



Abstract
Background
It is known that eyes-open (EO) and eyes-closed (EC) conditions invoke different organizations of brain functional networks, such as sensorimotor, attention, and salience networks in healthy participants. Functional connectivity (FC) extracted from resting-state functional magnetic resonance imaging data, under either EO or EC conditions, has been widely applied to explore the neural substrates of Alzheimer's disease (AD). However, the impact of eye conditions on FC within the AD continuum remains not fully understood.
Objective
This study aims to investigate the effects of eye conditions on FC across the AD continuum.
Methods
FC with the primary visual cortex (V1) seed was analyzed for both EO and EC conditions in 59 amyloid-β (Aβ)-positron emission tomography (PET)-negative cognitively normal (CN−), 14 Aβ-PET-positive CN+, 24 mild cognitive impairment (MCI+), and 15 AD individuals.
Results
EO and EC differently modulated FC between the V1 and cerebellum, especially the posterior vermis, in all groups. In CN−, CN+, and MCI+ groups, EO significantly facilitated FC between V1 and the cerebellum compared with the EC condition. However, the AD group showed the reverse pattern. Moreover, a sub-analysis demonstrated that the FC significantly correlated with a truncal balance measure under EO, but not EC, in participants with MCI+ and AD.
Conclusions
The results show that the FC between the V1 and cerebellum changed in AD. This finding may partially explain the impaired truncal balance and tendency to fall down in AD. This study suggests that analyzing FC under EO and EC conditions may provide a new functional biomarker for AD.
Keywords
Introduction
In recent years, intrinsic functional connectivity (FC) between and within brain regions, as measured by resting-state functional magnetic resonance imaging (rs-fMRI) data, has been extensively applied to study the neural correlates of Alzheimer's disease (AD), owing to its minimal burden on patients and the simple experimental setup it requires. In rs-fMRI experiments, participants are typically instructed to either keep their eyes open (EO)1–3 or closed (EC),4–7 and one of the consistent findings of these experiments is the decreased FC within the default mode network, correlating with the progression of AD pathologies and symptoms.1–7
Although both EO and EC conditions are commonly used in rs-fMRI studies, it has been reported that EO and EC evoke different organizations of brain functional networks in healthy individuals. The fractional amplitude of low-frequency fluctuation, which is a measure of variance in the fMRI blood-oxygen-level-dependent (BOLD) signal, has been consistently found to decrease under the EO rather than EC condition within visual, auditory and sensorimotor networks.8–11 The FC between the visual network and the attention, salience networks was stronger under the EO than EC condition.9,10 Conversely, the FC between the visual system and the motor or somatosensory systems was weaker under the EO condition compared to the EC condition. 9 Furthermore, these differences are consistent with those based on a primary visual cortex (V1)-seeded FC analysis.12,13 Moreover, the FC between V1 and the cerebellum, thalamus was consistently found to be stronger in the EO than EC condition in the V1-seeded FC analysis.12,13 Since these significant differences in the organization of functional networks elicited by EO and EC conditions have been mainly investigated in healthy populations, it remains unclear whether AD pathology influences such FC modulation elicited by the eye conditions.
It is well established that visual information is critical for efficient motor control, including postural balance14–18 and locomotion.19–23 In addition to cognitive decline, AD patients exhibit impaired motor functions, particularly in balance control and locomotion.24–28 Thus, analyzing FC between EO and EC conditions across the AD continuum may identify neural substrates underlying the impaired motor control functions associated with AD.
In this study, we aimed to investigate the effects of AD progression on FC between the V1 and other brain regions under the EO and EC conditions. We analyzed the rs-fMRI data during EO and EC conditions across individuals in the AD continuum (Aβ-PET-positive), including the preclinical (cognitively normal: CN+), prodromal (mild cognitive impairment: MCI+), and dementia (AD) stages. Additionally, Aβ-PET-negative CN (CN−) individuals were also included as a control group.
Methods
Participants
This research was carried out as part of the MULNIAD study (Multimodal NeuroImaging for Alzheimer's disease Diagnosis), which is a prospective longitudinal study targeting normal aging, MCI, and Alzheimer's disease, conducted at the National Center for Geriatrics and Gerontology (NCGG) in Obu, Japan.29–32 All participants were native Japanese individuals recruited from community-dwelling elderly or outpatients at the National Hospital for Geriatric Medicine, NCGG. The study was approved by the Ethics Committee of NCGG (No. 521-4), and all participants provided written informed consent. The study was conducted in accordance with the Declaration of Helsinki and “Ethical Guidelines for Medical and Health Research Involving Human Subjects” issued by the Ministry of Health, Labour and Welfare of Japan. Each participant's clinical status was categorized into CN, MCI, or dementia by following the inclusion criteria of the Alzheimer's Disease Neuroimaging Initiative 2 study (http://adni.loni.usc.edu) as described in previous works29,31,32 (see Supplemental Methods for detailed descriptions). Subsequently, based on visual interpretation of Aβ-PET imaging, they were further classified into Aβ-negative CN (CN−, n = 59), Aβ-positive CN (CN+, n = 14), MCI (MCI+, n = 24), and dementia (AD, n = 15). The demographics of the participants are given in Table 1.
Demographic, cognitive and PET measurements of participants.
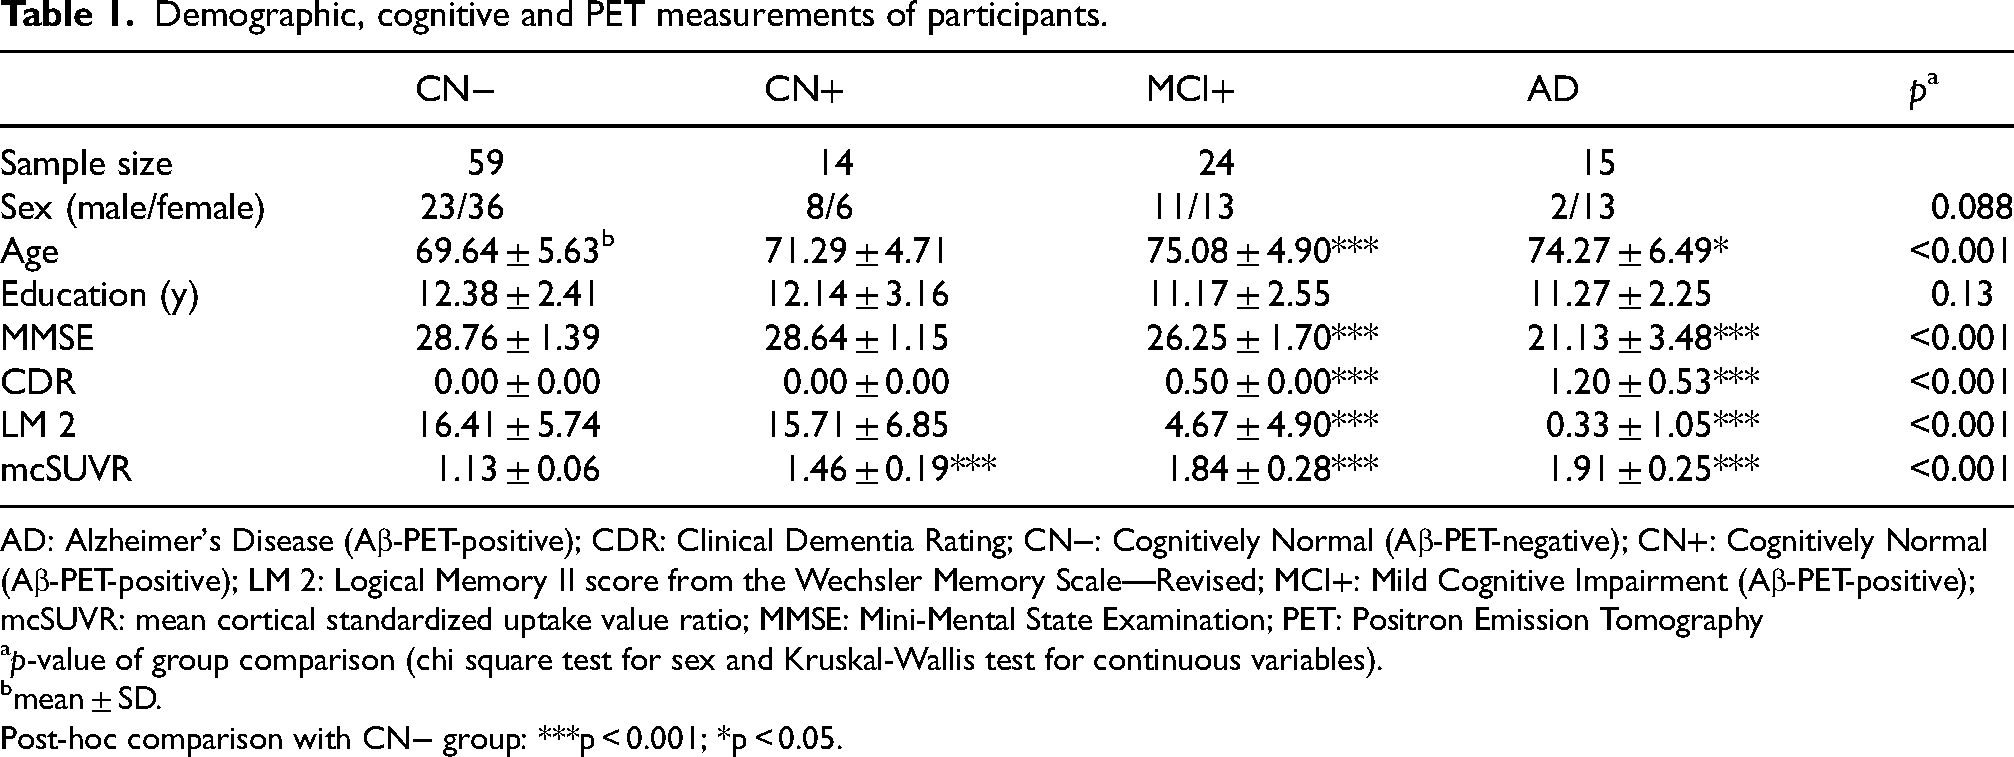
AD: Alzheimer's Disease (Aβ-PET-positive); CDR: Clinical Dementia Rating; CN−: Cognitively Normal (Aβ-PET-negative); CN+: Cognitively Normal (Aβ-PET-positive); LM 2: Logical Memory II score from the Wechsler Memory Scale—Revised; MCI+: Mild Cognitive Impairment (Aβ-PET-positive); mcSUVR: mean cortical standardized uptake value ratio; MMSE: Mini-Mental State Examination; PET: Positron Emission Tomography
p-value of group comparison (chi square test for sex and Kruskal-Wallis test for continuous variables).
mean ± SD.
Post-hoc comparison with CN− group: ***p < 0.001; *p < 0.05.
MRI/fMRI data acquisition
Images were acquired using a 3 T MRI scanner (MAGNETOM Trio, Siemens Medical Systems, Erlangen, Germany). High-resolution 3D T1-weighted anatomical images covering the whole brain were acquired (repetition time = 1900 ms, echo time = 2.51 ms, flip angle = 9 degrees, matrix = 256 × 256, slice thickness = 1.1 mm, voxel size = 0.977 × 0.977 × 1.1 mm3). Functional images were acquired with an echo planar imaging sequence (repetition time = 2000 ms, echo time = 30 ms, flip angle = 90 degrees, matrix = 64 × 64, slice thickness = 3.0 mm, gap = 0.75 mm, 33 axial slices, voxel size = 3.0 × 3.0 × 3.75 mm3) at rest conditions for a period of 5 min and 10 s. In EO condition scans, participants were instructed to gaze at a central fixation point displayed via a head-mounted display (VisuaStim Digital, Resonance Technology Inc., Northridge, CA, USA), to keep still, to stay awake, and not to think about anything specific. In EC condition scans, participants were instructed to keep their eyes closed, to keep still, to stay awake, and not to think about anything specific. After each scan, the arousal state was checked by experimenters through verbal communication via a microphone. If a participant reported feeling drowsy or sleepy, the data were excluded from analysis.
Aβ-PET acquisition, semi-quantitative analysis, and visual rating
Following our previous reports,29,31 all of the participants underwent 3D PET imaging for 50–70 min after intravenous injection of 555 ± 185 MBq 11C-Pittsburgh compound B (PiB) using a PET-Computed Tomography (CT) camera, Biograph True V (Siemens Healthcare). Low-dose X-ray CT was performed prior to PET imaging for attenuation correction. The reconstructed static PET images were spatially standardized to Montreal Neurological Institute (MNI) stereotactic space using Diffeomorphic Anatomical Registration Through Exponentiated Lie Algebra (DARTEL) with parameters derived from individual 3D-T1 MR images that were coregistered to PiB PET images. Spatially standardized PiB PET images were masked with individual's gray matter images segmented from the 3D-T1 MR images in order to exclude the white matter and extracerebral areas. Regions of interest (ROIs) values ([Bq/ml]) were obtained from the masked PiB images using the Automated Anatomical Labeling (AAL) Atlas). 33 All ROI values ([Bq/ml]) were converted to standardized uptake value ratio (SUVR) by dividing by the mean ROI value of the cerebellar cortices. The mean cortical SUVR (mcSUVR) value was obtained by averaging the SUVR values of the frontal, parietal, temporal and cingulate AAL ROIs, except for the primary motor and sensory areas. 34 Aβ-PET images were visually rated as positive or negative by two experienced nuclear medicine physicians (T.K. and K.I.) who were blind to the clinical data following our previously described protocol. 34 The obtained static images were displayed with a rainbow scale and an inverse gray scale. PiB images were rated as “positive” when the tracer binding in the cortical gray matter was deemed equal to or greater than that in the white matter, and as “negative” when the accumulation in the white matter was greater than that in the cerebral cortical gray matter. If the visual interpretations by the two raters did not match after the independent readings, the cases were discussed, and a consensus was reached. Our previous studies showed high consistency between two raters (more than 95%).29,31 There are no publicly available quantitative measures and cutoff values that can diagnose the presence of Aβ pathology in the brain. Moreover, the visual reading method used in this study has been shown to meet the neuropathological diagnostic criteria for AD. 35 Therefore, we adopted visual interpretation to stratify the participants.
Body balance control ability assessment
Body balance control ability was assessed by measuring postural sway during upright standing using a stabilometer (Gravicorder GP-5000, ANIMA Corporation, Japan) with a sampling rate of 20 Hz. In accordance with the Japanese equilibrium research guidelines, participants were instructed to maintain an upright posture with their feet together and arms by their sides of the body for 60 s in a moderately lit and quiet room. Measurements were performed in the eyes-open and eyes-closed conditions, in that order. We used the mean moving speed (cm/s) of time-course trajectories of the center of ground reaction force (center of pressure, COP) as the participants’ balance function marker. 28 A higher COP moving speed indicates greater body instability.
Data analysis
Image preprocessing and statistical analyses were conducted using SPM12 (http://www.fil.ion.ucl.ac.uk/spm/, Wellcome Department of Cognitive Neurology, University College London, London) and in-house Matlab (Mathworks, Natick, MA) scripts.
Preprocessing
The first five volumes of echo planar images (EPI) were discarded to accommodate T1 equilibration. The functional images were motion- and slice-time corrected. The mean and all EPI were then co-registered with the native anatomical T1 image. The T1 image was segmented to gray matter (GM), white matter (WM), and cerebrospinal fluid (CSF) images. Individual images, including EPI, T1, GM, WM, and CSF, were normalized into the MNI stereotactic space with a resolution of 2 × 2 × 2 mm3 using the transformation information derived from T1 image segmentation. To remove spurious artifacts, the temporal series of normalized BOLD data in each voxel was detrended, demeaned, and regressed by twelve regressors: 36 six motion parameters, average of whole brain signal, and five anatomical component-based noise correction (aCompCor) components 37 calculated from CSF and WM areas. Finally, a bandpass filter within 0.009–0.08 Hz was applied to the preprocessed data. 38 Furthermore, we checked head motion by the ratio of volumes with frame-wise displacement (FD) above 0.5 mm across eye conditions (EO and EC) and groups (CN−, CN+, MCI+ and AD) using a two-way analysis of covariance (ANCOVA). The mean volume ratio of FD above 0.5 mm for both eye conditions in all groups was less than 7%. No significant effect was found in the eye conditions (F(1,216) = 0.03, p = 0.85), the groups (F(3,216) = 1.38, p = 0.25), or the interaction between eye conditions and groups (F(3,216) = 0.36, p = 0.79).
Seed-to-voxel functional connectivity analysis
We set the seed region of V1 at the calcarine masks (calcarine fissure and surrounding cortex) from the AAL atlas. 33 For each eye condition in each participant, we extracted the preprocessed BOLD signal time courses across voxels within the V1 seed using MarsBaR 39 and then calculated voxel-wise connectivity as Pearson's correlation coefficients between the averaged time course within the V1 seed and the time courses of all voxels in the brain. We converted the correlation coefficients to normally distributed z scores using the Fisher transformation and then created a connectivity map. Finally, the connectivity maps were smoothed with an isotropic Gaussian kernel of 8 mm full-width at half-maximum for statistical analysis.
Statistical inference and visualization
We incorporated individual functional connectivity maps in four types of random effects analyses, that is, one-sample t-tests, paired t-tests, two-way analysis of covariance (ANCOVA) and one-way ANCOVA. In the one-sample t-tests, we examined the FC with V1 in EO and EC conditions across CN−, CN+, MCI+, and AD groups. In the paired t-tests, we compared the FC with V1 between EO and EC conditions across CN−, CN+, MCI+, and AD groups with the volume ratio of FD above 0.5 mm as a covariate of no interest. To identify the group effects on regions showing different FC with V1 between eye conditions, we applied a two-way ANCOVA with age, sex, education, and the volume ratio of FD above 0.5 mm as covariates of no interest. Our two-way ANCOVA was a mixed design with groups (CN−, CN+, MCI+ and AD) as a between-subject factor and eye conditions (EO and EC) as a within-subject factor (repeated measures). 40 To explore the effects of Aβ burden on the FC between eye conditions, we conducted two one-way ANCOVAs (EO and EC conditions, respectively) across groups with age, sex, education, the volume ratio of FD above 0.5 mm, and mcSUVR as covariates. In all types of analyses, we identified significant clusters with a threshold of p < 0.05 (family-wise error, FWE-corrected) at a cluster-forming threshold of p < 0.001 (uncorrected). We also checked clusters with a less stringent threshold (p < 0.005, uncorrected; cluster size > 100 voxels) in supplementary analyses. We identified brain regions using xjView toolbox (http://www.alivelearn.net/xjview). Post hoc two-sample t-tests were applied to compare the FC showing significant interactions in two-way ANCOVA analysis between groups and eye conditions. We visualized the statistical contrast images (Figures 1–3(a) and Supplemental Figure 1) using MRIcroGL (https://github.com/rordenlab/MRIcroGL, version 1.2), and the cerebellum regions showing significant interactions between eye conditions and groups for the FC to V1 (Figure 3(b)) were visualized using the SUIT toolbox for SPM (https://www.diedrichsenlab.org/imaging/suit_download.htm).41,42
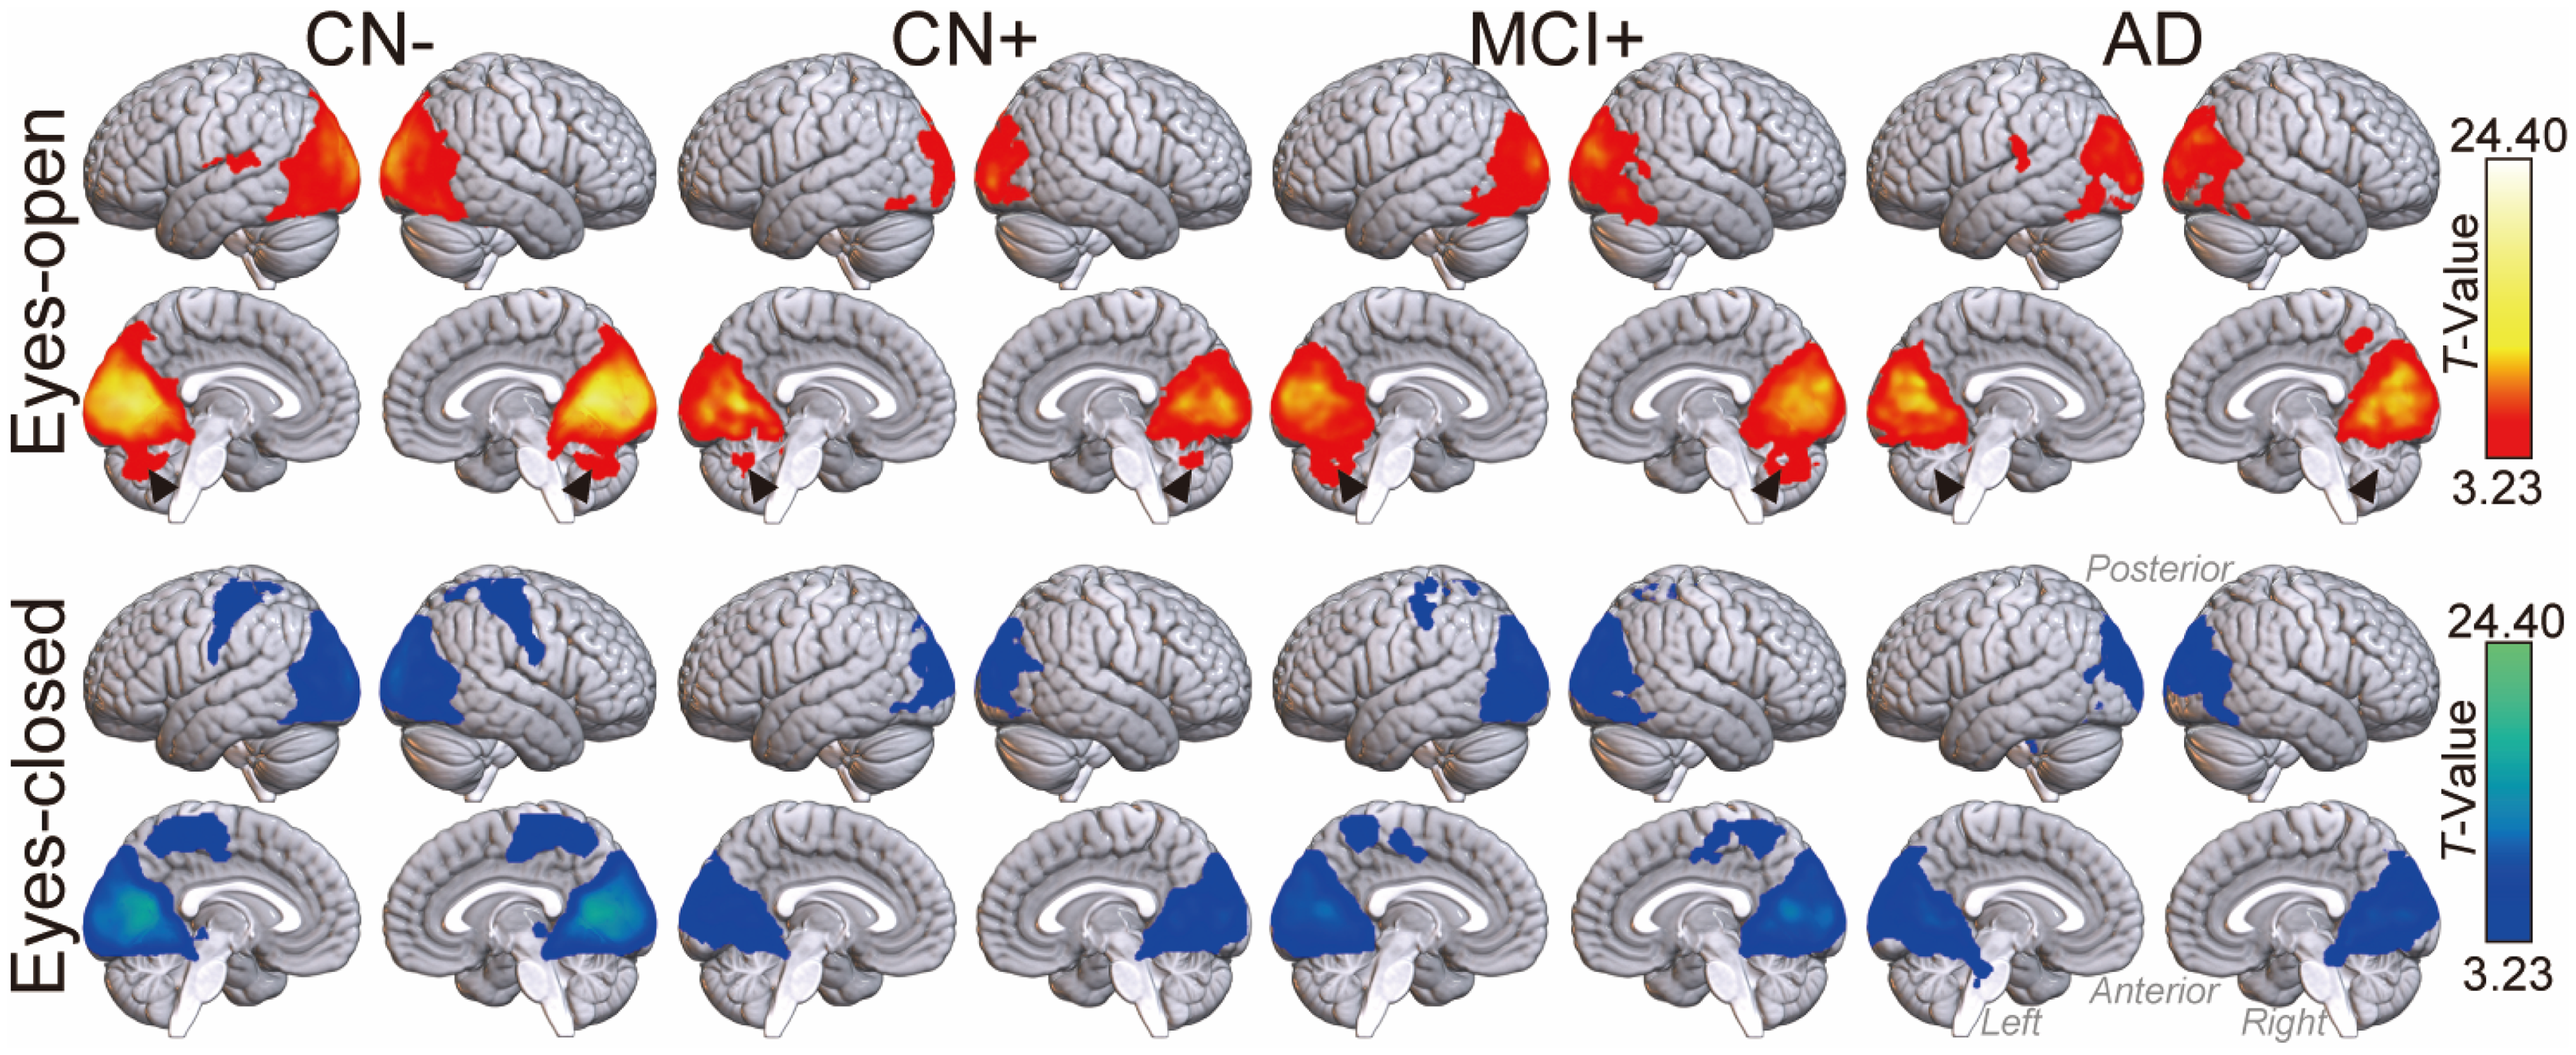
Brain regions with significant functional connectivity with V1 in eyes-open (red-yellow) and eyes-closed (blue-green) conditions across CN−, CN+, MCI+, and AD groups. Generally, brighter colors represent higher statistical values (T-values). The black arrow heads pointing to the posterior vermis areas in the cerebellum highlight the differences between AD group and other groups under the eyes-open condition. The statistically thresholded results are shown at p < 0.05, FWE-corrected, with a cluster-forming threshold of p < 0.001, uncorrected (see Supplemental Tables 1–4 for detailed statistical information and Supplemental Figure 1 for the lenient threshold used in the AD group). AD: Alzheimer's Disease (Aβ-PET-positive); CN−: Cognitively Normal (Aβ-PET-negative); CN+: Cognitively Normal (Aβ-PET-positive); MCI+: Mild Cognitive Impairment (Aβ-PET-positive) (Color figures available online).
Clusters a showing significant main effect of eye conditions and significant interactions between groups and eye conditions.
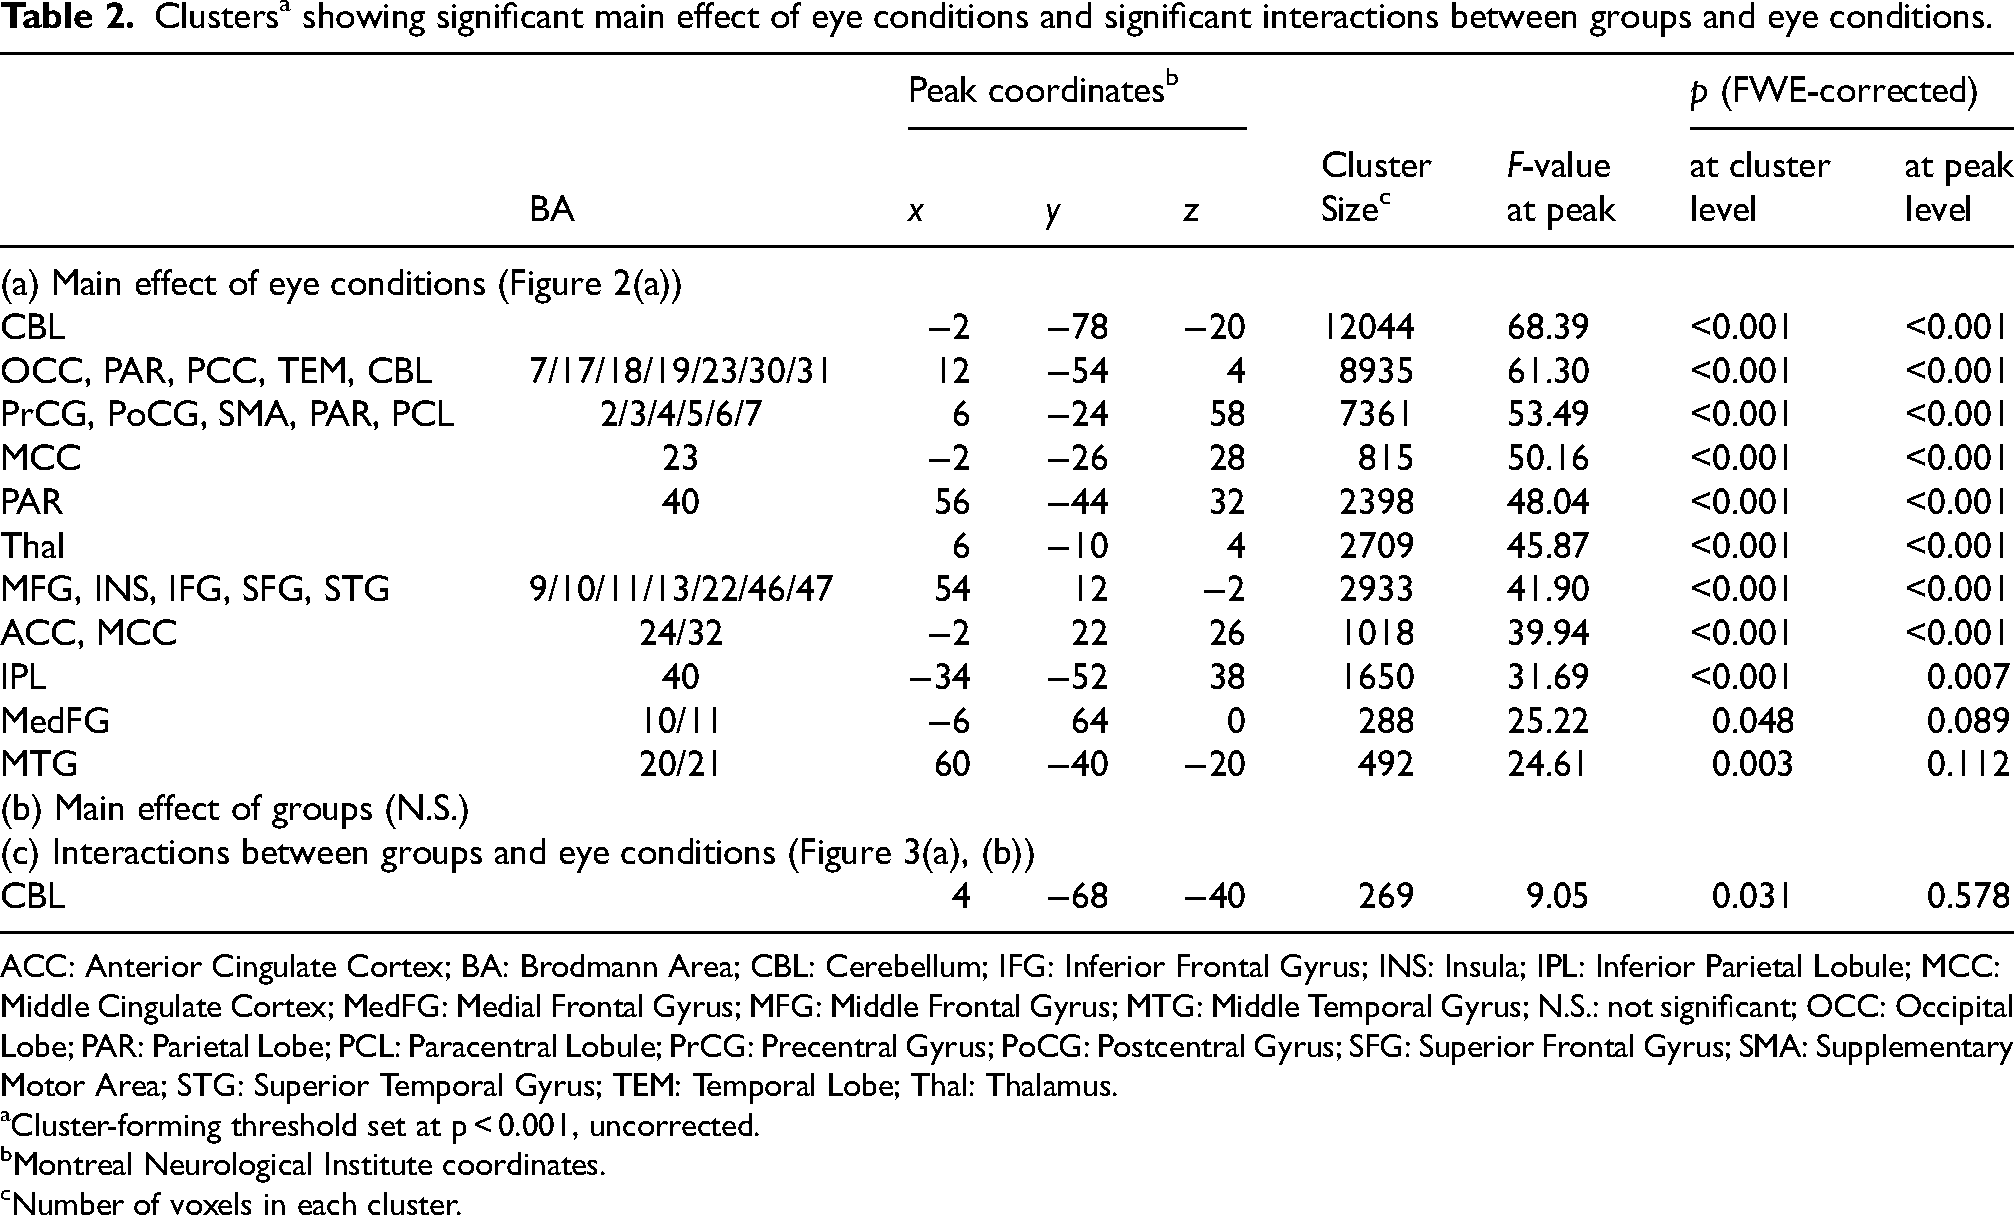
ACC: Anterior Cingulate Cortex; BA: Brodmann Area; CBL: Cerebellum; IFG: Inferior Frontal Gyrus; INS: Insula; IPL: Inferior Parietal Lobule; MCC: Middle Cingulate Cortex; MedFG: Medial Frontal Gyrus; MFG: Middle Frontal Gyrus; MTG: Middle Temporal Gyrus; N.S.: not significant; OCC: Occipital Lobe; PAR: Parietal Lobe; PCL: Paracentral Lobule; PrCG: Precentral Gyrus; PoCG: Postcentral Gyrus; SFG: Superior Frontal Gyrus; SMA: Supplementary Motor Area; STG: Superior Temporal Gyrus; TEM: Temporal Lobe; Thal: Thalamus.
Cluster-forming threshold set at p < 0.001, uncorrected.
Montreal Neurological Institute coordinates.
Number of voxels in each cluster.
Sub-analysis of the correlation between balance control ability and FC
To elucidate the potential relationship between FC with V1 and clinical symptoms, we conducted a sub-analysis to examine the correlation between body balance control ability and FC in 13 MCI+ and 11 AD individuals, whose balance control ability was assessed in our hospital's clinic within one year of the rs-fMRI measurements (Mean ± SD = 121.5 ± 126.7 days). We performed partial correlation analyses between FC and COP moving speed in both EO and EC conditions, controlling for age and sex. In addition, we analyzed the relationships among regional Aβ burden in the occipital lobe, balance control ability, and FC with V1. The occipital Aβ burden was estimated by combining SUVR values from the occipital ROIs, which included the right and left superior occipital gyrus, middle occipital gyrus, inferior occipital gyrus, cuneus, calcarine fissure and surrounding cortex, and lingual gyrus base on the AAL atlas ROIs, all of which are directly connected to V1.
Results
Significant FC maps from the V1 seed
Figure 1 illustrates the brain regions exhibiting significant FC with the V1 seed across CN−, CN+, MCI+ and AD groups under each eye condition (see Supplemental Tables 1–4 for detailed statistical information). Under the EO condition, all groups generally showed significant FC between V1 and the occipital, parietal, and posterior temporal cortices. Under the EC condition, significant FC regions tended to extend anteriorly, involving somatomotor and medial parietal cortices, especially within the CN− and MCI+ groups. Notably, the CN−, CN+, and MCI+ groups exhibited significant FC between the V1 and cerebellum (especially the posterior vermis regions) under the EO condition, whereas the AD group did not. At a less stringent statistical threshold, we found extensive FC between V1 and the posterior vermis under the EC condition but not under the EO condition in the AD group (Supplemental Figure 1).
Effects of eye condition and clinical category
The results demonstrate that a variety of brain regions exhibited significant main effects of eye condition (Figure 2(a), Table 2a). However, no brain regions showed significant main effects of clinical category (Figure 2(b)). Additionally, we performed post-hoc two-group (CN− versus CN+; CN− versus MCI+; CN− versus AD) two-way ANCOVA analyses (similar to the four-group main analysis) to examine the effects of groups on FC under EO and EC conditions. We did not find any regions showing significant group effects in these analyses. Post-hoc group-wise paired t-tests revealed that the effects of eye condition largely varied among groups (Figure 2(c)) (see Supplemental Tables 1–4 for detailed statistical information). The CN− group exhibited robust differences in FC patterns between EO and EC conditions, involving cerebellum, somatomotor, basal ganglia and some other brain regions (Supplemental Table 1). Within the AD continuum, similar but smaller FC pattern differences were seen in the CN+ and MCI+ groups, although these differences were less pronounced in the AD group. In all groups except for AD, the EO condition demonstrated significantly greater FC between V1 and the posterior cerebellum compared to the EC condition.

Different functional connectivity with V1 between eye conditions and across clinical categories. Generally, brighter colors represent higher statistical values (F- or T-values). (a) Brain regions (red-yellow) showing significant main effect of eye conditions in two-way ANCOVA analysis. (b) No brain region showed significant main effects of clinical category in two-way ANCOVA analysis. (c) Brain regions showing significantly different functional connectivity with V1 between eyes-open and eyes-closed conditions across CN−, CN+, MCI+, and AD groups. Regions in red-yellow show higher connectivity with V1 in eyes-open > eyes-closed contrast. Regions in blue-green show higher connectivity with V1 in eyes-closed > eyes-open contrast. Basically, a brighter color represents higher statistical value (T-value). No brain region shows significantly stronger functional connectivity in the eyes-open than eyes-closed condition in AD group (see Supplemental Tables 1–4 for detailed statistical information). The statistically thresholded results are shown at p < 0.05, FWE-corrected, with a cluster-forming threshold of p < 0.001, uncorrected. AD: Alzheimer's Disease (Aβ-PET-positive); CN−: Cognitively Normal (Aβ-PET-negative); CN+: Cognitively Normal (Aβ-PET-positive); MCI+: Mild Cognitive Impairment (Aβ-PET-positive) (Color figures available online).
Interaction between eye conditions and clinical categories
The two-way ANCOVA revealed a significant interaction of eye conditions with clinical categories in FC between V1 and the cerebellum (Figure 3(a) and Table 2(c)). The cerebellar regions involved are mainly localized in the posterior parts, including areas 7 and 8 in the left hemisphere and the vermis (Figure 3(b)). Figure 3(c) displays post-hoc group-wise comparisons of FC between V1 and the posterior cerebellum regions. The results clearly demonstrate different patterns in FC modulation by eye condition across the clinical groups. In the CN−, CN+, and MCI+ groups, FC between V1 and the cerebellum was higher in the EO condition compared to the EC condition, whereas the AD group exhibited the reverse pattern.

Interaction between eye conditions and clinical categories for the functional connectivity with V1. Posterior cerebellum, especially the vermis areas, showing significant interactions, plotted on rendered brain (a) and a flattened cerebellar map (b) (statistically thresholded at p < 0.05, FWE-corrected, with a cluster-forming threshold of p < 0.001, uncorrected) (see Table 2 for detailed statistical information). (c) Functional connectivity between V1 and the posterior cerebellum region shown in (a, b) across groups and eye conditions. Bars with errors show mean ± standard deviation. Light thin gray lines show individual data. Asterisks above vertical lines show significantly different functional connectivity within eye conditions between groups, as well as within groups between eye conditions (*p < 0.05, **p < 0.01, and ***p < 0.001, post hoc two-tailed t-tests, controlled by age, sex, education and ratio of volumes with frame-wise displacement above 0.5 mm, corrected for multiple comparisons using Tukey-Kramer's method). AD: Alzheimer's Disease (Aβ-PET-positive); CN−: Cognitively Normal (Aβ-PET-negative); CN+: Cognitively Normal (Aβ-PET-positive); MCI+: Mild Cognitive Impairment (Aβ-PET-positive) (Color figures available online).
Relationship among V1-cerebellum FC, balance control ability, and regional Aβ burden
Figure 4 shows the results of the sub-analysis in 13 MCI+ and 11 AD individuals, whose balance control abilities were measured. There was a significant partial correlation (rp, controlling for age and sex) between FC and COP moving speed in the EO condition (rp = −0.45, p = 0.036, Figure 4(a), left) but not in the EC condition (rp = −0.077, p = 0.73, Figure 4(a), right). Interestingly, balance control ability was significantly correlated with regional Aβ burden in the occipital ROI under both eye conditions (Figure 4(b), left and right). To further elucidate whether this relationship was specific to the occipital region or common findings in other brain regions, we performed additional ROI analyses. Specifically, we examined 20 ROIs (10 from each hemisphere) that were used when calculating mcSUVR values (Supplemental Figure 2). It is notable that SUVR values in the occipital ROI, despite not being included in the typical AD signature regions for Aβ deposition, showed the strongest link with balance control ability compared to any other brain regions. The correlation between the occipital ROI and the V1-cerebellum FC was stronger in the EO condition than the EC condition, although it did not reach significant (Figure 4(c), left and right). However, among all brain regions, the occipital ROIs showed the stronger partial correlation value, and only the left occipital ROI showed a significant correlation (Supplemental Figure 3a; rp = −0.43, p = 0.043, uncorrected).
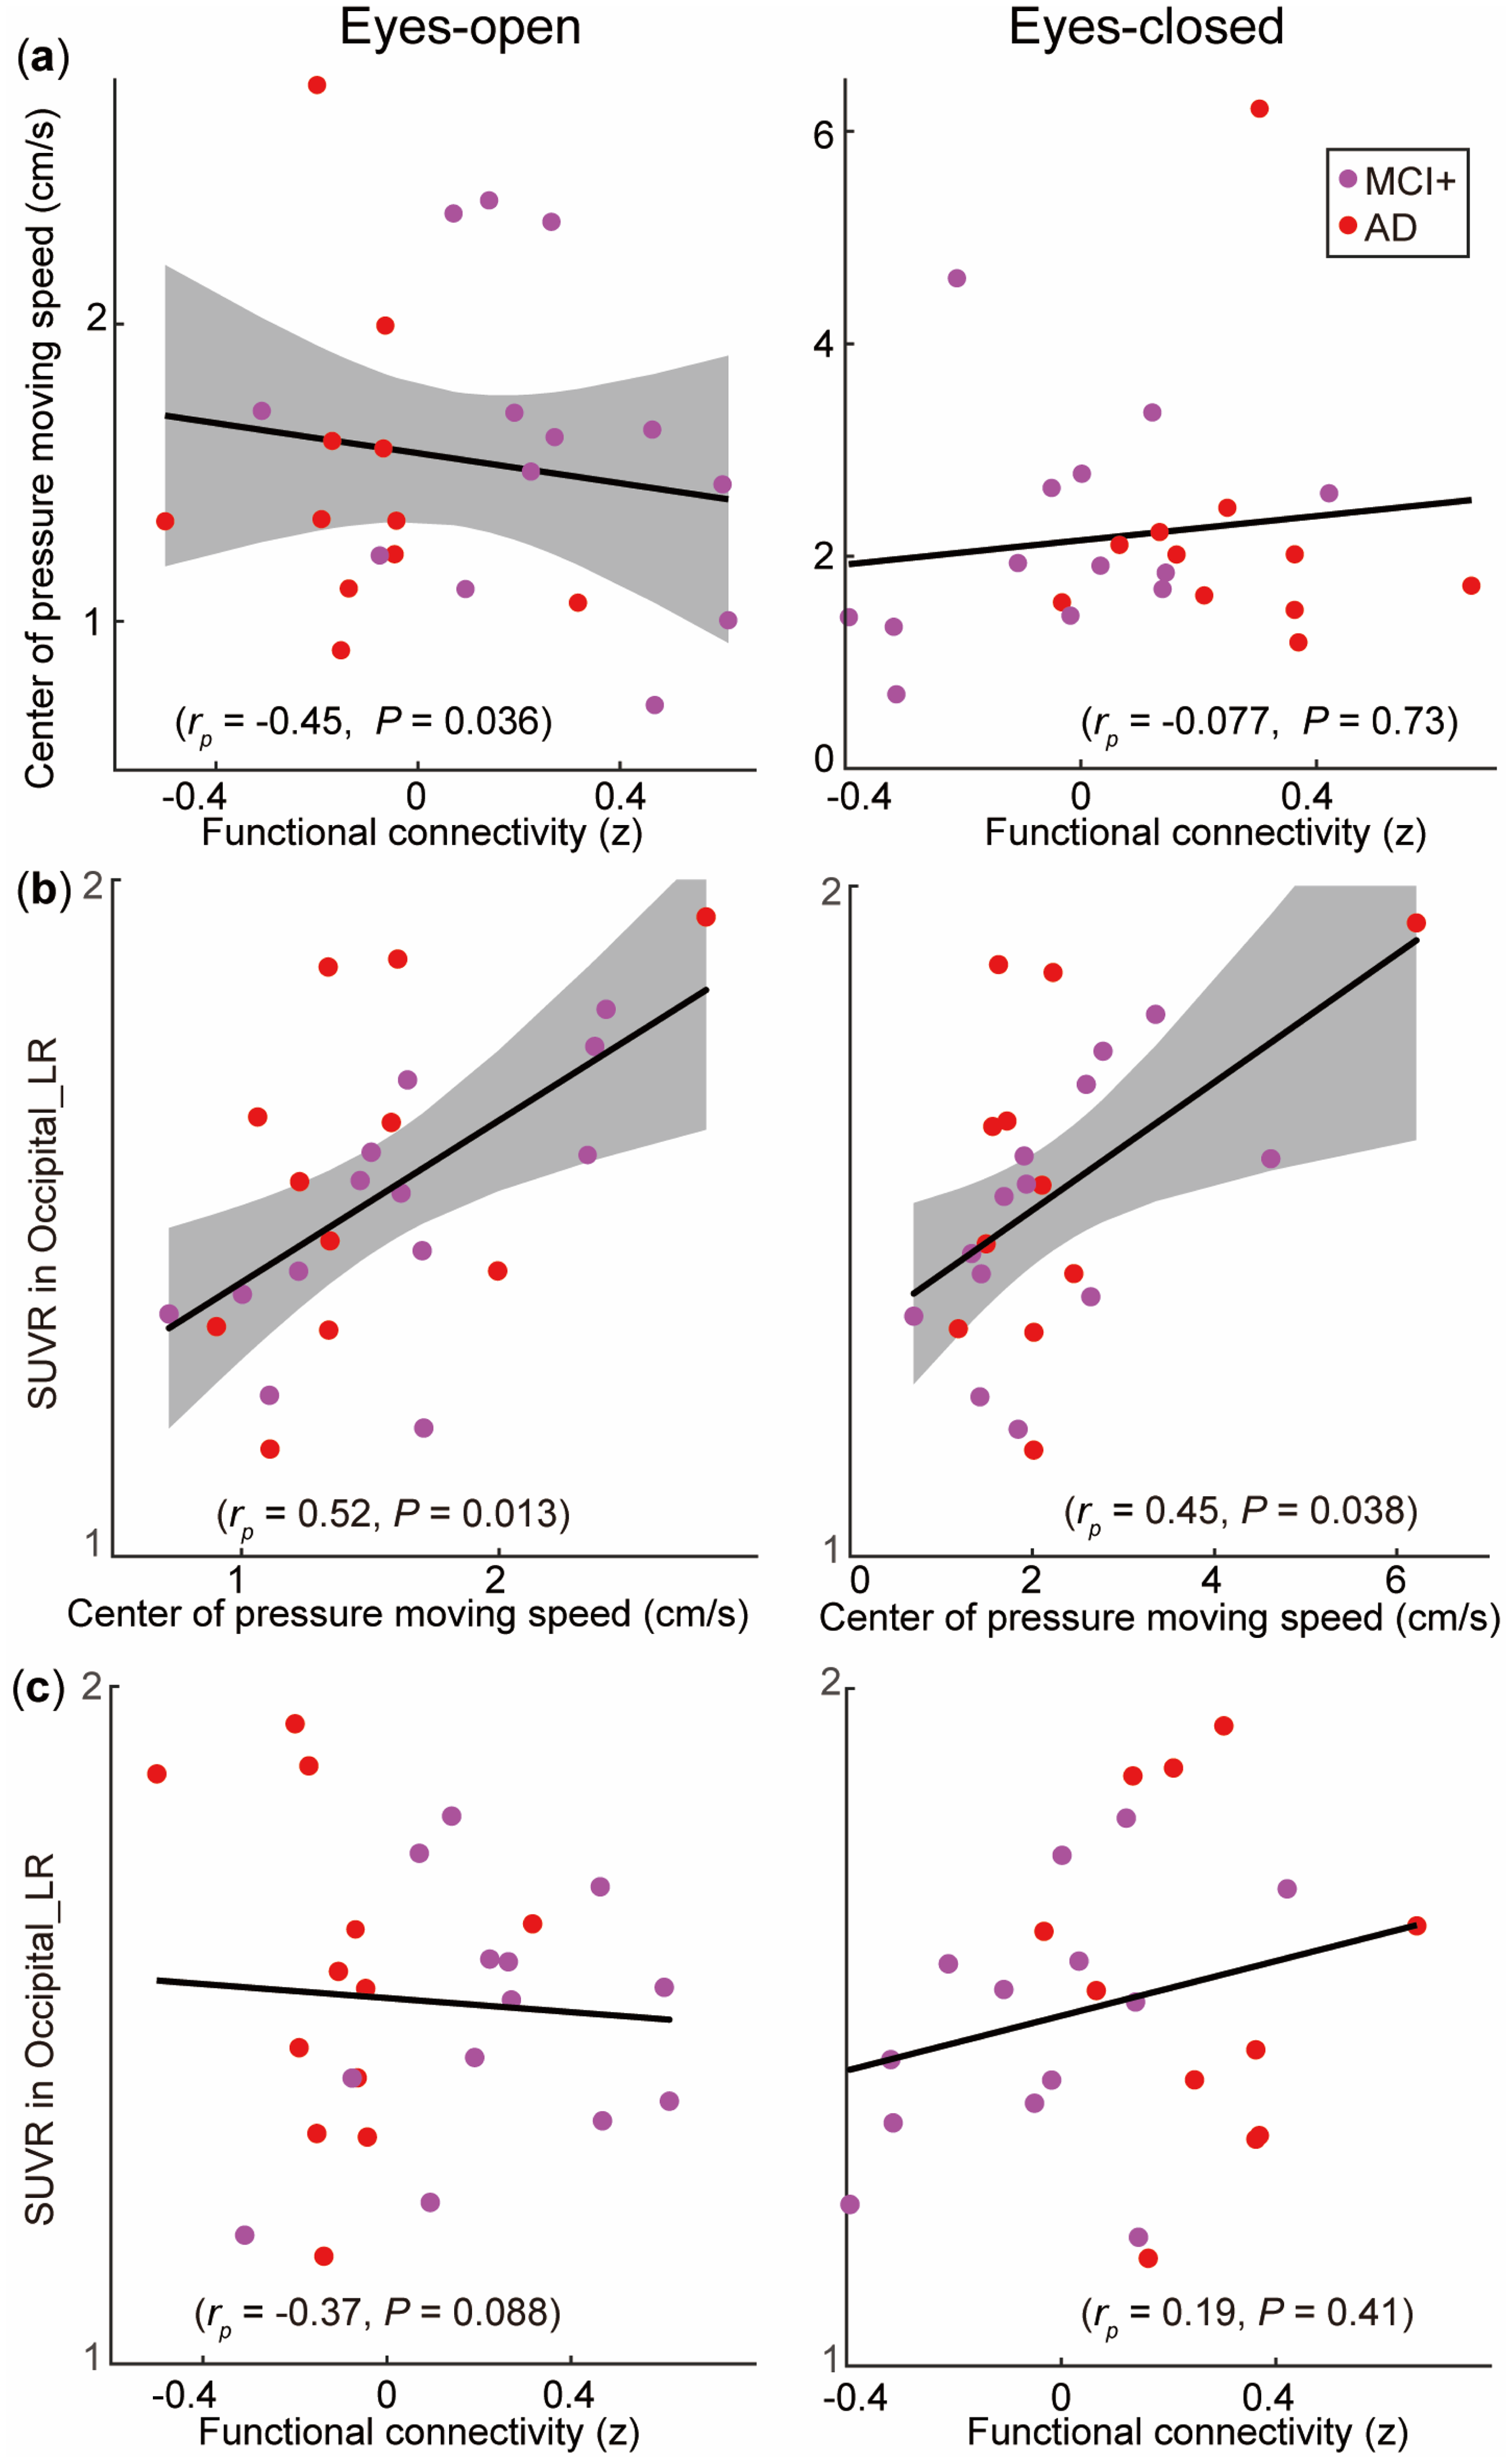
Relationship among V1-cerebellum FC, body balance, and regional Aβ burden in thirteen MCI+ and eleven AD individuals in EO (left) and EC conditions (right). (a) Scatter plots between V1-cerebellum FC and center of pressure (COP) moving speed. Partial correlations (rp) between the two variables were calculated, controlling for age and sex. (b) Relationship between COP moving speed and regional Aβ burden in the occipital cortices, as estimated by averaged SUVR values of AAL ROIs, including the right and left superior occipital gyrus, middle occipital gyrus, inferior occipital gyrus, cuneus, calcarine fissure and surrounding cortex, and lingual gyrus (SUVR in Occipital_LR). (c) Relationship between V1-cerebellum FC and regional Aβ burden in the occipital cortices. Gray shaded regions represent 95% confidence intervals (for cases of p ≤ 0.05) around the black regression lines. AD: Alzheimer's Disease (Aβ-PET-positive); MCI+: Mild Cognitive Impairment (Aβ-PET-positive); SUVR: standardized uptake value ratio of PiB-PET (Color figures available online).
Discussion
This study demonstrates that FC between V1 and cerebellum is modulated by the EO and EC conditions, and the pattern of this modulation is influenced by clinical progression in the AD continuum. Previous studies have demonstrated that FC modulations are elicited by eye conditions in healthy individuals,9,10,12,13 but to the best of our knowledge, this is the first report to investigate FC modulation by eye conditions in individuals within the AD continuum.
FC modulation by eye conditions
Our results demonstrate that the EO and EC conditions elicited different patterns in V1-seeded FC maps in the control (CN−) group. The EO condition, compared to the EC condition, triggered significantly stronger FC between V1 and the cerebellum, insular, cingulate cortex, inferior parietal cortex, middle frontal cortex, and subcortical regions, such as the thalamus, basal ganglia and pons, while the EC condition elicited significantly stronger FC between V1 and the sensorimotor cortex, occipital cortex, posterior cingulate cortex, and middle temporal cortex. Our findings are consistent with previous studies that analyzed V1-seeded FC, although these studies compared the FC between two healthy groups: one group in the EC condition and the other in the EO condition.12,13
Our results show that the pattern of FC modulation elicited by eye condition was altered in the AD continuum. In the CN+ and MCI+ groups, similar but less prominent FC modulation patterns compared with the control group were observed; however, in the AD group, the modulation pattern was markedly different (Figure 2(c)). We found a significant interaction between eye condition and clinical category in the V1-cerebellum FC (Figure 3). In particular, the AD group showed the reverse pattern in the FC modulation compared with other groups. The V1-cerebellum FC was activated under the EO condition in the CN−, CN+, and MCI+ groups, whereas this FC was predominantly activated under the EC condition in the AD group. The V1-cerebellum FC facilitation elicited by the EO condition in healthy populations was shown in previous reports,12,13 but its physiological implications have not yet been discussed in detail. It is well-established that opening our eyes and gathering the visual information guide efficient motor control, especially for posture balance14–18 and locomotion.19–23 The vermis in the cerebellum controls posture and locomotion, 43 which has been consistently confirmed in both animal44–46 and human studies.47–52 The vermis receives visual and other sensory and somatosensory inputs from the head and proximal parts of the body. It projects to the cortical and brainstem regions via the fastigial nucleus, which gives rise to the medial descending systems that control the proximal muscles of the body. 43 Considering that the cerebellum43,50,53–55 and subcortical regions56,57 are deeply involved in balance control and locomotion, we suggest that the EO condition could possibly trigger the FC between V1 and these areas for efficient balance control and locomotion.
Possible clinical impact of V1-cerebellum's FC modulation in AD
The most striking finding of this study was that the AD group exhibited a reversed V1-cerebellum FC pattern between eye conditions as compared with the other groups. It is known that AD patients show degenerated motor functions, especially locomotion and balance, which are usually characterized by a shorter step length, lower gait speed, lower stepping frequency, and greater step-to-step variability.24–28 Considering V1 and the cerebellum are deeply involved in balance control and locomotion, we postulate that the altered FC between them might be related to the dysfunctions of balance control and locomotion in AD. Furthermore, post-mortem human brains of AD also found the loss of Purkinje cells. 58 Aside from the vermis, the intermediate regions adjacent to the vermis (cerebellum 7/8) also showed altered FC with V1 in AD compared with the CN−, CN+ and MCI+ groups in this study. These vermis-adjacent regions receive somatosensory input from the limbs and control the more distal muscles of the limbs and digits. 43 Taken together, we suggest the altered FC between V1 and the cerebellum could possibly be related to declined motor functions, especially balance control and locomotor functions, in AD. To test this conjecture, we conducted a sub-analysis to examine the relationship among balance control ability, V1-cerebellum FC, and regional Aβ burden. Although the results are preliminary due to the small sample size, these data potentially support our hypothesis that the altered FC between V1 and the cerebellum may contribute to the declined balance control in patients with AD. The results suggest that regional Aβ burden in the occipital area may be a contributing factor to impaired balance control in AD, and that this symptom may be monitored by V1-cerebellum FC. These findings warrant further exploration.
Limitations
There are several limitations to this study. First, the sample size is relatively small. Further studies using larger sample sizes, ideally incorporating longitudinal data, are needed. In addition, the sample sizes are not matched across groups, which may have affected the differences in FC patterns between EO and EC conditions for each clinical group under the same statistical threshold. To address this possibility, we conducted an additional analysis by dividing the CN− group into four sub-groups (15, 15, 15 and 14 participants, randomly assigned with no overlap), and dividing the MCI+ group into two sub-groups (12 and 12 participants, randomly assigned with no overlap), to minimize the effect of unbalanced sample size across groups. The results of the randomly selected sub-sample analysis in CN− and MCI+ (Supplemental Figure 4) are basically consistent with the original results (Figure 2(c)). Second, only the biomarker information for Aβ pathology was implemented in this study, and thus relationships with other biomarkers, such as Tau and neurodegeneration, were not revealed. Lastly, given that this study focused on V1-seeded FC, the results might be biased because FC across the brain regions outside V1 was not analyzed. To check FC outside V1, we additionally conducted a whole-brain FC analysis in MCI+ and AD individuals, who showed the largest group differences in the V1-seeded analysis (see Supplemental Methods for details). The results of a non-parametric, network-based whole-brain two-way ANCOVA show a significant main effect of eye conditions in FC with the occipital cortex, especially from the cerebellum regions (Supplemental Figure 5). The results also demonstrated a significant interaction of groups and eye conditions in FC between the visual cortex and the cerebellum vermis regions (Supplemental Figure 6). Therefore, we consider that it was less probable that our V1-seeded analysis overlooked important FC that occurred outside V1.
Conclusions
This study demonstrated that the FC between V1 and the cerebellum is modulated by the EO and EC conditions, and the pattern of modulation is significantly altered in the dementia stage of the AD group compared with the other clinical stages. This alteration of FC might be related to the dysfunctions of balance control in patients with AD, and thus it might provide a biomarker to estimate fall risk in AD patients.
Supplemental Material
sj-docx-1-alz-10.1177_13872877241303849 - Supplemental material for Altered functional connectivity between primary visual cortex and cerebellum in Alzheimer's disease
Supplemental material, sj-docx-1-alz-10.1177_13872877241303849 for Altered functional connectivity between primary visual cortex and cerebellum in Alzheimer's disease by Chang Cai, Takashi Kato, Yutaka Arahata, Akinori Takeda, Takashi Nihashi, Keita Sakurai, Emi Tanaka, Kersten Diers, Kosuke Fujita, Taiki Sugimoto, Takashi Sakurai, Kengo Ito and Akinori Nakamura in Journal of Alzheimer's Disease
Footnotes
Acknowledgments
We sincerely thank all of the clinical doctors, researchers, and staff at NCGG who supported the MULNIAD (Multimodal Neuroimaging for Alzheimer's disease Diagnosis) study group.

Author contributions
Chang Cai (Formal analysis; Methodology; Software; Visualization; Writing—original draft; Writing—review & editing); Takashi Kato (Conceptualization; Data curation; Formal analysis; Funding acquisition; Investigation; Methodology; Project administration; Resources; Writing—review & editing); Yutaka Arahata (Data curation; Investigation; Project administration; Resources); Akinori Takeda (Data curation; Investigation; Resources); Takashi Nihashi (Data curation; Investigation); Keita Sakurai (Data curation; Investigation); Emi Tanaka (Data curation; Investigation); Kersten Diers (Formal analysis; Resources; Software; Writing—review & editing); Kosuke Fujita (Data curation; Investigation; Resources; Writing—review & editing); Taiki Sugimoto (Data curation; Resources); Takashi Sakurai (Data curation; Funding acquisition; Investigation; Resources); Kengo Ito (Conceptualization; Data curation; Formal analysis; Supervision); Akinori Nakamura (Conceptualization; Data curation; Funding acquisition; Investigation; Methodology; Project administration; Supervision; Writing—review & editing).
Funding
The author(s) disclosed receipt of the following financial support for the research, authorship, and/or publication of this article: The study was supported by the Research Funding for Longevity Sciences (21–11, 22–17, 22–23, 23–36, 25–24 and 26–30) from the National Center for Geriatrics and Gerontology, the Japan Society for the Promotion of Science (JSPS) KAKENHI (JP24590908 and JP23KJ2224), AMED Grant (JP23ae0101077), and the Japan Foundation for Aging and Health. The funding sources had no role in the study design, data collection, data analyses, or data interpretation.
Declaration of conflicting interests
The author(s) declared the following potential conflicts of interest with respect to the research, authorship, and/or publication of this article: Takashi Kato has received lecture fees from Nihon Medi-Physics, PDRadiopharma and Eisai. Akinori Takeda has received lecture fees from Nihon Medi-Physics, PDRadiopharma, Otsuka pharmaceutical, Kowa and Eisai. Keita Sakurai has received lecture fees from Nihon Medi-Physics, PDRadiopharma, GE Healthcare Pharma, Takeda Pharmaceuticals, Kyowa Kirin, Merck & Co and Eisai. Keita Sakurai is an Editorial Board Member of this journal but was not involved in the peer-review process of this article nor had access to any information regarding its peer-review. Kengo Ito has received lecture fees from Nihon Medi-Physics, Eisai and Eli Lilly Japan. Akinori Nakamura has received speaker fee from Eisai, Towa, PDRadiopharma and Nihon Medi-Physics. The remaining authors declared no potential conflicts of interest with respect to the research, authorship, and/or publication of this article.
Data availability
The data supporting the findings of this study are available on request from the corresponding author. The data are not publicly available due to privacy or ethical restrictions.
Supplemental material
Supplemental material for this article is available online.
References
Supplementary Material
Please find the following supplemental material available below.
For Open Access articles published under a Creative Commons License, all supplemental material carries the same license as the article it is associated with.
For non-Open Access articles published, all supplemental material carries a non-exclusive license, and permission requests for re-use of supplemental material or any part of supplemental material shall be sent directly to the copyright owner as specified in the copyright notice associated with the article.
