
Abstract
Background
Numerous blood biomarkers have emerged as promising biomarkers for Alzheimer's disease (AD) and cognitive decline, but limited knowledge exists concerning the difference of blood biomarkers between early-onset and late-onset cases.
Objective
Investigate blood biomarkers associated with amyloid and tau pathologies, brain degeneration, inflammation, and oxidative stress in individuals afflicted with both early-onset and late-onset AD, as well as in age-matched healthy controls.
Methods
A total of 125 participants were enrolled. We assessed levels of 18 distinct blood biomarkers and their associations with cerebrospinal fluid biomarkers, neuropsychological test scores, APOE ε4 carrier status, and neuroimaging markers. The diagnostic potential of blood biomarkers was investigated.
Results
In early-onset AD patients, levels of blood Interleukin (IL)-4, IL-6, and Tumor necrosis factor-alpha (TNF-α) were notably lower comparing to late-onset patients. AD patients exhibited higher blood levels of phosphorylated-tau181 (p-tau181), neurofilament light chain (NfL), and glial fibrillary acidic protein (GFAP), as well as lower levels of amyloid-β (Aβ)42 and IL-12p70. Oxidative stress markers, including malondialdehyde, total antioxidant capacity, and superoxide dismutase, exhibited a progressive trend across the continuum of AD. Inflammatory markers demonstrating correlations with neuroimaging markers. Blood levels of Aβ42, p-tau181, NfL, and GFAP associated with neuropsychological scores and effectively discriminated AD, with GFAP exhibiting particular relevance in early-onset cases.
Conclusions
Inflammatory markers exhibited differences between patients with early- and late-onset AD, associated with alterations in brain structure and function. With the progression of disease continuum, a decrement in antioxidant capacity was observed. Blood Aβ42, p-tau181, NfL, and GFAP showed promise in detecting cognitive decline and AD.
Introduction
Alzheimer's disease (AD) stands as a multifaceted and progressive neurodegenerative disease, ranking presently as the seventh-leading cause of mortality. 1 With an aging older population and the escalating incidence of AD, considerable attention has centered on late-onset AD (LOAD), the predominant form that manifests after the age of 65. However, tracing back to the first documented AD case in 1906, the disease's origins can be traced to early-onset AD (EOAD) cases occurring in individuals below the age of 65, consequently leading to the naming of the disease bearing the name of the physician. 2 Regrettably, EOAD cases, despite often exhibiting a more aggressive disease trajectory, tend to be underrecognized owing to their atypical phenotypes. 3 This stems from a general lack of awareness that AD is not solely confined to the older population but also affects younger and middle-aged individuals. By gaining insights into the unique attributes of EOAD, researchers can pave the path toward more efficacious diagnostic modalities and treatment strategies, thereby augmenting patient outcomes.
At present, the diagnosis of AD still relies on clinical criteria. Although positron emission tomography (PET) scans and cerebrospinal fluid (CSF) analysis offer valuable insights, their utility is constrained by high expenses and invasiveness. In line with the latest revised criteria from the Alzheimer's Association workgroup, 4 accurate blood biomarkers have emerged as potential tools for AD research and clinical implementation, primarily owing to their accessibility and commendable performance.
In recent years, researchers have probed various blood biomarkers as diagnostic tools for AD pathology and cognitive decline. Among these, phosphorylated-tau181 (p-tau181) and amyloid-β42 (Aβ42), regarded as pathological markers, have garnered significant attention. 5 Neurofilament light chain (NfL),6,7 an indicator of neuronal injury, has been employed to gauge the extent of axonal damage, while glial fibrillary acidic protein (GFAP), 8 denoting astrocyte activation and response, has been utilized to assess astrocyte behavior. The synaptic marker neuregulin1-beta1 (NRG1-β1) has been employed to reflect synaptic function. 9 Moreover, mounting evidence suggests that immunological mechanisms and oxidative stress status contribute to brain aging and AD progression. Therefore, we measured panels of inflammatory and oxidative stress markers.10,11
To date, limited knowledge exists concerning these blood biomarkers in the context of EOAD when compared to LOAD or age-matched healthy controls (HC). This study represents a crucial initial stride towards investigating biomarkers and potential pathogenic mechanisms in EOAD. We conducted a comprehensive evaluation of these biomarkers within patients with AD, amnestic mild cognitive impairment (aMCI), and HC, scrutinized their correlations with clinical variables, including demographics, neuroimaging markers, and neuropsychological scores, and conducted an in-depth analysis of the diagnostic accuracy of blood biomarkers to shed light on their role in AD.
Methods
Participants
A total of 125 participants were enrolled in this study between 2022 and 2023, comprising 32 EOAD patients, 22 LOAD patients, 30 aMCI patients, 17 young controls (YC) under the age of 65, and 24 old controls (OC) aged 65 and older. The diagnosis of AD and aMCI were established by a consensus reached by a multidisciplinary team, in accordance with the guidelines of the NIA-AA working group.12,13 The diagnoses of AD were confirmed through positive amyloid PET imaging and/or low CSF Aβ42, ensuring that all AD patients were verified as amyloid positive. AD and aMCI patients were recruited through Xuanwu Hospital, while HC were community-dwelling individuals recruited from nearby communities named Baizhifang District. HC demonstrated cognitive and neurological health, scored between 27 and 30 on the Mini-Mental State Examination (MMSE), and did not exhibit cognitive symptoms as evaluated by a physician.
This study adhered to the Declaration of Helsinki and was approved by the Ethics Committee of Xuanwu Hospital, Capital Medical University. Written informed consent was obtained from all participants.
Measurements of fluid biomarkers
Blood samples were collected in EDTA-containing tubes, while CSF was obtained using a standardized lumbar puncture procedure. CSF was collected using a drip method, with CSF directly dripping from the puncture needle into low-adsorption polypropylene (PP) collection tubes to minimize protein loss. After collection, fluid samples were centrifuged at 3000 rpm for 15 min at 4°C, and resulting aliquots were immediately frozen at −80°C until further analysis. Technicians responsible for the analysis did not have access to clinical data.
Plasma levels of p-tau181 were measured using an ultrasensitive Quanterix HD-X analyzer and p-tau181 V2.1 kit, employing an automated single molecule array (Simoa). Serum Aβ42 levels were assayed using an enzyme-linked immunosorbent assay (ELISA) kit from ANQUN. Serum NfL levels were assessed using ELISA kit from Elabscience (E-EL-H0741c). Serum GFAP levels were determined using an ELISA kit from Proteintech (KE00210). Serum NRG1-β1 levels were measured using an ELISA kit from DuoSet (DY377-05). The concentrations of Aβ42, NfL, GFAP, and NRG1-β1 were found to be within ±15% relative to the corresponding quality control products. Plasma inflammatory markers, including Interferon-gamma (IFN-y), Interleukin-1 beta (IL-1β), Interleukin-2 (IL-2), Interleukin-4 (IL-4), Interleukin-6 (IL-6), Interleukin-10 (IL-10), Interleukin-12p70 (IL-12p70), Interleukin-17A (IL-17A), and Tumor necrosis factor-alpha (TNF-α), were assessed using a Proinflammatory Panel 1 (human) Kit with the S-PLEX ultrasensitive assay platform from Meso Scale Discovery. Plasma oxidative stress markers, including total antioxidant capacity (tAOC), superoxide dismutase (SOD), and malondialdehyde (MDA), were measured using commercial assay kits from Nanjing Jiancheng Biotechnology Institute (tAOC: A015-3-1, SOD: A001-3, MDA: A001-3) following the manufacturer's instructions. Plasma glutathione peroxidase (GSH-Px) levels were determined using an Kit from Elabscience (E-BC-K096-M) according to the manufacturer's protocol. In AD participants, CSF biomarkers, including Aβ42, Aβ40, p-tau, and total-tau protein (t-tau), were measured using ELISA kits from Fujirebio (81579, 81581, 81583, 81585), and the Aβ42/40 ratio was calculated.
Neuropsychological assessments
The study incorporated standardized neuropsychological testing for all participants. Overall cognitive function was evaluated using the MMSE, Montreal Cognitive Assessment (MoCA), and global scores of Clinical Dementia Rating (CDR-GS).14–16 Episodic memory was assessed via the delayed recall component of the Rey Auditory Verbal Learning Test (RAVLT). 17 Language and communication skills were gauged using the Boston Naming Test (BNT). 18 Additionally, the Activities of Daily Living (ADL) scale was employed to assess an individual's capacity to perform essential daily tasks, including functional independence and practical aspects of daily life.
Apolipoprotein E (APOE) genotyping
APOE genotyping was conducted using real-time fluorescent quantitative polymerase chain reaction in accordance with the protocol provided by Wuhan Haijili Biotechnology Co., Ltd The kits used allele-specific primers and Taqman-MGB probe technologies to detect the polymorphism of APOE T388C, C526 T alleles in sample DNA. Specific primers are designed for the polymorphism site, placed in PCR reaction tubes for allele-specific amplification, and the amplification products are monitored in real-time with the Taqman-MGB probe. Participants harboring heterozygous or homozygous ε4 alleles were classified as APOE ε4 carriers.
Magnetic resonance imaging (MRI) acquisition and processing
T1 images underwent preprocessing using voxel-based morphometry with the Computational Anatomy Toolbox 12 (CAT 12, http://dbm.neuro.uni-jena.de/cat/) within the Statistical Parametric Mapping software version 12 (SPM12, http://www.fil.ion.ucl.ac.uk/spm12/).19,20 Gray matter volumes, white matter volumes, and CSF volumes within specific regions of interest (ROIs) were calculated based on the anatomical automatic labeling (AAL) atlas. 21 In conjunction with the Desikan-Killiany atlas, 22 a surface-based morphometry analysis was conducted to estimate cortical thickness, sulcus depth, fractal dimension, 23 and cortical gyrification within defined brain ROIs. 24 Preprocessing of resting-state fMRI (rsfMRI) data was carried out using the CONN Toolbox (http://www.nitrc.org/projects/conn), 25 with post-processing utilizing the RESTplus toolkit (http://restfmri.net/forum/restplus). 26 These tools, combined with the AAL atlas, were employed to extract rsfMRI measures, encompassing amplitude of low-frequency fluctuations (ALFF), fractional ALFF, percent amplitude of fluctuation, and regional homogeneity of Kendall's consistency coefficient. The average time series of ROIs derived from the AAL atlas were extracted, and graph theory analysis of functional networks was performed to elucidate the intricate relationships and interactions between MRI measures and blood biomarkers using the GRETNA toolbox (http://www.nitrc.org/projects/retna). 27 This analysis included metrics such as assortativity, betweenness centrality, degree centrality, network efficiency, nodal clustering coefficient, nodal efficiency, nodal local efficiency, nodal shortest path length, rich club, and small world.
Statistical analysis
Statistical analyses were conducted using IBM SPSS Statistics for Windows, version 26 (IBM Corp.) and GraphPad Prism 9 (GraphPad Software). Outliers for each potential CSF and blood biomarker, defined as values at least 1.5 times the interquartile range (IQR) below the first quartile or above the third quartile, were excluded. All tests were two-tailed. The statistical significance was established at p < 0.05, with a significance threshold of Benjamini-Hochberg false discovery rate (FDR)-corrected p-value (“q-value”) < 0.01 was used for correlation analyses.
Descriptive summaries of data included frequencies and percentages for categorical data. Continuous variables with a normal distribution were presented as mean and standard deviation (SD), while those with a non-normal distribution were presented as median and IQR. Group differences in categorical data, such as sex, clinical subgroups, and APOE ε4 carrier status, were assessed using the χ2 test. Group differences in numerical data, such as fluid biomarker levels, were analyzed using analysis of variance (ANOVA) with post-hoc least significant difference (LSD) tests for normally distributed data or Kruskal-Wallis tests for non-normally distributed data. To investigate differences in MRI measures among different ROIs between the EOAD and LOAD groups, two-sample t-tests were performed. Pearson correlation was employed for normally distributed data, while Spearman rank correlation was used for non-normally distributed data to calculate correlations between blood markers and MRI measures. Partial correlation analysis was utilized to examine correlations between biomarkers and age, APOE carrier status, neuropsychological scores while controlling for gender and years of education. Receiver-operating characteristic (ROC) curves were generated to determine the diagnostic accuracy of blood markers. Area under the ROC curve (AUC) values were computed through binary logistic regression, and cut-off values that maximized Youden indices were determined to assess sensitivity and specificity.
Results
Demographics
Table 1 presents the characteristics of the study population. A higher prevalence of participants carrying the APOE ε4 allele was observed among LOAD patients in comparison to EOAD patients. No demographic disparities were noted between EOAD and LOAD patients with regard to gender, years of education, or cognitive function. However, the OC participants exhibited significantly greater years of education in comparison to LOAD patients.
Demographic data and neuropsychological scores.

MMSE: Mini-Mental State Examination; MoCA: Montreal Cognitive Assessment; RAVLT: delayed recall of the Rey Auditory Verbal Learning Test; BNT: Boston Naming Test; ADL: Activities of Daily Living; CDR-GS: Clinical Dementia Rating-Global Score; EOAD: early-onset Alzheimer's disease; LOAD: late-onset Alzheimer's disease; YC: young controls; OC: old controls; MCI: mild cognitive impairment. *p < 0.05; **p < 0.01; ***p < 0.001; †t test; ‡Mann-Whitney U test; §Pearson Chi-Square test.
Blood biomarker levels across groups
The comparisons of blood biomarker levels revealed significant differences. Blood IL-4 was significantly lower in EOAD than in LOAD (IL-4: p < 0.001) and TNF-α was lower in YC than in OC (TNF-α: p = 0.004). P-tau181, Aβ42, NfL, and GFAP were significantly differed between EOAD and YC, as well as LOAD and OC (EOAD versus YC: p-tau181, p = 0.005; Aβ42, p < 0.001; NfL, p < 0.001; GFAP, p < 0.001; LOAD versus OC: p-tau181: p = 0.002; Aβ42, p < 0.001; NfL, p < 0.001; GFAP, p < 0.001). Similarly, tAOC and MDA showed an increasing trend while SOD showed a decreasing trend across HC, aMCI, and AD (AD versus HC: tAOC, p = 0.008; MDA, p = 0.003; SOD, p < 0.001). There were no significant differences observed for other biomarkers (Tables 2 and 3, Figures 1 and 2).
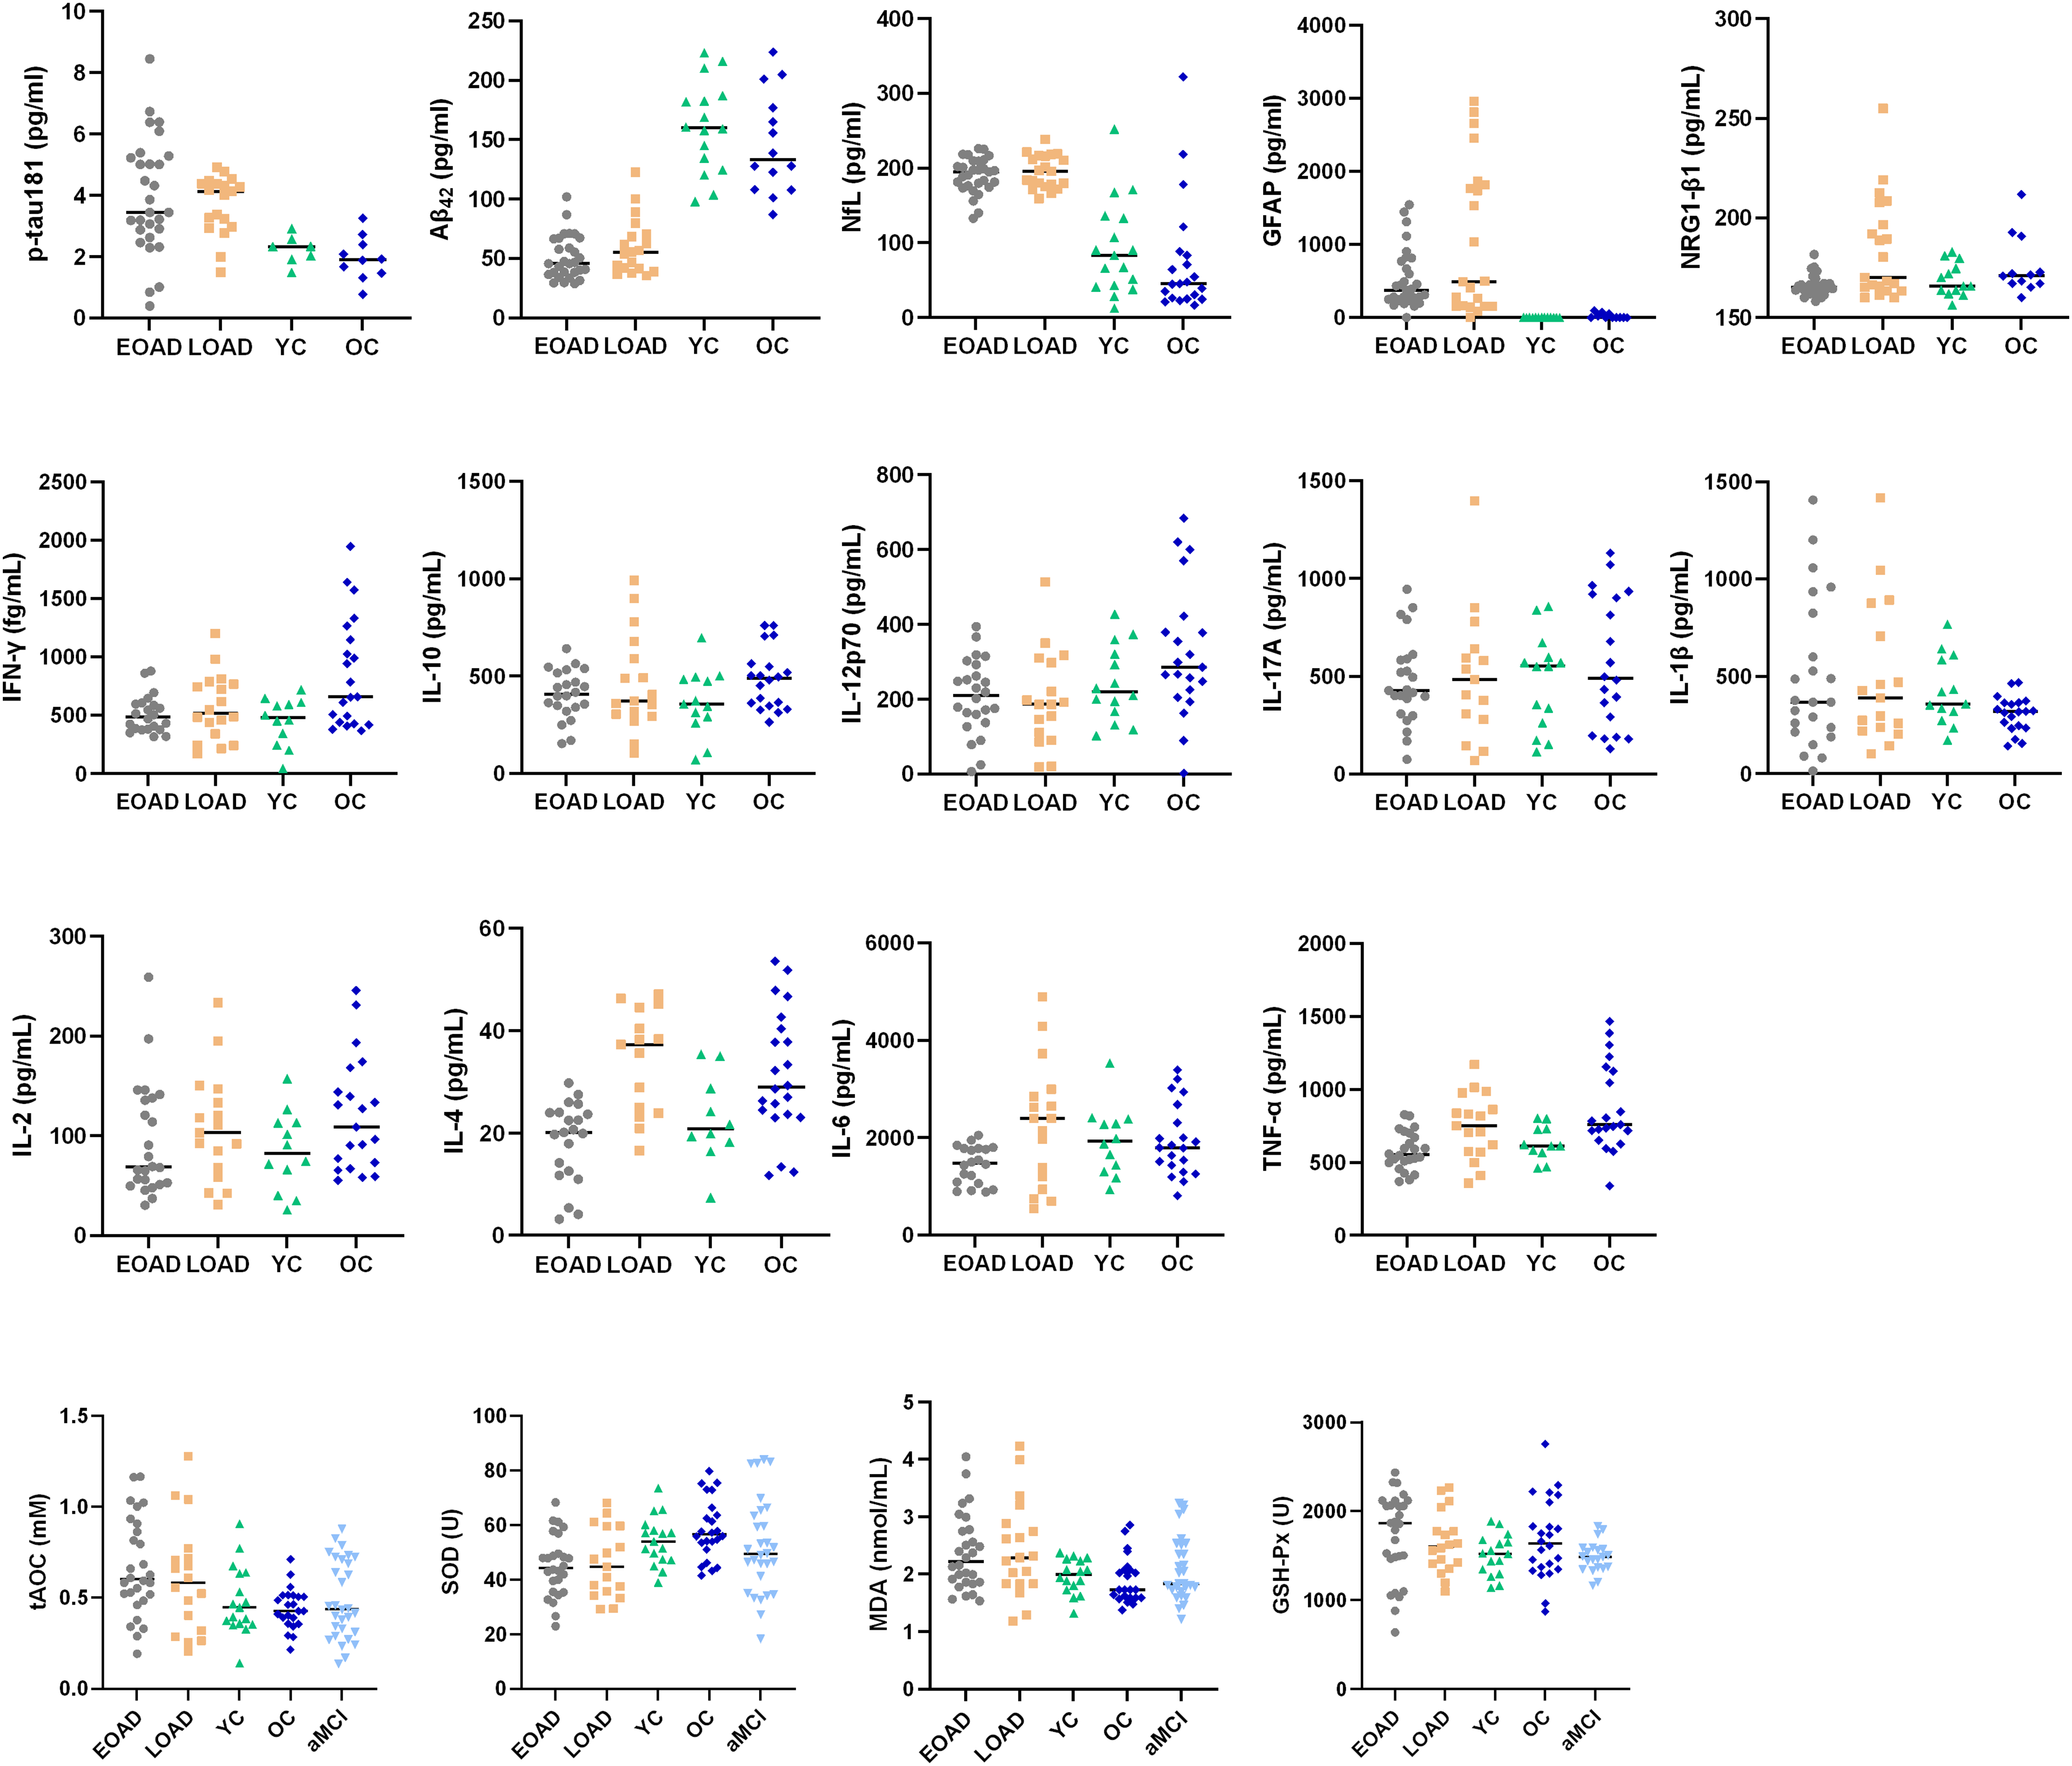
Blood biomarkers comparisons across EOAD, LOAD, YC, and OC groups. The black bar indicates the median value for each group.
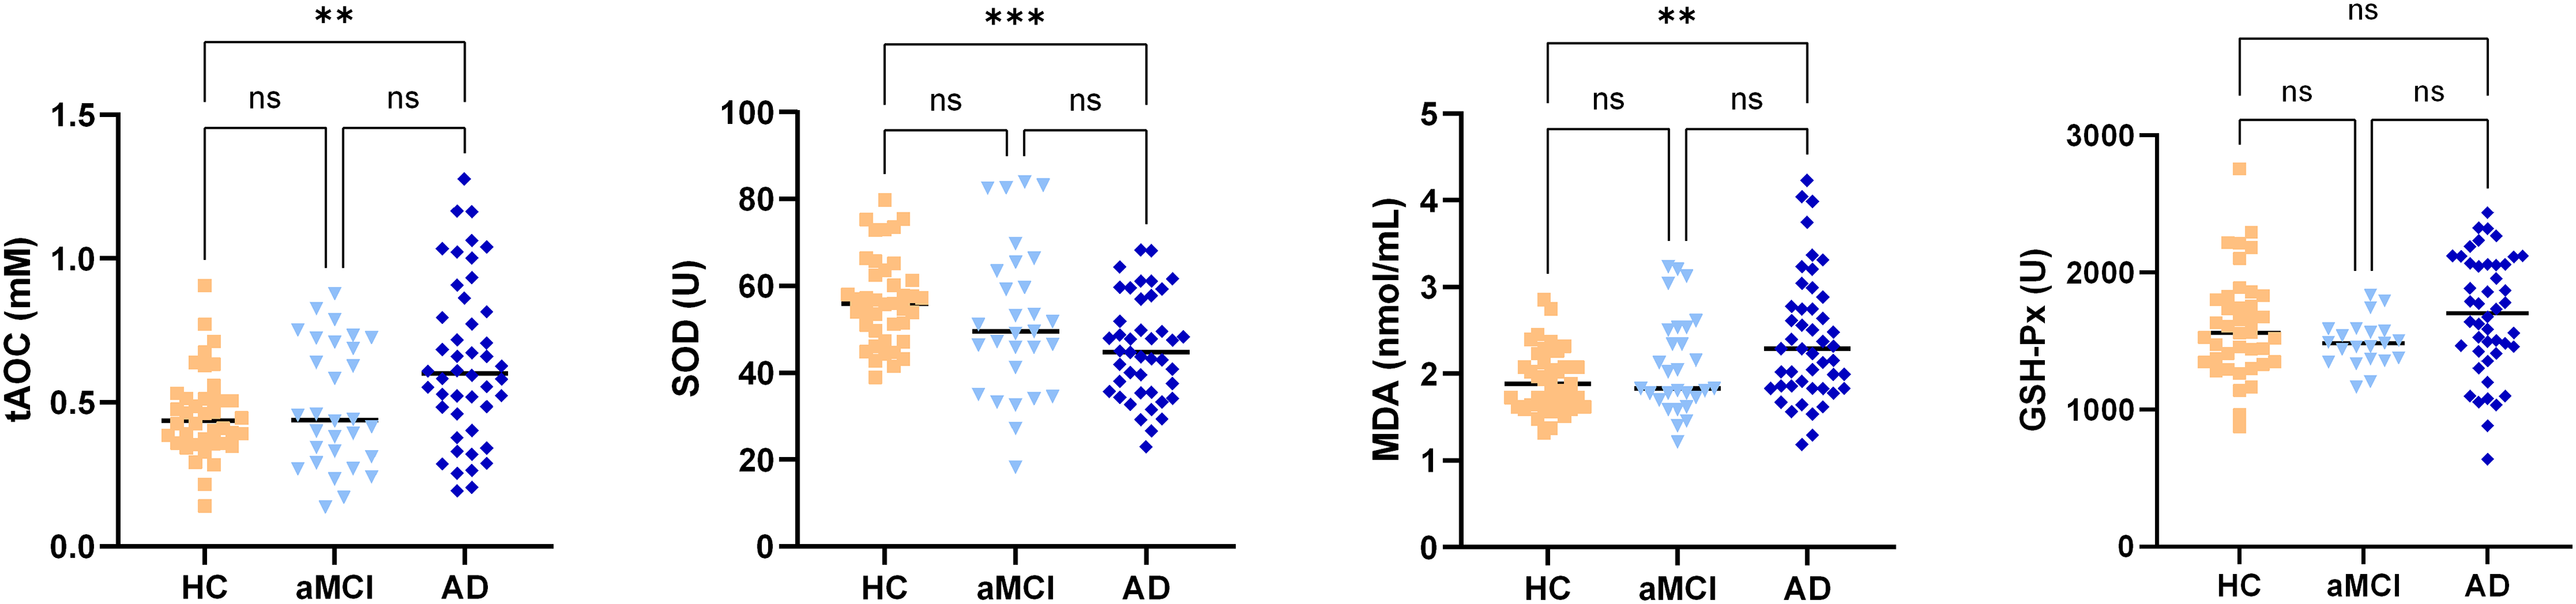
Oxidative stress biomarkers comparisons across HC, aMCI, and AD groups. The black bar indicates the median value for each group. AD: Alzheimer's disease combined EOAD and LOAD; HC: Healthy controls combined YC and OC.
Blood biomarker levels across EOAD, LOAD, YC, and OC groups.
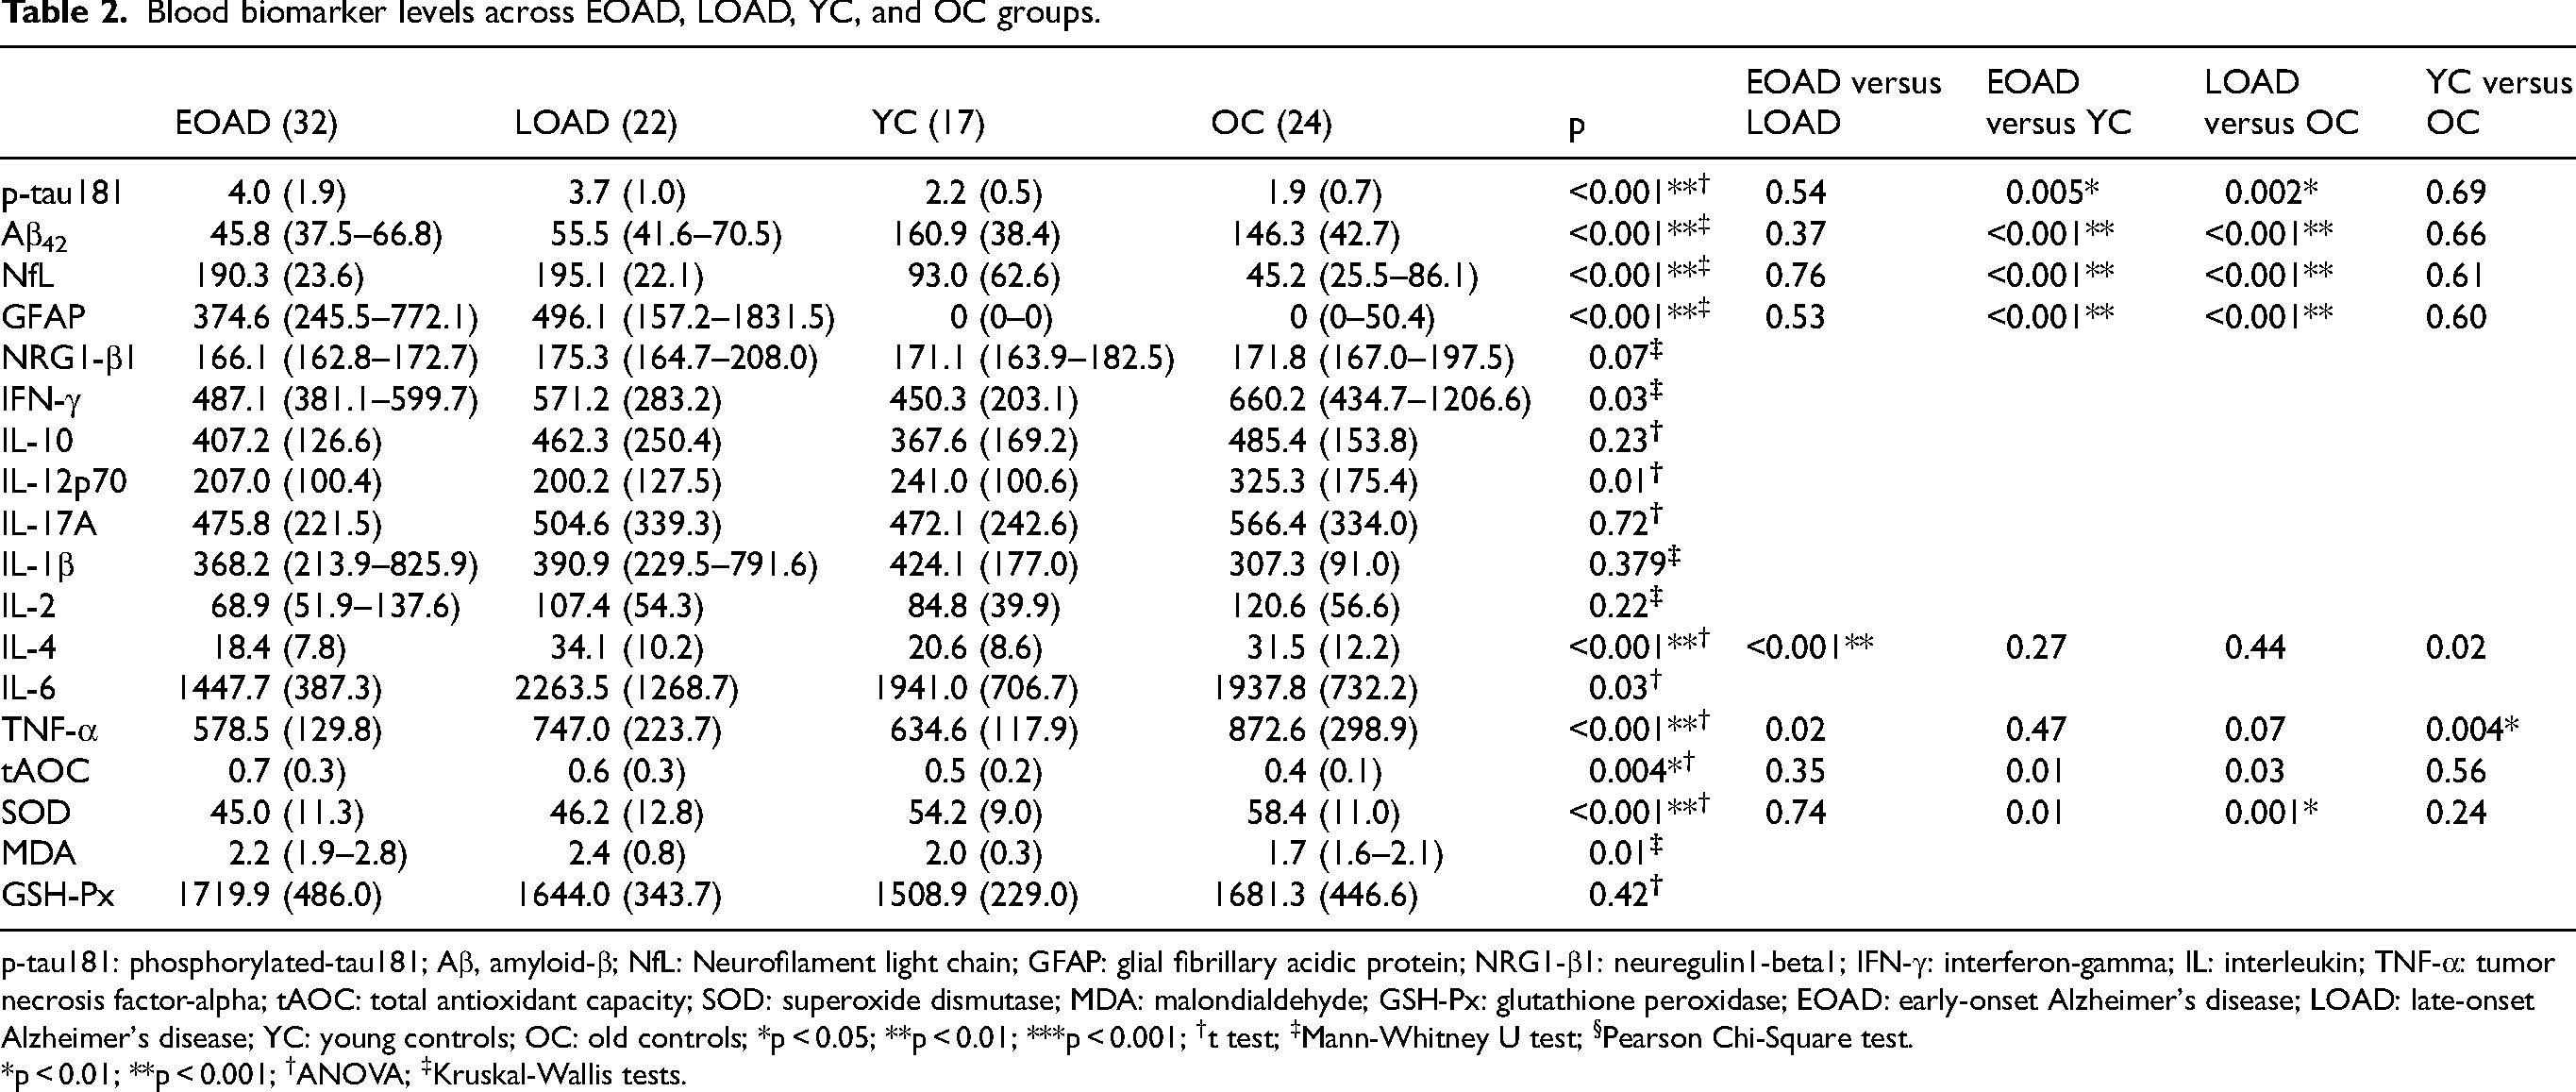
p-tau181: phosphorylated-tau181; Aβ, amyloid-β; NfL: Neurofilament light chain; GFAP: glial fibrillary acidic protein; NRG1-β1: neuregulin1-beta1; IFN-γ: interferon-gamma; IL: interleukin; TNF-α: tumor necrosis factor-alpha; tAOC: total antioxidant capacity; SOD: superoxide dismutase; MDA: malondialdehyde; GSH-Px: glutathione peroxidase; EOAD: early-onset Alzheimer's disease; LOAD: late-onset Alzheimer's disease; YC: young controls; OC: old controls; *p < 0.05; **p < 0.01; ***p < 0.001; †t test; ‡Mann-Whitney U test; §Pearson Chi-Square test.
*p < 0.01; **p < 0.001; †ANOVA; ‡Kruskal-Wallis tests.
Blood biomarker levels across AD, aMCI, and HC groups.

AD: Alzheimer's disease combined early-onset and late-onset AD; aMCI, amnestic mild cognitive control; HC: Healthy controls combined young and old controls; tAOC: total antioxidant capacity; SOD: superoxide dismutase; MDA: malondialdehyde; GSH-Px: glutathione peroxidase. *p < 0.01; **p < 0.001; †Kruskal-Wallis tests.
Correlations of biomarker levels with age, APOE ε4, and CSF AD biomarkers
Among the entire cohort, IL-4 (rs = 0.52, q < 0.001) and TNF-α (rs = 0.38, q = 0.009) exhibited significant correlation with age after FDR correction, while no biomarkers significantly correlated with APOE ε4 carrier status. Within patients with AD (EOAD + LOAD), only IL-4 levels were positively correlated with age (rs = 0.65, q < 0.001), while TNF-α showed significant correlation within HC participants (rs = 0.62, q = 0.004). tAOC and MDA were positively correlated with CSF Aβ42 levels in both AD (EOAD + LOAD) and aMCI patients (tAOC: rs = 0.57, q = 0.002; MDA: rs = 0.53, q = 0.004). Blood p-tau181 was not correlated with CSF t-tau and p-tau, and blood Aβ42 was not correlated with CSF Aβ42/40 and Aβ42.
Correlations between blood biomarkers and neuroimaging markers
In the comparison between EOAD and LOAD, no differences were observed among ROIs in MRI indicators, which included brain structural morphology, graph theory analysis, and local spontaneous neural activity of BOLD signals. Subsequently, we explored potentially informative correlations between blood biomarkers and MRI measures within the entire AD group (EOAD + LOAD) (Figure 3).
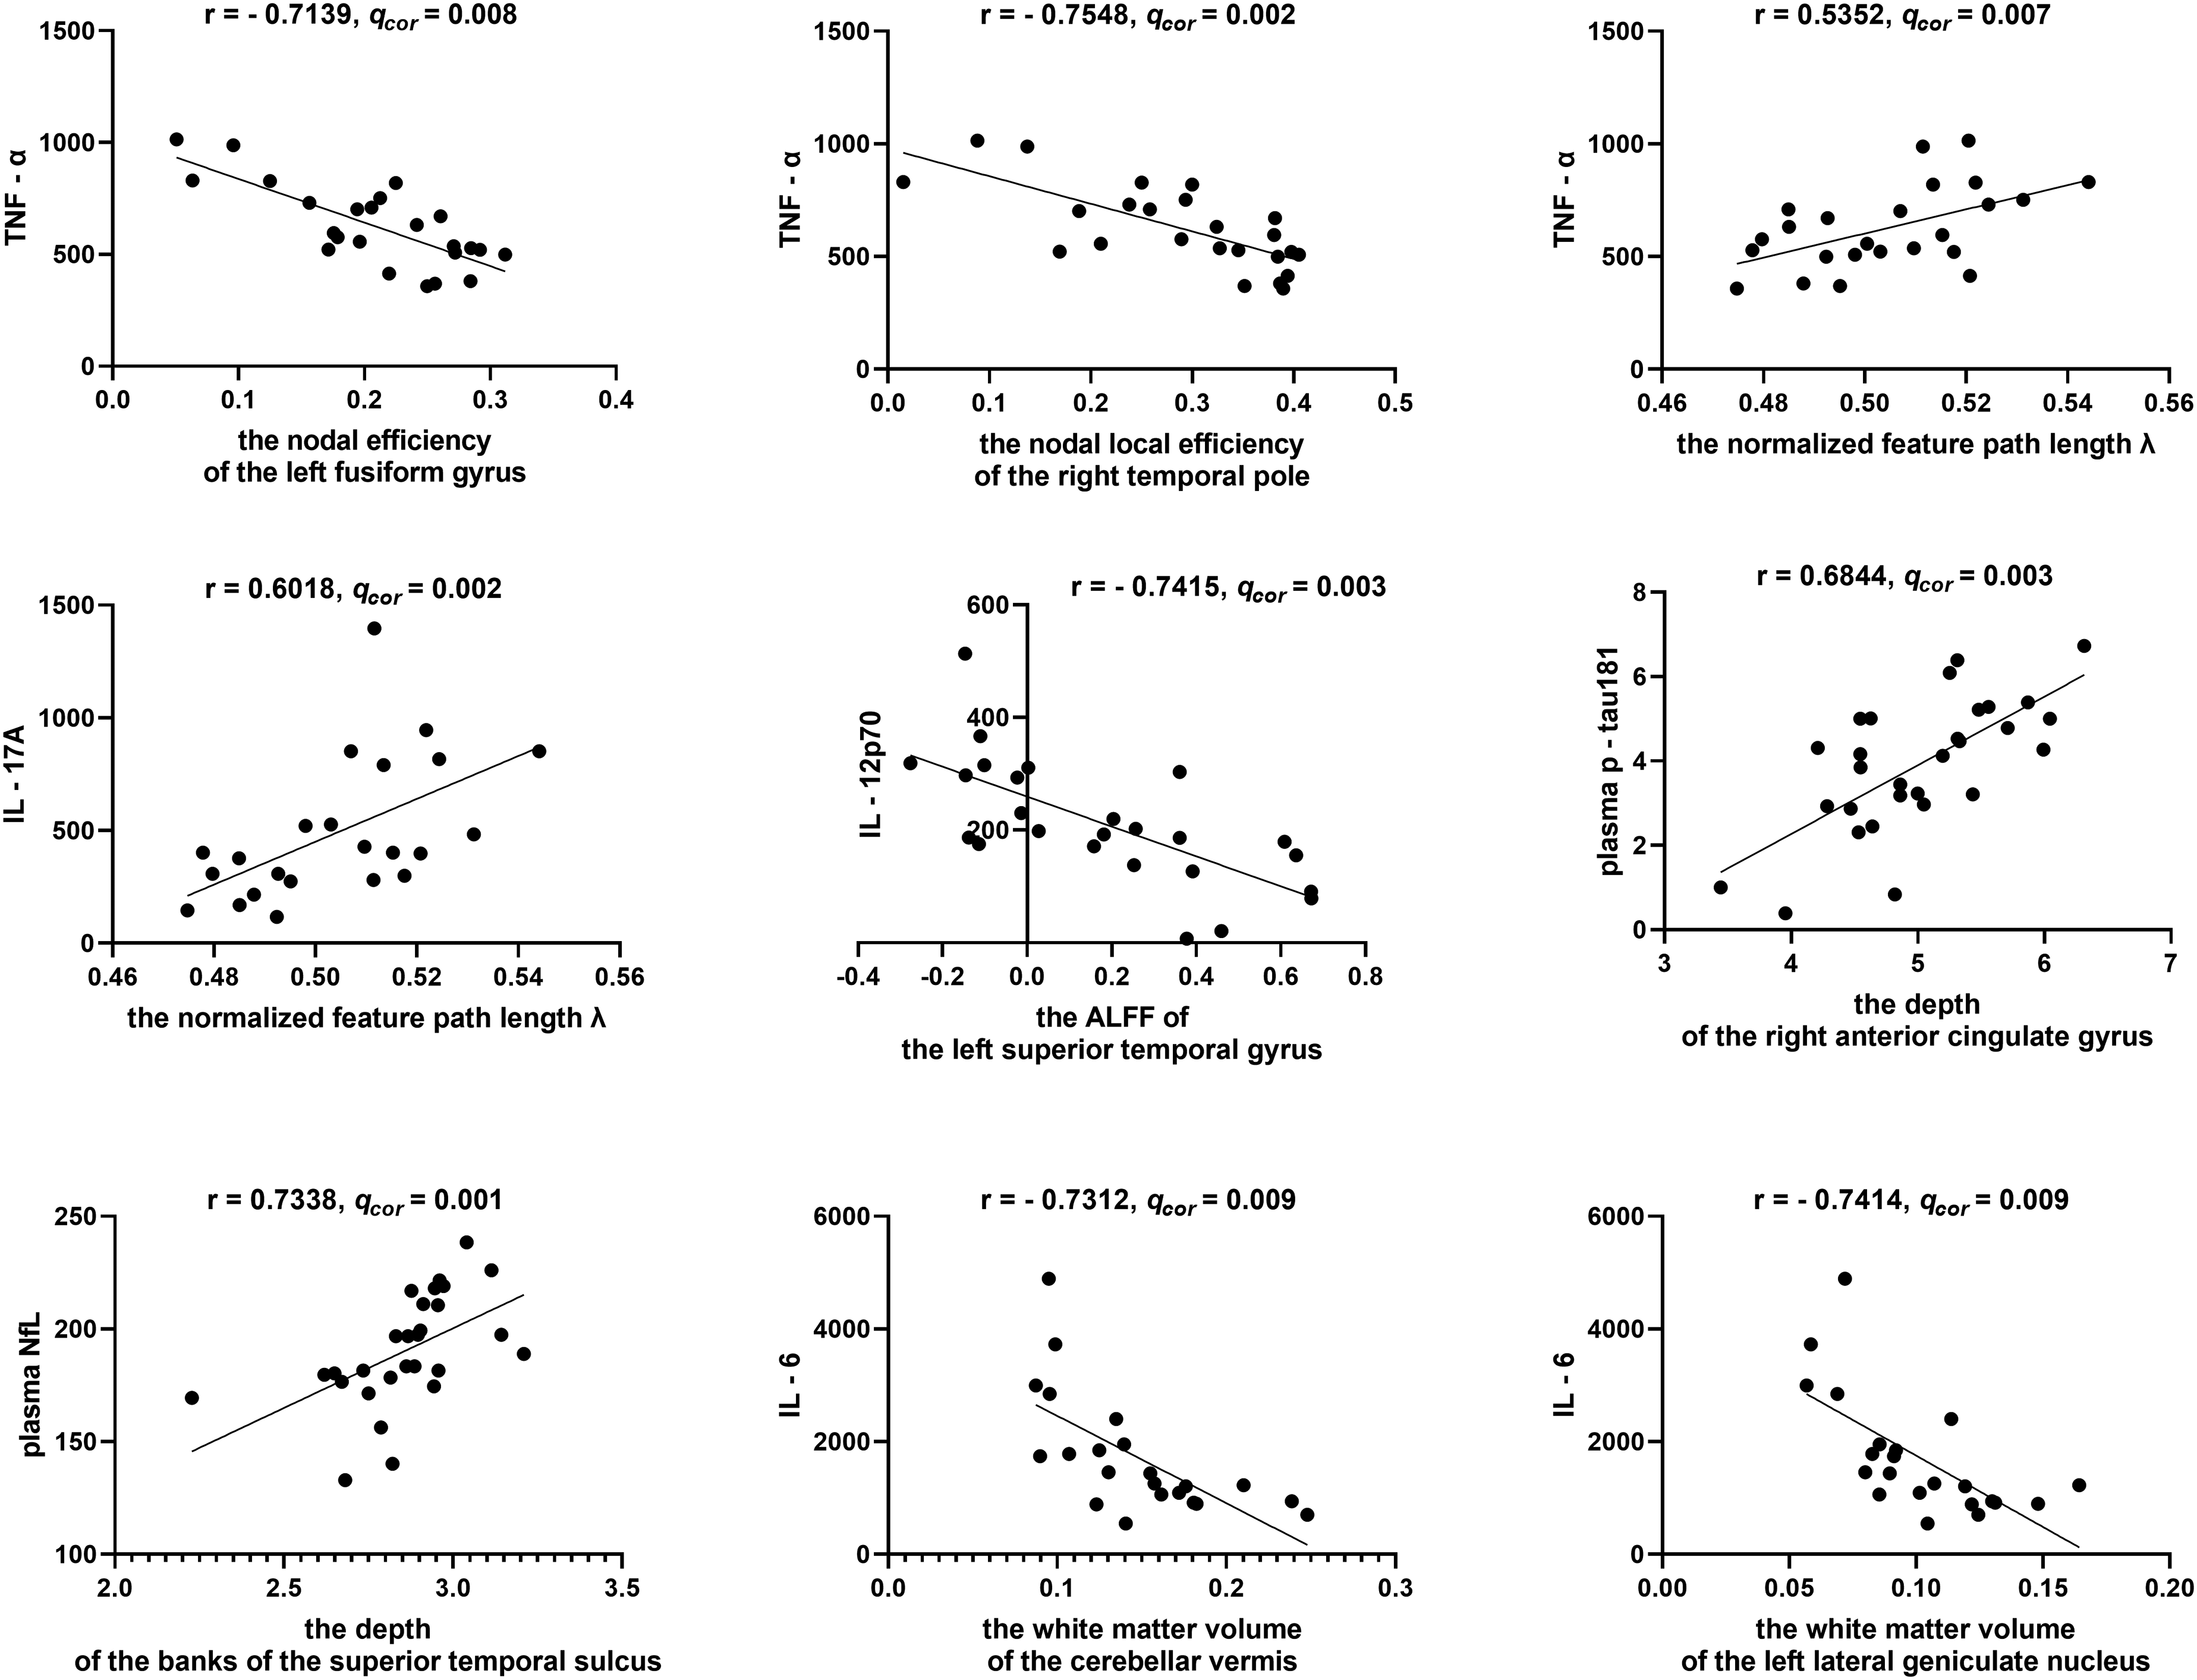
Correlations between blood biomarkers and MRI measures within the AD group. AD: Alzheimer's disease combined EOAD and LOAD.
Results pertaining to brain structural morphology revealed a positive correlation between plasma p-tau181 and the depth of the anterior cingulate gyrus (r = 0.68, q = 0.003). NfL exhibited a positive correlation with the banks of the superior temporal sulcus (r = 0.73, q = 0.0006). Additionally, IL-6 displayed a negative correlation with the white matter volume of the left lateral geniculate nucleus (r = −0.74, q = 0.009) and the white matter volume of the cerebellar vermis (r = −0.73, q = 0.009).
In the context of graph theory analysis, TNF-α exhibited a negative correlation with the nodal efficiency of the left fusiform gyrus (r = −0.71, q = 0.008), the nodal local efficiency of the right temporal pole (r = −0.75, q = 0.002), global network efficiency (r = −0.56, q = 0.007), and a positive correlation with the normalized characteristic path length λ (r = 0.54, q = 0.007). Furthermore, IL-17A displayed a negative correlation with global network efficiency (r = −0.56, q = 0.005) and a positive correlation with the normalized feature path length λ (r = 0.60, q = 0.002) based on this analysis.
Finally, the assessment of local spontaneous neural activity, IL-12p70 exhibited a negative correlation with ALFF in the left superior temporal gyrus (r = −0.74, q = 0.003). The correlations with other blood biomarkers were not statistically significant.
Correlations between blood biomarkers and neuropsychological scores
We further explored the correlations between blood biomarkers and neuropsychological performance as measured by a suite of cognitive scales, including MMSE, MoCA, RAVLT, BNT, ADL, and CDR-GS (Table 4). Across the entire study cohort, blood levels of p-tau181, Aβ42, and NfL were significantly correlated with all neuropsychological scores. Plasma levels of GFAP were found to correlate with MoCA, RAVLT, BNT, and CDR-GS scores. As for oxidative stress biomarkers, SOD levels were correlated with MMSE and MoCA scores, whereas tAOC and MDA levels were correlated with RAVLT scores. No significant correlations were observed between inflammatory biomarkers and neuropsychological scores following FDR correction. After controlling for AD, MCI, and HC groups, none of the biomarkers remained a significant correlated.
Correlations between blood biomarker levels and neuropsychological scores.

MMSE: Mini-Mental State Examination; MoCA: Montreal Cognitive Assessment; RAVLT: Rey Auditory Verbal Learning Test (delayed recall); BNT: Boston Naming Test; ADL: Activities of Daily Living; CDR-GS: Clinical Dementia Rating-Global Score; p-tau181: phosphorylated-tau181; Aβ, amyloid-β; NfL: Neurofilament light chain; GFAP: glial fibrillary acidic protein; NRG1-β1: neuregulin1-beta1; IFN-γ: interferon-gamma; IL: interleukin; TNF-α: tumor necrosis factor-alpha; tAOC: total antioxidant capacity; SOD: superoxide dismutase; MDA: malondialdehyde; GSH-Px: glutathione peroxidase. Sex and years of education were covariates. *p < 0.01; **p < 0.001.
Blood biomarkers for the diagnosis of AD from age-matched HC
Given the significant correlations between blood Aβ42, p-tau181, NfL, and GFAP levels with neuropsychological scores, we proceeded to assess the diagnostic accuracy of these four biomarkers for distinguishing EOAD from YC and LOAD from OC (Figure 4). Using optimal cut-off values of 92.5 ng/mL and 100.7 ng/mL for EOAD and LOAD, respectively, Aβ42 exhibited excellent discriminative ability for both EOAD (AUC = 0.9978, 95% CI = 0.99–1.00, p < 0.001) and LOAD (AUC = 0.9737, 95% CI = 0.93–1.00, p < 0.001). With optimal cut-off values of 2.99 ng/mL and 2.74 ng/mL for EOAD and LOAD, respectively, p-tau181 demonstrated better discriminative capability for LOAD (AUC = 0.9211, 95% CI = 0.82–1.00, p < 0.001) than for EOAD (AUC = 0.8325, 95% CI = 0.70–0.96, p = 0.007). Furthermore, NfL, with optimal cut-off values of 138.1 ng/mL and 140.6 ng/mL for EOAD and LOAD, respectively, displayed good accuracy in distinguishing EOAD from YC (AUC = 0.9189, 95% CI = 0.80–1.00, p < 0.001) and LOAD from OC (AUC = 0.9025, 95% CI = 0.79–1.00, p < 0.001). GFAP, on the other hand, provided effective discrimination for EOAD (AUC = 0.9839, 95% CI = 0.95–1.00, p < 0.001) but not for LOAD (AUC = 0.5079, 95% CI = 0.31–0.71, p = 0.94). These findings suggest that blood Aβ42 and p-tau181 exhibit a high degree of separation between AD and age-matched controls (with sensitivity and specificity exceeding 90%), while NfL ranks second in terms of performance. GFAP's performance appears to be influenced by age.
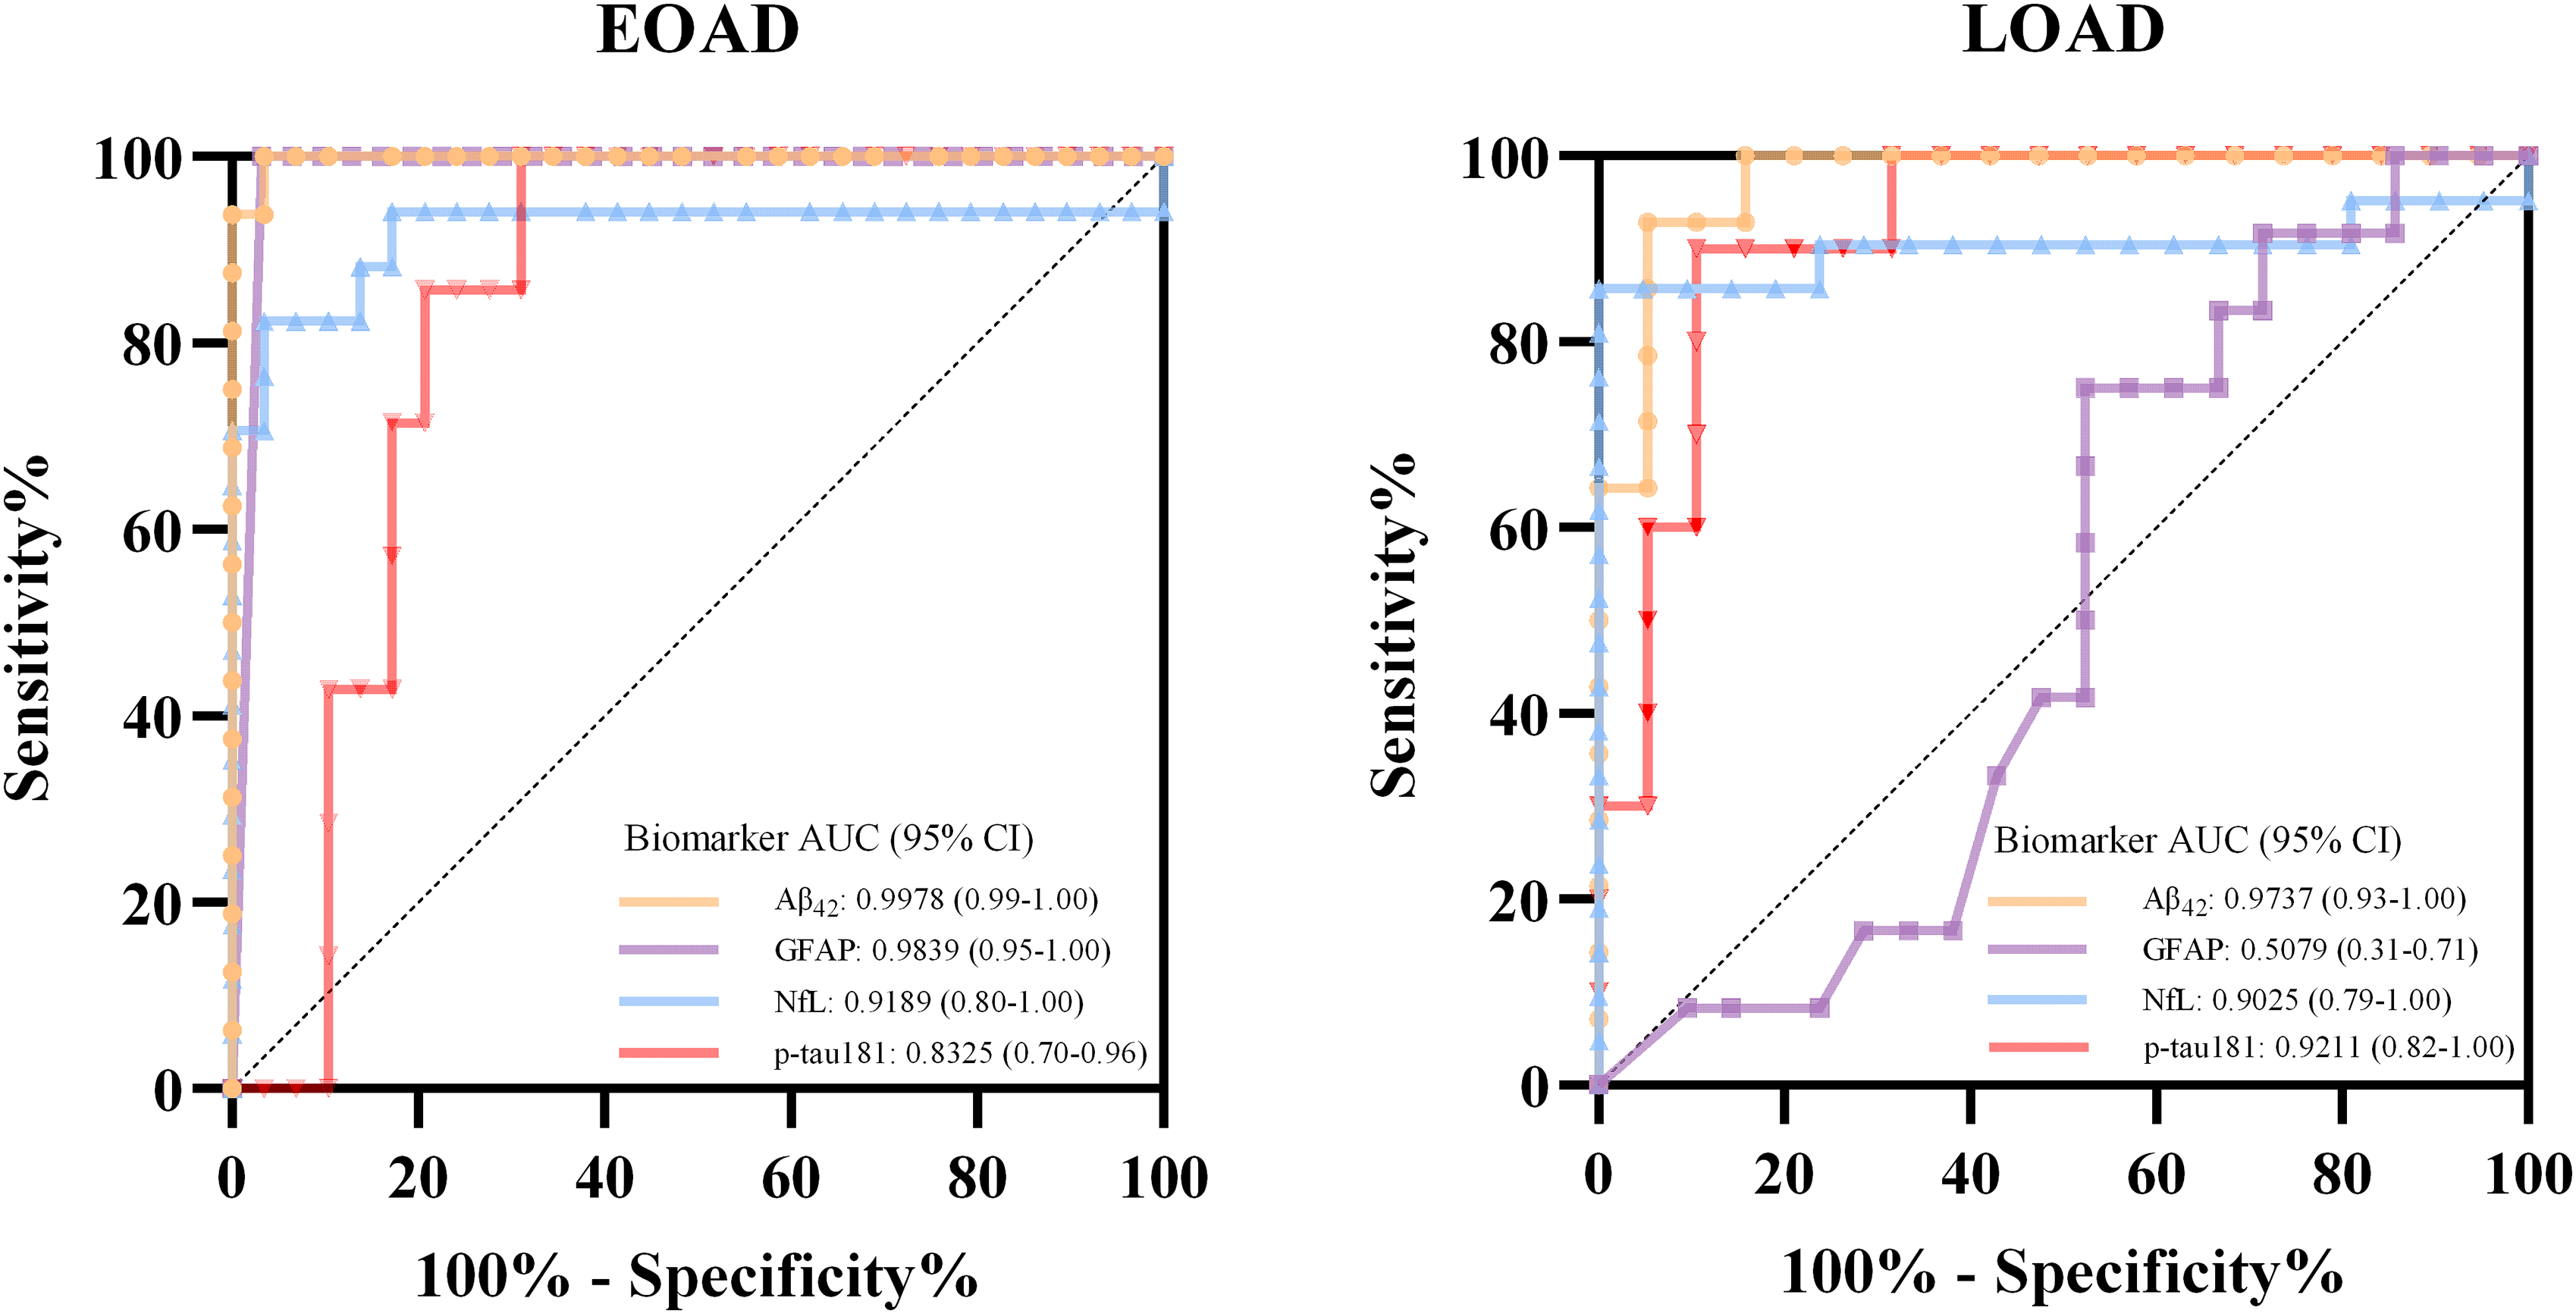
ROC curves of blood p-tau181, Aβ42, NfL, and GFAP in the discrimination of patients with AD from HC. AD: Alzheimer's disease combined EOAD and LOAD; HC: Healthy controls combined YC and OC.
Discussion
Extensive research has explored blood biomarkers in AD populations, but limited studies have characterized these biomarkers in EOAD patients. Our results offer clinical insights into the potential utility of biomarkers in diagnosing or indicating biological treatment effects in individuals under the age of 65. While blood inflammatory markers tend to increase with advancing age, our findings strongly suggest that peripheral inflammation emerges as a significant factor in LOAD and the deterioration of brain function. Among the studied biomarkers, Aβ42, p-tau181, NfL, and GFAP exhibited robust correlations with cognitive outcomes and high diagnostic accuracy for AD patients. However, GFAP was particularly effective in discriminating EOAD patients.
Inflammatory cytokines have been implicated in age-related degeneration and AD progression. 10 Our findings reveal lower levels of IL-4 and TNF-α in EOAD compared to LOAD, suggesting that patients with LOAD may experience a more pronounced inflammatory response than younger patients. Recent studies have demonstrated the involvement of the cGAS–STING pathway in inflammation in peripheral organs and the brain, triggering neurodegeneration and cognitive decline.28,29 This suggests that anti-inflammatory treatments might hold potential as a strategy to halt neurodegenerative processes during old age. However, our correlation analysis indicates that age is also associated with increased IL-4 and TNF-α levels, suggesting that aging contributes to the inflammatory profile observed in LOAD. Hence, we propose that anti-inflammatory strategies may be more effective in patients of older age. 30 Overall, although inflammatory cytokines may play a role in AD pathogenesis, their blood concentrations may be subject to wide individual variation and the influence of different screening tools, making them unreliable indicators for diagnosing AD in individuals.
In line with various published data,31–34 we suggest that blood Aβ42 and p-tau181 are robust biomarkers for diagnosing and tracking AD. Additionally, previous research has indicated that NfL and GFAP may lack specificity to AD.35,36 We found that lower levels of blood Aβ42 and higher levels of p-tau181, NfL, and GFAP were associated with overall cognitive decline, episodic memory impairment, language and communication deficits. Lower levels of Aβ42 and higher levels of p-tau181 and NfL also associated with diminished daily living abilities. When we controlled diagnostic groups, no biomarkers remained significantly correlated with neuropsychological scores, suggesting the associations may reflect group differences rather than independent effects. Prior studies have identified associations between amyloid and tau markers in blood and CSF. 37 However, our results suggest relatively weak correlations between AD pathological markers in these fluids, implying differential regulation. 38 The small sample size in our study may have contributed to both these discrepancies and the lack of a significant correlation between NfL levels and age,39,40 which may also be influenced by the heterogeneous nature of our cohort. Additionally, the presence of the APOE ε4 allele, commonly regarded as a genetic marker for LOAD, 41 was significantly less prevalent in the EOAD group than in the LOAD group in our investigation. However, the presence of this allele did not exert a significant influence on the levels of the targeted biomarkers.
Similarly, although we did not find that early onset of AD affected levels of oxidative stress markers, our findings suggest a progressive trend toward increased severity of oxidative stress across the cognitive spectrum from HC to aMCI and to AD. Consistent with previous studies,42,43 we found that AD patients exhibited lower SOD activity and higher tAOC and MDA levels, supporting the notion that oxidative stress may contribute to AD. In addition, our results showed that GSH-Px activity was comparable between AD, aMCI, and HC. While previous studies indicated that baseline levels of GSH are comparable between HC and MCI 44 or AD, 45 the GSH levels declined over time specifically within MCI instead of HC group. The decline in GSH is associated with accelerated cognitive decline and an increased risk of AD.44–46 Collectively, oxidative stress may be integrally associated with cognitive decline and damage to cellular structures and brain metabolism.43,47,48
Our findings further support the correlation between SOD and global cognition, as well as the relationship between tAOC and MDA with episodic memory function. The study provides additional evidence for the value of tAOC and MDA as biomarkers of cerebral amyloid pathology, as they exhibited significantly correlated with CSF Aβ42 in AD and aMCI patients. 11
NRG1-β1, a soluble protein belonging to the NRG family, plays a crucial role in synaptic maturation, as well as neuronal cell survival and repair. 49 Two previous studies have shown increased soluble NRG1 levels in AD patients during MCI and dementia stages, correlating significantly with MMSE scores.9,50 However, our findings suggest that NRG1-β1 levels were insufficient to represent cognitive impairment and AD.
Our study provides supporting evidence for the utility of blood biomarkers in detecting brain microstructural alterations and functional changes between brain regions. While age-related brain structural changes are well-documented, 51 our analysis among AD patients found no significant correlations between brain structures and age, suggesting that disease-specific factors may overshadow age effects on brain morphology in AD. Our imaging evidence suggests that both EOAD and LOAD patients share a comparable pattern of brain structure and function, indicating that early onset may affect brain atrophy and brain connectivity to the same extent as late onset.52,53 Our correlation analysis demonstrated that increased levels of TNF-α and IL-17A indicated a decrease in the efficiency of information exchange or integration in various brain regions, particularly in the vulnerable temporal lobe area in AD. 54 Such changes can significantly impact face recognition abilities in AD patients. Additionally, we found that alterations in blood p-tau181 and IL-12p70 levels in AD patients were accompanied by abnormalities in regional spontaneous activity of BOLD signals and the morphology of brain structures.55,56 These findings provide supporting evidence for the utility of blood biomarkers in detecting changes in brain structure and function.
One of the primary strengths of this study is its categorization of participants based on age, allowing for the investigation of multiple biomarkers in EOAD participants, which adds substantial meaning to the study. We highlighted the variation trend of oxidative biomarkers among AD, aMCI, and HC participants. We also proposed that treatment strategies may differ based on the age of disease onset to address the distinct mechanism. This study contributes to a more thorough understanding of associations between blood biomarkers and imaging findings. Moreover, our study validates the potential of p-tau181, Aβ42, NfL, and GFAP in detecting cognitive decline and diagnosing AD, underscoring their relevance in clinical practice.
This study has limitations related to potential analytical shortcomings associated with standard immunoassays, which could introduce interferences that might be addressed with analytical improvements. Novel accurate blood biomarkers, such as p-tau217 and p-tau231, might be better indicators of amyloid pathology. 4 Moreover, a notable constraint of this research lies in the relatively modest sample size, potentially impeding the extrapolation of our results. To mitigate these issues, forthcoming investigations should involve larger and more diverse cohorts to corroborate the present findings and to more precisely elucidate the intricacies of AD pathophysiology.
While blood biomarkers offer greater accessibility and potential for broader clinical application in the future, they also have notable limitations. Blood is a more challenging matrix than CSF for brain biomarkers, and there is still limited evidence regarding the peripheral effects of AD. Brain proteins released into the blood may undergo degradation, metabolism, or clearance, which can affect their concentration in the bloodstream. Further research is warranted to explore the specific mechanisms underlying the early onset of AD in relation to biomarker levels.
Footnotes
Acknowledgements
The authors thank all the participants for their participation. Yi Tang and Qi Qin are Editorial Board Members of this journal but were not involved in the peer-review process of this article nor had access to any information regarding its peer-review.
Ethical considerations
This study adhered to the Declaration of Helsinki and was approved by the Ethics Committee of Xuanwu Hospital, Capital Medical University.
Consent to participate
Written informed consent was obtained from all participants.
Author contribution(s)
Funding
The authors disclosed receipt of the following financial support for the research, authorship, and/or publication of this article: This project has received funding from Young Elite Scientists Sponsorship Program by CAST (2021QNRC001), Beijing Hospitals Authority Innovation Studio of Young Staff Funding Support (202118), Beijing Nova Program (Z211100002121051), National Natural Science Foundation of China (82201568, 82220108009, 81970996), National Key R&D Program of China (2022YFC3602600), and STI2030-Major Projects (2021ZD0201801).
Declaration of conflicting interests
The authors declared no potential conflicts of interest with respect to the research, authorship, and/or publication of this article.
Data availability
The data supporting the findings of this study are available on request from the corresponding author. The data are not publicly available due to privacy or ethical restrictions.