



Abstract
Background
This study uses the Unpredictable Chronic Mild Stress (UCMS) model to investigate the effects of mid-life stress (MLS) on vascular and neurobiological changes in triple transgenic Alzheimer's disease mice (3xTg-AD) during critical developmental stages.
Objective
To investigate how mid-life stress (MLS) affects cerebrovascular function and AD progression. We hypothesize that chronic stress in 3xTg-AD mice will accelerate cerebrovascular dysfunction and, subsequently, the associated AD pathology.
Methods
Wild-type (WT) and 3xTg-AD mice were subjected to UCMS for 8 weeks at 4 months of age, with physiological, vascular, and molecular outcomes assessed at 6 and 9 months of age. We evaluated cerebrovascular function in the middle cerebral artery (MCA) and measured the expression of key mRNA and protein alterations associated with amyloid-β (Aβ) and tau pathology, which drive AD progression.
Results
Both WT and 3xTg-AD mice exposed to UCMS had significant MCA endothelial dysfunction. Additionally, UCMS accelerated the expression of key AD-related genes, and we observed increased oxidative stress, characterized by higher pro-oxidants and lower antioxidants. Elevated APP and BACE protein levels further suggest that MLS accelerated AD progression.
Conclusions
This study highlights the harmful effects of MLS on cerebrovascular health and the neurobiological mechanisms underlying AD progression. Our findings emphasize the critical link between chronic stress, oxidative dysfunction, and the acceleration of AD progression, offering important insights into potential therapeutic targets for alleviating the impacts of mid-life environmental stressors on AD development.
Introduction
Alzheimer's disease (AD) is a progressive, multifactorial neurological disorder characterized by the accumulation of amyloid-β (Aβ) plaques and neurofibrillary tangles in the brain, which together drive synaptic dysfunction, neuronal loss, and ultimately the progression of dementia. 1 Epidemiological evidence suggests that cerebrovascular dysfunction emerges decades before the onset of AD and may play a contributory role in AD progression.2,3 Preclinical studies support the notion that alterations in the cerebral microvasculature occur prior to cognitive decline and contribute to early AD pathogenesis as well as the development of mixed or multi-etiology dementia.4–7 Indeed, progressive accumulation of vascular abnormalities was reported in the middle cerebral artery (MCA) of the genetic AD mouse model (triple-transgenic mice (3xTg)) in an age and sex-dependent manner. 8 These studies highlight the importance of vascular contributions to cognitive impairment and dementia, which occurs in 30–60% of AD individuals.9–11
Chronic psychological stress is a considerable health concern in America, and is associated with an increased risk of chronic disease and cognitive decline.12–15 Using a preclinical model of stress (Unpredictable Chronic Mild Stress, UCMS), we demonstrated that stress leads to cerebrovascular dysfunction and cognitive decline in C57BL/6 mice.16,17 Chronic stress has been strongly linked with dementia,18–22 suggesting that stress and dementia interact to drive the progression of AD-related dementias. However, how mid-life exposure to chronic stress influences AD progression is not yet fully understood, particularly regarding how the stress-induced cerebrovascular changes contribute to this relationship. This study aims to investigate how mid-life stress (MLS) affects cerebrovascular function and the progression of AD. We hypothesize that chronic stress in 3xTg-AD mice will accelerate cerebrovascular dysfunction and, subsequently, the associated AD pathology. Specifically, we hypothesize that the underlying mechanism is the disruption of redox homeostasis.
Methods
Animals and group allocation
Homozygous male and female 3xTg-AD (https://www.jax.org/strain/004807) mice and non-Tg controls (WT) (https://www.jax.org/strain/101045) (C57BL6/129S) were obtained from The Jackson Laboratory, and the colonies were bred and maintained at West Virginia University with 6 to 9 mice per group. This 3xTg-AD mouse model progressively develops Aβ deposits and neurofibrillary tangles, the two main hallmarks of AD, beginning around 6 months of age.23–25 Starting at 4 months of age, the mice were randomly assigned to specific groups for the 8 weeks: (1) WT control; (2) WT UCMS; (3) 3xTg control; and (4) 3xTg UCMS. A subset of mice were euthanized ∼48 h following exposure to 8 weeks of chronic stress at 6 months of age, and another subset of mice were aged to 9 months of age (i.e., 3 months after UCMS ended); these time points were chosen as they allowed us to assess the impact of chronic stress on the progression of AD. All control and UCMS mice were fed standard chow and water ad libitum for all experiments and kept on a 12-h light/dark cycle (6:00 A.M. lights on/6:00 P.M. lights off), with 2–5 animals housed per cage (controls) and UCMS (single-housed) in the same room. Food/water and weight logs for the mice were maintained throughout the study. Protocols received prior approval from the WVUHSC Animal Care and Use Committee. No statistical methods were employed to determine the sample size; nonetheless, our selections are consistent with those from comparable studies. Given the sample size, experiments were performed on both male and female mice, and the results were combined for analysis.
Chronic stress intervention
As previously performed 17 we used the UCMS model to induce chronic stress in our mice.26,27
Within the UCMS paradigm, each stressor (damp bed, cage tilt, no bedding, damp bedding, etc.) elicits a minor effect that is compounded over 8 weeks until allostatic overload results. The stressors were administered in combinations of 2–3 stressors daily, randomly chosen, for approximately 7 h each day, 5 days a week, for 8 weeks. These stressors were presented in short intervals throughout the day from 8:30 AM to 3:30 PM. The following stressors were performed in the study:
Damp bedding – 10 oz. of water was added to each standard cage Bath – all bedding was removed and ∼0.5 inches of water was added to empty cage. The water temperature was room temperature, ∼24°C. Cage Tilt – cage was tilted to 45 degrees without bedding Social stress – each mouse was switched into the cage of a neighboring mouse No bedding – all bedding was removed from the cage. Alteration of light/dark cycles –turning lights off/on in random increments for a scheduled period.
Euthanasia and tissue collection
Mice were anesthetized with isoflurane (4–5% concentration) in an induction chamber and euthanized upon cessation of respiratory and cardiac activity. Following euthanasia, the following tissues: brain (sectioned), liver (sectioned), heart, and visceral fat were carefully harvested. The whole blood was collected via cardiac puncture and centrifuged at 3000 rpm to isolate plasma. Tissues and plasma were immediately stored in cryovials and preserved in liquid nitrogen or on ice for subsequent analyses.
Coat scores
During the 8-week protocol, we evaluated the grooming habits of rodents, focusing on their coat condition as an indicator of physical and psychological health. We developed a scoring system that measured cleanliness in eight body areas: head, neck, back, forelimbs, stomach, hindlimbs, tail, and genitals, assigning scores of 0 for clean and 1 for dirty.27,28 At the end of each week, we calculated a cumulative coat score to represent overall cleanliness. A higher score indicated increased dirtiness, which could suggest stress or health issues. This standardized method aimed to correlate grooming behavior with environmental factors, highlighting the importance of a clean habitat for rodent welfare.
Cerebrovascular reactivity
Mice were euthanized, and the brain was carefully removed from the skull and placed in a cold physiological salt solution (PSS; 4°C). Both MCA were dissected from their origin at the Circle of Willis and placed into an isolated microvessel chamber (Living systems) filled with PSS. Each MCA was subsequently doubly cannulated within a heated chamber (37°C) that allowed the lumen and exterior of the vessel to be perfused and superfused, respectively, with PSS from separate reservoirs. The PSS was equilibrated with a 21% O2, 5% CO2, and 74% N2 gas mixture and had the following composition (mM): 119 NaCl, 4.7 KCl, 1.17 MgSO4, 1.6 CaCl2, 1.18 NaH2PO4, 24 NaHCO3, 0.026 EDTA, and 5.5 glucose. Any side branches were ligated. MCA diameter was measured using television microscopy and an on-screen video micrometer.
Following cannulation, MCAs were extended to their in-situ length and equilibrated at 70 mmHg mean arterial pressure. Following equilibration, the MCA dilator reactivity was assessed in response to increasing concentrations of an endothelial-dependent dilator (EDD, acetylcholine; Ach (Sigma Aldrich, Product no#A6625), 10−9M – 10−4M), endothelial-independent dilator (EID, sodium nitroprusside (Sigma Aldrich, cat#152061); SNP 10−9M – 10−4M), and a potent vasoconstrictor (phenylephrine, PE (Sigma Aldrich, Product no#P6126) (10−9M – 10−4M). To assess the effects of NO on EDD, the MCA was acutely incubated (30 min) with L-NAME (Sigma Aldrich, Product no#N57571) (10−4 M) and the MCA EDD response to ACh was repeated. To assess the acute effects of oxidative stress on modulating EDD, we acutely (30 min) incubated the MCA with (1) Tempol (10−4 M, Sigma Aldrich, cat# 176141); and (2) febuxostat (10 mM; Axon Medchem BV, Netherlands).
Western blot (WB) analysis
Brain tissue (front brain; hippocampus and cortex combined) was homogenized in the bead mill (Beadmill 4 Mini Homogenizer; Fisherbrand-cat # 15-340-164) with 1x TBS/RIPA buffer plus 1X HALT Protease and inhibitor cocktail (Halt™ Protease Inhibitor Cocktail (100X); Thermofisher-cat # 78429) for two cycles of 30 s each and then centrifuged at 5000 rpm at 4°C for 10 min and the supernatants were collected and stored at −80°C until protein quantification. Total protein concentration was determined by the bicinchoninic acid method (BCA, Pierce). An equal amount of protein for each sample (25 µg) was loaded in 4–12% Bolt-bis tris gels (Bolt™ Bis-Tris Plus Mini Protein Gels, 4–12%, 1.0 mm, WedgeWell™ format; Invitrogen- cat #NW04120BOX) using 1X MOPS SDS Running buffer (20X Bolt™ MOPS SDS Running Buffer; Invitrogen- cat # B001) at constant voltage (200 V) for 40 min. After the completion of gel electrophoresis, the protein was transferred to nitrocellulose membranes using 1X Bolt Transfer buffer (Bolt™ Transfer Buffer (20X); Invitrogen- cat #BT006) for 1 h. The membranes were blocked for 1 h using 5% non-fat dry milk (Non-fat dry milk; Cell signaling- cat #9999) in 0.1% TBST (Tris-buffered saline with Tween 20 10X; Cell signaling- cat #9997) and imaged with Pierce Reversible stain (Pierce™ Reversible Protein Stain Kit for Nitrocellulose Membranes; Thermo Fisher- cat #24580) for total protein quantification. Primary antibodies against Amyloid-beta Precursor Protein (APP) (Thermo Fisher, cat#13-0200), Beta-secretase cleaving enzyme (BACE) (Abcam, cat#ab108394), and Total tau (TAU-5) (Thermo Fisher, cat#AHB0042) were diluted in blocking buffer and incubated with the membranes overnight at 4°C. After washing, membranes were incubated with HRP-conjugated secondary antibodies for 1 h at room temperature. Blots were imaged using visualization of protein bands in the chemiluminescence imaging system G-box (SyngeneTM G: BOX Chemi XX6/XX9; Fisher scientific cat- 01-257-167) using ECL Substrate and quantified using ImageJ software.
Pathway-focused quantitative polymerase-chain-reaction (qPCR) analysis
Dissected mouse brain sections (mid-brain, hippocampus, and cortex combined) were collected and stored in cryotubes at −80°C. Total RNA was extracted from the brain tissues using the RNeasy Lipid Tissue Mini Kit (Qiagen, catalog number: 74804). The quality and concentration of the RNA were determined using a NanoDrop spectrophotometer (DeNovix DS-11, USA). Reverse transcription was performed with the RT² First Strand Kit (Qiagen, USA, cat#330404). The resulting cDNA was mixed with RT² SYBR Green qPCR Master Mix (Qiagen, USA, cat#330503), then transferred to RT² Profiler Arrays using a modified method and amplified on a CFX Opus 384 Real-Time PCR System (Bio-Rad, USA). The differential expression of 84 key genes related to oxidative stress and AD was analyzed using the pathway-focused RT² Profiler Arrays (Qiagen, USA, catalog numbers: PAMM-065Z and PAMM-057Z). The geometric mean of five housekeeping genes (Actb, B2m, Gapdh, Gusb, and Hsp90ab1) was used to normalize the expression level of each gene transcript. The gene expression levels were calculated as 2−ΔΔCt values and analyzed using Qiagen's online data analysis platform (RT2 Profiler PCR Arrays and Assays Data Analysis software (https://geneglobe.qiagen.com/ca/analyze). All genes were normalized to the average of the reference genes listed above. The fold-change (FC) was calculated by dividing the normalized gene expression in the test sample (UCMS) by the normalized gene expression in the control sample.
Single gene qPCR analysis
RNA isolation and cDNA synthesis were performed using the same method as described above. The gene expression levels of hAPP, hPSEN1 and hMAPT (RT2 qPCR primer assays, Qiagen USA, cat#330001) were normalized against the geometric mean of two reference genes, B2m and Actb (RT2 qPCR primer assays, Qiagen USA, cat#330001). The gene expression levels are presented as 2−ΔΔCt values and analyzed using the Qiagen analysis platform as described above.
Statistics
Since no statistical differences were observed between male and female mice for any of the variables, data for both sexes were combined for statistical analyses. The maximal reactivity and remodeling of the MCA were analyzed using a multifactorial analysis of variance (ANOVA) that included experimental conditions (Control and UCMS) and an interaction term. A Tukey post-hoc test was conducted to determine differences between groups (multiple comparisons test) and study the main effect of stress and genotype, and their interaction. The effects of L-NAME and either Tempol or febuxostat on the maximal dilation of the MCA were examined using repeated-measures ANOVA, with a Tukey post-hoc test to determine differences between conditions. Data is presented as mean ± SD, unless otherwise stated. For qPCR and WB analysis data, statistical analyses, unless specified, were compared using a two-way ANOVA appropriate for evaluating the effects of genotype and stress or stress and time (and their interactions) between WT and 3xTg-AD mice. We also used a Tukey post-hoc test to examine for significant group interactions (multiple comparisons). To examine the effect of stress within each genotype for qPCR analysis, planned comparisons were performed for WT and 3xTg-AD mice using a two-tailed parametric unpaired Student's t-test for our normally distributed data sets. We chose this test because it is recommended for samples with unequal sizes across groups, and it is more robust in avoiding Type I errors, which are common in standard t-tests. Additionally, we conducted an F test to assess the variances, supporting the use of Welch's correction. All qPCR analyses were normalized using respective experimental controls and endogenous controls for both WT and 3xTg-AD mice. We used Grubb's outlier test to identify any outliers in the data sets, applying a critical z-score threshold of Q = 1%. Outliers were excluded from further analysis. All statistical analyses conducted are detailed in the study. Data analysis and graphing were performed using GraphPad Prism version 10.4 (GraphPad Software, Inc.), with a significance threshold set at p ≤ 0.05. Comprehensive statistical results, including unpaired t-tests and two-way ANOVA, are presented in Tables 1–4 and Supplemental Table 1), and their effects and interactions are discussed in Figures 1–7 and Supplemental Figures 1 and 2.
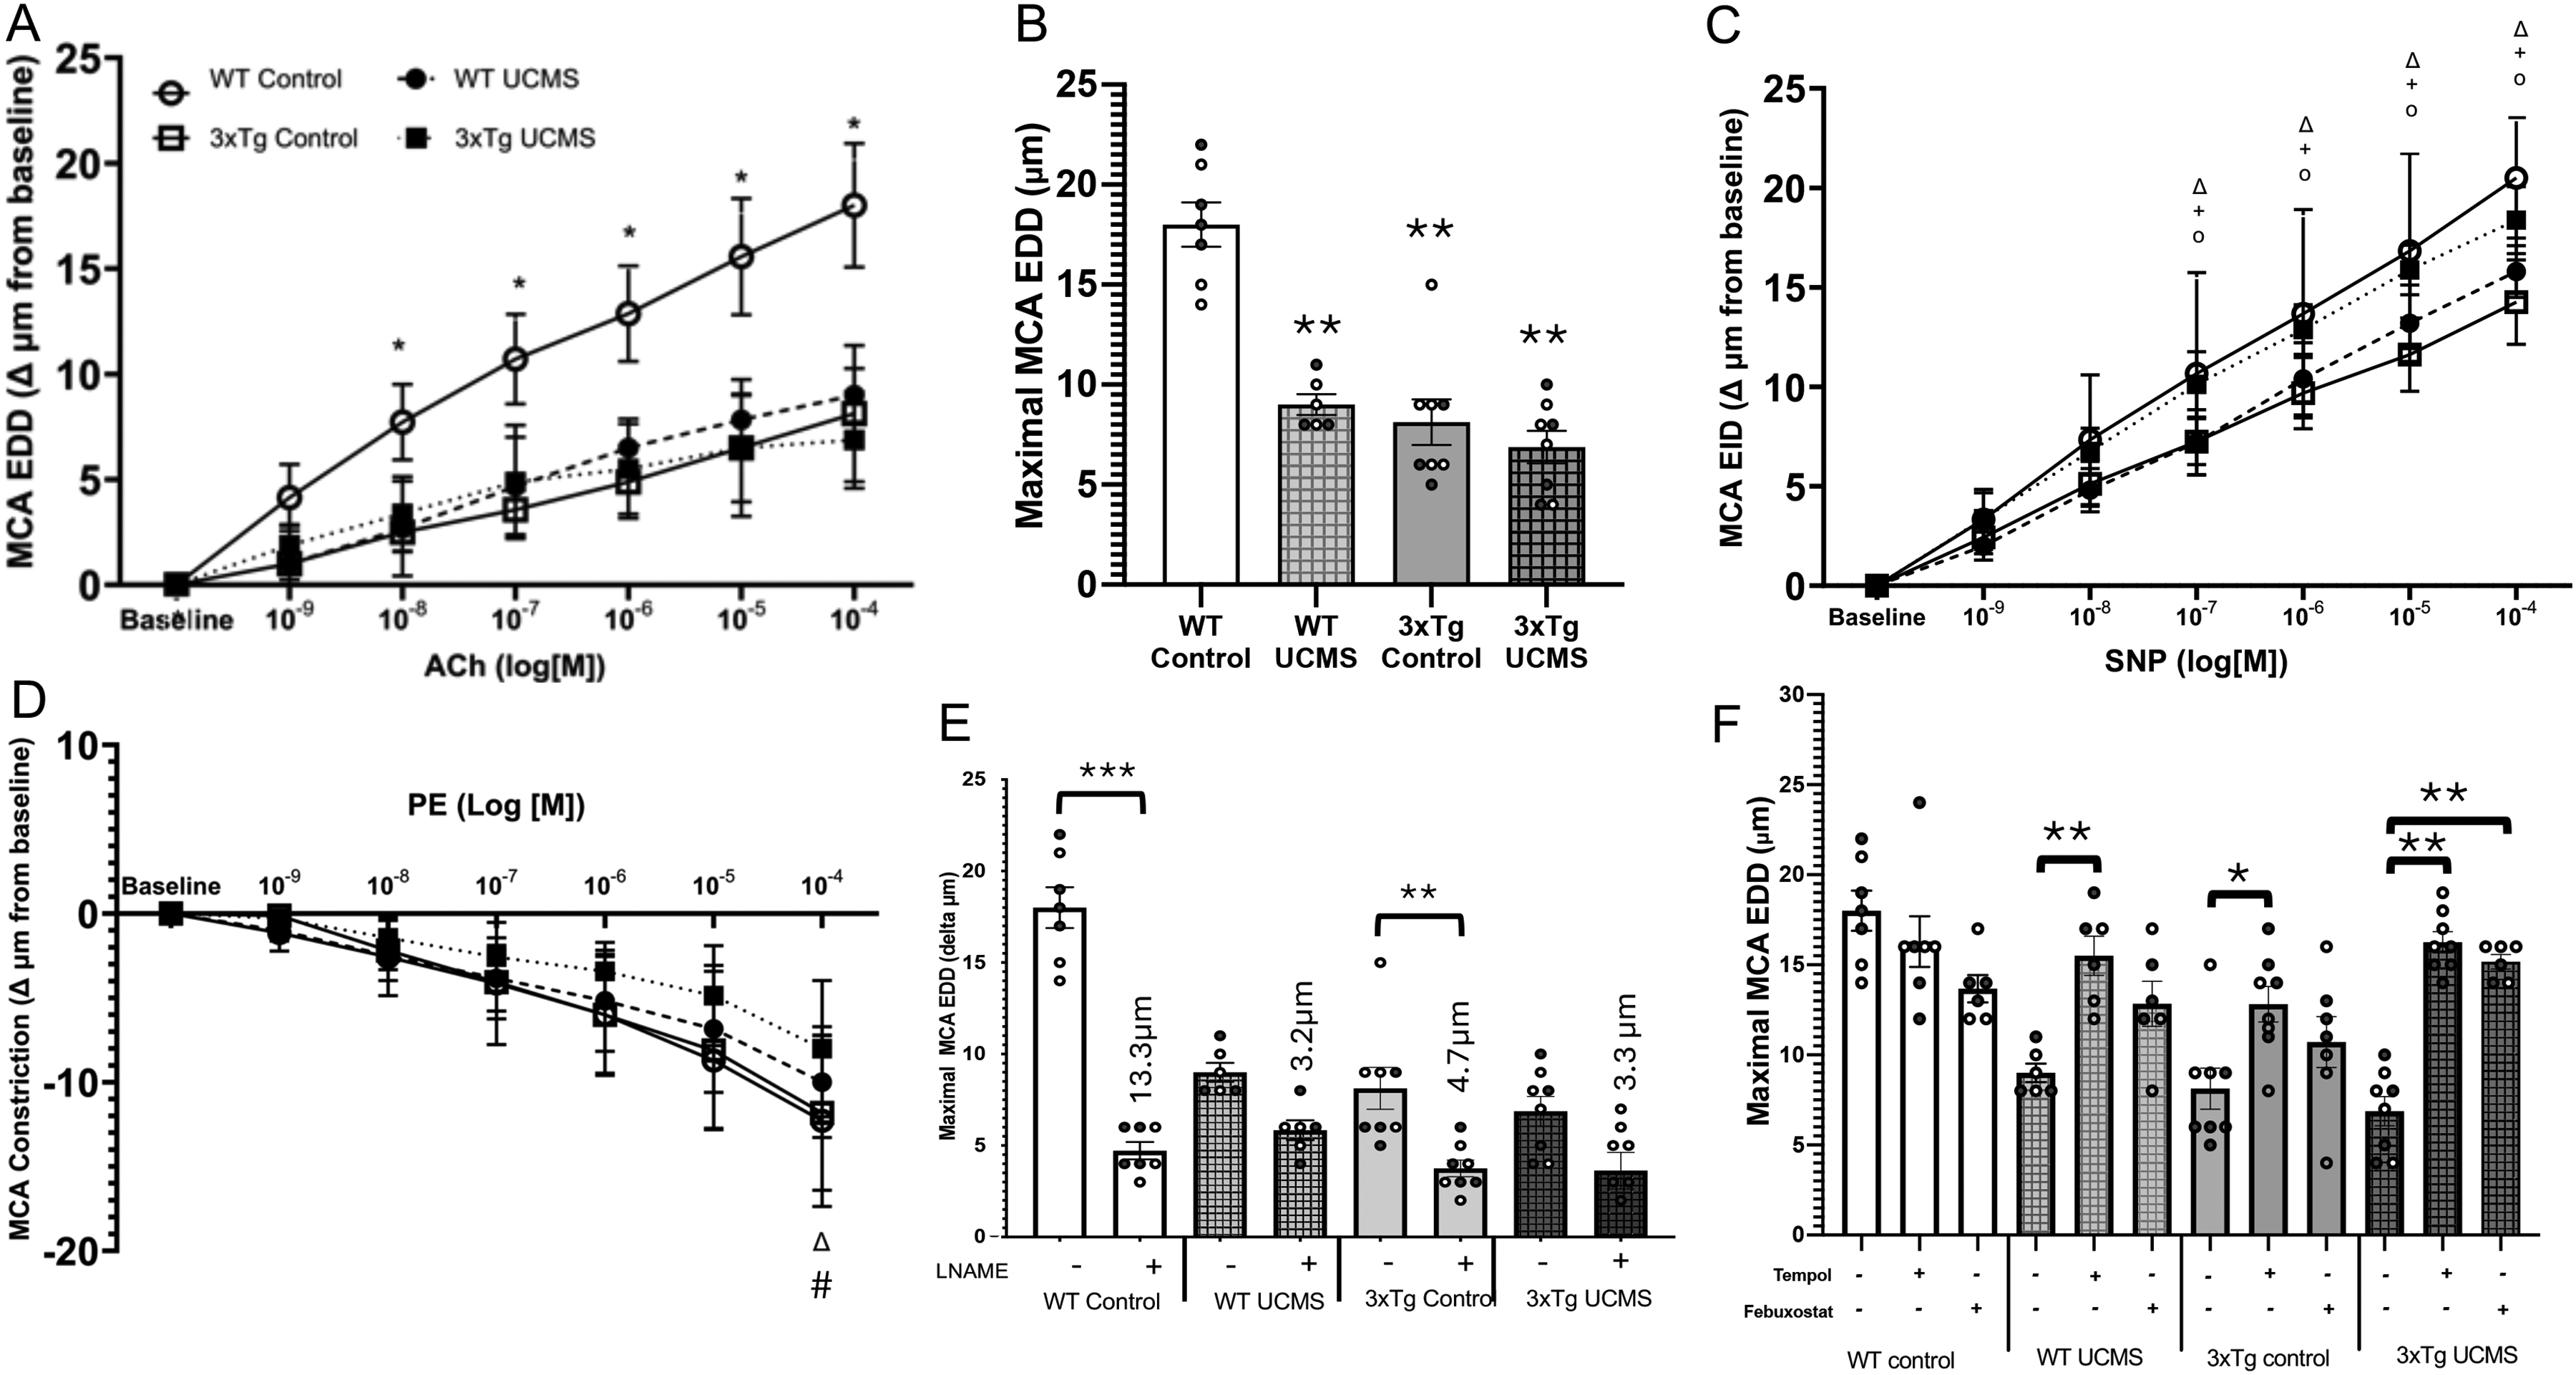
Middle cerebral artery reactivity in WT and 3xTg-AD mice at 6 months of age. (A) Middle cerebral artery (MCA) dose-response to the endothelial-dependent dilator acetylcholine (ACh), (B) MCA Maximal endothelial-dependent dilation (EDD) to ACh. (C) Dose responses of the MCA to the endothelial-independent dilator (EID) sodium nitroprusside (SNP). (D) Vasoconstrictor response to Phenylephrine (PE). (E) MCA maximal NO-dependent dilation response to L-NAME. (F) Maximal dose responses to the endothelial-dependent dilator acetylcholine (ACh), during acute (30 min) incubation with Tempol and febuxostat. Data represented WT and 3xTg-AD control, and UCMS mice at 6 months of age. Mean ± SD. n = 6–8/group. Blue dots = male data; white dots = female data. (A) *p ≤ 0.05 versus WT UCMS, 3xTg-AD control, and 3xTg-AD UCMS. (B) **p ≤ 0.01 versus WT Control; (C) WT con versus WT UCMS (op ≤ 0.05) and 3xTg-AD control (+p < 0.05), and △p < 0.05 3xTg-AD control versus 3xTg-AD UCMS. (D) #p < 0.05 WT con versus 3xTg-AD UCMS, △p < 0.05 3xTg-AD control versus 3xTg-AD UCMS. (E, F) **p ≤ 0.01 and ***p ≤ 0.001 within-group comparisons. Data were compared using Two-way ANOVA/repeated measures ANOVA, with the main effect of genotype and stress (and their interaction) with a Tukey post-hoc test.

Middle cerebral artery reactivity in WT and 3xTg-AD mice at 9 months of age. (A) Middle cerebral artery (MCA) dose-response to the endothelial-dependent dilator acetylcholine (Ach), (B) MCA Maximal endothelial-dependent dilation (EDD) to ACh, (C) Dose responses of the MCA to the endothelial-independent dilator (EID) sodium nitroprusside (SNP). (D) the vasoconstrictor response to Phenylephrine (PE). (E) MCA maximal NO-dependent dilation response to L-NAME. (F) Maximal dose responses to the endothelial-dependent dilator (ACh), during acute (30 min) incubation with Tempol and febuxostat. Data represented control and UCMS mice at 9 months of age. *p ≤ 0.05; mean ± SD. n = 6–9/group. Blue dots = male data; white dots = female data. (A) WT con versus WT UCMS (op ≤ 0.05) and 3xTg-AD control (+p < 0.05), △p < 0.05 3xTg-AD control versus 3xTg-AD UCMS, p < 0.05 WT con versus 3xTg-AD UCMS. (B) **p ≤ 0.01 versus WT Control. ^p < 0.05 versus 3xTg-AD control; (D) WT con versus WT UCMS (op ≤ 0.05) and 3xTg-AD control (+p < 0.05), and △p < 0.05 3xTg-AD control versus 3xTg-AD UCMS. (E, F) **p ≤ 0.01 and ***p ≤ 0.001 within-group comparisons. Data were compared using Two-way ANOVA/repeated measures ANOVA, with the main effect of genotype and stress (and their interaction) with a Tukey post-hoc test.
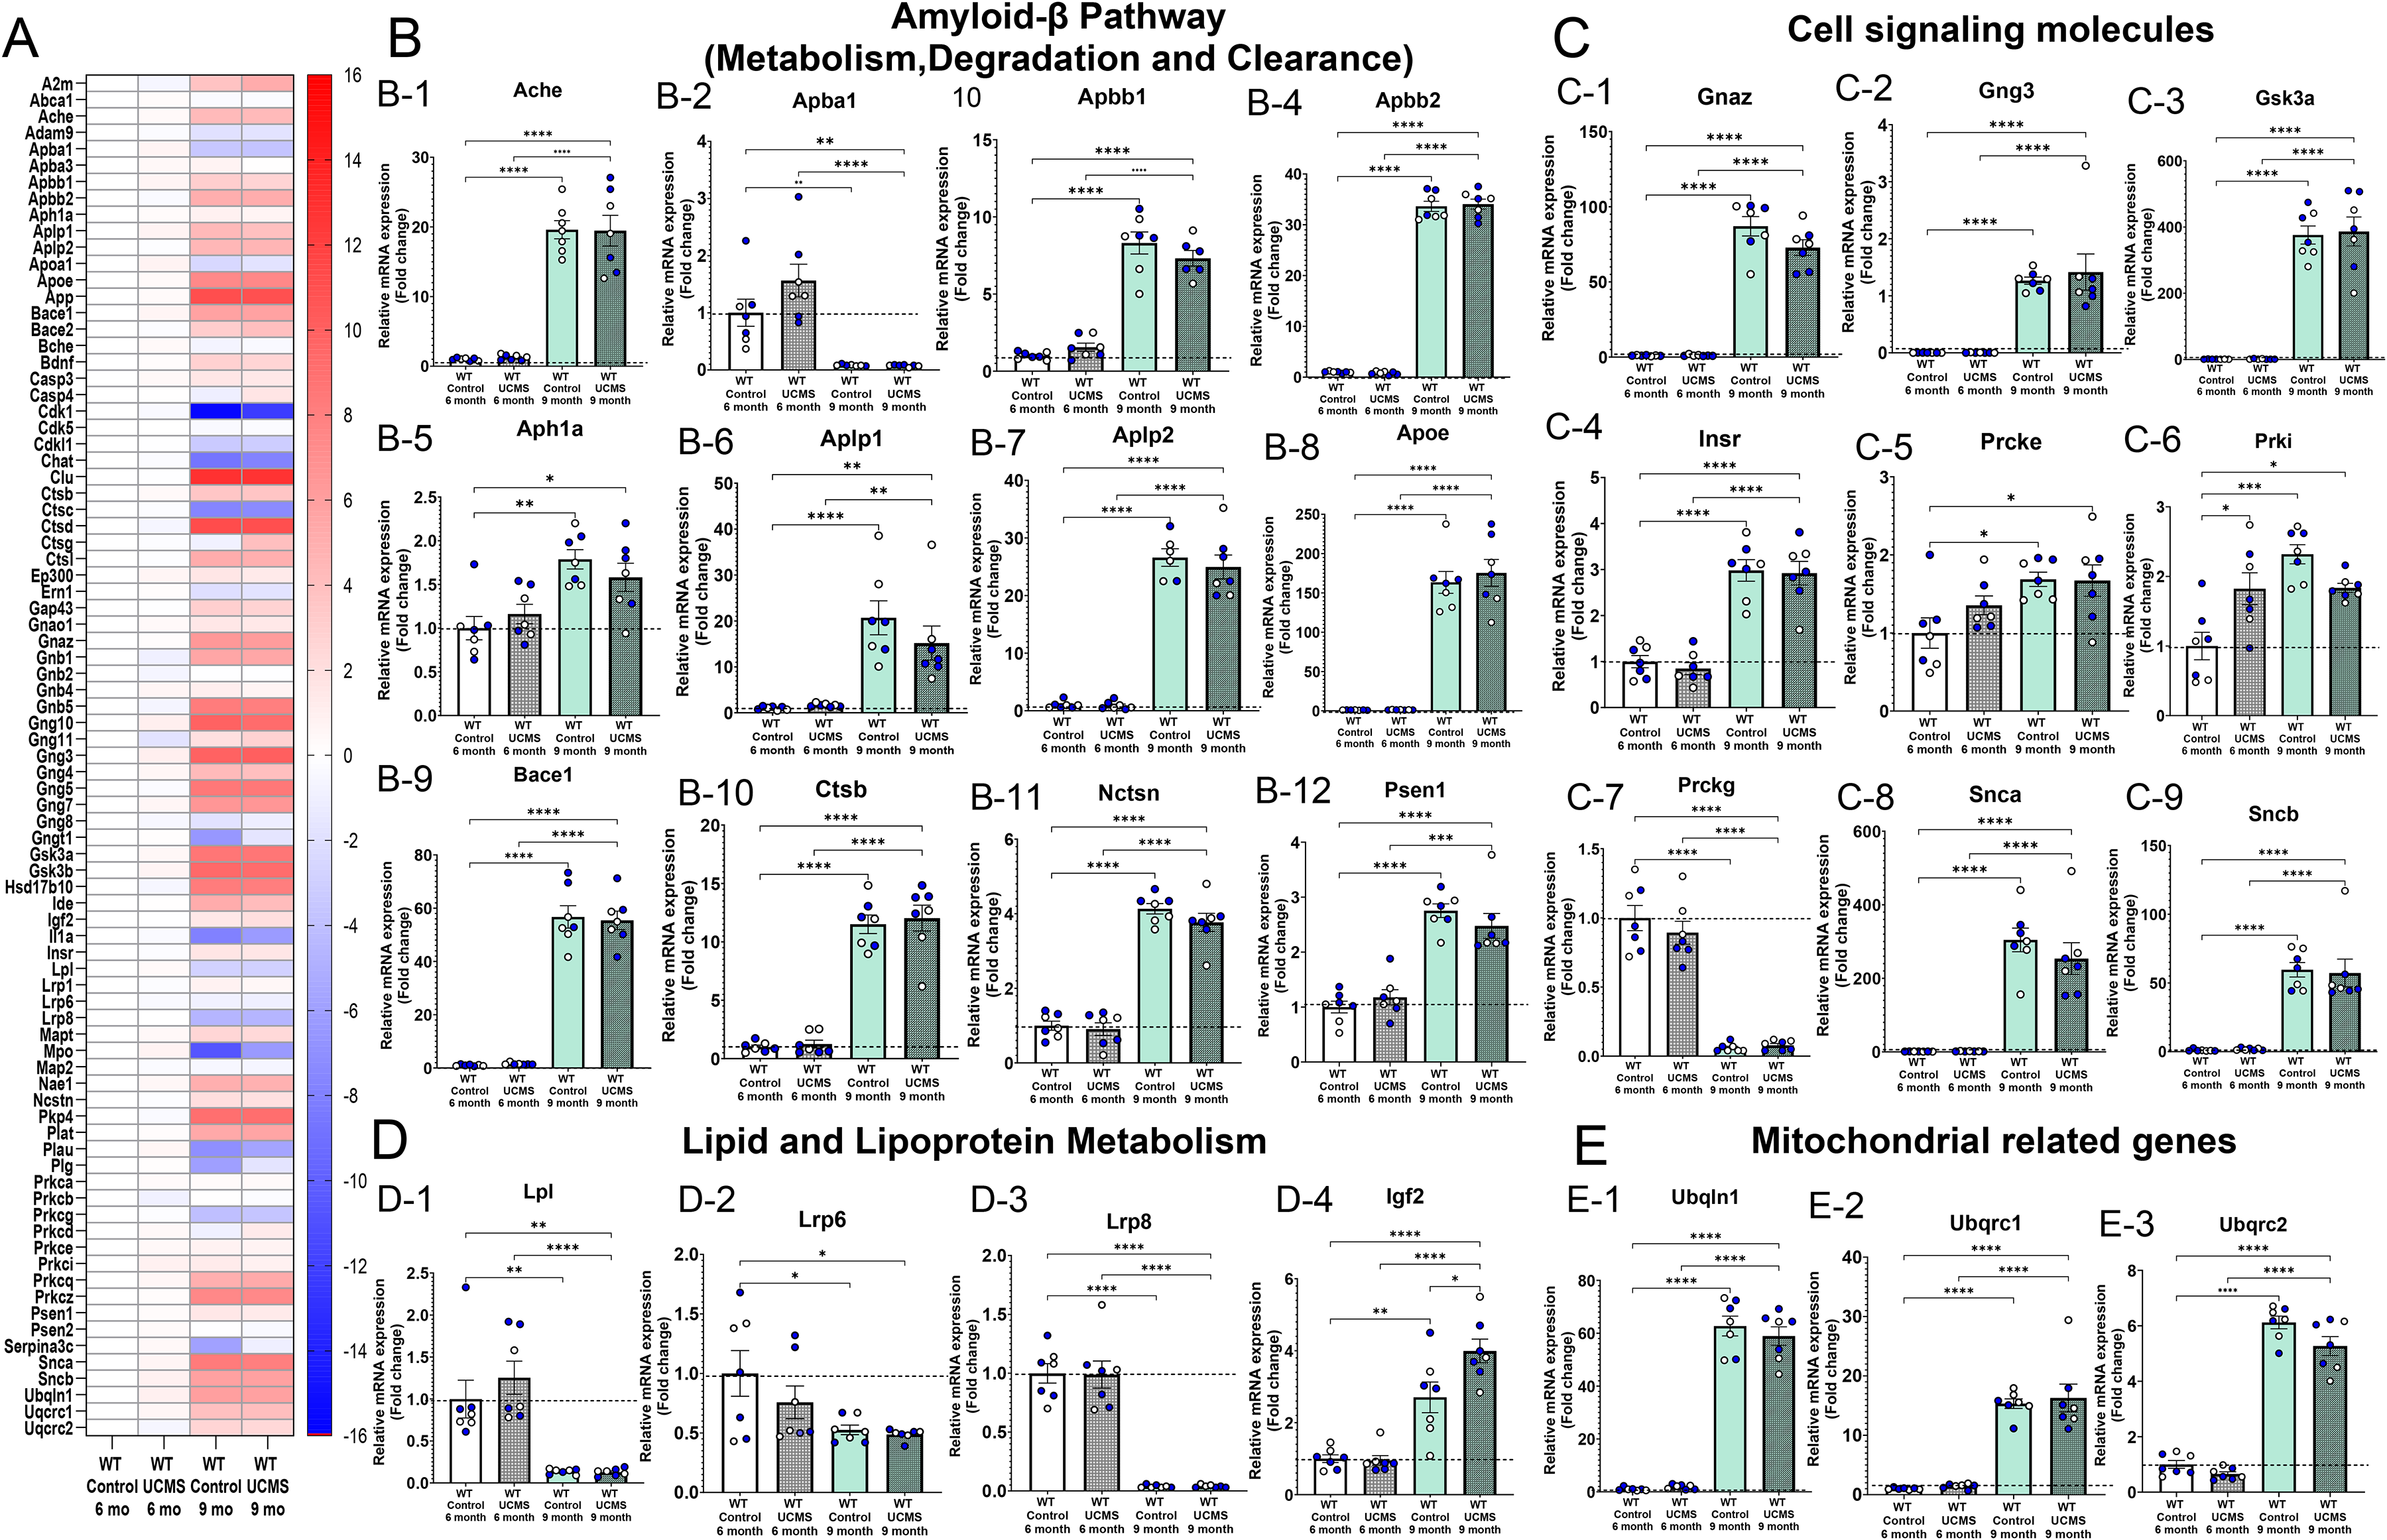
Age-related gene comparison analysis of AD pathway genes in WT mice at 6 and 9 months of age. (A) Heat map of all 84 AD pathway genes (plotted as log2FC). (B) Amyloid-β Pathway genes. (C) Cell Signaling molecules. (D) Lipid and lipoprotein metabolism genes. (E) Mitochondrial-related genes. All data is normalized to the 6-month WT group. Data represented WT control and WT UCMS mice at 6 and 9 months of age. Blue dots = male data; white dots = female data. *p ≤ 0.05, **p ≤ 0.01, ***p ≤ 0.001, ****p ≤ 0.0001; mean ± SEM. n = 6–9/group. Data were compared using Two-way ANOVA, with the main effect of stress and time (and their interaction) with a Tukey post-hoc test. Acetylcholinesterase (Ache), amyloid beta precursor protein binding family A member 1 (Apba1), amyloid beta A4 precursor protein-binding family B member 1 (Apbb1) and 2 (Apbb2), aph-1 homolog A gamma-secretase subunit (Aph1a), amyloid precursor like protein 1 (Aplp1) and 2 (Aplp2), apolipoprotein E (Apoe), beta-secretase 1 (Bace1), cathepsin B (Ctsb), nicastrin (Nctsn) presenilin-1 (Psen1), G protein subunit alpha (Gnaz) and gamma 4 (Gng4), glycogen synthase kinase 3 alp (Gsk3a), insulin receptor (Insr), protein kinase C epsilon (Prcke), protein kinase C Iota (Prkci) and theta (Prkcq), alpha (Snca) and beta (Sncb) synuclein, low density lipoprotein receptor-related protein 1 (Lrp1), 6, (Lrp6), and 8 (Lrp8), ubiquilin 1 (Ubqln1), ubiquinol-cytochrome C reductase core protein 1 (Uqcrc1) and 2 (Uqcrc2).
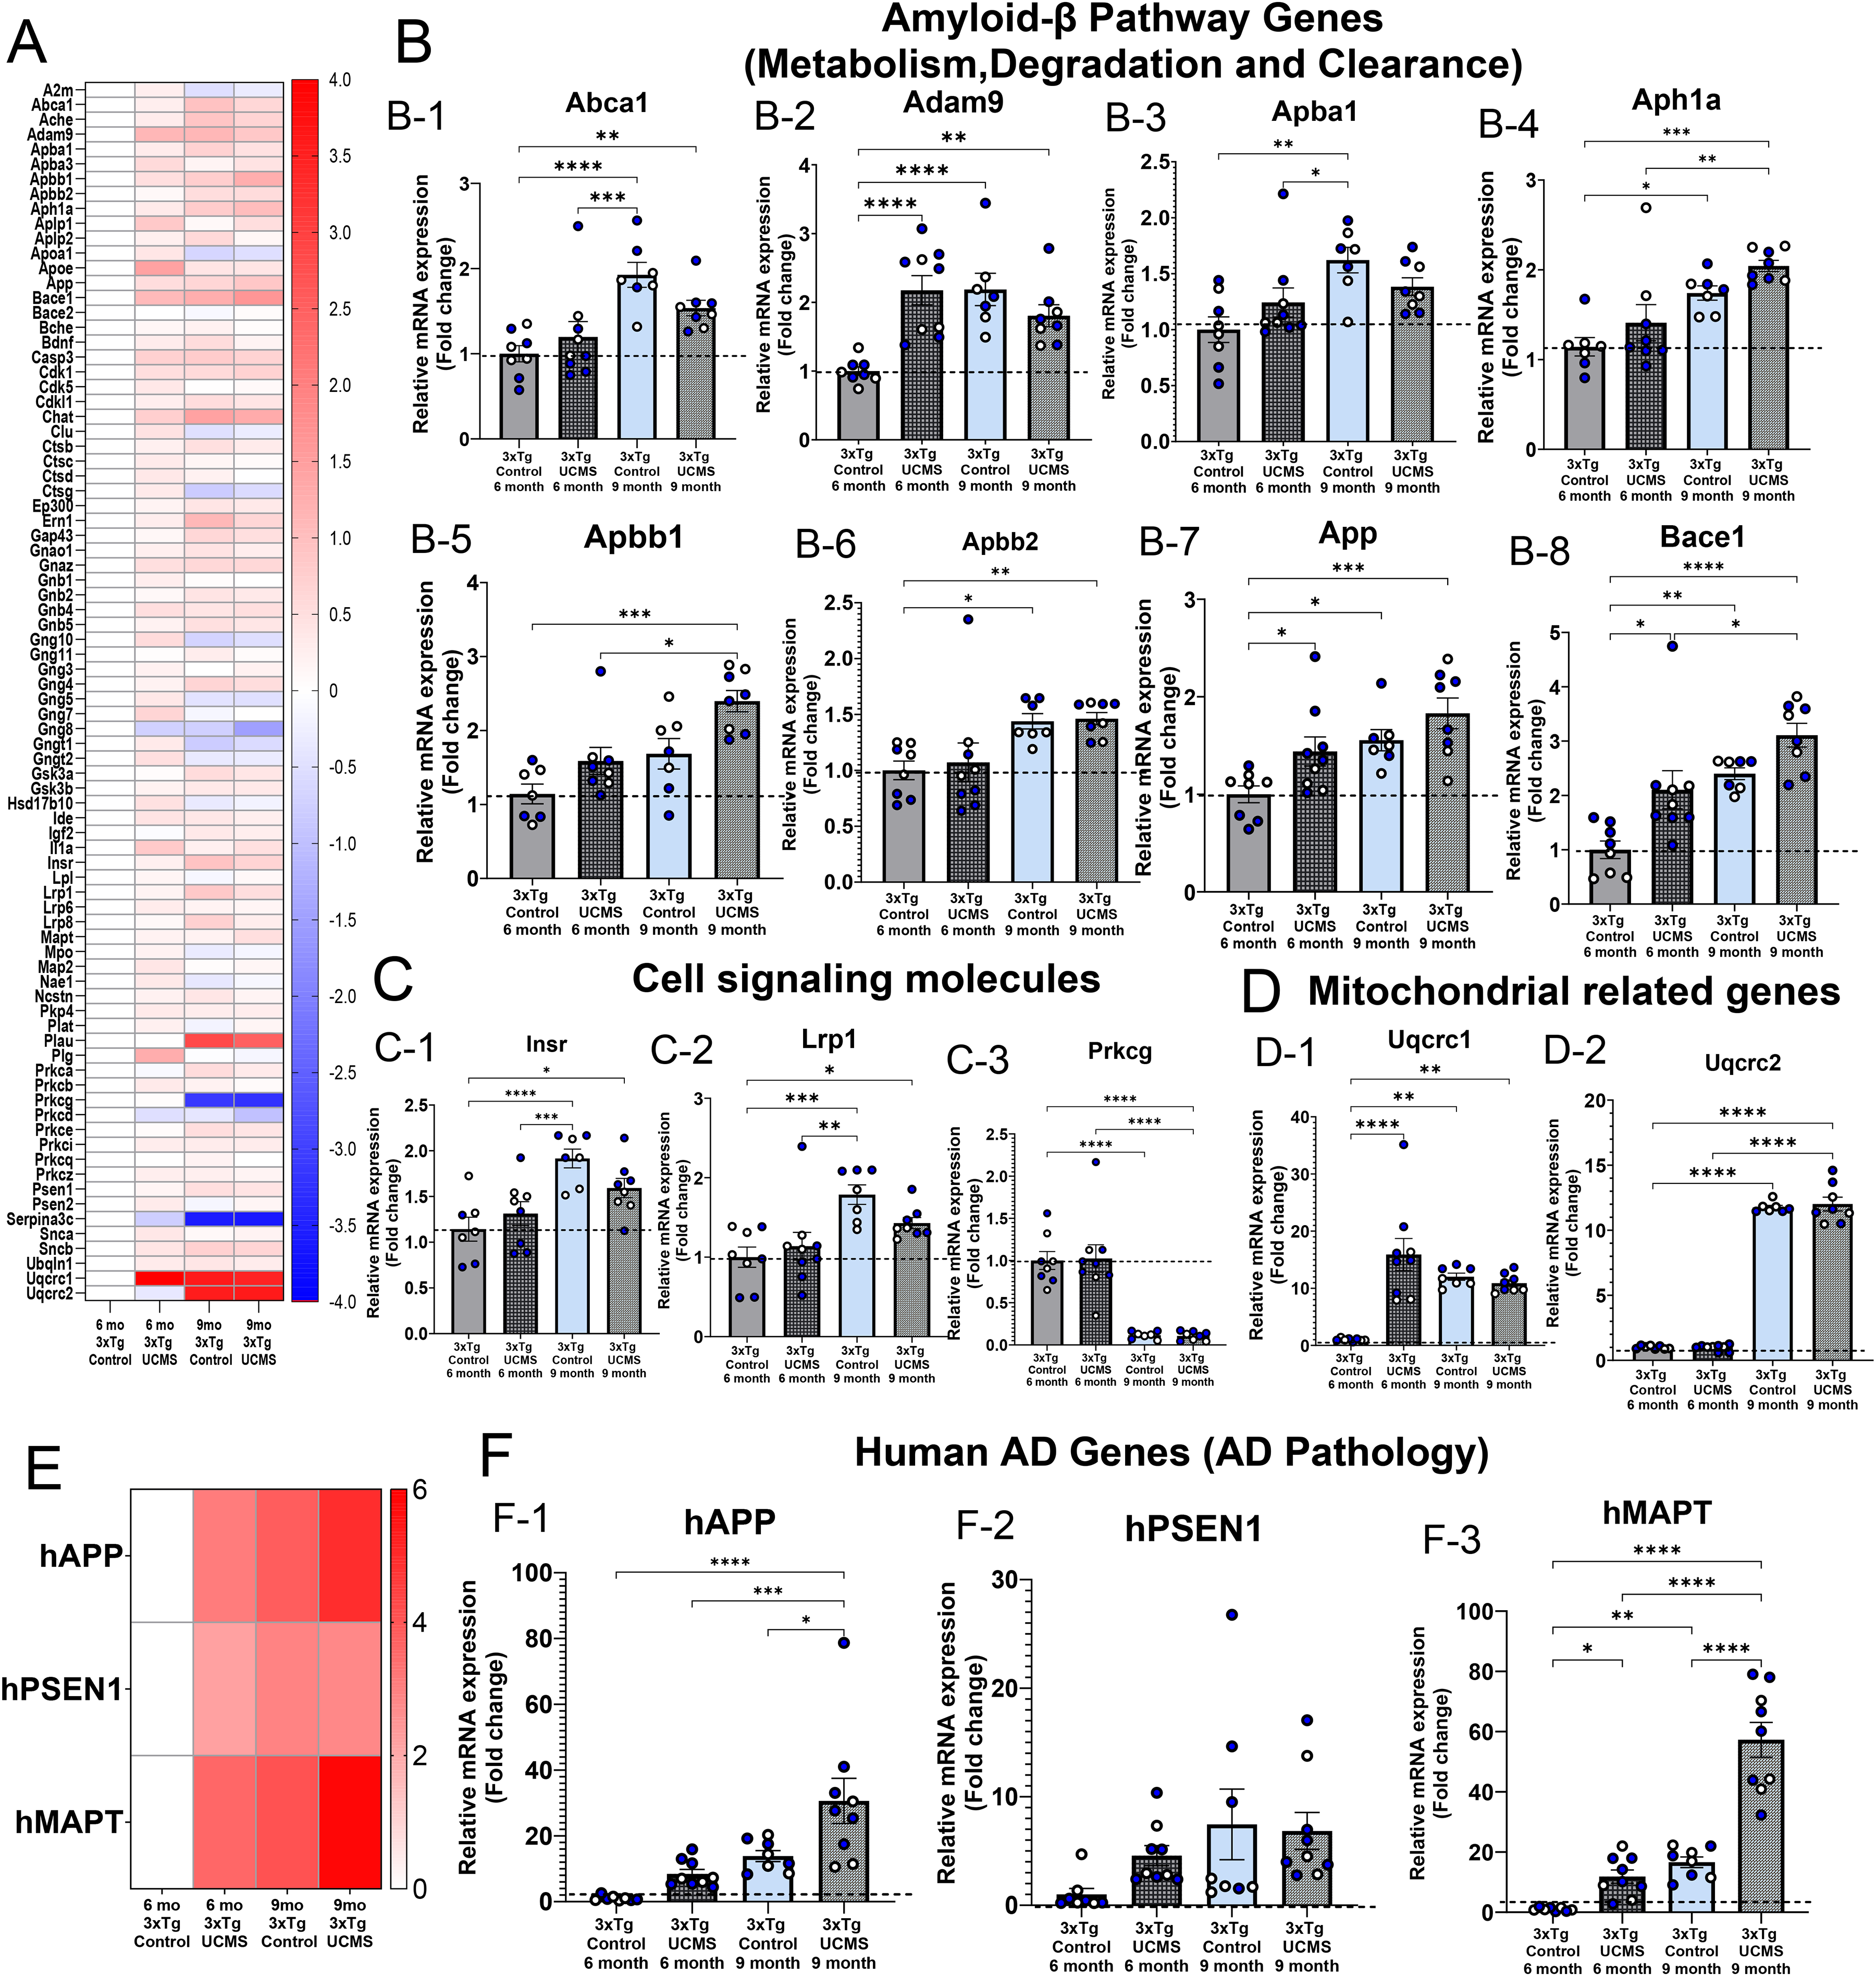
Age-related gene comparison analysis of AD pathway genes in 3xTg-AD mice at 6 and 9 months of age. (A) Heat map of all 84 AD pathway (murine) genes (plotted as log2FC). (B) Amyloid-β pathway genes. (C) Cell signaling molecules. (D) Mitochondrial-related genes. All data are normalized to the 6-month 3xTg-AD control group. Data represented 3xTg-AD control and 3xTg-AD UCMS mice at 6 and 9 months of age. Blue dots = male data; white dots = female data. *p ≤ 0.05, **p ≤ 0.01, ***p ≤ 0.001, ****p ≤ 0.0001; mean ± SEM. n = 6–9/group. (E) Heat map of 3 mutant human genes (human amyloid precursor protein (hAPP), human Presenilin-1 (hPSEN1), and human microtubule-associated protein tau (hMAPT)) plotted as log2FC. (F) hAPP, hPSEN, and hMAPT gene expression using custom qPCR at 6 and 9 months of age in 3xTg-AD mice. Data were compared using Two-way ANOVA, with the main effect of stress and time (and their interaction) with a Tukey post-hoc test. ATP-binding cassette sub-family A (Abca1), a disintegrin and metallopeptidase domain 9 (Adam9), amyloid beta precursor protein binding family A member 1 (Apba1), gamma-secretase subunit (Aph1a), amyloid beta A4 precursor protein-binding family B member 1 (Apbb1) and 2 (Apbb2), amyloid beta (A4) precursor protein (App), beta-secretase 1 (Bace1), gamma-secretase subunit (Aph1a), amyloid beta (A4) precursor protein binding (Apba1), insulin receptor (Insr), low density lipoprotein receptor-related protein 1 (Lrp1), Ubiquinol-Cytochrome C Reductase Core Protein 1 (Uqcrc1) and 2 (Uqcrc2).
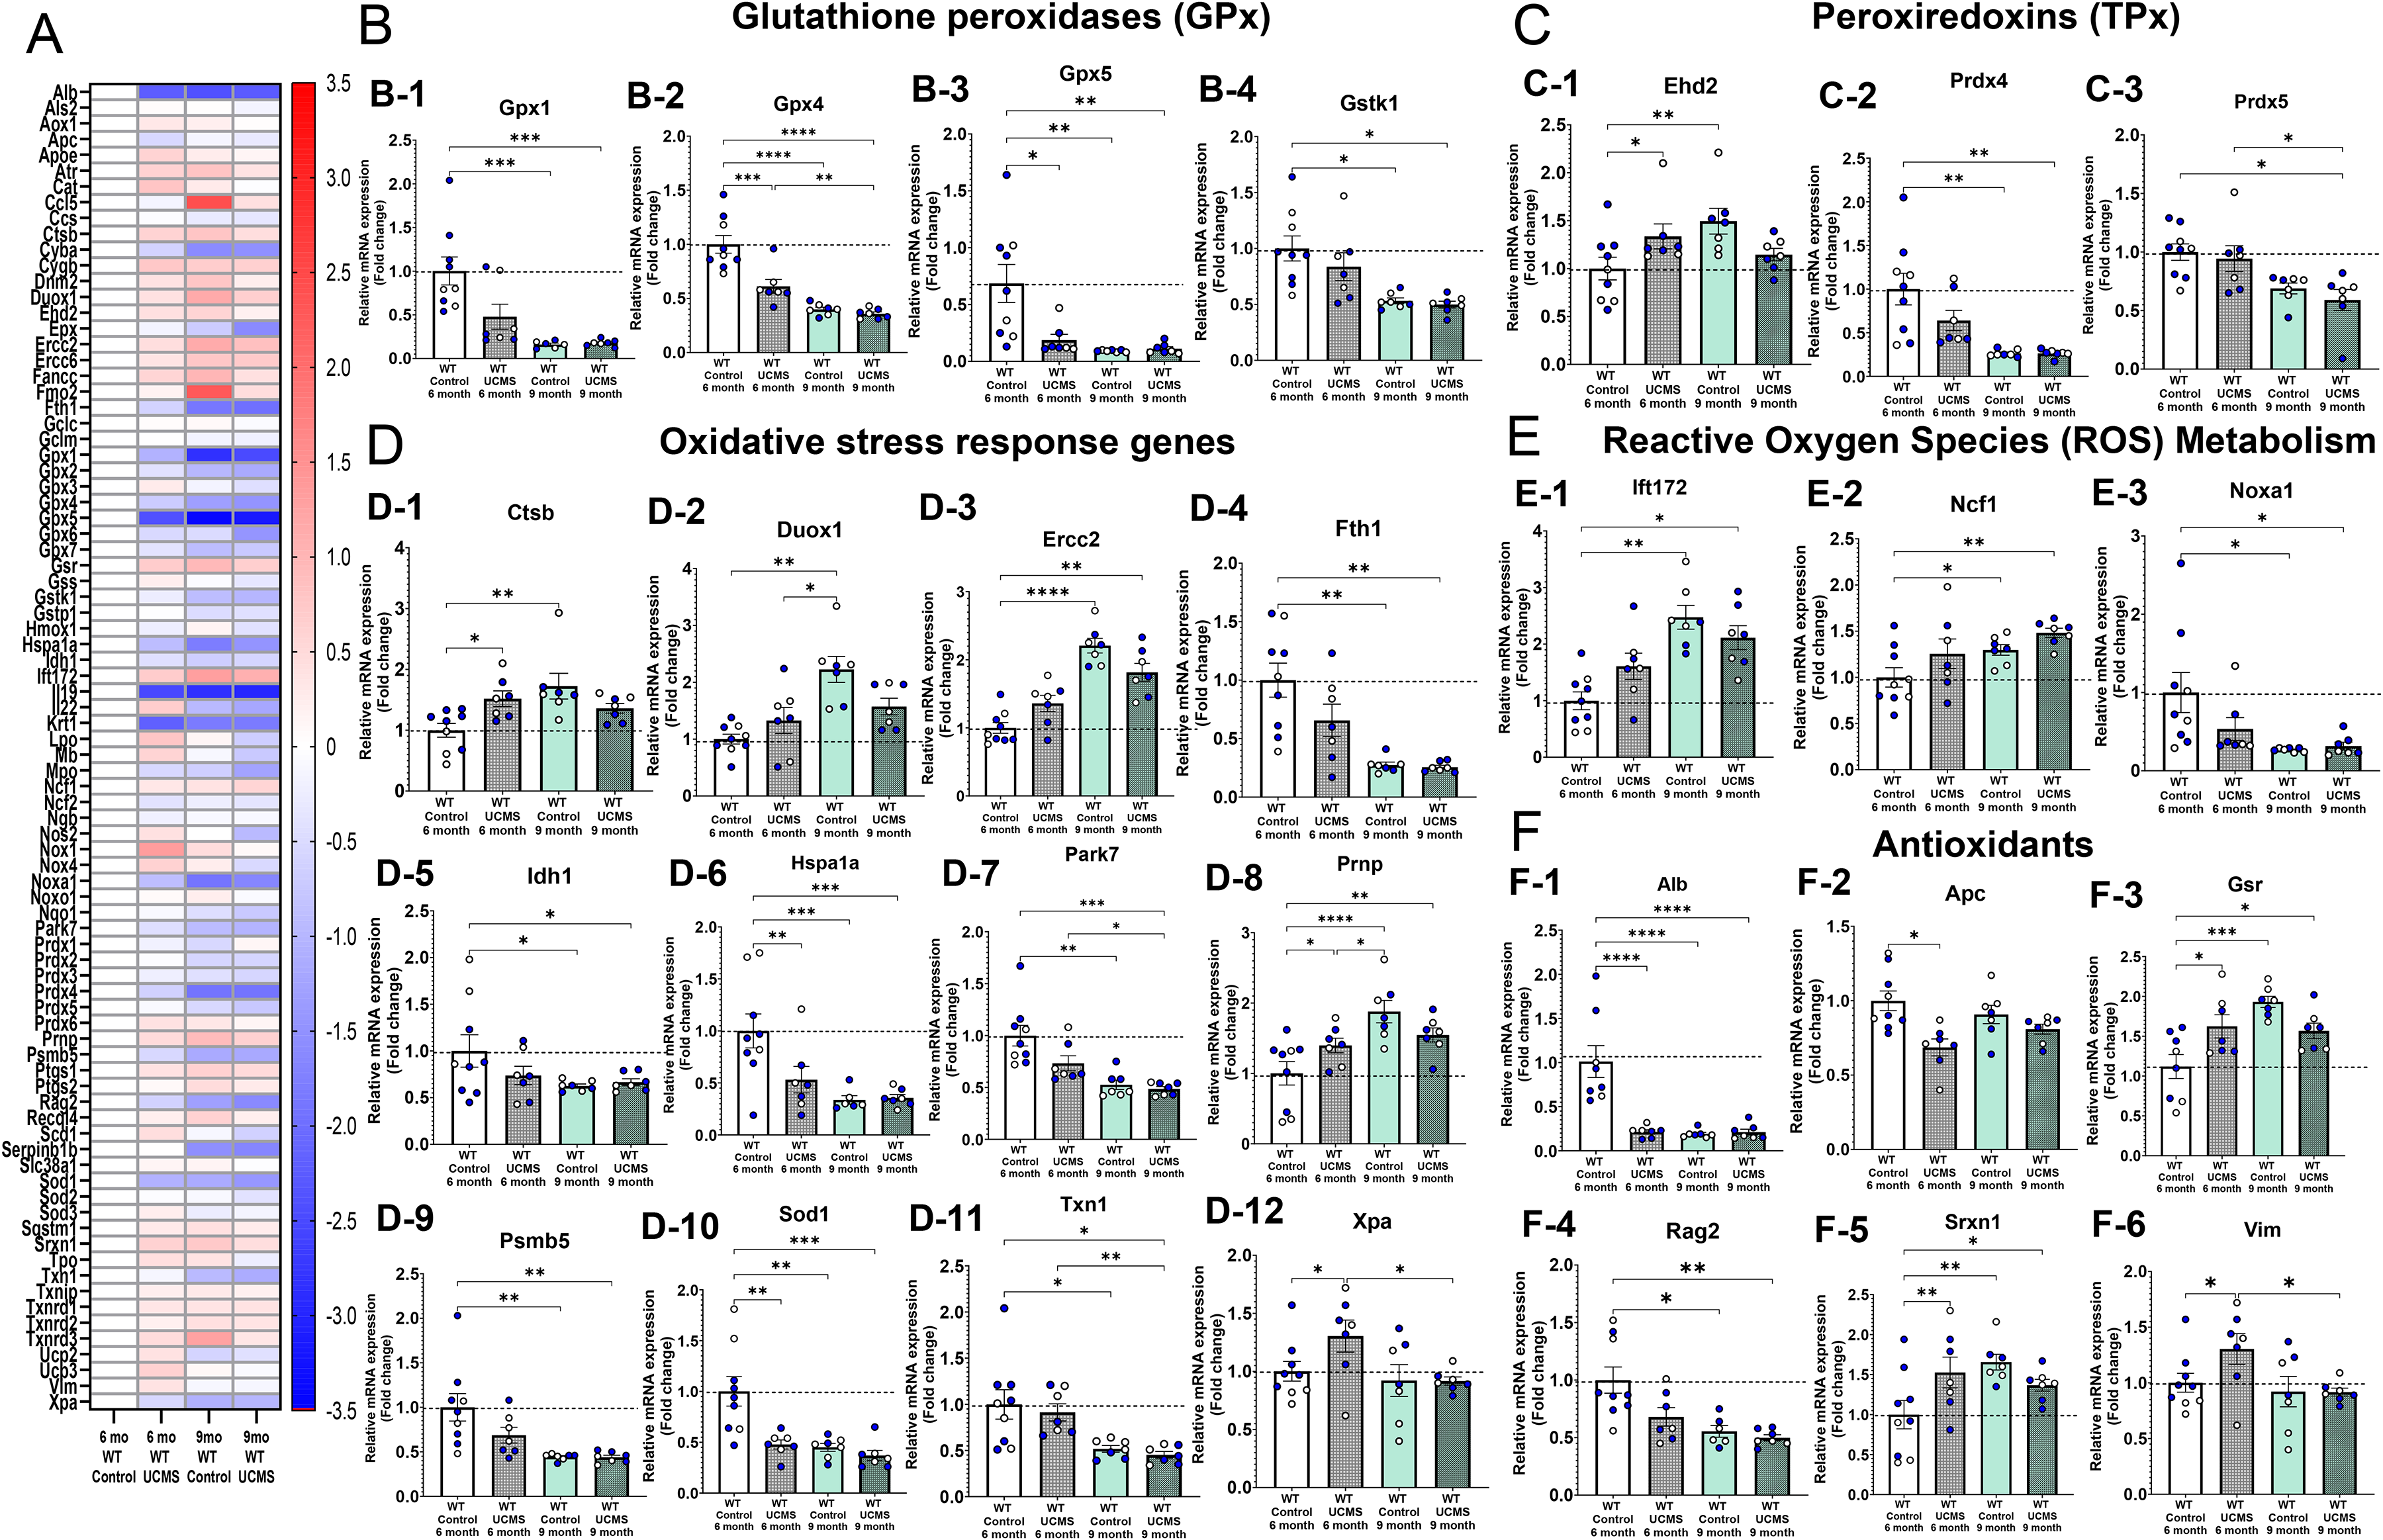
Age-related gene comparison analysis of oxidative stress pathway genes in WT mice at 6 and 9 months of age. (A) Heat map of all 84 oxidative stress pathway genes (plotted as log2FC), (B) glutathione peroxidases (GPx), 5C) peroxiredoxins (TPx), (D) oxidative stress response genes, (E) reactive oxygen species (ROS) metabolism genes, (F) antioxidants. All data are normalized to the 6-month WT control group. Data represented WT control and WT UCMS mice at 6 and 9 months of age. *p ≤ 0.05, **p ≤ 0.01, ***p ≤ 0.001, ****p ≤ 0.0001; mean ± SEM. n = 6–9/group. Blue dots = male data; white dots = female data. Data were compared using Two-way ANOVA, with the main effect of stress and time (and their interaction) with a Tukey post-hoc test. Glutathione peroxidase 1 (Gpx1), 4 (Gpx4), and 5 (Gpx5), glutathione S-transferase kappa 1 (Gstk1), cathepsin B (Ctsb), dual oxidase 1 (Duox1), excision repair cross-complementing rodent repair deficiency, complementation group 2 (Ercc2), prion protein (Prnp), ferritin heavy polypeptide 1 (Fth1), heat shock protein 1A (Hspa1a), Parkinson disease (autosomal recessive, early onset) 7 (Park7), proteasome subunit beta type 5 (Psmb5), thioredoxin 1 (Txn1), xeroderma pigmentosum complementation group A (Xpa), superoxide dismutase 1 (Sod1), peroxiredoxin 4 (Prdx4) and 5 (Prdx5), intraflagellar transport 172 (Ift172), glutathione reductase (Gsr), sulfiredoxin 1 homolog (Srxn1), albumin (Alb), recombination activating gene 2 (Rag2), and vimentin (Vim).
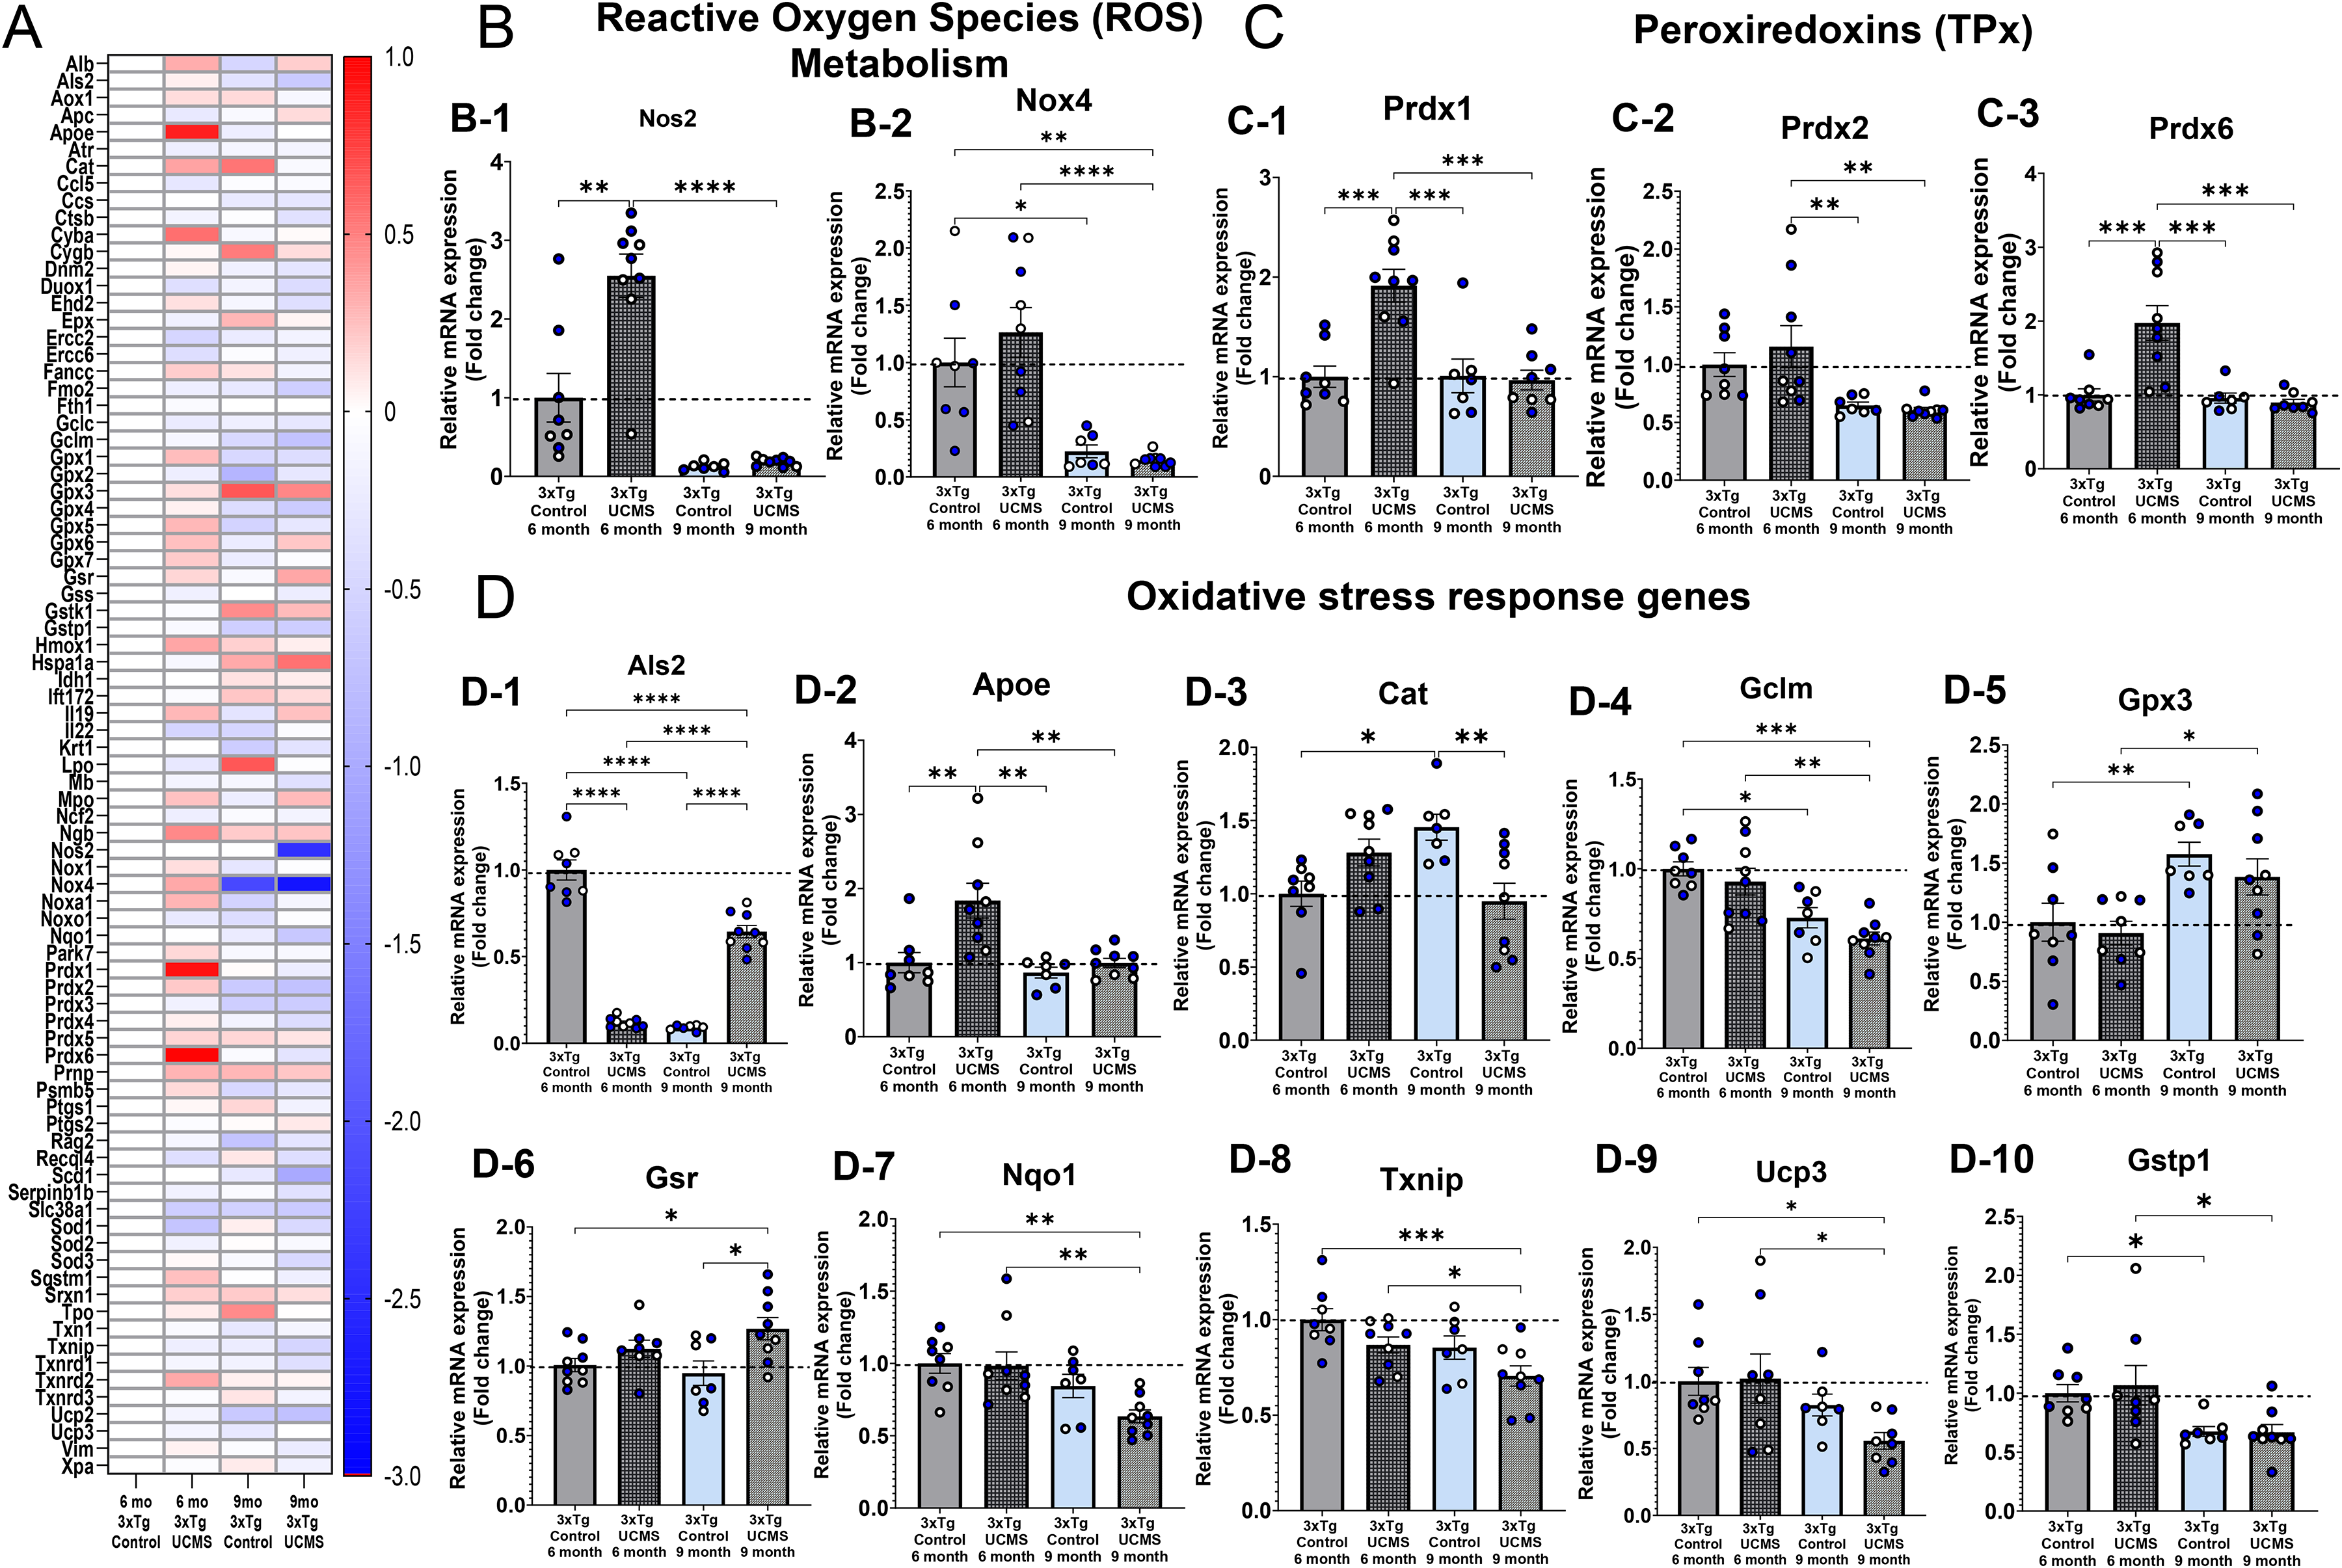
Age-related gene comparison analysis of oxidative stress pathway genes in 3xTg-AD mice at 6 and 9 months of age. (A) Heat map of all 84 oxidative stress pathway genes (plotted as log2FC), (B) reactive oxygen species metabolism genes, (C) peroxiredoxins (TPx), (D) oxidative stress response genes. All data are normalized to the 6-month 3xTg-AD control group. Data represented 3xTg-AD control and 3xTg-AD UCMS mice at 6 and 9 months of age. *p ≤ 0.05, **p ≤ 0.01, ***p ≤ 0.001, ****p ≤ 0.0001; mean ± SEM. n = 6–9/group. Blue dots = male data; white dots = female data. Data were compared using Two-way ANOVA, with the main effect of stress and time (and their interaction) with a Tukey post-hoc test. Nitric oxide synthase 2 (Nos2), NADPH oxidase 2 (Nox2) and 4 (Nox4), peroxiredoxin 1 (Prdx1), 2 (Prdx2), and 6 (Prdx6), catalase (Cat), glutathione peroxidase 3 (Gpx3), glutathione reductase (Gsr), glutamate-cysteine ligase modifier subunit (Gclm), glutathione S-transferase (Gstp1), NAD(P)H dehydrogenase, quinone 1 (Nqo1), thioredoxin interacting protein (Txnip), and uncoupling protein 3 (Ucp3).
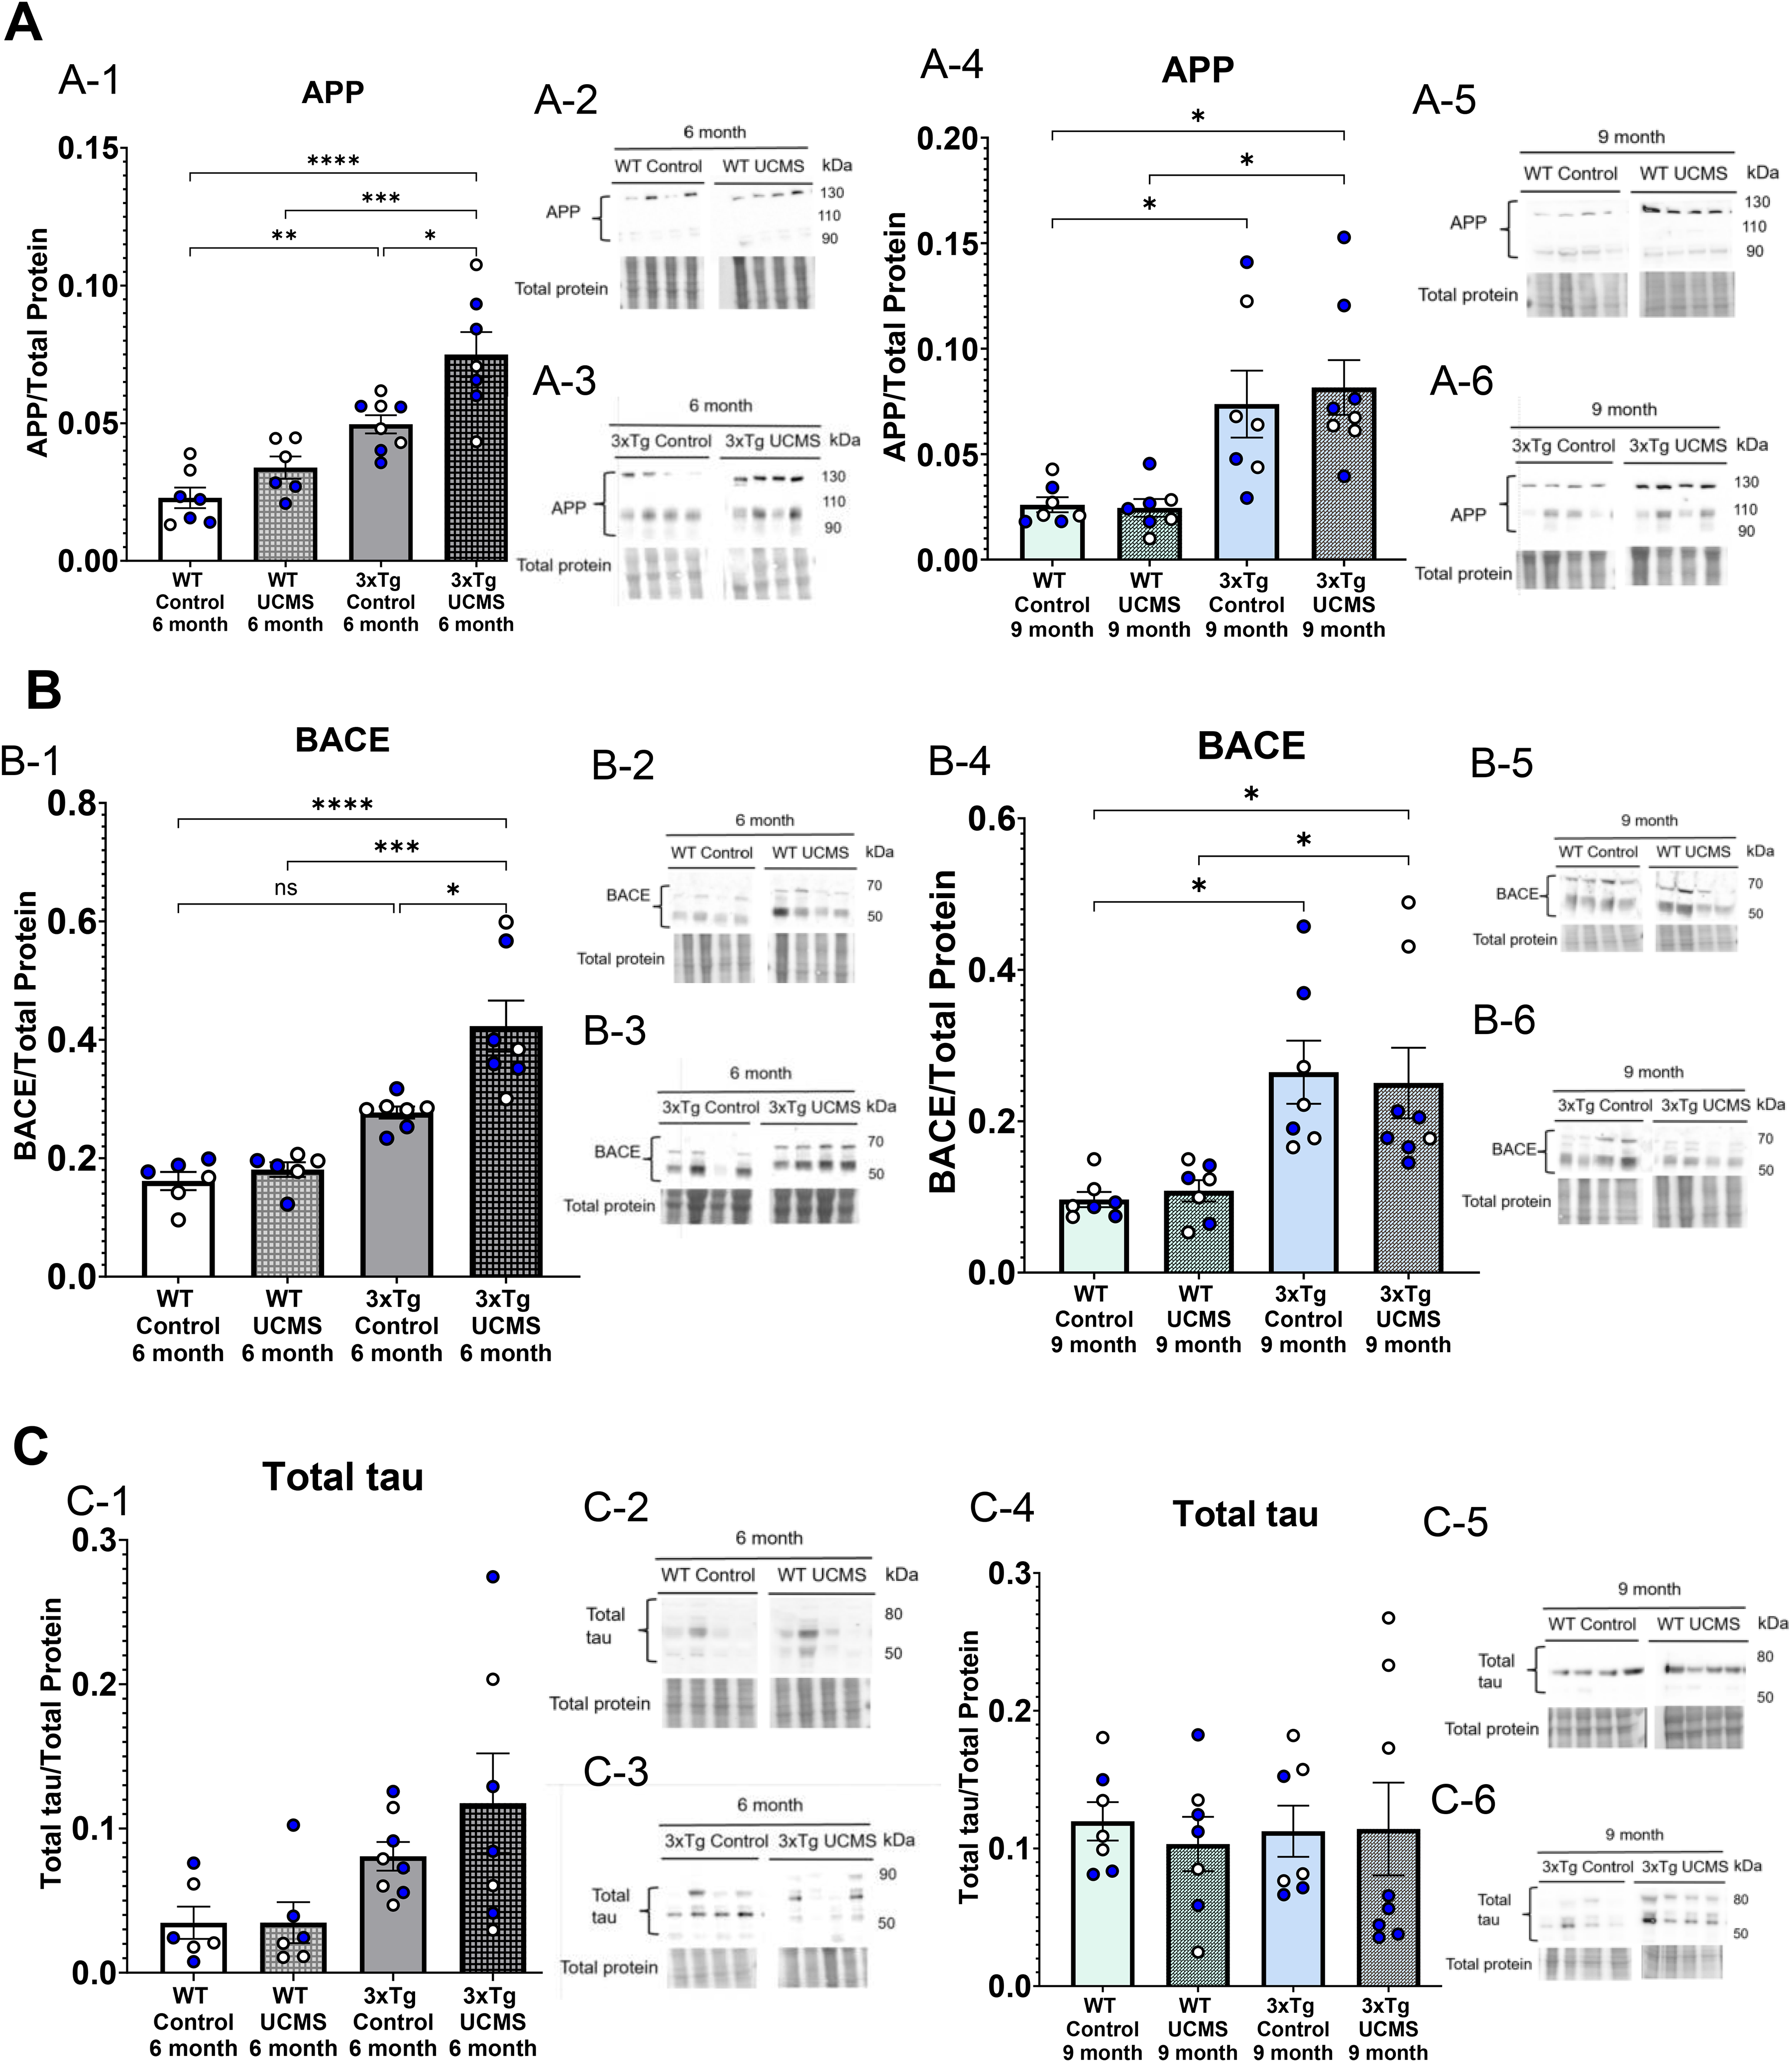
Age-dependent protein expression changes in AD pathology. (A) APP protein expression at 6 months (A-1) and 9 months (A-4) of age in WT and 3xTg-AD mice. Representative images for WB analysis for APP at 6 months of age for WT mice (A-2) and 3xTg mice (A-3), and APP at 9 months of age for WT mice (A-5) and 3xTg mice (A-6). (B) BACE protein expression at 6 months (B-1) and 9 months (B-4) of age in WT and 3xTg-AD mice. Representative images for WB analysis for BACE at 6 months of age for WT mice (B-2) and 3xTg mice (B-3), and BACE at 9 months of age for WT mice (B-5) and 3xTg mice (B-6). (C) Tau protein expression at 6 months (C-1) and 9 months (C-4) of age in WT and 3xTg-AD mice. Representative images for WB analysis for Total tau at 6 months of age for WT mice (C-2) and 3xTg mice (C-3), and Total tau at 9 months of age for WT mice (C-5) and 3xTg mice (C-6). Blue dots = male data; white dots = female data. *p ≤ 0.05; mean ± SEM. n = 6–9/group. Data were compared using Two-way ANOVA, with the main effect of genotype and stress (and their interaction) with a Tukey post-hoc test.
Stress-induced changes in Alzheimer's disease gene expression in 6 months WT and 3xTg-AD mice.
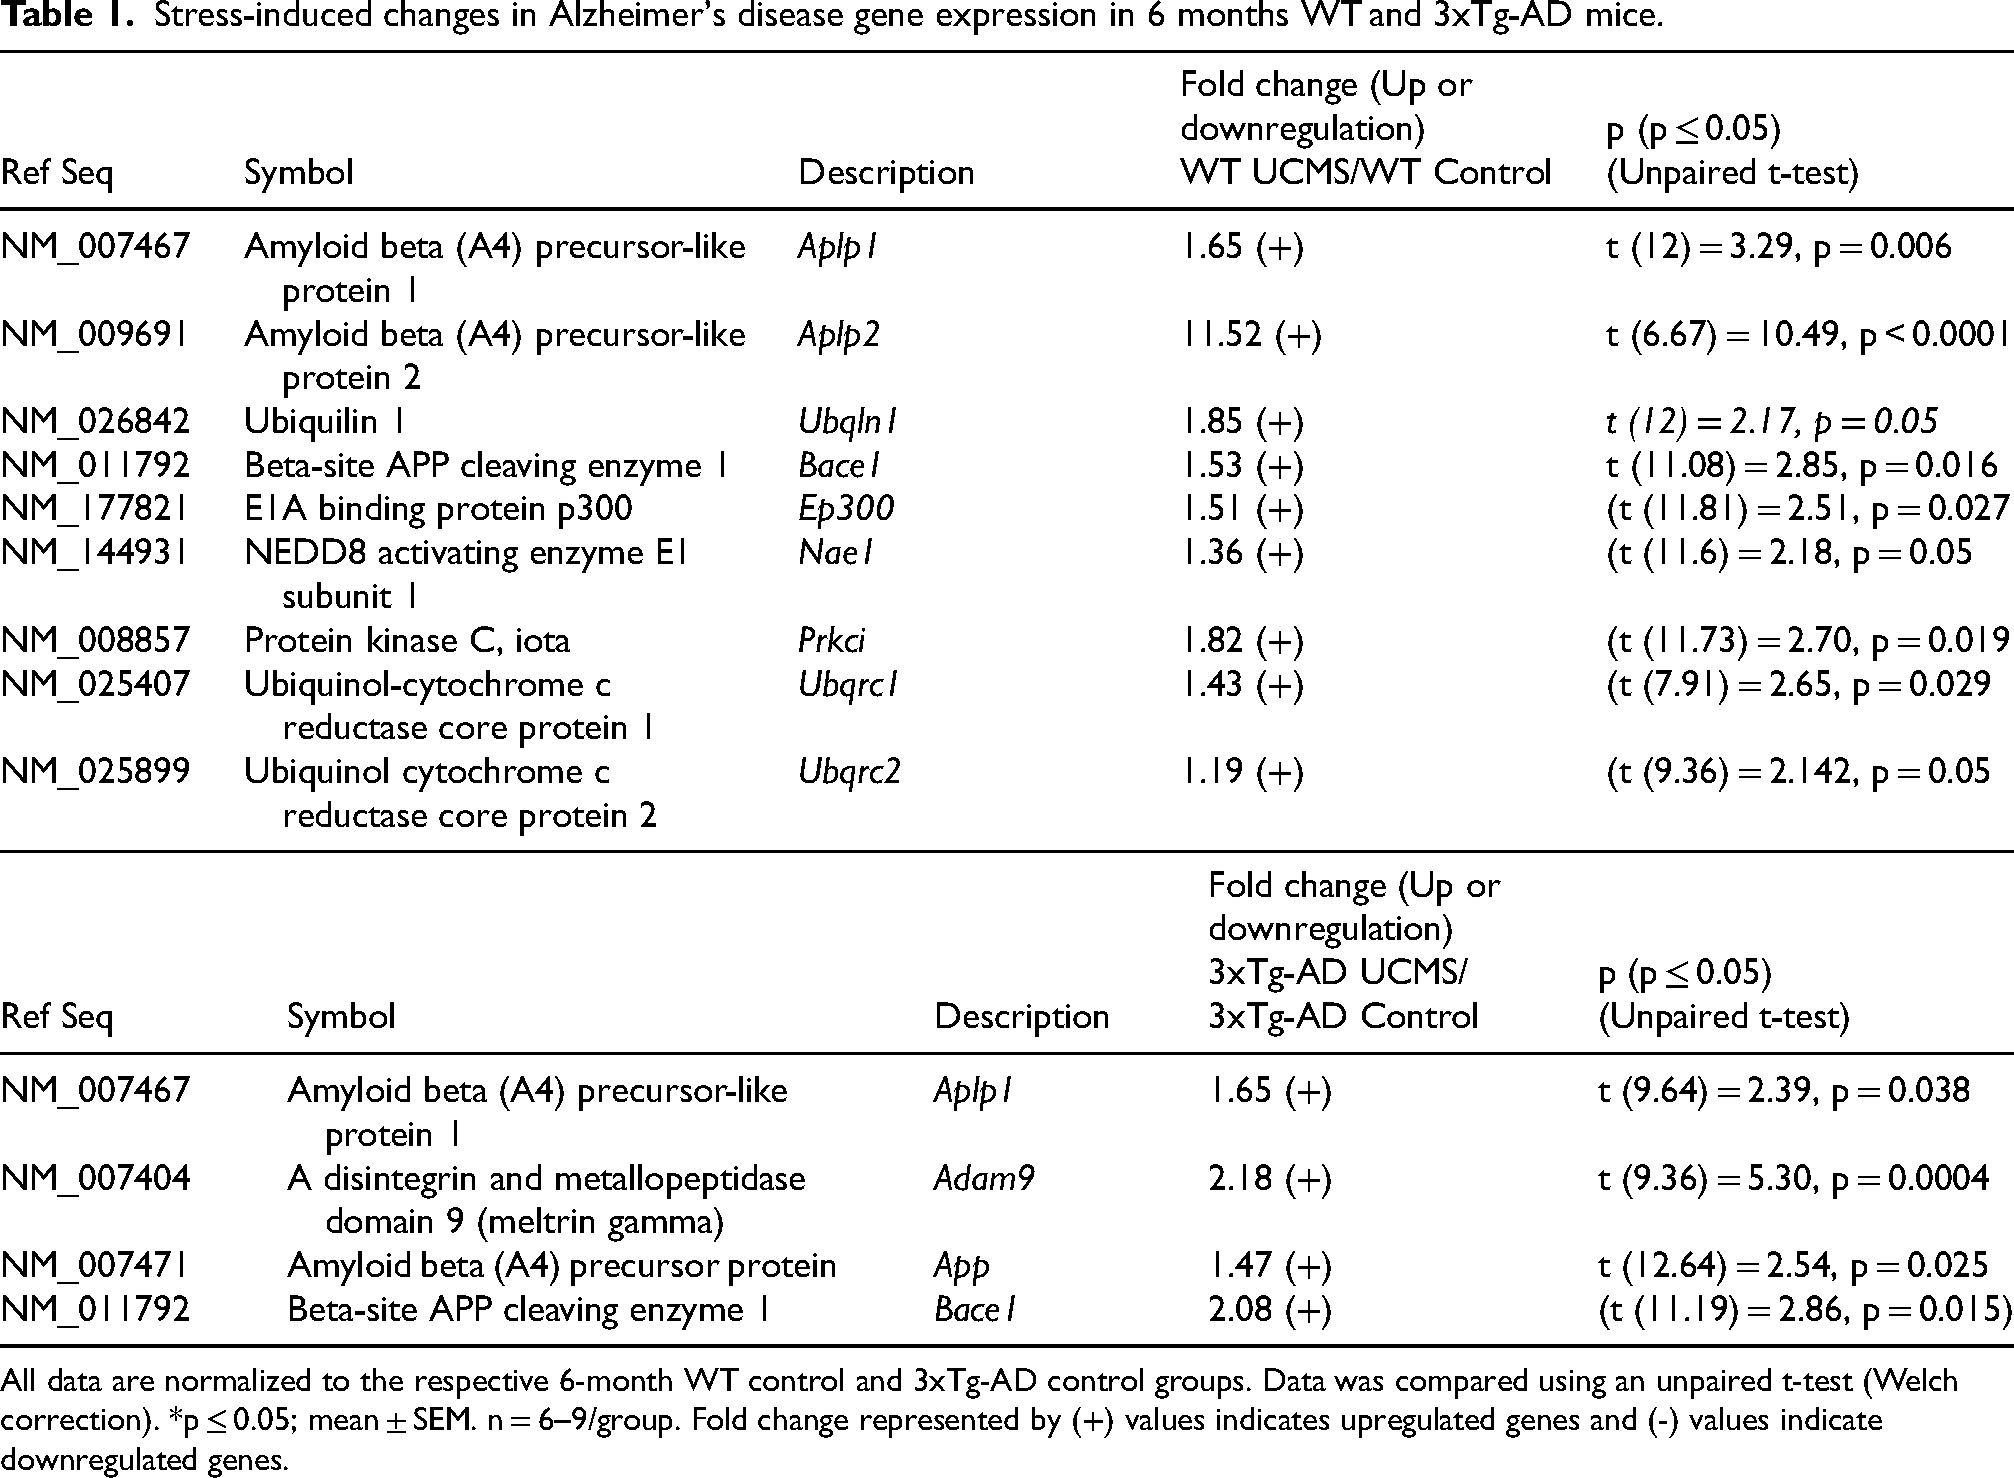
All data are normalized to the respective 6-month WT control and 3xTg-AD control groups. Data was compared using an unpaired t-test (Welch correction). *p ≤ 0.05; mean ± SEM. n = 6–9/group. Fold change represented by (+) values indicates upregulated genes and (-) values indicate downregulated genes.
Stress-induced changes in Alzheimer's disease gene expression in 9 months 3xTg-AD mice.
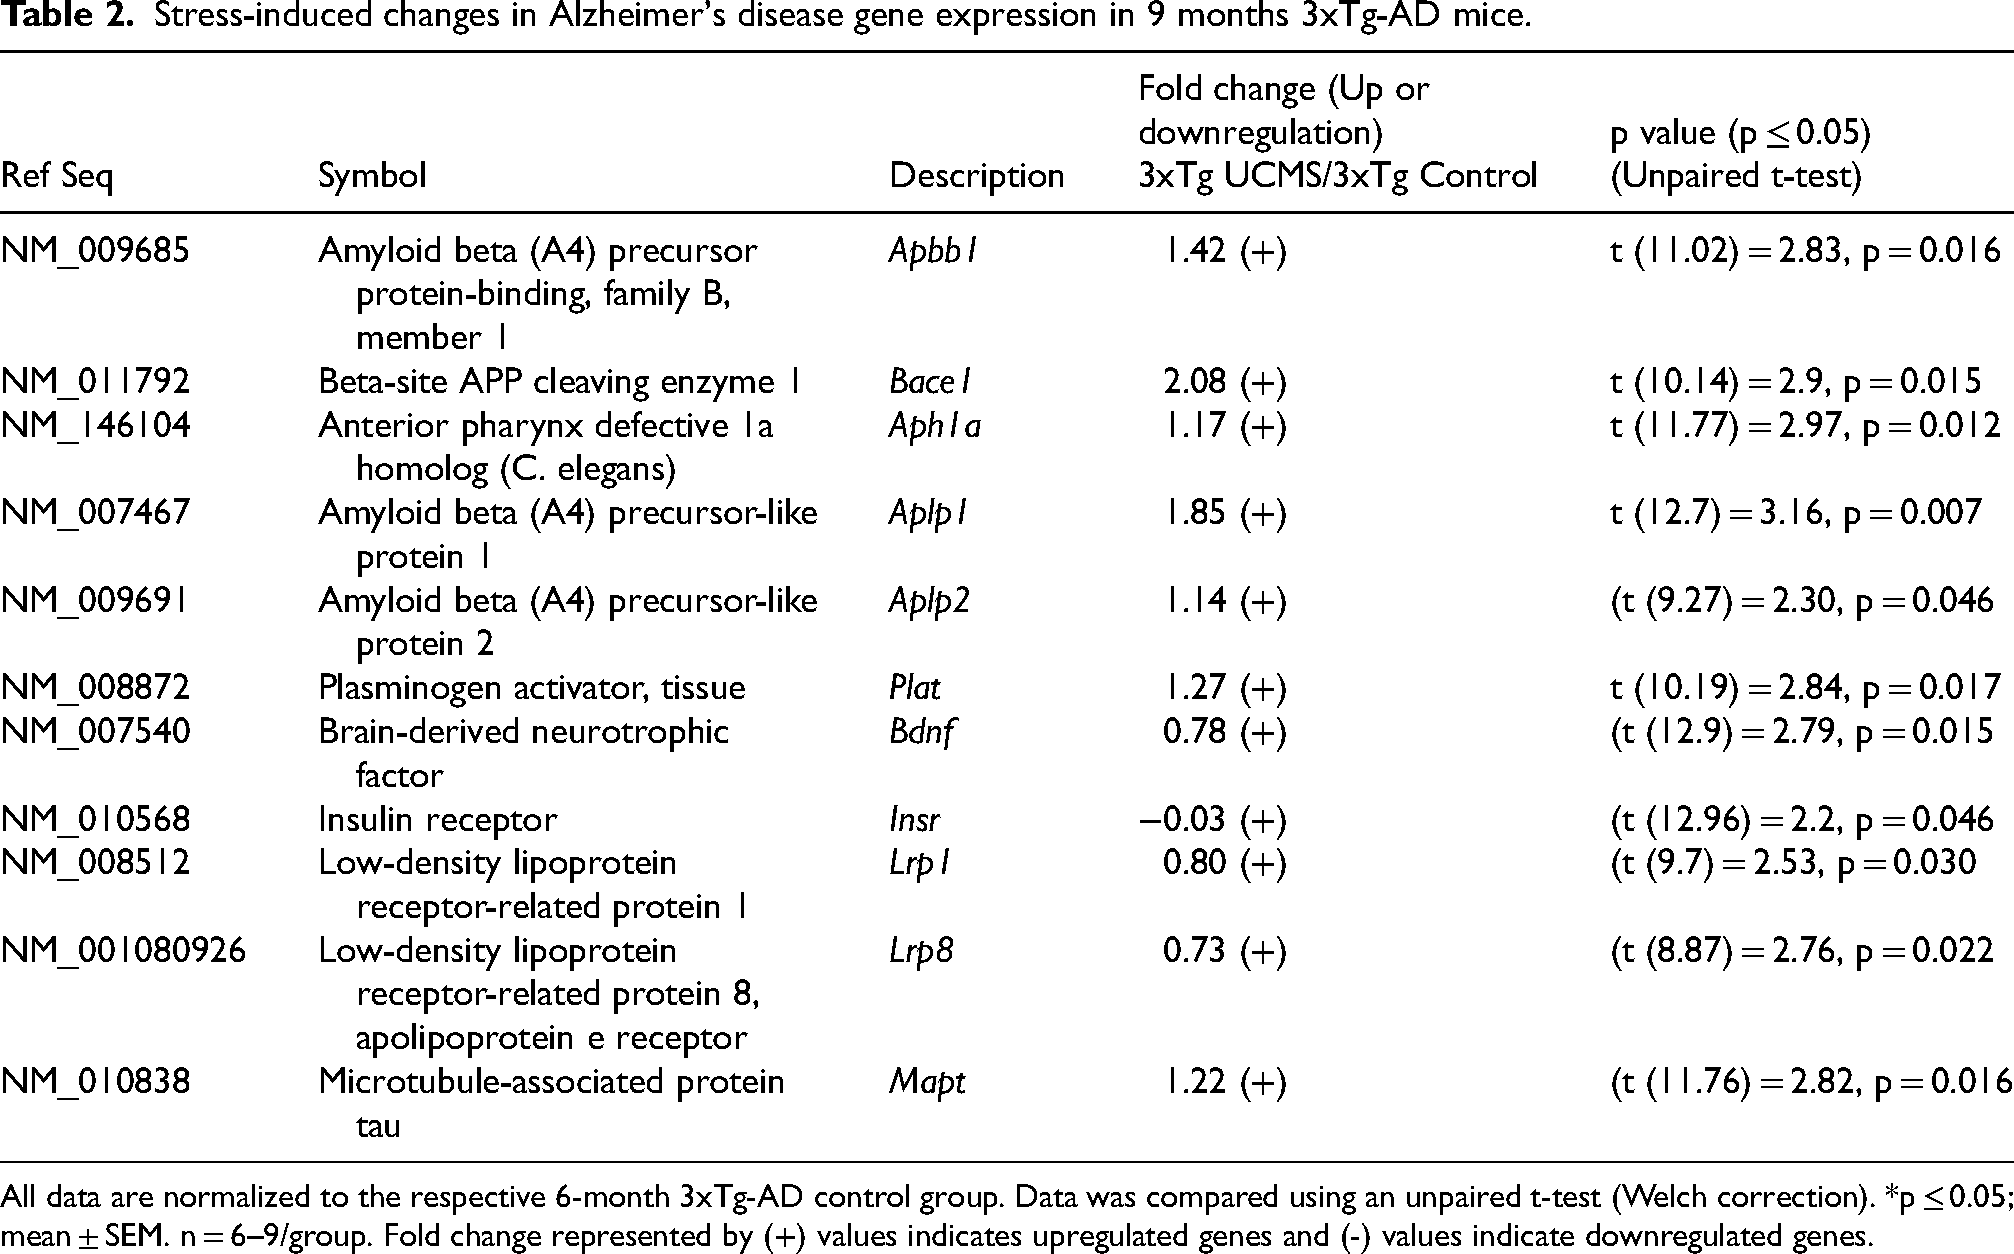
All data are normalized to the respective 6-month 3xTg-AD control group. Data was compared using an unpaired t-test (Welch correction). *p ≤ 0.05; mean ± SEM. n = 6–9/group. Fold change represented by (+) values indicates upregulated genes and (-) values indicate downregulated genes.
Stress-induced changes in oxidative stress pathway-associated genes in 6-month WT and 3xTg-AD mice.
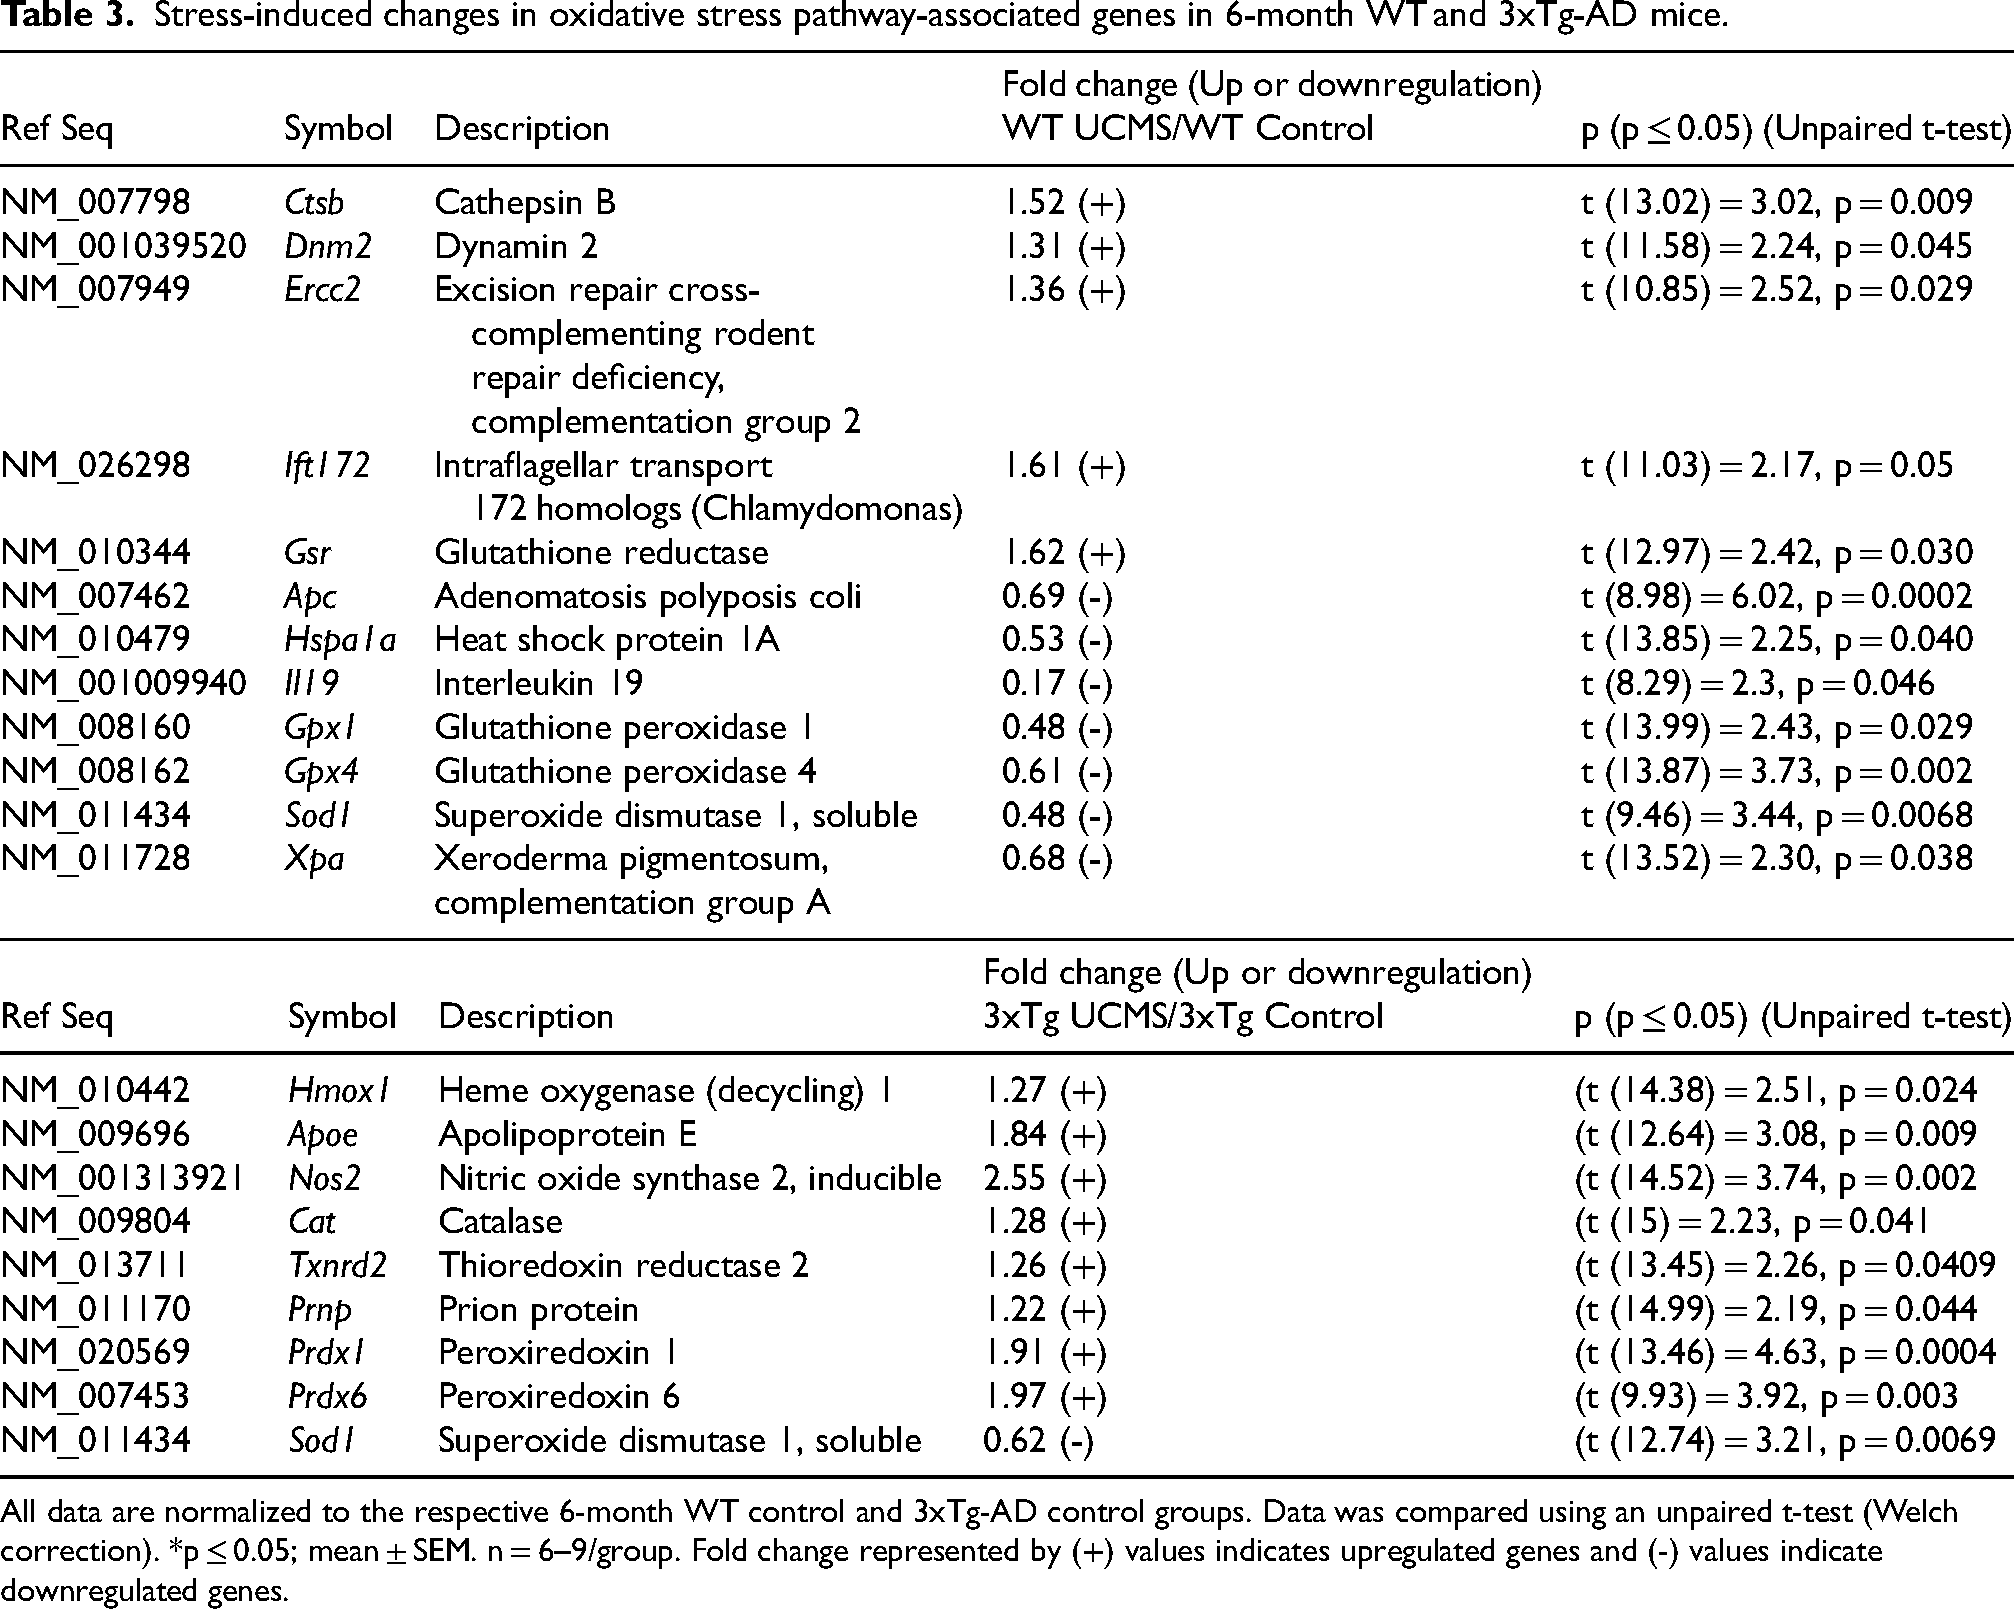
All data are normalized to the respective 6-month WT control and 3xTg-AD control groups. Data was compared using an unpaired t-test (Welch correction). *p ≤ 0.05; mean ± SEM. n = 6–9/group. Fold change represented by (+) values indicates upregulated genes and (-) values indicate downregulated genes.
Stress-induced changes in oxidative stress pathway-associated genes in 9-month WT and 3xTg-AD mice.

All data are normalized to the respective 6-month WT control and 3xTg-AD control groups. Data was compared using an unpaired t-test (Welch correction). *p ≤ 0.05; mean ± SEM. n = 6–9/group. Fold change represented by (+) values indicates upregulated genes and (-) values indicate downregulated genes.
Results
Effect of stress on animal characteristics
No significant differences were noted in body mass at 6 months of age between WT con (29 ± 5 g), WT UCMS (27 ± 5 g), 3xTg-AD con (25 ± 4 g), and 3xTg-AD UCMS (27 ± 5 g) or at 9 months of age between WT con (35 ± 13 g), WT UCMS (30 ± 5 g), 3xTg-AD con (25 ± 5 g), and 3xTg-AD UCMS (31 ± 7 g). Examining coat scores at 6 months revealed a main effect for stress with no differences in genotype or a genotype by UCMS interaction. As such, the mouse grooming habits revealed poorer coat status in WT (5.7 ± 1.5 au) and 3xTg-AD (5.4 ± 1.5 au) UCMS groups versus WT (0.8 ± 1.2 au) and 3xTg-AD (0.4 ± 0.5 au) controls. Similarly, at 9 months, we only identified a main effect for stress, indicating mice in the WT (2.2 ± 1.6 au) and 3xTg-AD (2.1 ± 1.6 au) UCMS groups had poorer coat scores than their respective controls (WT: 0.1 ± 0.04 au; 3xTg-AD: 0.3 ± 0.5 au). Data is presented as mean ± SD.
UCMS accelerates age-related impairment in MCA function and reactivity
At 6 months of age, we explored how UCMS and AD affected the dilatory response of the MCA to ACh, SNP, and PE (Figure 1). We identified a main effect of UCMS (p < 0.0001) and an interaction between genotype (WT versus 3xTg-AD) and UCMS (p < 0.0001) on the MCA EDD dilator response. Specifically, the MCA dilator response to ACh was blunted in WT UCMS versus WT controls and 3xTg-AD versus WT controls (Figure 1A, B). No differences were noted in the MCA EDD response to ACh between 3xTg-AD control and UCMS groups. This impaired EDD response due to UCMS and AD was due to a smaller NO dilatory influence (Figure 1E). We identified the main effect of UCMS (p < 0.0001) and an interaction between genotype and UCMS (p < 0.0001) on the MCA NO dilatory response. Whereby, a smaller reduction in EDD in the presence of the NO inhibitor L-NAME was noted in the WT UCMS (3.2 ± 0.8 µm), 3x-Tg-AD (4.7 ± 1.7 µm), and 3x-Tg-AD UCMS (3.3 ± 3.7 µm) groups versus WT Con (13.3 ± 3 µm) (Figure 1E).
To explore the role of oxidative stress on EDD, we acutely incubated the MCA with Tempol (a SOD mimic) or febuxostat (XO inhibitor) (Figure 1F). We identified a main effect of UCMS (p < 0.0001) and an interaction between genotype and UCMS (p < 0.0001) on the acute effects of Tempol. Similarly, we identified the main effect of UCMS (p < 0.0001) and an interaction between genotype and UCMS (p < 0.0001) on the acute effects of febuxostat. These data indicate that neither Tempol nor febuxostat affected EDD in WT controls. However, acute Tempol incubations restored EDD in WT UCMS mice to EDD levels noted in WT controls. On the other hand, acute febuxostat incubation did not improve EDD in WT UCMS. The acute Tempol incubation in 3xTg-AD controls improved EDD, but no improvements were noted with acute febuxostat (Figure 1F). In the 3xTg-AD UCMS mice, acute Tempol and/or febuxostat incubations were equally effective in restoring maximal EDD of the MCA to WT-control levels (Figure 1F). Next, we explored how UCMS and AD impacted endothelial independent dilation (EID). We identified the main effect of UCMS (p < 0.0001) and genotype (p < 0.0001) with no significant interaction. MCA EID was reduced in the 3xTg-AD controls, WT UCMS, and 3xTg-AD UCMS groups at 10−7–10−4 M (Figure 1C) versus WT controls. For the MCA constrictor response to PE at 6 months of age, we identified a main effect of UCMS (p < 0.001) and genotype (p < 0.0001) with no significant interaction. Whereby, at 10−5 and 10−4M PE, 3xTg-AD UCMS had a reduced constrictor response versus WT controls, and at 10−4M, the 3xTg-AD UCMS also had a reduced constrictor response versus 3xTg-AD controls (Figure 1D).
The EDD, EID, and constrictor responses at 9 months of age are summarized in Figure 2. We identified the main effect of UCMS (p < 0.0001) and an interaction between genotype (WT versus 3xTg-AD) and UCMS (p < 0.0001) on the MCA EDD response. We noted that at 9 months of age (Figure 2B), the impaired EDD response to ACh persisted in WT UCMS and 3xTg-AD groups versus WT controls, and 3xTg-AD UCMS mice displayed a further reduction in EDD compared to 3xTg-AD controls. Once again, this impaired EDD response was driven by a smaller NO dilatory influence (Figure 2E). Specifically, we noted the main effect of UCMS (p < 0.0001) and an interaction between genotype and UCMS (p < 0.0001) on the MCA NO dilatory response. A smaller reduction in EDD in the presence of the NO inhibitor L-NAME was noted in the WT UCMS (5 ± 3.5 µm), 3x-Tg-AD (5.4 ± 1.7 µm), and 3x-Tg-AD UCMS (−1 ± 2.9 µm) groups versus WT Con (12.9 ± 3 µm) (Figure 2E).
Next, we acutely incubated the MCA with Tempol or febuxostat (Figure 2F) and identified a main effect of UCMS (p < 0.0001) and an interaction between genotype and UCMS (p < 0.001) on the acute effects of Tempol. Similarly, we identified a main effect of UCMS (p < 0.0001) and an interaction between genotype and UCMS (p < 0.0001) on the acute effects of febuxostat. As before, these data indicate that neither Tempol nor febuxostat affected EDD in WT controls. Meanwhile, in the WT-UCMS mice, acute Tempol incubation restored EDD to levels noted in WT controls; however, acute febuxostat did not improve EDD in WT-UCMS mice. In the 3xTg-AD controls, the acute Tempol incubation improved EDD, but no improvements were noted with acute febuxostat incubations (Figure 2F). In the 3xTg-AD mice exposed to chronic stress, acute Tempol and/or febuxostat incubations were equally effective in restoring maximal EDD of the MCA to WT-control levels (Figure 2F). No significant main effect or interaction between genotype and UCMS was noted in MCA EID response (Figure 2C). Next, we explored the MCA constriction response at 9 months of age and found a main effect of UCMS (p < 0.0001) and genotype (p < 0.0001) with no significant interaction. These data indicate that the MCA constriction was impaired at 9 months of age between WT and 3xTg-AD Controls (Figure 2E), and between WT UCMS and 3xTg-AD UCMS mice compared to WT controls (Figure 2E).
UCMS promotes age-dependent deposition of AD pathway genes
To examine the time-dependent manifestations of AD pathology, we analyzed changes in gene expression of 84 murine genes in the brains of 6- and 9-month-old WT and 3xTg-AD mice, categorized into control (non-stressed) and UCMS groups. The data presented outlines changes in gene expression based on three variables: genotype, age, and time across all groups. A heat map illustrates the gene expression profile for all genes, using a log2 fold change scale for all groups, with data normalized to their respective control groups. The data are represented as relative mRNA expression (2−ΔΔCt values) normalized to the control groups for both WT and 3xTg mice and analyzed using unpaired t-test and two-way ANOVA with Tukey post-hoc analysis.
Planned comparisons using unpaired t-tests with Welch's correction were conducted to evaluate stress-induced gene expression changes in 6- and 9-month-old WT and 3xTg-AD mice exposed to UCMS. At 6 months (Table 1), UCMS upregulated Aβ-related genes in both WT (Aplp1, Aplp2, Ubqln1, Bace1) and 3xTg-AD mice (Aplp1, Adam9, App, Bace1), suggesting early compensatory responses to increasing Aβ levels that may contribute to accelerated AD progression. Upregulation of Ep300 and Nae1 in WT UCMS mice indicates changes in gene regulation and stress adaptation. Evidence of mitochondrial dysfunction was observed through increased expression of Uqcrc1 and Uqcrc2, components of mitochondrial complex III, consistent with elevated oxidative stress. The differential transcriptional responses between WT and 3xTg-AD mice highlight how chronic stress exacerbates AD-related pathology in genetically predisposed models (Supplemental Figure 1), underscoring the critical interaction between environmental stress and genetic vulnerability.
To evaluate the long-term effects of MLS, we analyzed AD-related gene expression in 9-month-old 3xTg-AD UCMS mice (Table 2). Upregulation of Apbb1, Bace1, Aph1a, Aplp1, Aplp2, and Plat suggests enhanced Aβ production and potential acceleration of AD pathology. Concurrent downregulation of Bdnf and Insr indicates stress-induced disruption of neurotrophic signaling and insulin sensitivity. Impaired clearance of Aβ was noted with decreased levels of Lrp1 and Lrp8. Furthermore, an increase in Mapt levels in 3xTg-AD UCMS mice implicates UCMS in promoting tau accumulation and hyperphosphorylation, suggesting that chronic stress may worsen both amyloid and tau pathology in AD.
Aging comparisons between 6- and 9-month-old WT and 3xTg-AD mice were conducted using two-way ANOVA, with all data normalized to 6-month controls. In 9-month WT mice, we observed significant age-related upregulation of Aβ pathway genes (Ache, Apba1, Apbb1, Apbb2, Aph1a, Aplp1, Aplp2, Apoe, Bace1, Ctsb, Ncstn, Psen1; Figure 3B), indicating early activation of AD-associated mechanisms. Upregulation of signaling molecules (Gnaz, Gng4, Gsk3a, Insr, Prcke, Prcki, Prckg, Snca, Sncb; Figure 3C) further supports age-driven cellular changes. In contrast, the downregulation of lipid metabolism genes (Lpl, Lrp6, Lrp8; Figure 3D) suggests disrupted lipid homeostasis. Increased expression of mitochondrial-related genes (Ubqln1, Uqcrc1, Uqcrc2; Figure 3E) may reflect compensatory responses to age-associated mitochondrial stress and early AD progression.
Figure 4 illustrates an age-associated acceleration of key Aβ pathway genes in the 6 and 9-month-old 3xTg-AD mice normalized to 6-month 3xTg-AD controls. A significant main effect of time was observed for several genes: Abca1, Adam9, Apba1, Aph1a, Apbb1, Apbb2, App, and Bace1 when compared to the 6-month 3xTg-AD controls (Figure 4B). Additionally, a significant increase with UCMS on Adam9, Aph1a, Apbb1, App, and Bace1 was observed, along with an interaction effect (UCMS and time) in the gene expression of Abca1, Adam9, and Apba1. We also observed the upregulation with time for insulin receptor protein Insr (Figure 4C) and its regulating protein Lrp1 (Figure 4C), which is associated with insulin signaling and glucose uptake. Furthermore, increased levels of Uqcrc1 and Uqcrc2 (Figure 4D) in 9-month 3xTg-AD mice may indicate increased ROS levels via dysfunctional complex III, due to increased demand for ATP and stress-induced biogenesis with aging.
We also conducted a custom gene expression analysis for three mutant human AD genes (present in the 3xTg-AD model) in 6 and 9-month-old 3xTg-AD mice (Figure 4E, F). Our findings revealed a significant increase in the relative mRNA expression of hAPP (Figure 4F-1), influenced by both time and stress. Additionally, we observed elevated levels of hMAPT (Figure 4F-2) over time and stress, along with a significant interaction effect between stress and time. Furthermore, we noted a significant main effect of time on hPSEN1 levels (Figure 4F-3), although no significant stress-related differences were observed across the groups.
UCMS triggers transcriptional dysregulation of oxidative stress markers and enhances AD progression with age
The progression of AD has been linked to oxidative stress; as such, we analyzed 84 murine oxidative stress pathway genes in WT UCMS and 3xTg-AD UCMS mice, comparing them to their control groups using an unpaired t-test (Welch's correction). In 6-month WT UCMS mice (Table 3), stress significantly upregulated genes involved in proteostasis, DNA repair, and redox regulation (Ctsb, Dnm2, Ercc2, Ift172, Gsr), while other key genes (Apc, Hspa1a, IL19, Gpx1, Gpx4, Sod1, Xpa) were downregulated, indicating compromised oxidative defense. Notably, Sod1 was reduced in both 6-month WT and 3xTg-AD UCMS mice, suggesting shared antioxidant dysfunction. In 6-month 3xTg-AD UCMS mice, upregulation of Hmox1, Cat, Txnrd2, Apoe, Prnp, Nos2, Prdx1, and Prdx6 reflects a heightened oxidative and inflammatory response to UCMS, potentially as a compensatory mechanism against AD-related ROS accumulation.
In the 9-month-old WT mice (Table 4), we assessed the long-term effects of MLS and found that most gene transcripts showed stress-related downregulation in both WT and 3xTg mice. In the WT UCMS mice, we observed significant downregulation of oxygen transporters (Atr, Dnm2 and Fancc), peroxidases (Duox1, Ehd2 and Epx), glutathione metabolism genes (Gss and Gsr), and oxidative stress response genes (Ercc2, Hmox1 and Srxn1). Similarly, in the 9-month-old 3xTg-AD UCMS mice (Table 4), several oxidative stress-response genes were downregulated, such as Als2, Cat, Nqo1, Scd1, Sod1, and Txnrd3. Additionally, there was a stress-related upregulation of genes related to glutathione metabolism (Gsr) and NADPH oxidase components (Nos2 and Noxo1). Overall, the consistent pattern of gene downregulation observed in WT and 3xTg-AD mice highlights the impact of stress on cellular function affecting antioxidant defense, cellular repair, and metabolism.
We conducted a two-way ANOVA analysis (Supplemental Figure 2 and Supplemental Table 1) to analyze the mRNA transcripts of key genes in 6- and 9-month-old WT and 3xTg-AD mice, with the data normalized to 6-month-old WT controls. At 6 months, 3xTg-AD mice (control and UCMS) showed downregulation of glutathione peroxidases (Gpx1, Gpx3, Gpx4, Gpx5), indicating impaired antioxidant defenses. Conversely, oxidative stress response genes (Apoe, Cat, Gsr) and peroxiredoxins (Prdx1, Prdx6) were upregulated. By 9 months, 3xTg-AD mice displayed downregulation of oxidative stress-related genes (Als2, Cat, Dnm2, Duox1, Epx, Fancc, Nos2, Prnp, Srxn1, Noxo1, Txnip), implicating impaired ROS detoxification and stress response, potentially accelerating AD progression.
Aging-related changes in oxidative stress genes were evident in WT mice between 6 and 9 months (Figure 5). Key glutathione peroxidases (Figure 5B), including Gpx1, Gpx4, Gpx5, and Gstk1, showed age-dependent downregulation, with Gpx1 and Gpx4 also influenced by stress and its interaction with age. Several oxidative stress response genes (Ctsb, Duox1, Ercc2, Prnp) were upregulated, while redox-related genes such as Sod1, Fth1, Park7, and Txn1 declined with age (Figure 5D). The consistent downregulation of Sod1 across time, stress, and their interaction underscores a potential weakening of antioxidant defenses. Additionally, while Ift172 and Gsr were upregulated, other stress-related genes (Alb, Rag2, Vim) were reduced with aging, suggesting a shift in redox regulation and cellular stress responses over time.
As shown in Figure 6, 9-month-old 3xTg-AD mice exhibited widespread downregulation of oxidative stress-related genes. ROS-metabolizing genes (Nos2, Nox4) were significantly affected by age, stress, and their interaction, with Nos2 particularly sensitive to UCMS. Peroxiredoxins (Prdx1, Prdx2, Prdx6) were also downregulated, showing effects of both time and stress. While some oxidative stress response genes, such as Cat, were upregulated under interaction effects, others like Gpx3 and Gsr were affected by time and stress individually. Additional key genes (Gclm, Gstp1, Nqo1, Txnip, Ucp3) showed downregulation with time.
UCMS drives age-related accumulation of AD pathology proteins
Western blot analysis for protein quantification (Figure 7A-C) confirmed similar trends observed at the mRNA level, with a significant increase with stress and genotype in the production of APP at 6 months of age (Figure 7A-1). A similar effect of stress, genotype, and interaction effect was observed for BACE at 6 months of age (Figure 7B-1). At 9 months of age, the main effect of genotype on APP and BACE was noted with an increased expression. (Figure 7A-2, 7B-2). A significant main effect of genotype was observed in tau protein expression at 6 months (Figure 7C-1) with no significant differences at 9 months of age (Figure 7C-2).
Discussion
Chronic stress during mid-life is a key risk factor for cerebrovascular disease and long-term cognitive decline.13,15,29 We found that UCMS at mid-life led to lasting cerebrovascular dysfunction, worsened AD pathology, and disrupted oxidative balance. These impairments may contribute to cognitive decline, consistent with studies linking chronic stress to reduced cognitive function.30–32 As such, this dysregulated stress response may be responsible for the compounded effects of chronic stress and AD on cerebrovascular function.
Cerebrovascular dysfunction is a hallmark of chronic stress.33,34 We show that chronic stress impairs endothelial function in WT mice by 6 months of age, with deficits persisting through 9 months. This dysfunction is driven by reduced NO bioavailability, likely due to decreased eNOS activity or NO scavenging by superoxides, as acute oxidative stress inhibition restored MCA EDD. Cerebrovascular changes are also an early feature of AD.4,35 Even before hallmark pathology development, 3xTg-AD mice exhibit impaired MCA responses at 6 months, which persist at 9 months. These deficits stem from insufficient NO-mediated dilation, aligning with studies showing that reduced NO correlates with dementia severity 36 and that NO inhibition worsens AD pathology.37,38 Early reductions in cortical blood flow 23 further underscore the relevance of NO and vascular dysfunction in AD progression. Next, we wanted to understand if UCMS further impaired MCA function in AD mice; however, at 6 months of age, the 3xTg-AD mice that underwent UCMS had similar MCA dysfunction as 3xTg-AD control mice. At 9 months of age, the effects of early exposure to UCMS in the 3xTg-AD resulted in a further reduction in MCA EDD. Again, this was likely due to a pro-oxidative environment, impacting NO bioavailability. Indeed, MCA EDD was mostly protected when ROS were acutely removed with Tempol or febuxostat. This pro-oxidative environment induced by AD and amplified by UCMS was also supported by changes in gene expression in the brain. Oxidative stress is a major contributor to AD pathogenesis,39–41 with alterations in genes regulating synaptic transmission, ion homeostasis, 42 oxidative stress, DNA repair, and cell cycle occurring before plaque or tangle formation with AD. 43 In our study, we showed that at 6 months, 3xTg-AD UCMS mice exhibited increased expression of antioxidant genes (Hmox1, Cat, Nos2, Txnrd2), reflecting an early compensatory response to elevated intrinsic oxidative burden supported by findings from other preclinical studies.44,45 By 9 months, both genotypes exhibited widespread downregulation of antioxidant genes. In 3xTg-AD mice, this included further reductions in Als2, Cat, and Sod1, accompanied by elevated expression of Gsr, Nos2, and Noxo1. This pattern suggests a maladaptive oxidative stress response, potentially accelerating neurodegeneration, as reported elsewhere.46,47 Older 3xTg-AD mice also exhibited downregulation of Nos2 and Nox4, indicating impaired detoxification capacity.48,49 These transcriptional shifts align with broader findings of mitochondrial dysfunction, redox collapse, and inflammation preceding overt pathology in 3xTg-AD mice. 50 Chronic stress further exacerbates amyloid accumulation and disrupts neurotrophic signaling, 51 while promoting transcriptomic signatures of biological aging and DNA damage. 52 These results collectively suggest that chronic stress not only disrupts redox homeostasis but also accelerates the oxidative decline associated with AD, supporting the hypothesis that an altered and potentially insufficient oxidative stress response may exacerbate AD-associated neurodegeneration.
Chronic stress has been shown to accelerate AD pathology across multiple transgenic mouse models. In Tg2576 mice and APPV717I-CT100 mice, UCMS elevated hippocampal Aβ and phosphorylated tau, accompanied by cognitive deficits.53,54 In 5xFAD mice, they exhibited stress-induced cognitive decline and worsened plaque burden, likely driven by glucocorticoid imbalance. 55 Mechanistically, stress appears to exacerbate AD through multiple pathways, including Aβ and tau accumulation, impaired neurotrophic signaling, mitochondrial dysfunction, and neuroimmune alterations in APP-PS1 and 3xTg mice models.18,20,56 Our findings further support this by showing significant upregulation of APP and BACE expression in 3xTg-AD UCMS mice at both 6 and 9 months of age. Although total tau protein remained unchanged, human MAPT (gene encoding for tau) expression was markedly increased at 6 months, suggesting early tau dysregulation that may progress with age. Together, these data reinforce a clear link between chronic stress and the acceleration of AD pathology and highlight the potential of early stress-targeted interventions in modifying disease trajectory.
AD progression involves a complex interplay between genetic factors, environmental stressors, and aging. Core genes in Aβ metabolism (App, Bace1, Plat, Apbb1, and Aph1a, Aplp1 and Aplp2) underscore its multifactorial nature.57–60 Tau pathology, driven by Mapt, and reduced Bdnf and Insr signaling further contribute to AD progression.61,62 However, a comprehensive analysis of stress-induced mRNA changes in key Aβ metabolism and clearance genes remains limited. In this study, we investigated how UCMS alters the expression of Aβ- and tau-related genes in the 3xTg-AD mouse model. At 6 months of age, UCMS-exposed mice showed upregulation of App, Bace1, and Aplp1, indicating an early stress-induced activation of Aβ metabolic pathways. By 9 months, these transcriptional changes became more pronounced, with a continued upregulation of Bace1, Apbb1, Aph1a, Aplp1, Aplp2, and Mapt, alongside a significant downregulation in Bdnf and Insr. We observed age-dependent amplification, particularly the increased expression of Aβ-pathway genes and decreased markers of lipid and metabolic regulation, which parallels previous transcriptomic studies in aging and AD brains. 63 Our results suggest that chronic stress exacerbates the pathological trajectory of AD by promoting both Aβ and tau pathology while simultaneously impairing neurotrophic and metabolic support. The observed alterations, particularly in redox regulation, Aβ and tau dynamics, and neurotrophic signaling, highlight key molecular targets that may inform therapeutic strategies aimed at mitigating stress-related acceleration of AD pathology.
Conclusion
This study demonstrates that MLS, modeled using the UCMS paradigm, contributes to cerebrovascular dysfunction and accelerates AD pathology. Key findings include: (1) Chronic stress in WT mice induced cerebrovascular endothelial dysfunction at both 6 and 9 months of age. (2) 3xTg-AD mice exhibited impaired endothelial function as early as 6 months, comparable to WT UCMS mice. (3) UCMS exposure in 3xTg-AD mice did not further exacerbate endothelial dysfunction at 6 months but led to a significant decline by 9 months of age. (4) UCMS increased expression of APP and BACE, as well as Aβ–pathway–related transcripts, suggesting that MLS accelerates AD-related molecular pathology at both time points. (5) Oxidative stress regulation was disrupted by UCMS in both WT and 3xTg-AD mice, as evidenced by the downregulation of key antioxidant genes and the upregulation of oxidative stress-responsive genes, indicating compromised redox homeostasis. Overall, these findings suggest that MLS profoundly impacts both cerebrovascular and AD pathologies, potentially exacerbating disease progression and worsening clinical outcomes.
Limitations and future directions
The study presented here included male and female mice and found no significant sex differences. However, the number of mice in each group was relatively low, which may not have provided enough statistical power to detect potential sex differences. This study must be expanded, as several sex differences have been observed in the 3xTg-AD model, particularly in areas such as Aβ burden.64–67 Furthermore, we did not address behavioral alterations due to the early age of our mice, a time when cognitive changes are not normally evident in this AD mouse model. Rather, the focus of the work was to understand how MLS impacts the early progression of cerebrovascular dysfunction and AD pathology. Future research should include these factors, as both AD and chronic stress can uniquely influence behavioral outcomes, particularly in memory, and it would be important to expand this to older ages when the progression of AD and behavioral/cognitive deficits are firmly established (∼14 months of age).
Supplemental Material
sj-docx-1-alz-10.1177_13872877251362204 - Supplemental material for Mid-life exposure to chronic stress accelerates cerebrovascular dysfunction and upregulates oxidative stress in Alzheimer's disease mice
Supplemental material, sj-docx-1-alz-10.1177_13872877251362204 for Mid-life exposure to chronic stress accelerates cerebrovascular dysfunction and upregulates oxidative stress in Alzheimer's disease mice by Saina S Prabhu, Emily N Burrage, Tyler Coblentz, Steven Ball, Dharendra Thapa, James W Simpkins, Evan DeVallance, Eric E Kelley and Paul D Chantler in Journal of Alzheimer's Disease
Footnotes

Ethical considerations
Protocols received prior approval from the WVUHSC Animal Care and Use Committee.
Author contributions
Funding
The authors disclosed receipt of the following financial support for the research, authorship, and/or publication of this article: This study was supported by the National Institute of Neurological Disorders and Stroke (PDC: R01NS117754); National Institute of General Medical Sciences of the National Institutes of Health (PDC and EEK; U54GM104942, and 5P20GM109098); SP: (Stroke and Its Alzheimer's Disease Related Dementias (ADRD)T32, Associate Scholar; WVU HSC International Fellowship Award, External and Internal Study Section Review); National Institute of Aging (EB: T32 AG052375); ED: AHA 23CDA1038976 and U54GM104942.
Declaration of conflicting interests
The authors declared no potential conflicts of interest with respect to the research, authorship, and/or publication of this article.
Data availability statement
The data supporting the findings of this study are available on request from the corresponding author.
Supplemental material
Supplemental material for this article is available online.
References
Supplementary Material
Please find the following supplemental material available below.
For Open Access articles published under a Creative Commons License, all supplemental material carries the same license as the article it is associated with.
For non-Open Access articles published, all supplemental material carries a non-exclusive license, and permission requests for re-use of supplemental material or any part of supplemental material shall be sent directly to the copyright owner as specified in the copyright notice associated with the article.
