




Abstract
Background
Existing literature lacks information on the relationship between exposure to ambient air contaminants and Alzheimer's disease (AD) risk represented by simultaneous assessment of absolute and relative concentration-response patterns.
Objective
This study quantifies fine particulate matter (PM2.5)-exposure and AD-risk relationships with detailed analyses of the role of methodologic limitations and sources of bias (e.g., population heterogeneity) and identifies notable subpopulation differences and subpopulations most vulnerable to PM2.5 exposure.
Methods
Using Medicare and SEDAC data, we evaluated effects of PM2.5 exposure on AD risk using absolute and relative concentration-response functions through, respectively, age-adjusted rates and Cox-model estimates by sex/race/ethnicity/exposure groups.
Results
Analyses demonstrated that chronic PM2.5 exposure was significantly associated with increased AD risk, with substantial variation observed across sex and race/ethnicity-specific subgroups. Females showed higher absolute incidence, while males exhibited steeper relative risk increases with rising PM2.5 concentrations. Native Americans, residing primarily in low-exposure areas, demonstrated the steepest rise in hazard with increasing PM2.5 concentrations; Black and Asian subpopulations exhibited the lowest relative ratios. Nonlinearities were detected in exposure-response relationships. AD risk in Hispanics displayed notable geographic heterogeneity.
Conclusions
This study provides a background for evaluating health impacts of recent air-quality standards across the U.S. and their specific effects on AD risk in vulnerable subpopulation groups. Future research should employ more-flexible modeling techniques (e.g., spline-based or piecewise methods), integrate mechanistic studies, and utilize data on social determinants to further elucidate the biological and structural pathways linking PM2.5 to AD diagnosis, explain observed disparities through associated risk factors, and identify causal factors mediating the relationship.
Keywords
Introduction
Ambient air contaminants have been linked to increased risk of Alzheimer's disease (AD), related dementias (ADRD), and cognitive impairment, even at low exposure levels.1–7 However, the determinants governing the relationship between air pollution, the risk of AD/ADRD, and associated disparities remain unclear.1,3,8–10 Measures critical for understanding the influence of environmental exposures on disease risk in individuals and across populations include absolute and relative concentration-response functions. Characterizing the shape of concentration-response curves within subpopulations defined by demographic and other characteristics is essential for uncovering the population-attributable biological and social mechanisms through which environmental exposures elevate the risk of AD. Ultimately, this foundational knowledge underpins efforts to develop targeted prevention strategies and improve public-health outcomes.
Determinants governing air-pollution-related risk of AD diagnosis quantified in this paper include measures of the absolute and relative concentration-response patterns of ambient fine particulate matter (PM2.5) exposure. Several estimates of relative concentration-response patterns of PM2.5 and AD/ADRD exist, but the absolute patterns have not been characterized in the literature.1,8,11–13 Here, the absolute pattern is represented by age-adjusted incidence rates measured in predetermined PM2.5 exposure-specific groups. The relative concentration-response pattern is also a function of PM2.5 concentration and represents the excess risk of AD compared with that observed in the same population with zero concentration. However, this definition generates a quandary in evaluating the relative concentration-response patterns, because no geographic areas exist with PM2.5 = 0, so the risk of an outcome at zero concentration is unobservable and always missing. In practice, the relative concentration-response patterns are estimated as the ratio of the risk in each PM2.5 concentration group to that of a reference group with the lowest concentration. Because of a mean concentration in the reference group that is tangibly higher than zero and the necessity of choosing its right-hand boundary—which differs between populations—bias results in the obtained relative concentration-response patterns. One approach to obtaining an unbiased estimate of the relative pattern is to fit the absolute pattern by an analytic function and apply the explicit mathematical formula of this function for extrapolation to zero-concentration levels.
Additionally, because the relative concentration-response patterns are ratios of risks in each exposure category and the low-exposure reference group, another limitation of current relative concentration-response estimates is that only slopes can be compared demonstrating the rate of increase of the risk with rising concentration but not the absolute risk of AD incidence. Choosing the right-hand bound of the reference group, which is different for the subpopulations being compared, exacerbates the problem. Furthermore, age is typically added as a cofactor to Cox models in evaluating relative concentration-response patterns. This incorporation induces a model dependence on the effect of age, widely recognized as the foremost predictor of AD and a much stronger predictor than PM2.5 exposure. Here, we account for the effect of age nonparametrically by using age as a time-scale variable in Cox modeling of relative patterns and age adjustment for absolute patterns.
In this study, we examine both absolute and relative concentration-response relationships between PM2.5 exposure and AD risk, identify subpopulations that exhibit heightened vulnerability, and explore statistical properties governing shifts in concentration-response functions across heterogeneous subpopulations. We further evaluate the linearity of the concentration-response curves and assess whether AD risk persists below regulatory thresholds set by the U.S. Environmental Protection Agency (EPA) and the World Health Organization (WHO). Currently, the U.S. EPA annual standard for PM2.5 is 9.0 µg/m³, whereas the WHO recently updated its guideline to 5 µg/m³. These thresholds were set using the best available evidence at the time from studies documenting non-accidental and cause-specific mortality, serious morbidity risks, biological plausibility, new findings for neurodegenerative and neurocognitive endpoints such as dementia, and higher exposure concentrations for Black, Hispanic, and lower-SES communities, leading to higher morbidity compared with non-Hispanic Whites.14–16 However, a growing body of research suggests that health risks, including increased incidence of AD/ADRD and other dementias, may occur even below these levels.1,8,11,17–20
Methods
Data
This study is based on analysis of administrative health-insurance claims from a nationally representative 5% sample of Medicare beneficiaries followed over the 1991–2020 period, as well as ancillary data on ZIP-code-specific ambient PM2.5 levels linked to individual health records through the ZIP code of residence of each Medicare beneficiary. Medicare enrollment data provided information on the sex, race/ethnicity, and age of each individual. Due to the nature of the data, the official Centers for Medicare and Medicaid Services definitions of race/ethnicity were used: White, Black, Hispanic, Asian, and North American Native/Pacific Islander (Native Americans). Age at baseline, length of follow-up, onset of AD, and dates of death (where applicable) were derived from the data using previously published algorithms. 21
Daily and annual PM2.5 concentration estimates for 2000–2016 were drawn from the NASA Socioeconomic Data and Applications Center (SEDAC).22,23 These estimates were derived from ensemble predictions of three machine-learning models incorporating data from air-monitoring stations, satellite observations, meteorological records, and chemical-transport simulations.22,24,25 Each model produced PM2.5 values at the centroids of 1 km × 1 km grid cells across the contiguous U.S. ZIP-code-level PM2.5 concentrations were derived by averaging grid-cell predictions within each ZIP-code polygon, or—for point-designated ZIP codes—by assigning the value from the nearest grid cell. These annual averages were then linked to individuals in the Medicare data based on their ZIP code for each study year, covering approximately 31,000 polygon-based and 10,000 point-designated ZIP codes. Finally, each person's exposure metric was computed as the mean of these annual concentrations over the entire study period.
The cohort for analyses was formed using data from the 2000–2020 period with the 1991–2000 period employed for look-back. Each individual was characterized by the follow-up period, which began at the age of enrollment in traditional Medicare and ended at the age of AD diagnosis or censoring due to death, last date of coverage by traditional Medicare, or reaching age 110. Death was treated as an independent censoring event. Individuals with claims for AD at baseline as well as those with missing claims data for more than 20% of their follow-up time (e.g., due to enrollment in Medicare Advantage) were excluded from the analysis. Our final sample constituted 3,455,411 individuals aged 65+ with measured PM2.5 exposure.
Statistical analysis
We used a series of empirical estimates and Cox models to evaluate the absolute and relative concentration-response functions of PM2.5 governing AD risk. The absolute patterns were obtained using the empirical estimates of the age-adjusted rates evaluated in designated exposure groups. The relative patterns were calculated using the Cox model applied to the categorical (ordinal) variable categorized into eight groups by PM2.5 levels based on percentiles of the distribution for a studied subpopulation.
The age-specific empirical estimates were calculated for seven age groups: 65–69, 70–74, 75–79, 80–84, 85–89, 90–94, and 95–110. The estimates of age-specific incidence were calculated as the number of cases per the total amount of person-years in a specific age-exposure group:
The obtained concentration-response patterns were modeled using parametric models. First, we tested whether the patterns were linear in nature. Second, we tested whether the exponential model (M1) for the incidence rate
The results of the modeling of the calculated concentration-response patterns were compared with the estimates obtained using the proportional hazard model in two formulations. The first analysis examined in a univariable model the continuous predictor
Results
Figure 1 displays concentration-response patterns of age-specific AD incidence rates across seven age and eight exposure groups, revealing nonlinearity at higher concentrations of PM2.5. Figures 2 and 3 present age-adjusted incidence rates for the total population and for sex- and race/ethnicity-specific subpopulations, with absolute (left panels) and relative (right panels) concentration-response patterns. Whereas females show higher absolute incidence rates, the relative increase in incidence is steeper among males (Figure 2). Across all subpopulations, the highest octile of PM2.5 exposure—particularly above 12 µg/m³—rises beyond predictions from a linear model, indicating that a purely linear approach fails to fit either the absolute or relative concentration-response patterns in this upper range.
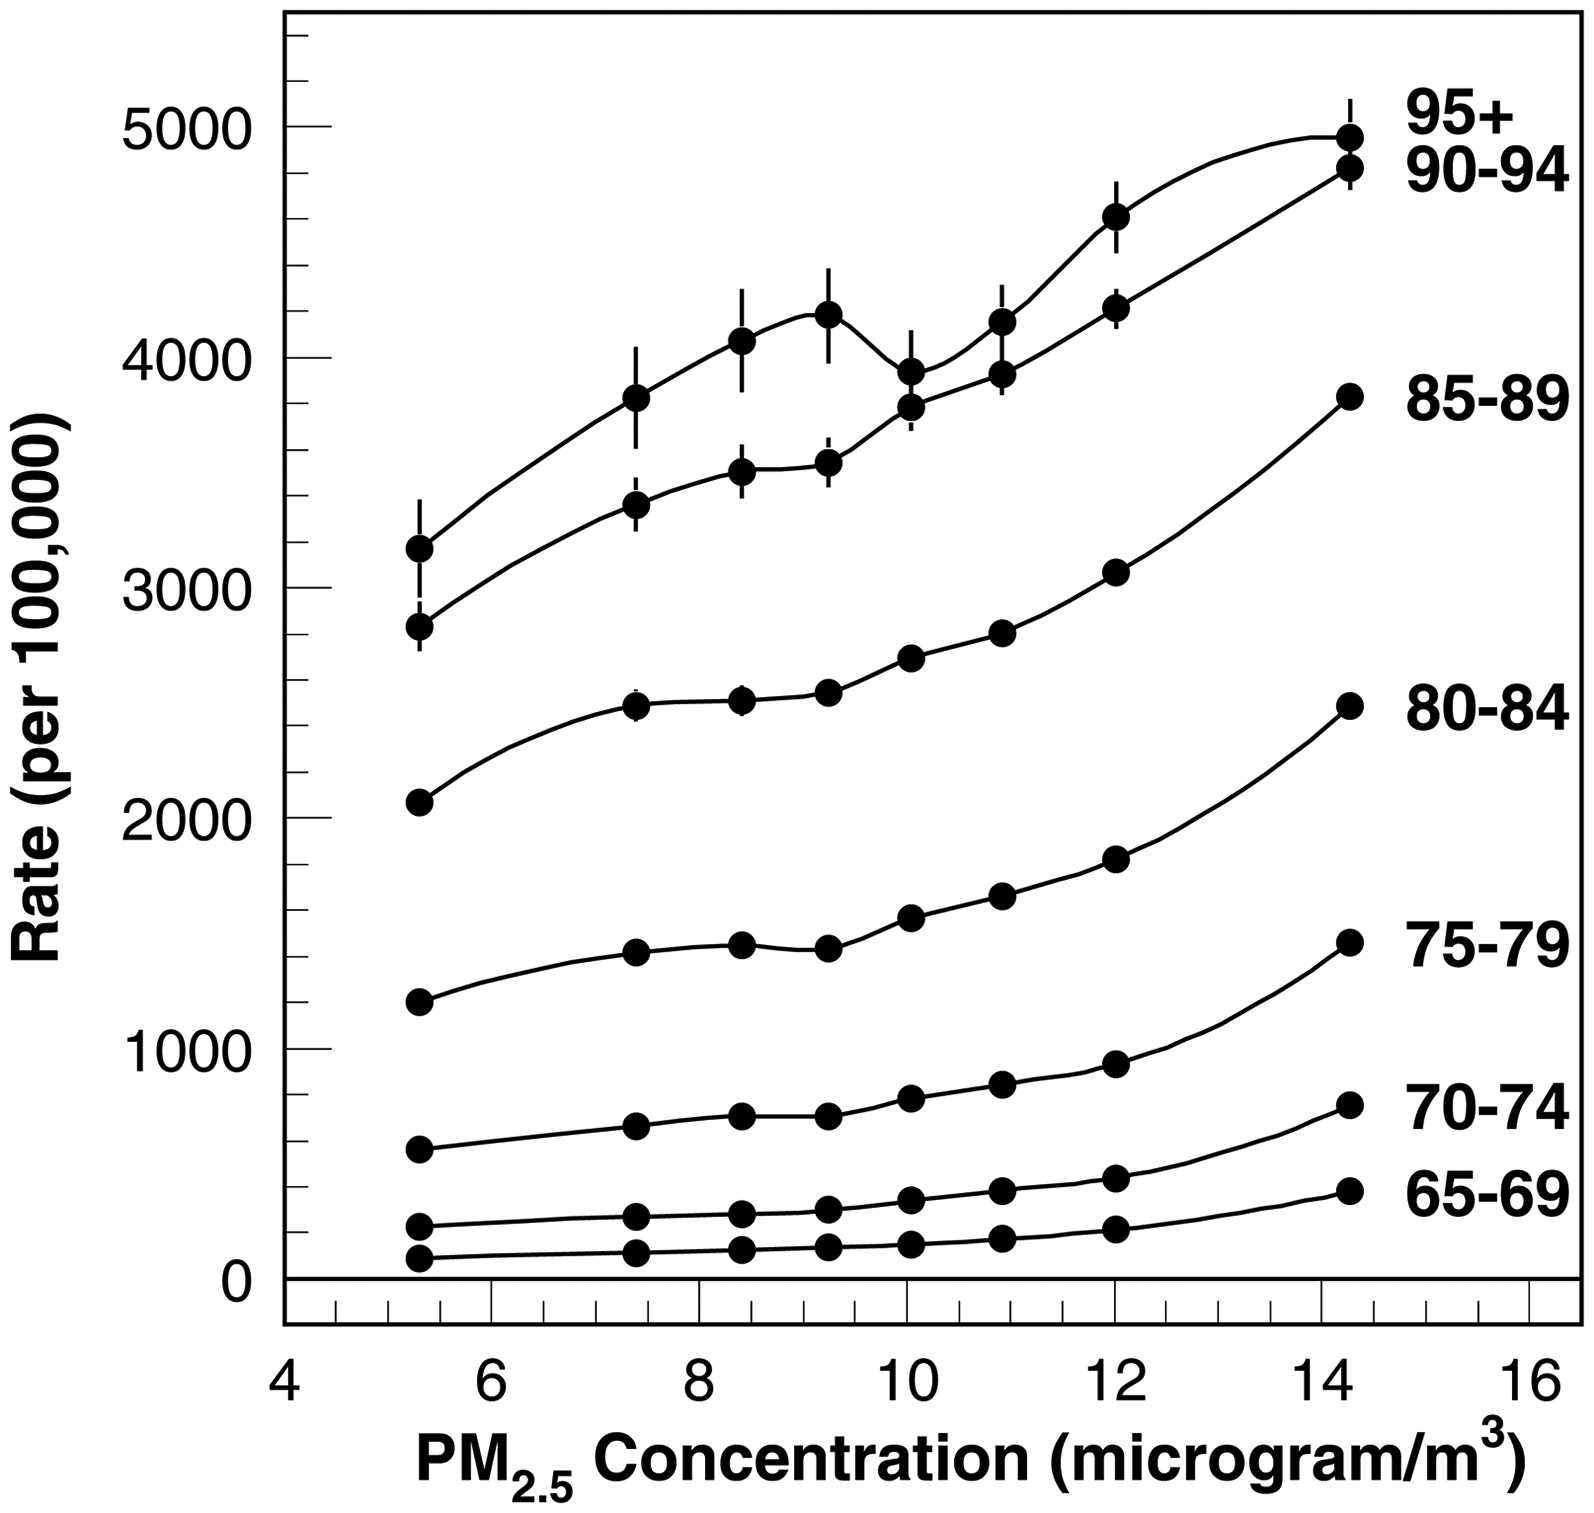
The PM2.5 concentration-response function of AD risk for the general population of older adults for seven 65+ age groups.

The PM2.5 concentration-response function of age-adjusted (AA) AD risk for the general population of older adults and sex-specific subgroups. The prior and newer EPA standards (i.e.,
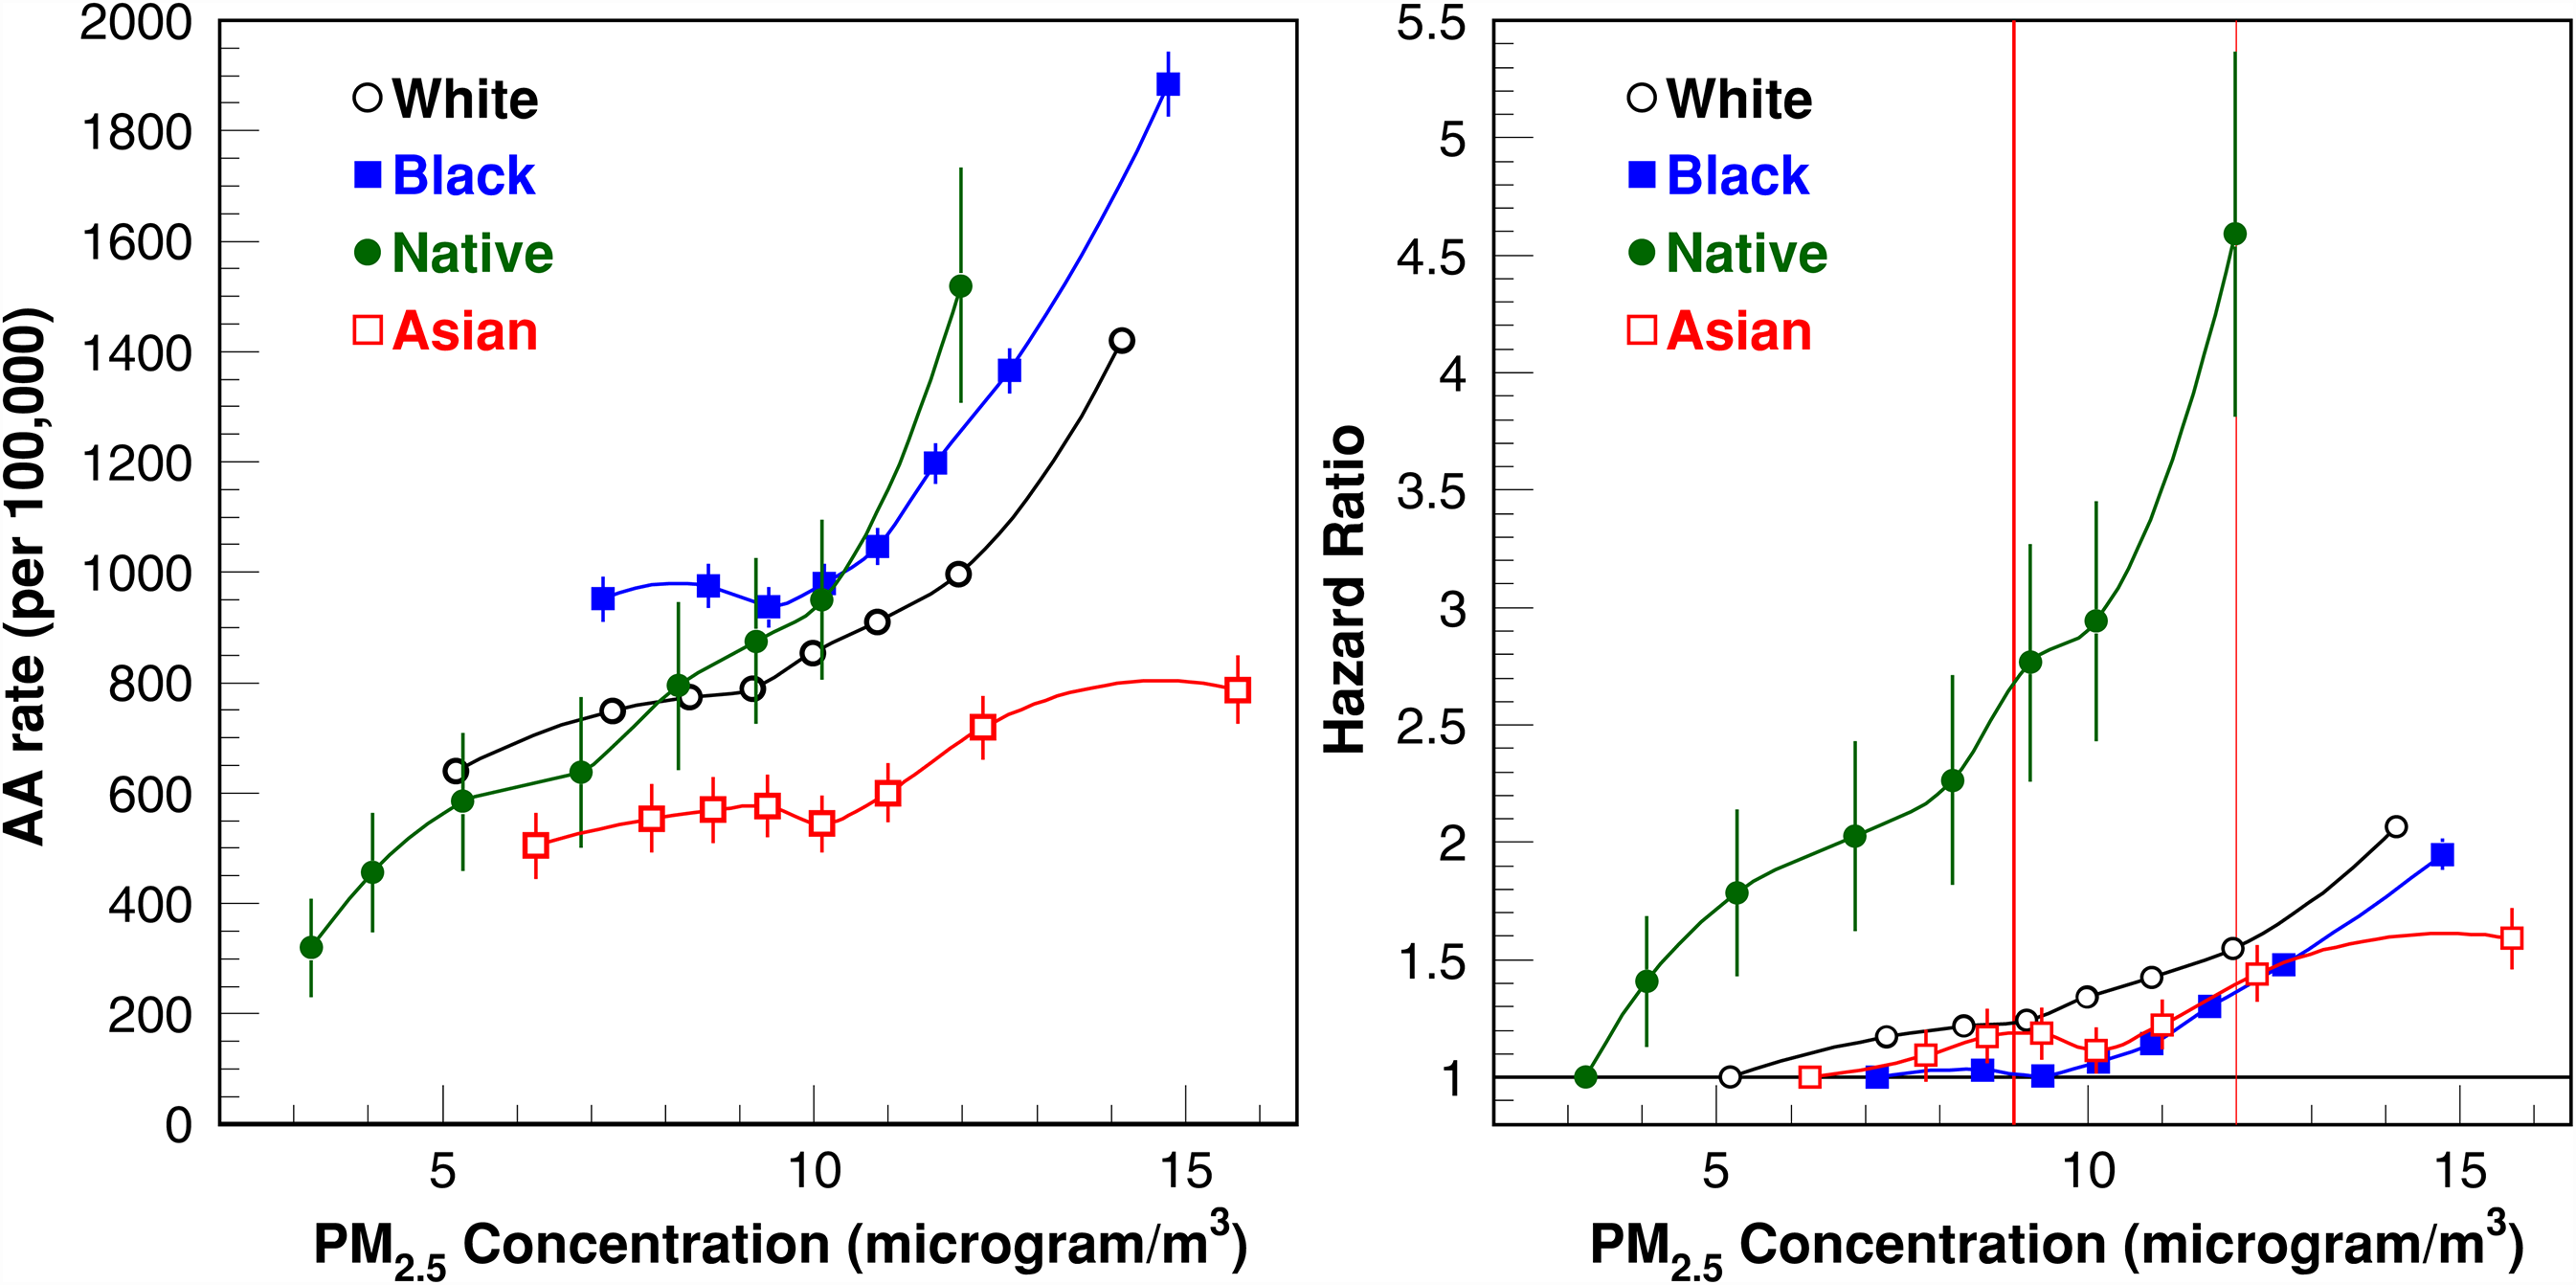
The PM2.5 concentration-response function of age-adjusted (AA) AD risk for race-specific subgroups: White, Black, Native American (“Native”), and Asian. The prior and new EPA standards (i.e.,
Black and Native American subpopulations showed higher absolute AD incidence rates than other racial/ethnic groups, whereas the Asian subpopulation's rate was the lowest. The lowest-exposure category suggests that Native Americans generally reside in areas with lower PM2.5 concentrations, whereas Black and Asian groups face higher peak exposures. Relative concentration-response patterns reveal a steep rise in hazard for Native Americans with increasing PM2.5, whereas Black and Asian subpopulations exhibit the lowest relative ratios. We also depict these hazard functions at two regulatory thresholds: the previous EPA standard of 12 µg/m³ and the new, stricter 9 µg/m³ standard announced on February 7, 2024—a 25% reduction from the prior limit (Figure 3).
Estimates from the Hispanic population demonstrated a unique concentration-response relationship, with AD risk decreasing at PM2.5 exposures >8 µg/m³ (Figure 4)—a pattern distinct from other demographic groups. This pattern held regardless of how “Hispanic” was defined—whether via any single-year self-report or a Research Triangle Institute-derived variable 27 —indicating that fluctuating self-reported ethnicity was not a factor. Further analysis revealed substantial geographic heterogeneity. Examining Hispanic beneficiaries in Florida, California, Texas, and the remaining states (Figure 5) showed that each region alone exhibited a steadily rising concentration-response relationship. However, when these subsets were combined, Florida—where PM2.5 levels are relatively low yet AD incidence is high—merged with California—where PM2.5 is higher, but AD incidence is comparatively low—produced the overall decline noted in Figure 4. This paradox highlights the importance of accounting for geographic distributions of both pollution exposure and disease risk, underscoring why stratified analyses are vital in air-pollution and AD research. This analysis of geographic-related heterogeneity was not possible based on analyses of the relative patterns. Notably, geographic heterogeneity does not explain the rapid incidence increase among Native Americans (Figure 3). The estimates shown in Supplemental Figure 1 show that the patterns from different geographic regions are largely overlapping and follow the overall patterns shown in Figure 3.

The PM2.5 concentration-response function of age-adjusted (AA) AD risk for race/ethnicity-specific subgroups: White and Hispanic origin.

The PM2.5 concentration-response function of age-adjusted (AA) AD risk for 4 subgroups of the U.S. Hispanic subpopulation.
We applied Models M1 and M2 to the absolute concentration-response patterns for the subpopulations shown in Figure 6. Model M1, which has limited flexibility, did not sufficiently capture the observed patterns—particularly at lower PM2.5 levels. This shortcoming is mitigated under Model M2, where the “continuous predictor” for PM2.5 has a degree close to two. In other words, using (PM2.5)² rather than simply PM2.5 appears to fit the data more accurately and could provide a superior predictor in Cox proportional hazards analyses. However, even with these improvements, both M1 and M2 struggle to address the effects of PM2.5 concentrations above 12 µg/m³. Further analyses showed a tendency for incidence rates to level off beyond 15 µg/m³, with the final three data points in most subpopulations (except for the Asian group) indicating such a plateau. Neither M1 nor M2 is structured to capture this high-concentration leveling; more refined extensions of these models will thus be necessary for future work examining these upper-exposure effects.
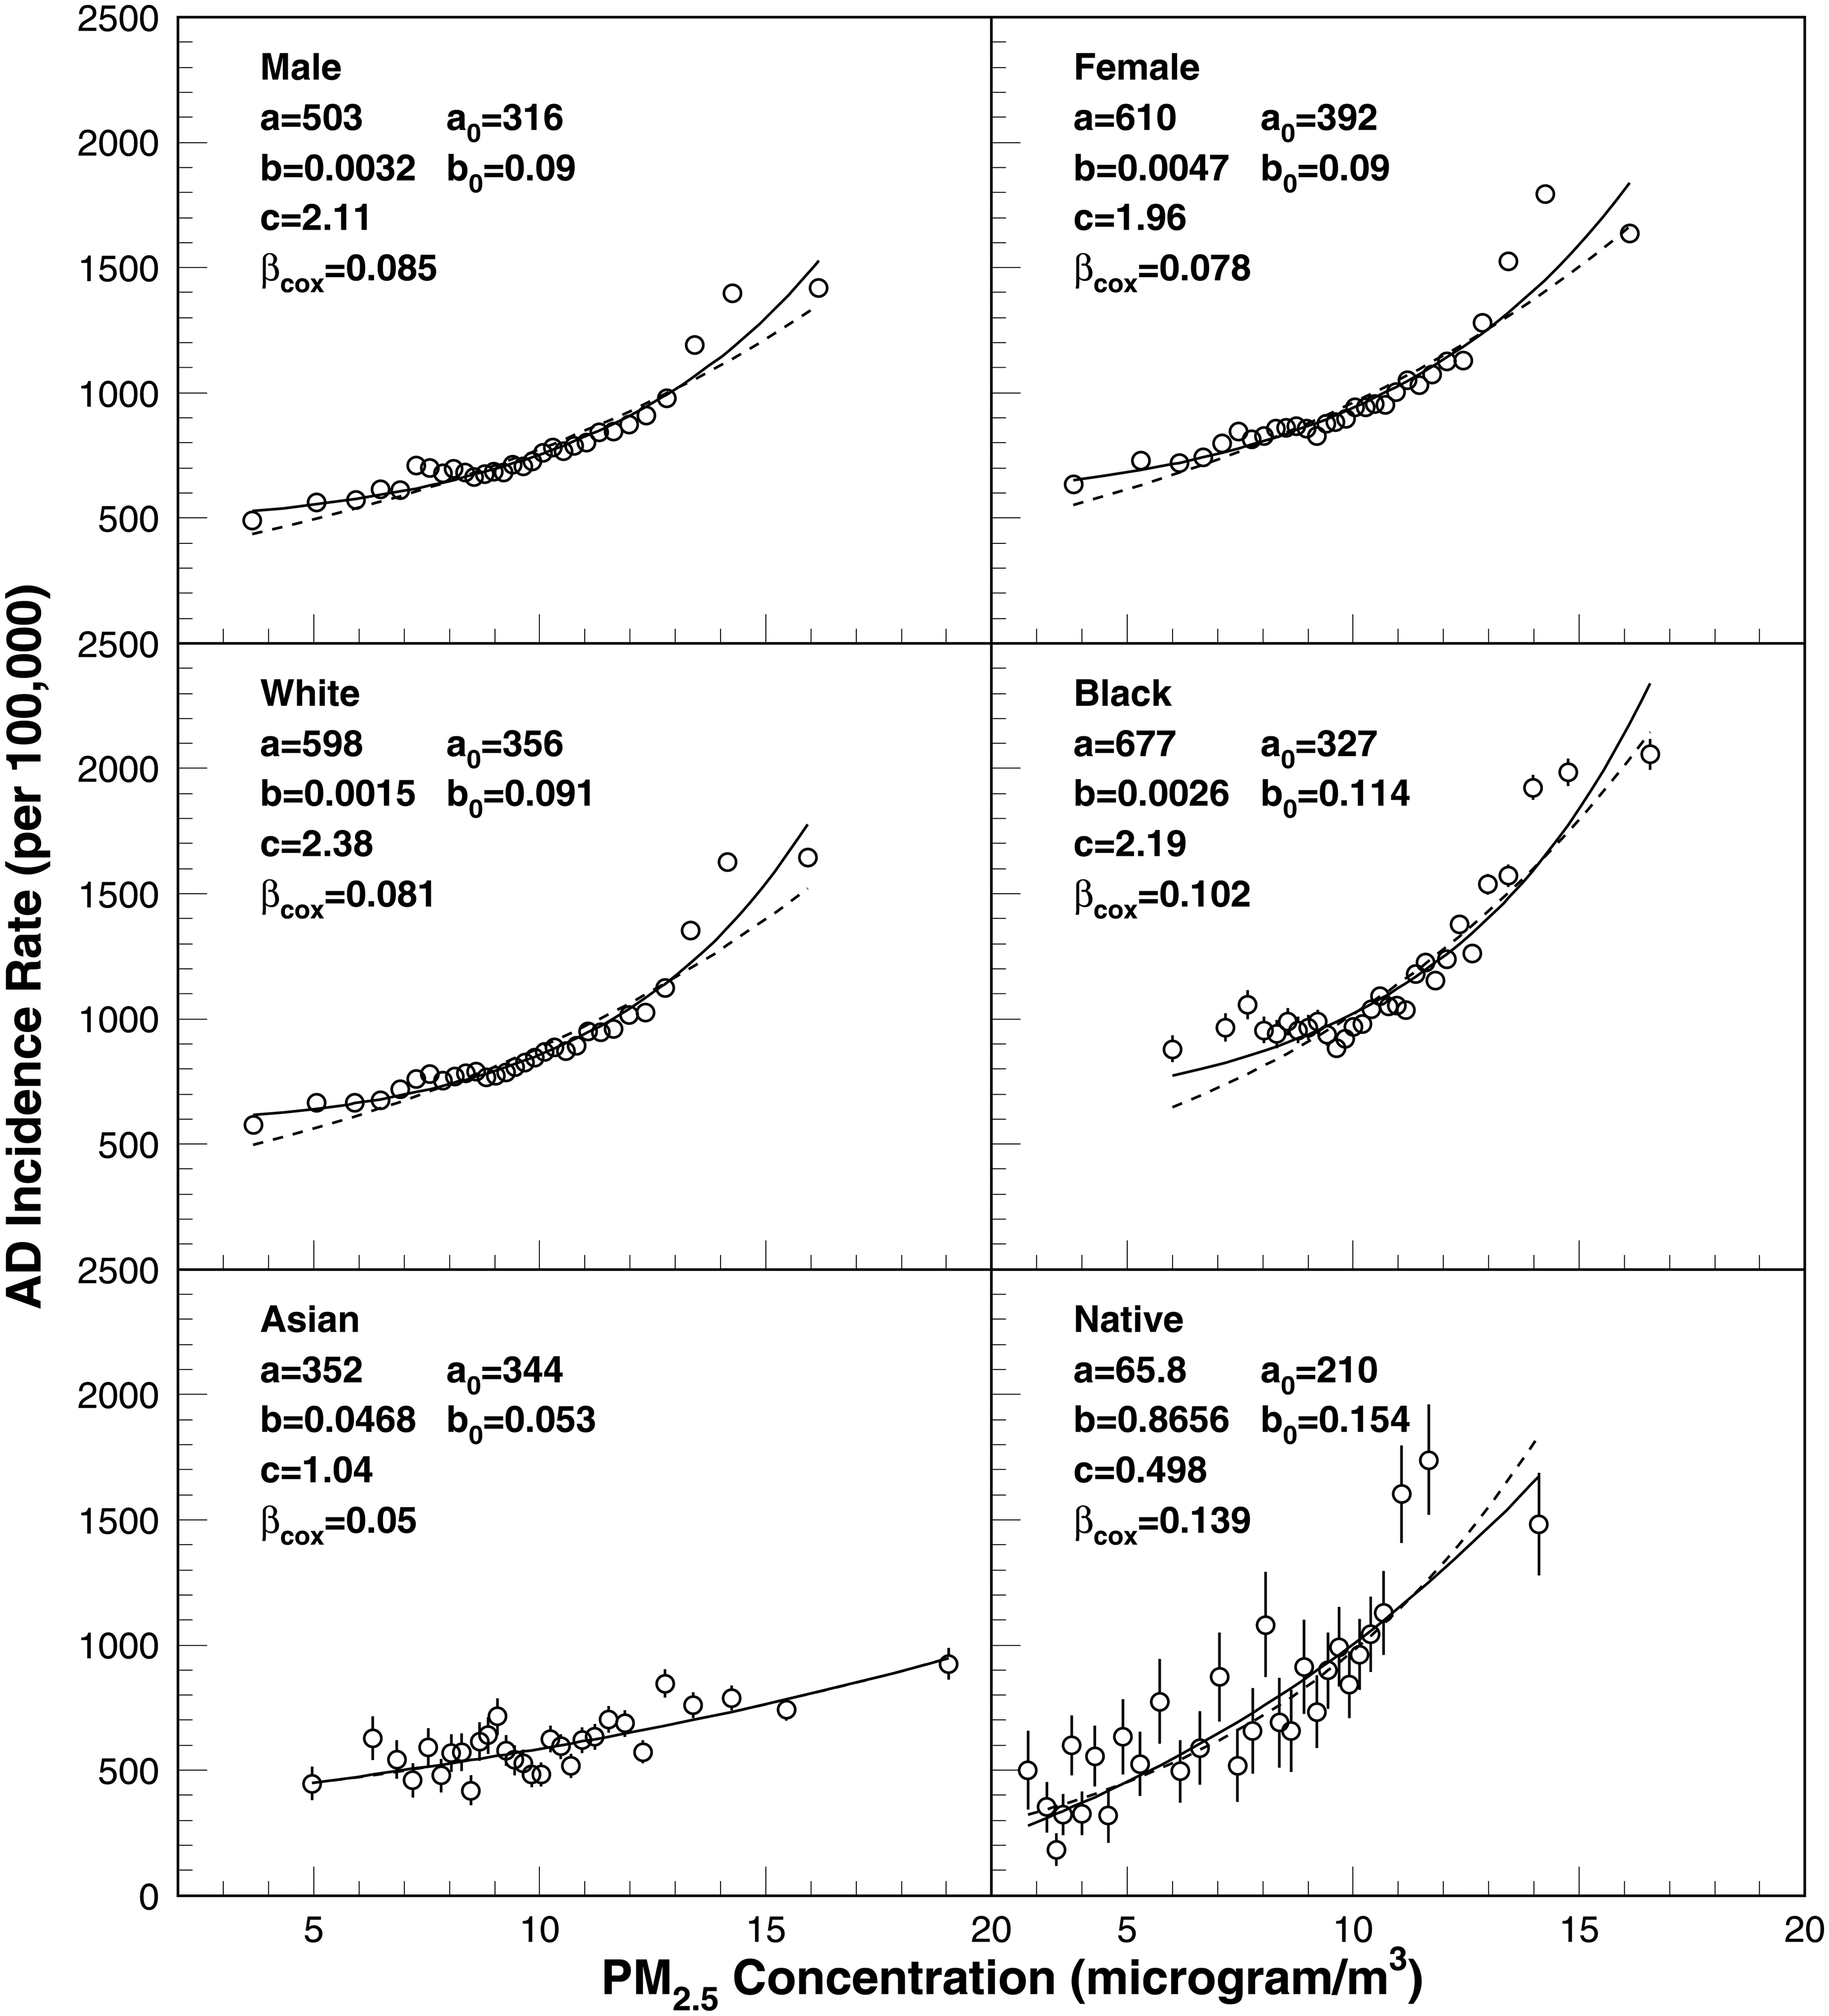
Age-adjusted incidence rates evaluated in 30 exposure groups and the fitting curve obtained using M1 (dashed) and M2 (solid) models. The model parameters for M1 and M2 and the Cox model are also shown.
Discussion
Mounting epidemiological evidence suggests that exposure to PM2.5 is associated with increased risk of AD.6–8 Although the added risk to any one individual may be comparatively small, the widespread prevalence of air pollution implies that, at the population level, the impact could be substantial.5,28,29 Most of the existing research has centered on first-time hospital admissions for AD/ADRD,1–4,30–32 leaving gaps in the understanding of the relationship between concentration levels and incidence.1,8,32
Mechanisms by which ambient air pollution may increase AD/ADRD risk—directly or indirectly via comorbid conditions—remain poorly understood, especially when considering the interplay of age, sex, race/ethnicity, and local environmental factors.4,33 Emerging evidence suggests that PM2.5 can promote the accumulation of amyloid-β (Aβ) and impair its clearance in cerebrospinal fluid. 34 Once a certain exposure threshold is surpassed, clearance-system efficiency significantly declines, resulting in rapid Aβ accumulation.35,36 High concentrations of PM2.5 may also trigger excessive activation of microglia, promoting release of pro-inflammatory factors, such as IL-1β and TNF-α. This neuroinflammatory response can exacerbate neuronal damage, forming a viscous cycle accelerating the progression of neurodegenerative changes characteristic of AD. The sustained activation of microglia and the resulting chronic inflammation may thus contribute to the observed increase in AD incidence associated with elevated PM2.5 exposure. 37 Furthermore, PM2.5 exposure has been shown to compromise the integrity of the blood-brain barrier, allowing neurotoxic substances to enter the brain parenchyma. This disruption facilitates the production of reactive oxygen species, leading to oxidative stress and neuronal damage. 38 Additionally, oxidative stress can contribute to the abnormal phosphorylation of tau protein, another key pathological feature of AD. These mechanisms collectively underscore the multifaceted impact of PM2.5 on brain health and its potential role in AD pathogenesis.38,39 Together, this neurobiological pathophysiology highlights the complex interplay between environmental factors and neurodegenerative processes, further underscoring the importance of more-flexible modeling approaches required to capture these dynamics and evaluate the adequacy of current air-quality standards. Geographic disparities in exposure and healthcare access further complicate this picture, underscoring the value of more-comprehensive studies exploring both biological and social pathways in diverse populations.
Our findings also highlight the importance of examining both absolute and relative concentration-response patterns within a large, nationally representative sample of Medicare beneficiaries. For instance, Figure 3 shows a hazard ratio reaching 4.5 at a common PM2.5 exposure level of 12 µg/m³ for the Native American subpopulation. Parallel analysis of the absolute pattern indicates that part of this large effect stems from a particularly low baseline risk at the lowest concentration, yet it also confirms a rapid uptick in AD risk with increased PM2.5 exposure. Our results for the relative patterns are consistent with those reported by Shi et al. 8 Our estimates demonstrate slightly higher effects: HR for PM2.5 = 15 µg/m³ exceeds 2.0 (Figure 2) versus 1.5 in the prior paper. 8 These differences likely arise from modeling limitations described in the Introduction. The association of PM2.5 and dementia/cognitive impairment was additionally confirmed using UK biobank data 13 and a modeling approach for PM2.5 measured using ground monitors. 40 Overall, these results underscore a strong positive association between PM2.5 and AD risk in the Native American subpopulation. This result updates the findings of Zhu et al., 41 who did not observe a statistically significant effect.
Throughout our analyses, we identified several points illuminating the multifaceted nature of these associations and the significant role of population-level heterogeneity. We observed a generally linear trend at lower PM2.5 concentrations, suggesting that even marginal increases in this range may lead to proportionate increases in AD incidence. However, as PM2.5 concentrations surpassed roughly 12 µg/m³, the concentration-response patterns became more complex and deviated from simple linearity. In some subpopulations, the incidence rates climbed sharply at higher exposure levels, whereas in others the trend leveled off at about 15 µg/m³. These patterns point to possible threshold or saturation effects in the upper range of PM2.5 exposure—phenomena that traditional modeling approaches may struggle to capture adequately without introducing additional flexibility. This inflection point may correspond to a threshold beyond which PM2.5 exposure significantly impairs Aβ-clearance mechanisms, leading to rapid Aβ accumulation in the brain. 42 Such accumulation is a hallmark of AD pathology and may underly the observed nonlinear increase in AD incidence at higher PM2.5 concentrations. Our comparison of modeling approaches showed that a standard exponential or linear model (M1) was too restrictive to capture the concentration-response patterns across the full spectrum of PM2.5 exposures. A modified version (M2)—which included a second-degree polynomial term for PM2.5—improved the fit at both lower and higher exposure levels but still struggled to fully account for the flattening or saturation patterns observed above 15 µg/m³.
Generally, our results are compatible with those found in the literature: i) a linear relationship in the relative pattern of hospital admissions for AD/ADRD 1 for concentrations under 15 µg/m³ followed by leveling off (similarly as in Figure 6) and a new increase above 25 µg/m³, ii) similar patterns of AD incidence8,17 in the region under 16 µg/m³, though limited details8,17 preclude more specific comparison, iii) a strong linear relationship 20 between hospital admissions for a causal model employing Poisson regression up to 15 µg/m³, although both generalized propensity score weighting and matching deviated from linearity with attenuation after 9 µg/m³, iv) a sublinear response relationship at low levels of PM2.5 for hospital admissions, 32 and v) a meta-analysis of nine studies of outpatient and hospitalization-based diagnosis similarly reporting a nonlinear fit for effect sizes of exposure concentrations reflecting a plateau at higher levels 11 and analogous observations for Europe. 12 Consequently, future research may benefit from more-sophisticated modeling strategies, such as spline-based or piecewise approaches, to characterize concentration-response relationships across a wide range of exposure levels, though Shi and collaborators 1 noted that departure from linearity may reflect particular sensitivity of flexible penalized-spline regression to outliers.
The demographic and geographic differences in AD risk further illustrate the intricate interplay between environmental exposures and population factors. Racial disparities emerged, with Black and Native American subpopulations showing the highest absolute incidence rates and the Asian subpopulation the lowest. Population-based studies have demonstrated that individuals carrying the APOE ε4 allele exhibit greater sensitivity to PM2.5-associated cognitive decline. 43 The APOE ε4 genotype is known to impair lipid transport and neuronal-repair mechanisms, potentially exacerbating the detrimental effects of PM2.5-induced oxidative stress and inflammation. 44 This genetic susceptibility may explain the heightened risk of AD observed in APOE ε4 carriers exposed to elevated levels of PM2.5. The association of APOE ε4 with AD risk is strongest in the White subpopulation, with Hispanics falling in an intermediate range. Reports also indicate that the APOE ε4 genotype may not significantly increase the risk of incident AD in African Americans or that its association may be less pronounced compared with other racial groups. 45
Male beneficiaries, despite lower baseline incidence rates compared with females, experienced steeper relative increases in AD risk at higher PM2.5 levels. While females exhibit higher absolute incidence rates of AD, the relative risk increase associated with PM2.5 exposure is steeper in males, particularly at higher concentrations. This disparity may be attributed to sex-specific differences in hormonal regulation, immune response, and oxidative-stress susceptibility. For instance, estrogen has neuroprotective effects that may mitigate PM2.5-induced neuronal damage in females, whereas the absence of such protection in males could render them more vulnerable to the deleterious effects of air pollution on cognitive function.46,47 The higher baseline incidence among women is well documented and is often attributed to longer life expectancy, declining estrogen levels post-menopause, and genetic-environmental interplay. 46 In contrast, subgroups such as men, older adults, individuals with low education, farmers or retired blue-collar workers, and overweight or obese individuals appear to be more susceptible to the effects of PM2.5. 48 These findings underscore the complex interplay of multiple influences in shaping AD risk patterns and highlight the interaction of environmental exposures with educational, occupational, and biological factors to shape subgroup-specific vulnerabilities, emphasizing the value of targeted prevention strategies addressing disparities. This juxtaposition between absolute and relative risk further emphasizes expanding beyond a unitary measure to identify subpopulations bearing the greatest burden of disease, acceleration of risk with rising PM2.5 concentrations, and optimal allocation of public-health resources.
A salient example of how geography can mask or amplify observed effects is emerged from analyses of the Hispanic subpopulation. Upon aggregating data from across the U.S., a paradoxical decline in AD incidence appeared at higher PM2.5 levels. Regional-level analyses revealed considerable variation: in Florida, with relatively low average PM2.5, the incidence of AD was high, whereas in California, known for higher average PM2.5, we observed substantially lower rates of AD. Aggregating these dissimilar geographic patterns produced the overall decline, highlighting the importance of geographically stratified analyses.
These findings have useful implications for public-health policy. The results indicate that adverse effects of PM2.5 on AD risk persist at levels below the previous EPA standard of 12 µg/m³. This observation suggests that reducing exposures toward the new EPA limit of 9 µg/m³—or even closer to the WHO guideline of 5 µg/m³—could yield significant benefits, particularly for older populations. The substantial heterogeneity in AD risk patterns across demographic groups and geographic areas suggests that nationwide prevention strategies require localized adaptation. To effectively reduce the incidence of AD and further decrease related health disparities, air-quality interventions should be integrated with population-specific healthcare programs, community-engaged environmental planning, and targeted monitoring of disease incidence in high-risk subgroups. This comprehensive public-health approach could address the effects of socioeconomic factors governing AD risks and varying sensitivity to exposure observed across subpopulations.
A logical extension of the analysis presented in this paper would consolidate the integration of AD mechanisms and disease pathways into an epidemiological modeling framework. Such a comprehensive model could integrate the biological processes underlying AD risk with population-level patterns of the disease in the U.S. and would benefit from the following components: i) life-course patterns of exposure (fetus, childhood development, young adult, older adult), ii) predominant pathways of PM2.5 on the brain (blood-brain barrier, gut microbiota, olfactory bulb, nasal microbiota, optic nerve, skin), iii) molecular mechanisms of neurotoxicity caused by exposure to PM2.5 (neuroinflammation, oxidative stress, mitochondrial dysfunction, neuronal apoptosis), iv) mechanisms of DNA methylation, autophagy, imbalance of blood homeostasis, v) genetic characteristics associated with increased risk of AD and/or higher vulnerability to PM2.5 exposures, vi) the presence of comorbid conditions shown to increase the risk of AD (e.g., diabetes, arterial hypertension, traumatic brain injury), and vii) behavioral factors and social determinants associated with increased AD risk. Although many of these components have been extensively studied and the importance of accounting for multiple pathways and risk factors has been widely recognized,49–53 the development of a joint model that integrates these elements into a unified epidemiological framework remains a task for future research. Such an approach would require detailed data from laboratory experiments, clinical assessments, population surveys, and individualized exposure histories to PM2.5, including its life-course trajectory and chemical composition. Notably, PM2.5 constituents vary by source, and their effects on AD risk differ by compound—for example, black carbon. 54 A critical aspect of this model should incorporate investigation of the non-linear concentration–response relationship between long-term PM2.5 exposure and both AD risk and patient survival, with particular emphasis on moderate and low exposure levels, including those below the current U.S. EPA and global WHO standards.55,56 This focus is essential for informing more-effective intervention strategies and environmental-policy decisions.
This analysis has several limitations. First, the potential exists for selection bias due to the exclusion of individuals with a substantial proportion of their enrollment time in Medicare Advantage plans. This bias may arise if enrollment in Medicare Advantage is correlated with environmental exposures specific to the regions where individuals reside. Second, important predictors such as socioeconomic status, smoking history, and genetic factors such as the APOE genotype are not available in Medicare claims data and thus could not be included in the analyses. Potential residual confounding stemming from this limitation can be addressed through supplemental analyses of linked data on socioeconomic indices, genotyping, and other salient biomarkers. Third, the use of ZIP-code-level data—the smallest geographic unit available in the dataset—may lead to exposure misclassification, as ZIP-code-level averages of PM2.5 may not capture intra-ZIP variability or account for residential mobility. Recent studies, however, demonstrated minimal bias in estimated effect sizes for mortality studies, 57 consistent prediction accuracy in both urban and rural environments, 58 and the identifiability of spatial homogeneity in linked mortality data. 59 Fourth, although the findings allow for interpretations of PM2.5 effects on AD risk, the current analysis does not integrate mechanistic pathways into an epidemiological-modeling framework.
Ultimately, our work highlights the importance of considering both absolute and relative concentration-response patterns in understanding fully the scope of PM2.5 impacts on AD risk. By demonstrating how factors such as age, sex, race/ethnicity, and geographic location shape exposure-risk relationships, we provide a foundation for more-nuanced modeling, improved public-health planning, and targeted interventions. Moving forward, additional work is necessary to explain observed subpopulation disparities through comborbidities and other associated risk factors and identify causal factors mediating the relationship between air pollutants and AD. Furthermore, linking these epidemiological findings to mechanistic studies—such as those exploring neuroinflammatory or vascular pathways—may deepen understanding of how PM2.5 triggers or accelerates AD neuropathology, thereby paving the way for more-effective and efficient policies and prevention efforts.
Footnotes
Acknowledgments
The authors express their gratitude to Dr. H. Kim Lyerly for his insightful feedback on the results.

Ethical considerations
Data analysis was designed and performed according to the ethical standards of the responsible committee on human studies and the Helsinki Declaration (1975, revised in 1983).
Consent to participate
This study was approved by the Duke University Health System Institutional Review Board. Informed consent was not necessary.
Author contributions
Funding
The authors disclosed receipt of the following financial support for the research, authorship, and/or publication of this article: This work was supported by the National Institute on Aging, U.S. Department of Defense (grant number R01-AG057801, R01-AG066133, HT9425-24-1-0255).
Declaration of conflicting interests
The authors declared no potential conflicts of interest with respect to the research, authorship, and/or publication of this article.
Data availability statement
Restrictions apply to the availability of the data. The data used for the analyses is considered identifiable protected research data and the access to it is regulated by HIPAA and CMS. Researchers wishing to obtain access to the data must have appropriate professional qualifications allowing to conduct human-subjects research and seek IRB and CMS approval. Researchers wishing to reproduce our research, in whole or in part, may contact the Principal Investigator of the project, Dr. Igor Akushevich, for possible access to the raw materials and the detailed archives of the programs used to prepare the data and perform the analysis.
Supplemental material
Supplemental material for this article is available online.
References
Supplementary Material
Please find the following supplemental material available below.
For Open Access articles published under a Creative Commons License, all supplemental material carries the same license as the article it is associated with.
For non-Open Access articles published, all supplemental material carries a non-exclusive license, and permission requests for re-use of supplemental material or any part of supplemental material shall be sent directly to the copyright owner as specified in the copyright notice associated with the article.
