
Abstract
Background
Alzheimer's disease (AD) exhibits significant clinical and pathological heterogeneity, particularly during the mild cognitive impairment (MCI) transitional stage. Current understanding of the molecular drivers underlying distinct MCI progression trajectories remains incomplete, hindering the development of personalized interventions.
Objective
This study aims to integrate transcriptomic, epigenomic, and metabolomic data to identify distinct trajectories in the progression from MCI to AD, and to explore the underlying disease heterogeneity.
Methods
We integrated transcriptomic, epigenomic, and metabolomic data from MCI patients to model the progression to AD and stratified them into subtypes. We then examined molecular differences between MCI and AD within each subtype, identifying key immune microenvironments and regulatory pathways via immune cell infiltration analysis, WGCNA, and GO/KEGG analyses. Finally, we applied Cox regression to identify prognostic biomarkers and built a random forest prognostic model.
Results
Our analysis identified two distinct MCI-to-AD progression subtypes. Subtype 1 was marked by metabolic dysregulation and slower cognitive decline, while Subtype 2 was driven by chronic immune activation and exhibited faster cognitive decline. The trajectory subtypes captured molecular perturbations that were missed by traditional unclustered methods. Prognostic models based on these molecular signatures predicted disease progression over 1–5 years, with AUROC values ranging from 0.851 to 0.893 for Subtype 1 and from 0.878 to 0.927 for Subtype 2.
Conclusions
Our findings highlight the importance of multi-omics trajectory stratification in understanding the heterogeneity of AD progression. The identification of two distinct progression trajectories provides insights into the underlying mechanisms of AD.
Keywords
Introduction
Alzheimer's disease (AD), a highly heterogeneous neurodegenerative disorder, exhibits remarkable diversity in both clinical progression and pathological mechanisms. 1 This heterogeneity is particularly prominent at the mild cognitive impairment (MCI) stage—considered the prodromal phase of AD—where patients demonstrate vastly different conversion trajectories ranging from long-term stability to rapid progression, suggesting distinct molecular driving mechanisms. 2 Current AD clinical trials are hindered by heterogeneous treatment responses, which may arise from the inclusion of biologically distinct subgroups under a single diagnostic framework. 3 However, the dynamic molecular processes underlying MCI-to-AD conversion remain poorly understood at a systems level.
Recent breakthroughs in multi-omics technologies have provided new opportunities to address this scientific challenge. Transcriptomics can reveal disease-associated gene expression changes, 4 epigenomics captures epigenetic dysregulation, 5 while metabolomics reflects downstream functional metabolic disturbances. 6 Integration of these multidimensional data facilitates the construction of a comprehensive molecular atlas of MCI-to-AD conversion.
Previous studies have made important but limited contributions to understanding AD heterogeneity. Shigemizu et al. and Lian et al. relied solely on single-omics approaches (genomics and transcriptomics, respectively) to investigate AD subtypes, inevitably providing incomplete molecular portraits of disease heterogeneity.7,8 While Eteleeb et al. identified molecular subtypes of AD through multi-omics analysis, their focus was restricted to established AD cases. 9 Iturria-Medina et al. constructed multi-omics trajectory models of AD but did not specifically analyze the dynamic features of MCI progression. 10 These research gaps have limited our understanding of the mechanisms underlying AD heterogeneity at early stages.
To address these challenges, we performed multi-omics trajectory inference and subtype-specific validation to characterize heterogeneous progression patterns from MCI to AD, and identify potential biomarkers for prognosis prediction. An overview of our study design is illustrated in Figure 1. By integrating cross-sectional multi-omics data, our approach successfully delineated two biologically and prognostically distinct trajectories—a metabolism-dysregulated Subtype 1 and an immune-dysfunctional Subtype 2. The prognostic models based on these trajectory-defined subtypes demonstrated excellent predictive performance. Furthermore, the identification of subtype-specific progression markers may facilitate early intervention, particularly for patients following aggressive progression trajectories who would likely benefit most from timely therapeutic intervention.

An overview of the study design. Transcriptomic, epigenomic, and metabolomic data were extracted from the ADNI datasets Multi-omics comparative trajectory inference was applied to integrate the datasets and identify heterogeneous molecular progression subtypes among MCI and AD subjects. Subsequently, mechanistic validations were performed at multiple levels: CIBERSORT was used to characterize immune cell infiltration and define subtype-specific immune landscapes, while WGCNA was employed to identify key regulatory modules, followed by functional enrichment analyses. Finally, a prognostic model was constructed using a random forest approach. SNF: Similarity Network Fusion; MST: Minimum Spanning Tree; WGCNA: Weighted Correlation Network Analysis.
Methods
Datasets
Data used in the preparation of this article were obtained from the Alzheimer's Disease Neuroimaging Initiative (ADNI) database (adni.loni.usc.edu). The ADNI was launched in 2003 as a public-private partnership, led by Principal Investigator Michael W. Weiner, MD. The original goal of ADNI was to test whether serial magnetic resonance imaging (MRI), positron emission tomography (PET), other biological markers, and clinical and neuropsychological assessment can be combined to measure the progression of MCI and early AD. The current goals include validating biomarkers for clinical trials, improving the generalizability of ADNI data by increasing diversity in the participant cohort, and to provide data concerning the diagnosis and progression of AD to the scientific community. For up-to-date information, see adni.loni.usc.edu. The final analytical cohort comprised 217 participants, including 182 individuals diagnosed with MCI at baseline and 35 patients with AD at enrollment, all of whom had complete blood-derived transcriptomic, epigenomic, and metabolomic data available. The Affymetrix Human Genome U219 Array, which contains 530,467 probes for 49,293 transcripts, was used for expression profiling. Raw expression values were normalized using the Robust Multi-array Average method. Methylation profiling was performed using the Illumina Infinium HumanMethylationEPIC BeadChip Array, with raw IDAT files read into R for quality control (QC) and annotation using the ChAMP package. 11 Metabolites were measured using the AbsoluteIDQ-p180 kit, employing UPLC/MS/MS technology to analyze 186 metabolites, with data provided by the Alzheimer's Disease Metabolomics Consortium (ADMC). After QC, including exclusion of metabolites with high detection limits and multivariate outliers, a final set of 160 metabolites was retained for analysis.
Multi-omics contrastive trajectory inference
In this study, we employed the mcTI method proposed by Iturria-Medina et al., 10 which aimed to identify distinct disease subtypes associated with AD progression by integrating multiple omics datasets, including transcriptomics, epigenomics, and metabolomics. The core of the mcTI approach lay in computing a personalized multi-omics disease progression score (mDPS) that quantified each individual's potential trajectory from MCI toward AD, and in delineating molecular subtypes based on their distribution in the integrated multi-omics space.
As illustrated in Figure 1, mcTI first performed dimensionality reduction for omics modalities with high dimensionality. Specifically, for transcriptomic and epigenomic data, where the number of features far exceeded the number of samples, contrastive principal component analysis (cPCA) was applied to extract low-dimensional representations that emphasized patterns enriched in the AD group while suppressing background noise. cPCA identified components that maximized variance in the target group (AD subjects) while minimizing variance in the background group (MCI subjects), by computing a weighted difference between the respective covariance matrices. To enhance robustness, multiple contrast parameters (α), spanning 100 logarithmically spaced values between 0.01 and 100, were tested. The subspaces generated by different α values were clustered based on their similarity, which was quantified using principal angles between subspaces—smaller principal angles indicate higher similarity. Specifically, the pairwise principal angles between subspaces were computed to construct a similarity matrix, upon which spectral clustering was applied to group subspaces with similar structural characteristics. The target data were projected onto each of the representative subspaces, and the Gap statistic was used to evaluate the clustering tendency within each projected space. The subspace yielding the highest Gap value was selected as the optimal projection space for downstream analyses, as it best captured the structural differences in the target data relative to the background.
Subsequently, the reduced omics representations were integrated using Similarity Network Fusion (SNF), which constructed a unified subject–subject similarity network. SNF first generated individual similarity networks for each omics modality using a radial basis function (RBF) kernel, and then iteratively fused them, effectively capturing complementary information across the datasets and mitigating modality-specific noise.
Once the fused network was established, mcTI constructed a minimum spanning tree over the network and calculated the shortest path from each participant to the MCI group. These paths defined the individual mDPS values, reflecting each subject's relative distance from the background (MCI) state within the multi-omics space. The mDPS values were normalized to the range [0, 1], with higher scores indicating closer proximity to the AD state and lower scores reflecting greater similarity to the MCI state.
Finally, mcTI applied the Expectation–Maximization (EM) algorithm to identify molecular subtypes by clustering participants within the integrated multi-omics space. The EM procedure iteratively refined subtypes by alternating between computing subtype-specific mDPS prediction models using leave-one-out validation and reassigning subjects based on minimal prediction error until convergence. These subtypes represented distinct trajectories of disease progression and reflected the underlying heterogeneity in the molecular mechanisms of AD development.
Weighted gene co-expression network analysis
The R package WGCNA was used to construct co-expression networks for each trajectory subtype, utilizing transcriptomics, epigenomics, and metabolomics data. 12 This approach aimed to identify modules strongly associated with clinical features, thereby highlighting biologically relevant networks that could potentially play a role in the progression from MCI to AD within each trajectory.
Functional enrichment analysis
The R package clusterProfiler was used to perform Kyoto Encyclopedia of Genes and Genomes (KEGG) and Gene Ontology (GO) analyses to identify the pathways associated with genes in the WGCNA modules that are linked to clinical features. 13
Immune cell infiltration analysis
Immune cell infiltration was analyzed using the R package CIBERSORT to estimate the relative abundance of 22 immune cell types from the transcriptomic data of each subject. 14 This method allows the deconvolution of gene expression profiles to estimate the relative proportions of immune cell types in subjects with MCI and AD across different trajectory subtypes. Generalized linear models were used to test for significant differences in immune cell proportions between subtypes, with adjustment for age, sex, education years, and APOE ε4 status.
Prognostic model development
To develop a prognostic tool for predicting MCI-to-AD progression, univariate Cox regression analysis was performed to identify progression biomarkers. Significant biomarkers from transcriptomic, epigenomic, and metabolomic data were used to construct a RF model. To ensure robustness and mitigate overfitting, five-fold cross-validation was applied during model training, and within each fold, hyperparameters were optimized using grid search. Using the grid search method, we evaluated numerous combinations of key parameters, including the number of trees [10, 20, …, 100], the maximum tree depth [3, 5, 7, 9], and the minimum number of samples required at a leaf node [1, 2, 4]. To address class imbalance, class weights were adjusted inversely proportional to class frequencies. All features were standardized prior to model fitting. The model's performance was validated using area under the receiver operating characteristic (AUROC) values across multiple time points (1–5 years) for each trajectory subtype.
Statistical analysis
For transcriptomic, epigenomic, and metabolomic data, differential analyses were conducted using the R package limma, with age, sex, education years, and APOE ε4 status included as covariates. 15 Differentially expressed genes (DEGs), differential methylation positions (DMPs), and differential abundant metabolites (DAMs) were considered significant if the |log fold change (FC)| was greater than 0.2 and the p-value was less than 0.05. Continuous clinical and neuroimaging variables were compared using t-test, and categorical variables were compared using chi-square test. All analyses were performed using R software (version 4.4.1), with statistical significance set at p < 0.05.
Results
Clinical differences between trajectory subtypes
Table 1 shows the baseline clinical and neuroimaging differences between MCI individuals from different trajectory subtypes. In Subtype 2, MCI individuals exhibited a significantly higher proportion of females compared to Subtype 1, as well as better cognitive performance, indicated by lower CDRSB scores. Additionally, after normalization by intracranial volume (ICV), individuals in Subtype 2 exhibited smaller ventricular volumes and larger hippocampal and whole-brain volumes, further indicating a less advanced neurodegenerative state at baseline. Notably, there were no differences in APOE ε4 carrier status between the two subtypes. Although trajectory subtypes were identified based on baseline multi-omics profiles of participants, we further evaluated their longitudinal cognitive trajectories using follow-up data from the ADNI, in which participants are systematically assessed every six months. Figure 2 illustrates the changes in cognitive scores over time for these individuals. It is evident that cognitive function in Subtype 2 MCI individuals deteriorated more rapidly, particularly after the three-year follow-up, suggesting a faster progression of cognitive decline in this trajectory.
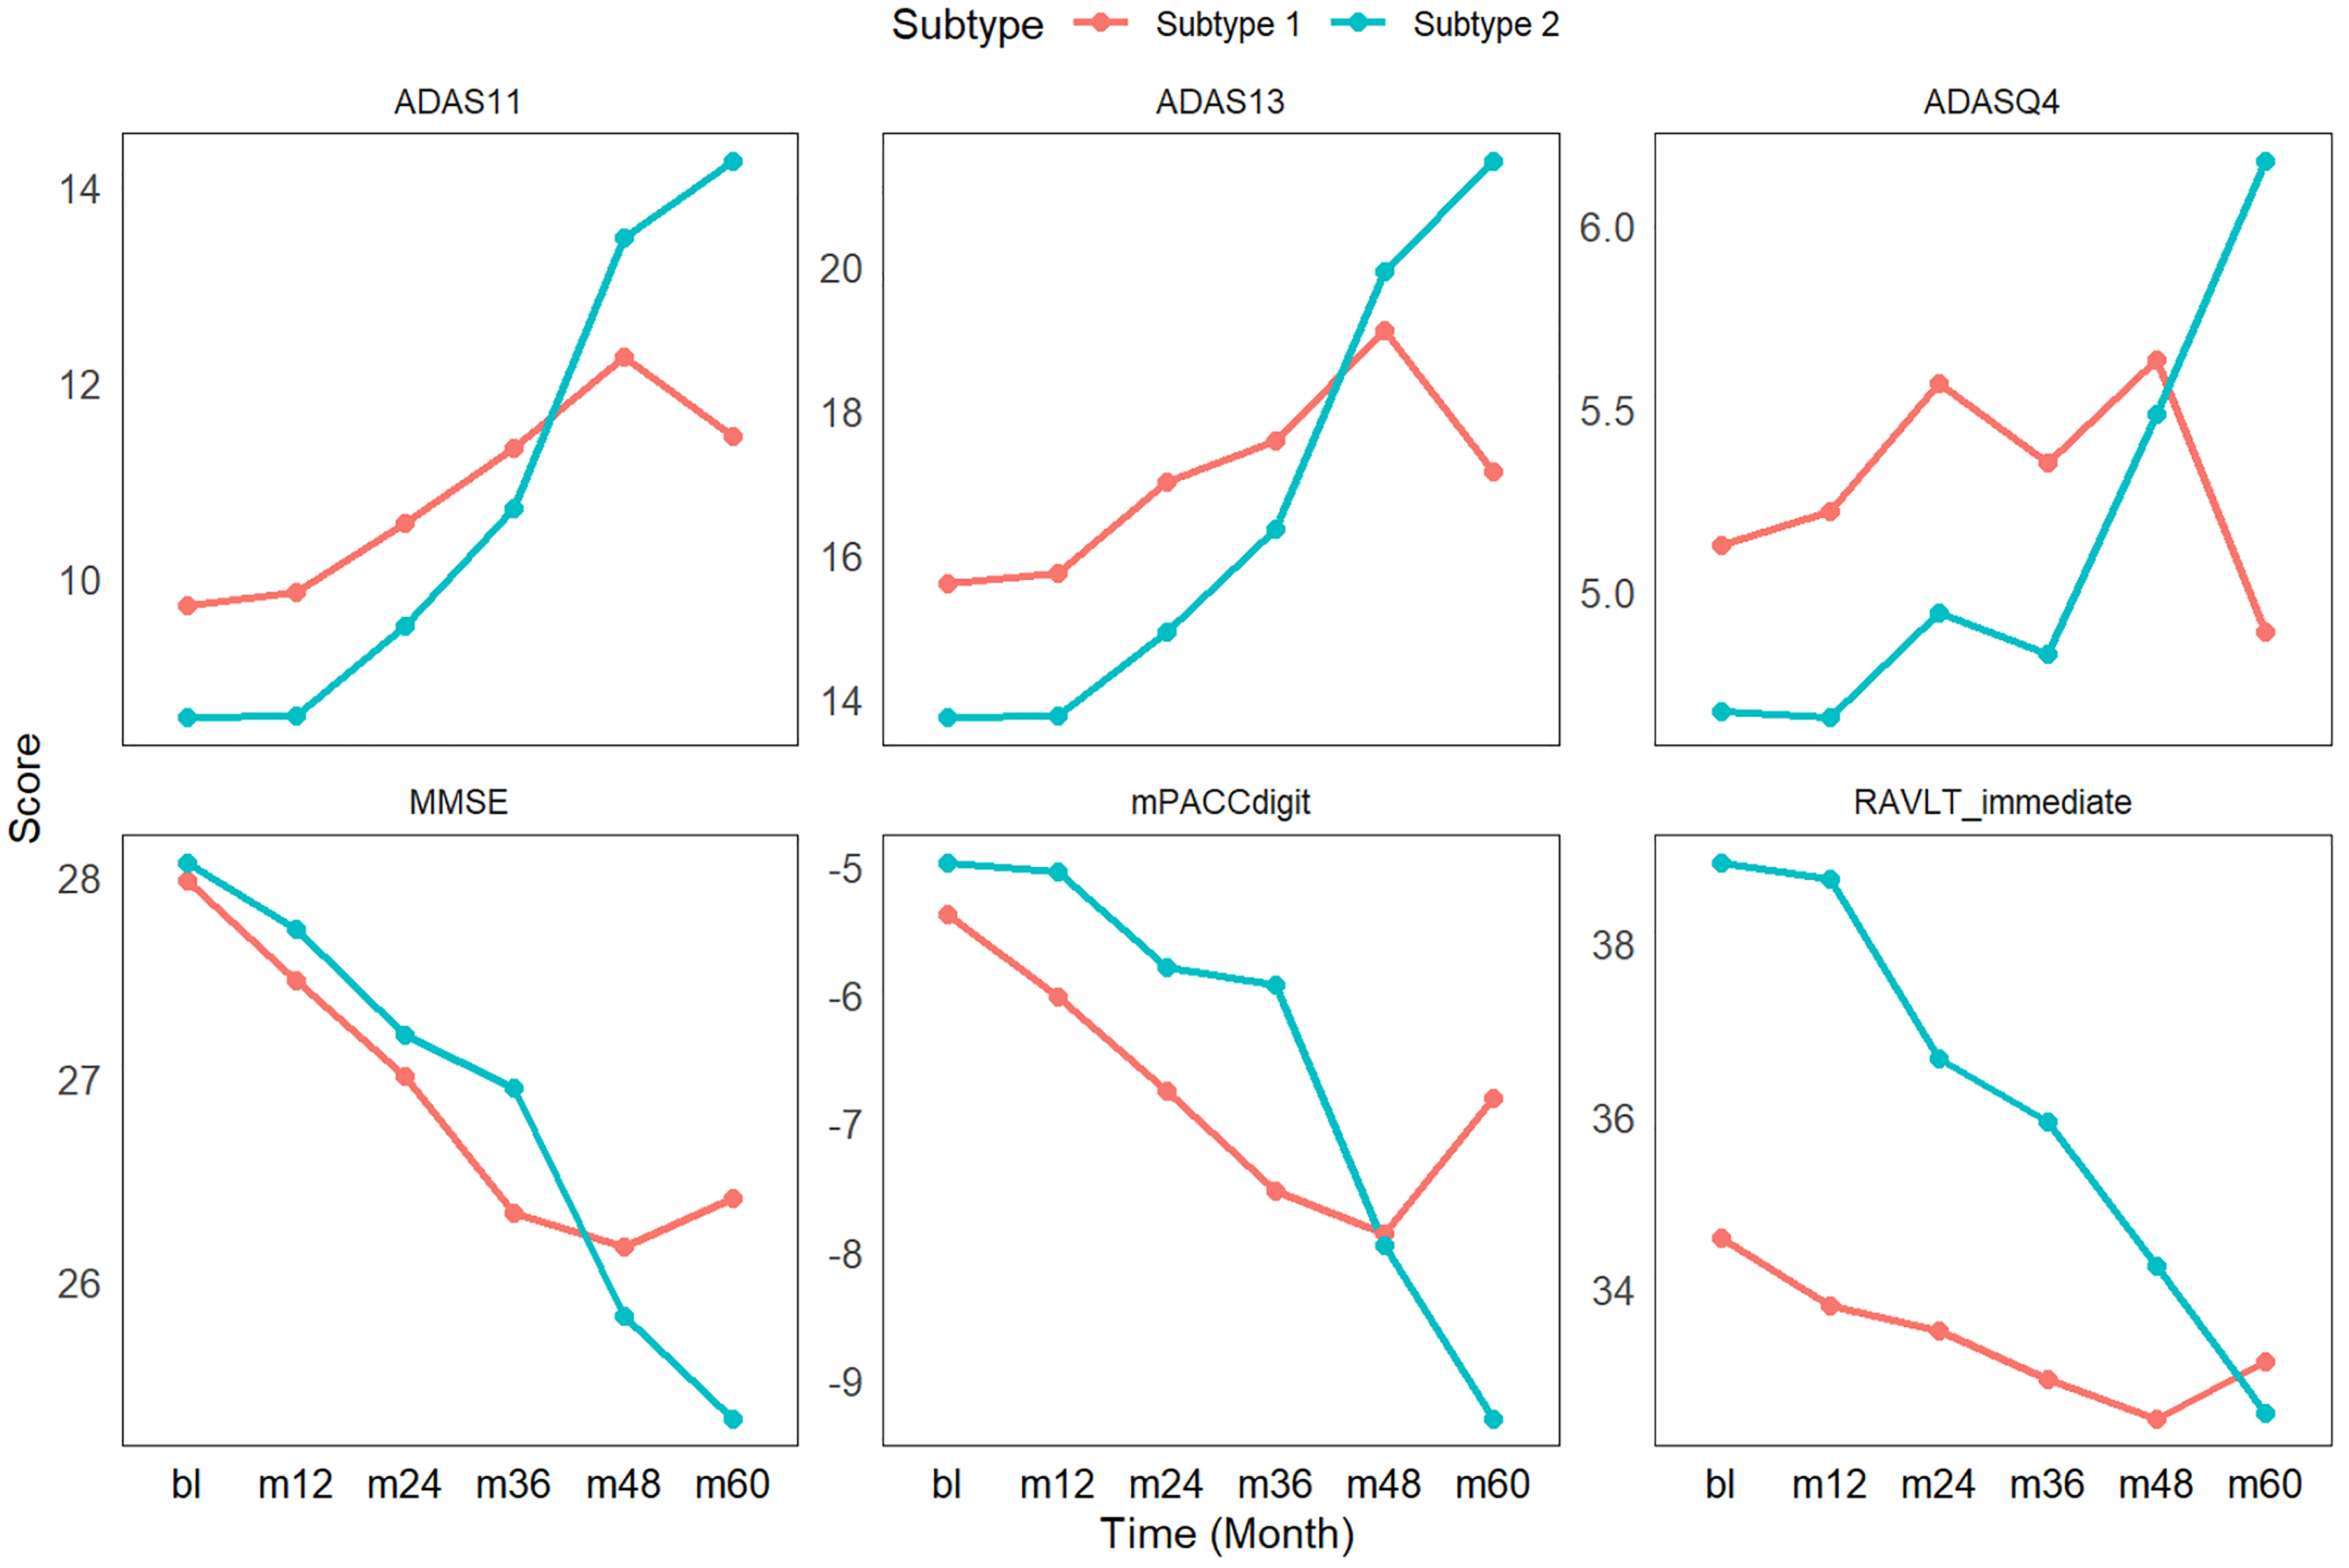
Cognitive trajectories of MCI subtypes over 5-year follow-up. Subtype 2 demonstrates significantly steeper cognitive decline compared to Subtype 1, particularly after the 3-year timepoint, despite better baseline performance. ADAS11: Alzheimer's Disease Assessment Scale – Cognitive Subscale (11-item version); ADAS13: Alzheimer's Disease Assessment Scale-Cognitive Subscale (13-item version); ADASQ4: Alzheimer's Disease Assessment Scale-Question 4; MMSE: Mini-Mental State Examination; mPACCdigit: Preclinical Alzheimer's Cognitive Composite Scores; RAVLT_immediate: Rey Auditory Verbal Learning Test-Immediate Recall.
Baseline characteristics of MCI subtypes.
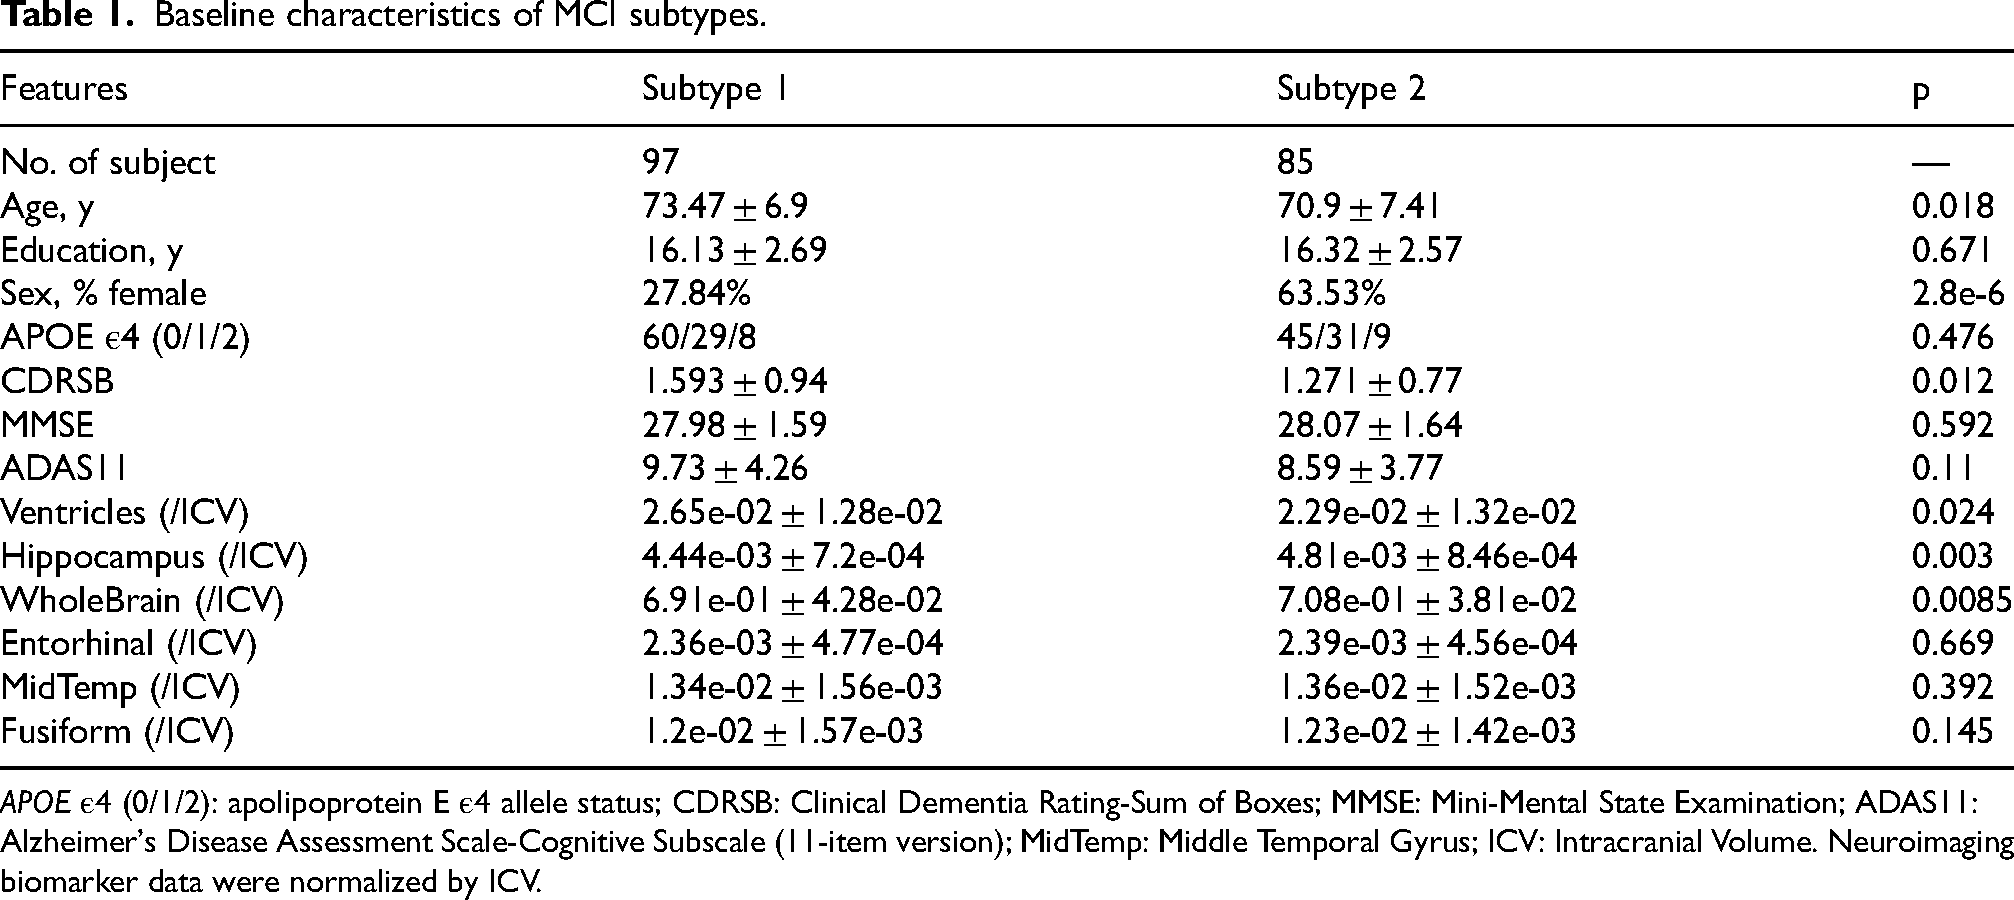
APOE ε4 (0/1/2): apolipoprotein E ε4 allele status; CDRSB: Clinical Dementia Rating-Sum of Boxes; MMSE: Mini-Mental State Examination; ADAS11: Alzheimer's Disease Assessment Scale-Cognitive Subscale (11-item version); MidTemp: Middle Temporal Gyrus; ICV: Intracranial Volume. Neuroimaging biomarker data were normalized by ICV.
Multi-omics profiling reveals trajectory-specific molecular signatures
In our analysis, we identified DEGs, DMPs, and DAMs in both MCI and AD individuals across the trajectory subtypes, revealing substantial specific molecular alterations not captured by the traditional unclustered analysis.
At the transcriptomic level, Subtype 1 exhibited 192 DEGs, with 87 (45.3%) overlapping with the 457 DEGs identified in non-clustered analysis, while 102 (53.1%) were subtype-specific. In contrast, Subtype 2 demonstrated dramatically more extensive gene expression changes, showing 2356 DEGs – an 11-fold increase compared to Subtype 1. Among these, 408 (17.3%) overlapped with unclustered DEGs (89% coverage), while 1932 (82.0%) were unique to Subtype 2. Notably, the combined DEGs from both subtypes (2485) captured 435 (95.2%) of the unclustered DEGs, with only 4.8% remaining undetected (Figure 3(a) and (b)).
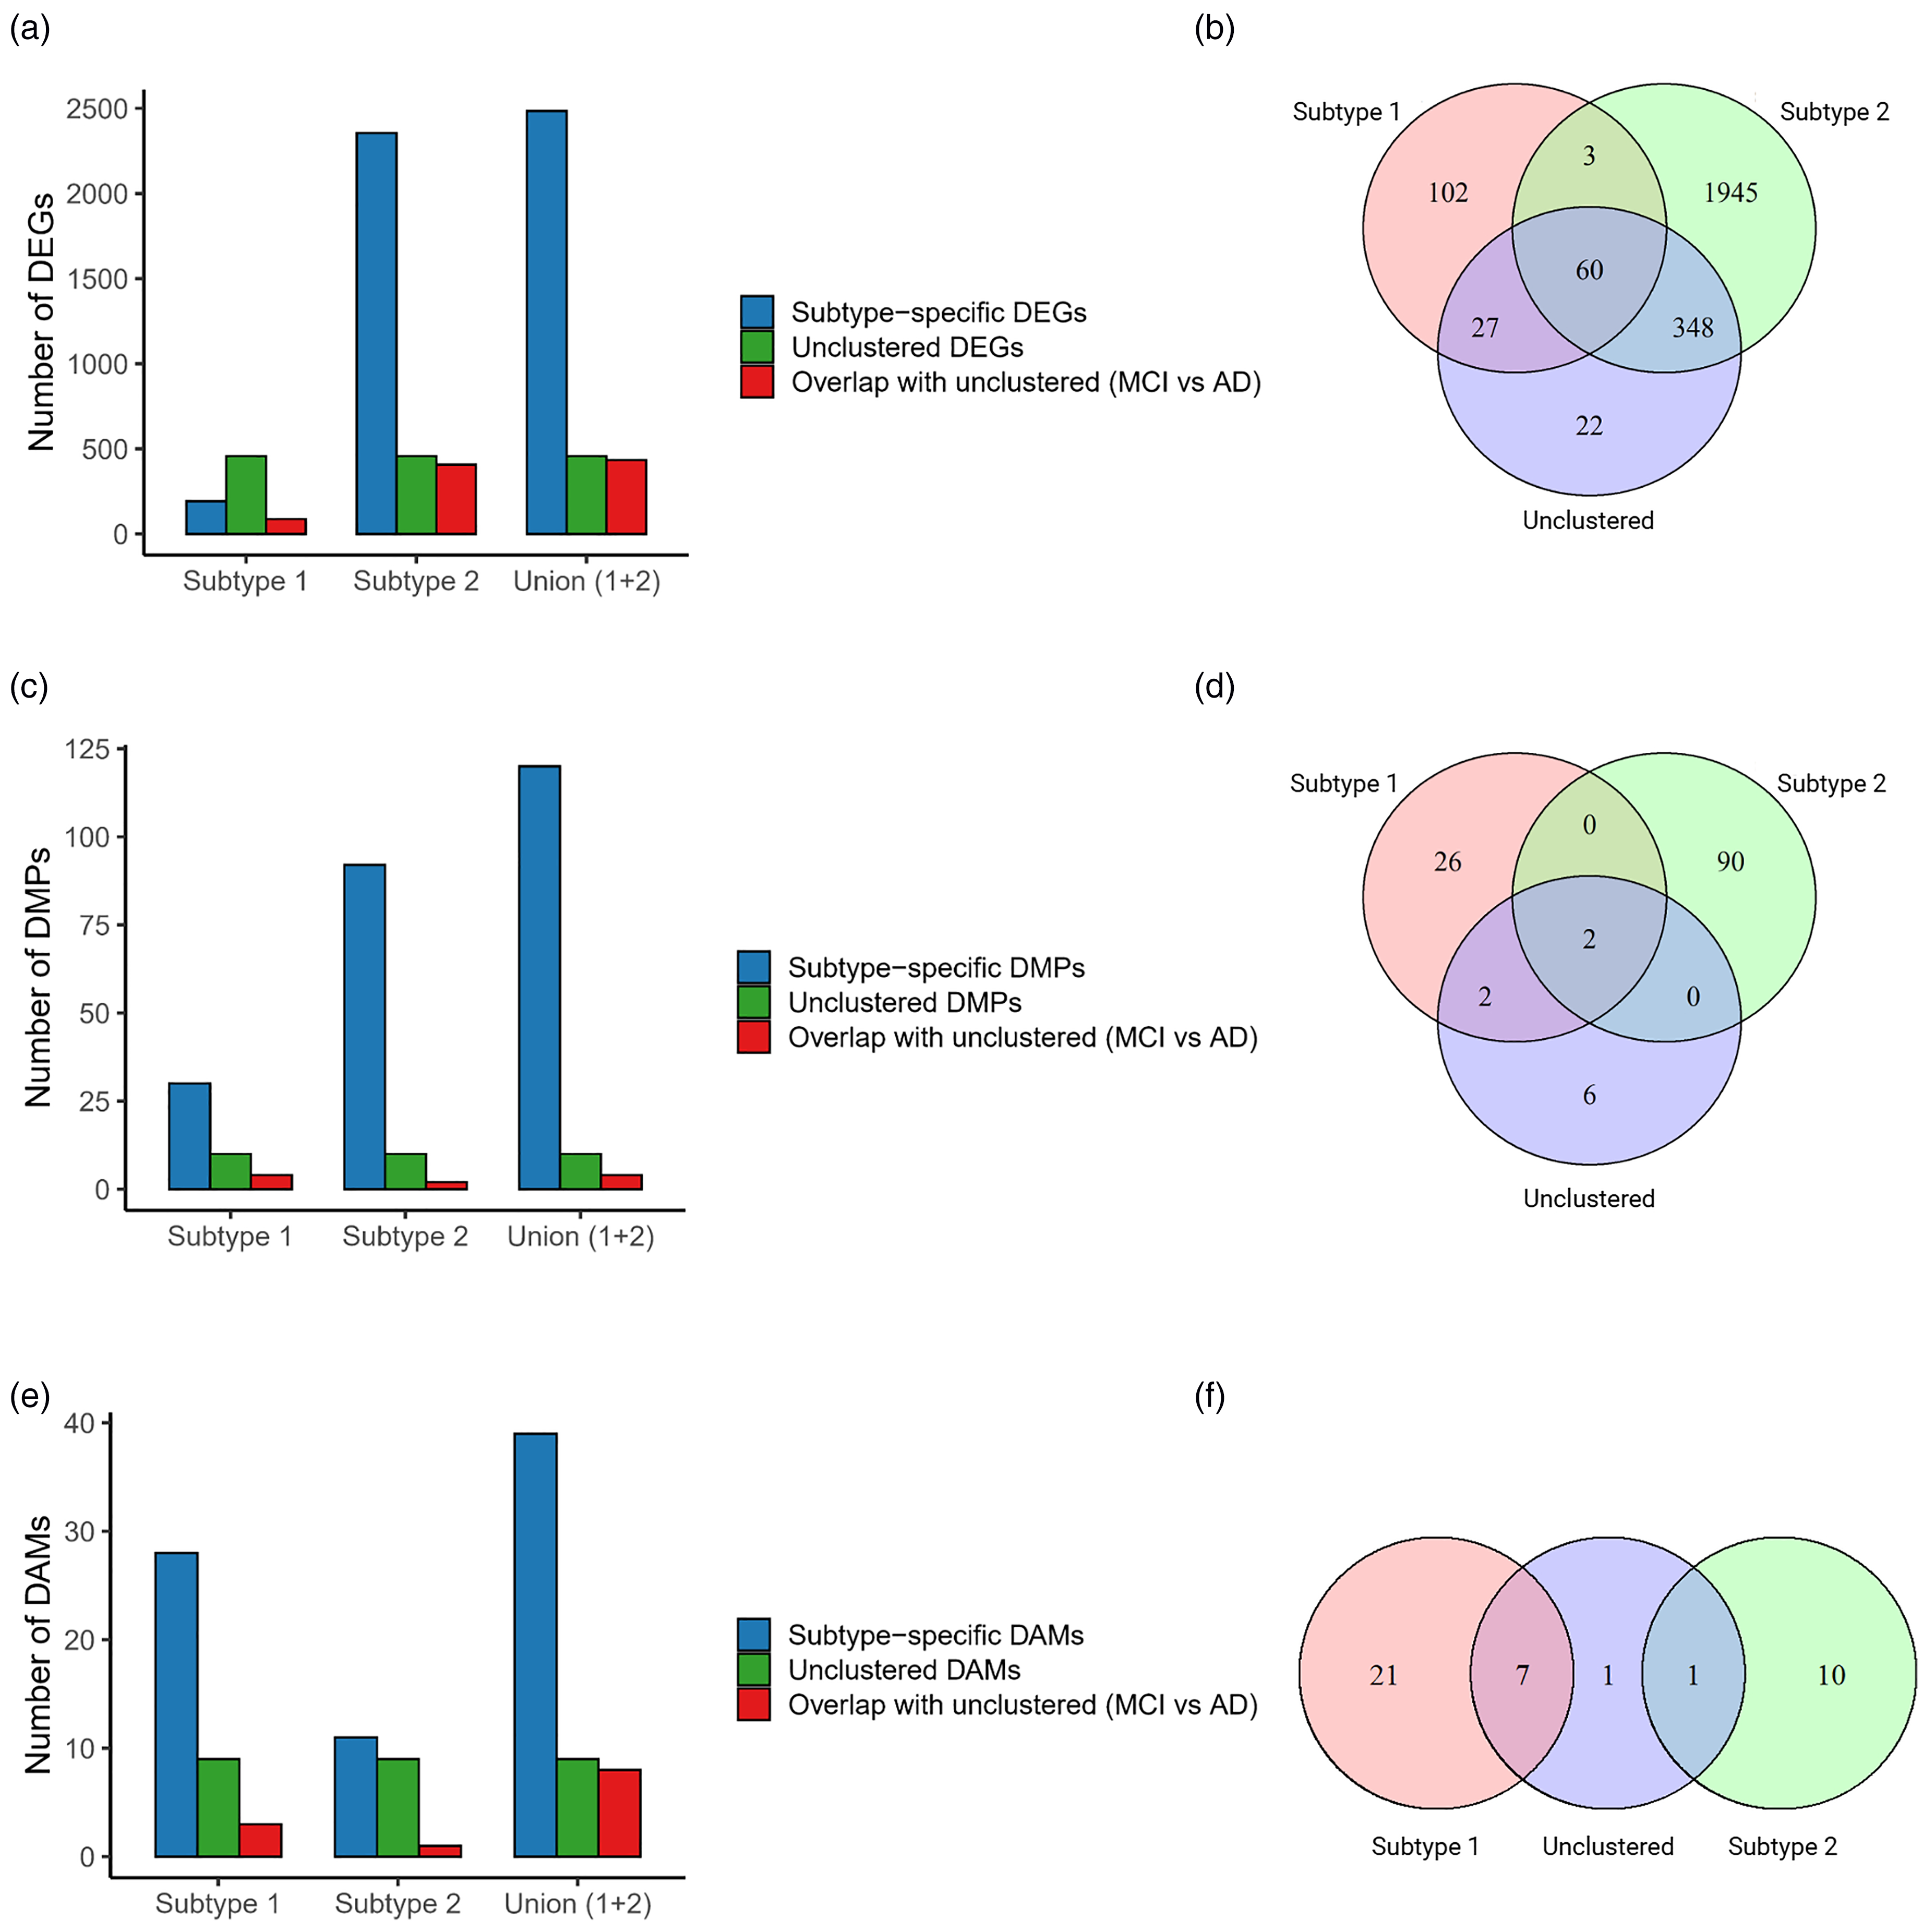
MCI-to-AD molecular changes across subtypes. (a) Bar plot showing the number of subtype-specific DEGs, unclustered DEGs, and the overlap with unclustered DEGs (MCI versus AD) across the different subtypes. (b) Venn diagram illustrating the overlap between each subtype and non-clustered DEGs, highlighting the intersections between the groups. (c and d) Similar to panels (a) and (b), but for DMPs. (e and f) Similar to panels (a) and (b), but for DAMs.
The DNA methylation patterns showed similar subtype specificity. Subtype 1 contained 30 DMPs, including 4 (13.3%) overlapping with the 10 unclustered DMPs, while 26 (86.7%) were subtype-specific. Subtype 2 presented 92 DMPs, with only 2 (2.2%) overlapping with unclustered DMPs and 89 (97.3%) being unique. Combined analysis captured only 40% of unclustered DMPs, suggesting greater subtype exclusivity in methylation changes (Figure 3(c) and (d)).
Metabolomic analysis revealed that Subtype 1 contained the majority of dysregulated metabolites, with 21 DAMs (75% subtype-specific) compared to Subtype 2's 10 DAMs (90% subtype-specific). Notably, Subtype 1 captured 7 of 9 (77.8%) unclustered DAMs, with only 1.1% remaining undetected by either subtype (Figure 3(e) and (f)).
The comprehensive profiling demonstrated that Subtype 2 exhibited the most extensive transcriptomic alterations with the highest feature coverage, while Subtype 1 showed predominant dysregulation in the metabolome. Importantly, we observed that substantial proportions of molecular features were subtype-exclusive, with each subtype capturing unique aspects of disease pathophysiology that would have been missed without stratification. The superior capability of this multi-omics integration method to identify these divergent molecular signatures compared to conventional unstratified analysis highlights its importance for uncovering the complex heterogeneity underlying disease pathogenesis and progression.
Immune landscape underlies divergent trajectories
To further investigate the potential link between immune cell infiltration and the molecular mechanisms underlying disease progression in each trajectory subtype, we performed comprehensive immune cell proportion analysis using CIBERSORT on both within-subtype and between-subtype comparisons (Supplemental Figure 1). Within-subtype comparisons showed that Subtype 1 exhibited a significant decrease in activated dendritic cells during progression from MCI to AD (p < 0.05) (Figure 4(a)), while Subtype 2 demonstrated a marked increase in activated CD4+ memory T cells (p < 0.05) (Figure 4(b)). No other immune cell populations showed significant changes within either subtype during disease progression.

Immune cell infiltration differences across MCI-to-AD subtypes. (a) Comparison of immune cell proportions within Subtype 1 during MCI-to-AD progression. (b) Comparison of immune cell proportions within Subtype 2 during MCI-to-AD progression. (c) Comparison of immune cell proportions between Subtype 1 and Subtype 2 at the MCI stage. (d) Comparison of immune cell proportions between Subtype 1 and Subtype 2 at the AD stage. (*p < 0.05, **p < 0.01, ***p < 0.001).
Between-subtype comparisons revealed more pronounced differences. At the MCI stage, Subtype 2 showed significantly higher proportions of naive B cells (p < 0.001), resting CD4+ memory T cells (p < 0.05), activated CD4+ memory T cells (p < 0.05), along with significantly lower proportions of memory B cells (p < 0.01), regulatory T cells (p < 0.01), and Monocytes (p < 0.01) compared to Subtype 1 (Figure 4(c)). These differences persisted but became more restricted at the AD stage, with only, resting CD4+ memory T cells (p < 0.05), and activated CD4+ memory T cells (p < 0.01) remaining significantly elevated, while memory B cells (p < 0.01) showed significantly lower proportions in Subtype 2 relative to Subtype 1 (Figure 4(d)). To assess whether sex differences might contribute to the immune signature observed in Subtype 2, we further compared immune cell proportions between male and female MCI participants within this subtype. Among the 22 immune cell types, only naive CD4+ T cells showed a significant difference between sexes (p < 0.05), while all others were comparable (Supplemental Figure 3). This suggests that the immune alterations observed in Subtype 2 are unlikely to be primarily driven by sex.
The immune cell composition differences between subtypes at the same disease stage were more substantial than the changes observed within subtypes during disease progression. This pattern suggests that the distinct immune microenvironments between subtypes are established early in the disease course, which may contribute to their divergent clinical trajectories.
Subtype-specific co-expression networks reflect divergent pathobiology
To further investigate the molecular mechanisms underlying disease progression within each trajectory subtype, we performed WGCNA separately for Subtype 1 and Subtype 2 using multi-omics data from MCI and AD samples. We then correlated the identified modules with clinical traits, including CSF biomarkers (Aβ42, TAU, PTAU), cognitive scores (ADAS11, ADAS13, ADASQ4, CDRSB, MMSE, RAVLT immediate, RAVLT learning, FAQ), and imaging measures (FDG-PET, AV45 SUVR, ventricles volume, hippocampus volume, whole brain volume, entorhinal cortex volume, fusiform volume, middle temporal lobe volume, intracranial volume). Notably, Subtype 1 exhibited significant correlations between specific gene modules and biomarkers Aβ42, TAU, and PTAU, while Subtype 2 did not show such associations (Figure 5(a) and (d)). Other clinical traits exhibited varying degrees of correlation with modules in both subtypes. This trend was consistent in the metabolomic data (Supplemental Figure 2).

Molecular mechanisms of disease progression in subtypes 1 and 2. (a) WGCNA for Subtype 1, showing correlations between gene modules and clinical traits (Aβ42, TAU, PTAU, brain volumes). (b) KEGG pathways enriched in Subtype 1's significant gene module, related to metabolism. (c) GO enrichment in Subtype 1, with pathways linked to metabolic processes. (d) WGCNA for Subtype 2, showing correlations with clinical traits like FDG-PET, CDRSB, and brain volumes. (e) KEGG pathways enriched in Subtype 2's significant gene module, related to immune response. (f) GO enrichment in Subtype 2, with immune activation processes. CDRSB: Clinical Dementia Rating – Sum of Boxes; ADAS11: Alzheimer's Disease Assessment Scale-Cognitive Subscale (11-item version); ADAS13: Alzheimer's Disease Assessment Scale-Cognitive Subscale (13-item version); ADASQ4: Alzheimer's Disease Assessment Scale-Question 4; MMSE: Mini-Mental State Examination; RAVLT_immediate: Rey Auditory Verbal Learning Test-Immediate Recall; RAVLT_learning: Rey Auditory Verbal Learning Test-Learning Score; FAQ: Functional Activities Questionnaire; MidTemp: Middle Temporal Gyrus; ICV: intracerebral volume. (*p < 0.05, **p < 0.01, ***p < 0.001).
Next, we focused on the genes within the modules identified from the transcriptomic data that showed the most correlations with a variety of clinical traits. In trajectory Subtype 1, the green module, containing 84 genes, exhibited significant correlations with CSF TAU (R = 0.23, p < 0.05), CSF PTAU (R = 0.21, p < 0.05), hippocampus volume (R = −0.21, p < 0.05), whole brain volume (R = −0.37, p < 0.001), fusiform volume (R = −0.3, p < 0.001), middle temporal lobe volume (R = −0.31, p < 0.001), and intracranial volume (ICV) (R = −0.32, p < 0.001) (Figure 5(a)). KEGG enrichment analysis of this module highlighted several metabolic-related pathways, including beta-Alanine metabolism, Mucin type O-glycan biosynthesis, Pyrimidine metabolism, Arachidonic acid metabolism, and Drug metabolism – other enzymes (Figure 5(b)). Furthermore, GO enrichment analysis revealed that BP were predominantly associated with metabolic activities, such as O-glycan processing, sialylation, pyrimidine metabolism, and UMP metabolic process (Figure 5(c)). These findings suggest that metabolic disruptions are a key feature of Subtype 1, with specific alterations in glycosylation and pyrimidine metabolism processes playing a central role in disease progression.
For Subtype 2, we identified a gene module (brown module) containing 265 genes, which exhibited significant correlations with a variety of clinical traits, including FDG-PET (R = −0.28, p < 0.01), CDRSB (R = 0.22, p < 0.05), ADAS11 (R = 0.24, p < 0.05), ADAS13 (R = 0.22, p < 0.05), FAQ (R = 0.2, p < 0.05), entorhinal cortex volume (R = −0.24, p < 0.05), fusiform volume (R = −0.28, p < 0.01), and middle temporal lobe volume (R = −0.28, p < 0.01) (Figure 5(d)). KEGG enrichment analysis of this module revealed a strong association with immune-related pathways, such as Rheumatoid arthritis, Inflammatory bowel disease, Toll-like receptor signaling pathway, Th17 cell differentiation, and IL-17 signaling pathway, in addition to infection-related pathways including Kaposi sarcoma-associated herpesvirus infection, Leishmaniasis, Chagas disease, and Amoebiasis (Figure 5(e)). GO enrichment analysis further supported these observations, with BP terms enriched in immune activation processes such as positive regulation of interferon-beta production, cytokine production, neutrophil-mediated immunity, and neutrophil-mediated killing of symbiont cells (Figure 5(f)). These results suggested that immune dysregulation and inflammation play a central role in Subtype 2's disease progression.
Prognostic model construction and subtype-specific feature analysis
To further explore the prognostic characteristics of Subtype 1 and Subtype 2 in MCI individuals, we performed univariate Cox regression analysis on the DEGs, DMPs, and DAMs for both subtypes. In the metabolically-driven Subtype 1, we identified 11 significant prognostic genes, 4 methylation sites, and 7 metabolites associated with disease progression (p < 0.05) (Figure 6). In contrast, in the immune-driven Subtype 2, 42 genes out of 2356 DEGs showed significant prognostic associations (p < 0.05), along with 8 methylation sites and 1 metabolite were also significantly associated with prognosis (p < 0.05) (Figure 7). These findings indicated significant molecular differences between Subtype 1 and Subtype 2, with distinct omic features potentially influencing MCI progression in different ways.

Forest plot showing significant prognostic genes, methylation sites, and metabolites associated with disease progression in subtype 1 (p < 0.05). SM: sphingomyelin; PC: phosphatidylcholine; lysoPC: lysophosphatidylcholine; Gly: glycine; alpha.AAA: alpha-aminoadipic acid.

Forest plot showing significant prognostic genes, methylation sites, and metabolites associated with disease progression in subtype 2 (p < 0.05). PC: phosphatidylcholine.
Based on these selected features, we constructed a random forest prognostic model and assessed its predictive performance using time-dependent AUROC curves. The results showed that the model for Subtype 1 achieved AUROC values ranging from 0.851 to 0.893 for predictions at 1, 3, and 5 years (Figure 8(a)), while the model for Subtype 2 exhibited superior performance with AUROC values ranging from 0.878 to 0.927 (Figure 8(b)). Decision curve analysis (DCA) further confirmed the clinical utility of the model (Figure 8(c) and (d)). Notably, feature importance analysis revealed the key driving factors for both subtypes: the top 10 features in Subtype 1 included 4 metabolites (alpha.AAA, PC.ae.C42.4, SM.C16.0, lysoPC.a.C24.0), highlighting the central role of metabolic dysregulation in this subtype (Figure 8(e)); whereas in Subtype 2, the top 5 important features included the genes SLC3A2, ADGRL1, and LGALS12 (Figure 8(f)), all of which were significantly correlated with the proportion of activated CD4+ memory T cells—the immune population that showed significant expansion in Subtype 2 during disease progression in our prior immune infiltration analysis (Figure 8(g)). This finding further underscored the critical role of immune dysregulation in the pathogenesis of Subtype 2.

Prognostic model and performance evaluation. (a) AUROC curves for the RF model predicting disease progression in Subtype 1 at 1, 3, and 5 years. (b) AUROC curves for the RF model predicting disease progression in Subtype 2 at 1, 3, and 5 years. (c and d) DCA showing the clinical utility of the prognostic models for Subtype 1 (c) and Subtype 2 (d). (e and f) Feature importance analysis for Subtype 1 (e) and Subtype 2 (f). (g) Correlation between the expression of SLC3A2, ADGRL1, LGALS12 and the proportion of activated CD4+ memory T cells.
Discussion
Based on transcriptomic, epigenomic, and metabolomic data, this study classified disease progression in MCI patients into two trajectory subtypes and investigated the molecular perturbations underlying the transition from MCI to AD. Our findings highlight significant differences between the two trajectory subtypes in clinical manifestations, molecular alterations, immune profiles, and prognostic characteristics, providing a more nuanced understanding of AD progression heterogeneity. Importantly, this work emphasizes the potential of multi-omics stratification to identify subtype-specific disease mechanisms, which may ultimately lead to more precise and targeted therapeutic approaches.
Patients with Subtype 2 exhibited better cognitive performance at baseline but demonstrated faster cognitive decline over time, suggesting that Subtype 2 represents a more aggressive disease progression pattern. Interestingly, no significant differences in APOE ε4 carrier status were observed between subtypes, indicating that known genetic risk factors for AD do not differentiate the progression dynamics among MCI patients.
Our differential analysis revealed distinct molecular signatures between Subtype 1 and Subtype 2. Compared to Subtype 1, Subtype 2 showed extensive transcriptional and epigenetic changes during the MCI-to-AD transition, which may reflect the more severe neurodegeneration observed along this trajectory. In contrast, Subtype 1 displayed the most prominent metabolic disturbances, suggesting that metabolic dysregulation drives disease progression in this subtype.
The involvement of the immune system is recognized as a crucial component of AD pathogenesis. Through immune cell infiltration analysis, we uncovered differences in immune cell infiltration patterns between the two subtypes. In Subtype 1, progression from MCI to AD was accompanied by a significant decrease in dendritic cells, indicating potentially attenuated immune responses or suppressed immune cell function. Conversely, Subtype 2 showed a marked increase in CD4+ memory T cells, particularly activated CD4+ memory T cells, reflecting persistent immune activation and inflammatory responses in this subtype. Inter-subtype comparisons revealed more profound immunological differences. The immune signature of Subtype 2—characterized by elevated naive and memory CD4+ T cells in the MCI stage coupled with reduced regulatory T cells and Monocytes—suggests early breakdown of immune tolerance mechanisms. Notably, the persistent differences in CD4+ memory T cells during the AD stage indicate that these cells may serve as both biomarkers and therapeutic targets for Subtype 2.
Our WGCNA analysis provided compelling evidence for fundamentally different molecular mechanisms driving disease progression in the two subtypes. In Subtype 1, the dysregulation of glycosylation metabolism has been demonstrated to play a crucial role in AD pathophysiology by influencing key proteins including Aβ, tau, and ptau. Specifically, N-glycosylation has been shown to regulate AβPP processing and subsequent Aβ accumulation. Mutations at N-glycosylation sites of AβPP can alter its processing, modify cellular localization, and increase levels of the more aggregation-prone Aβ42 isoform, 16 suggesting that altered AβPP glycosylation patterns may enhance Aβ production and contribute to early AD pathology. Furthermore, glycosylation of natural autoantibodies against Aβ42 exerts neuroprotective effects by modulating Aβ aggregation and phagocytosis, 17 underscoring the critical role of glycosylation in regulating Aβ toxicity and clearance. Importantly, O-GlcNAcylation at key serine residues of tau protein can reduce tau phosphorylation by inhibiting kinases such as GSK3β that mediate tau hyperphosphorylation. 18 In contrast, Subtype 2 was characterized by chronic immune activation, with a strong correlation between the brown module genes and cognitive function scores, indicating that neuroinflammation is the primary driver of neurodegeneration in this subtype. The neuroinflammatory response exhibits biphasic dynamics during AD progression: in early stages, resident brain immune cells (e.g., microglia) provide neuroprotection through Aβ plaque phagocytosis and secretion of degrading enzymes like Neprilysin 19 ; however, persistent microglial activation later shifts toward secretion of pro-inflammatory cytokines (IL-1β, IL-6, TNF-α, etc.), which not only impair Aβ clearance but also directly contribute to neuronal damage.20,21 This dynamic immune response mechanism explains the unique clinical trajectory of Subtype 2 patients—relatively preserved cognitive function in the early stages but a sharp decline later. The consistency of these findings in the metabolomics further strengthened the validity of our subtype approach. The stark contrast between the metabolic module in Subtype 1 and the immune-inflammatory module in Subtype 2 strongly supports the existence of biologically distinct AD pathways with different pathophysiological bases.
The prognostic model established in this study translates the biological differences between MCI and AD within subtypes into clinically actionable tools. The robust performance of our models across multiple time points (1–5 years) demonstrates that these molecular signatures capture fundamental disease processes that evolve with clinical progression. Particularly noteworthy is the model's ability to predict progression in Subtype 2 patients, who represent a clinically challenging population due to their initially preserved cognitive function yet rapid subsequent decline. Early identification of these patients could enable timely intervention before significant neurodegeneration occurs. The distinct feature importance patterns between subtypes provide critical biological insights. For metabolically-driven Subtype 1, the prominence of lipid metabolites (alpha.AAA, PC.ae.C42.4, SM.C16.0, lysoPC.a.C24.0) in the prognostic model strongly supports our initial hypothesis of metabolic dysregulation as the key driver. Alpha-aminoadipic acid (alpha.AAA), a lysine catabolite, reflects disturbances in lysine metabolism that may promote tau hyperacetylation and subsequent aggregation, while also impairing mitochondrial function through its impact on carnitine synthesis.22,23 Sphingomyelin (SM) is another lipid metabolite that plays a critical role in cellular membrane integrity and myelin formation. Elevated levels of SM have been associated with AD pathology, likely due to its role in lipid rafts, which are involved in the aggregation of Aβ peptides. 24 SM also influences Aβ processing through interactions with enzymes like phospholipase A2, contributing to increased Aβ generation and reduced clearance. Furthermore, the accumulation of SM in the brain, especially in the context of demyelination and neuronal damage, has been implicated in the progression of AD, highlighting its potential as a therapeutic target. 25 The metabolism of Phosphatidylcholine (PC) is disrupted in AD, largely due to the overactivation of PLA2, which leads to altered lipid metabolism and exacerbates neuroinflammation.26,27 This dysregulation is a significant contributor to the pathological processes of AD, including the aggregation of Aβ in lipid rafts, which are critical for amyloid plaque formation.28,29 Lysophosphatidylcholine (LysoPC), a derivative of phosphatidylcholine, plays a significant role in inflammation and membrane integrity. Studies have shown that lysoPC levels correlate with Aβ plaque accumulation and cognitive decline, particularly in the frontal and temporal regions of the brain. 26 Furthermore, the reduced lysoPC/PC ratio can disrupt neuronal membrane stability, trigger inflammatory responses, and promote cell apoptosis, further accelerating the progression of AD. 30 Among the top 5 important genetic features in the prognostic model for immune-driven Subtype 2, three genes (SLC3A2, ADGRL1, and LGALS12) were associated with the expansion of activated CD4+ memory T cells. This finding not only validates our immune infiltration results but also suggests these genes may mediate the observed neuroinflammatory processes through potential mechanistic roles. SLC3A2 is a transmembrane transporter protein primarily expressed in the endothelial cells of brain microvessels and glial cells within the neurovascular unit, and its role in AD receiving increasing attention. Studies have shown significant alterations in the protein expression of SLC3A2 in the microvessels of 5xFAD mice, with a marked increase compared to wild-type controls. 31 Given that blood-brain barrier (BBB) dysfunction represents a critical pathological feature in AD, SLC3A2 may influence the transport of substances across the BBB, affecting neuroinflammation, metabolic abnormalities, and the accumulation of toxic substances in the brain. 32 Changes in SLC3A2 expression could lead to the accumulation of key metabolites and toxic molecules, thereby promoting AD progression. ADGRL1 (Adhesion G Protein-Coupled Receptor L1, also known as Latrophilin-1) is an adhesion G protein-coupled receptor primarily expressed in neurons, playing a crucial role in neuroprotection, synaptic plasticity, and anti-apoptosis. Upon binding with the neuroprotective factor TAFA2, 33 ADGRL1 activates the cAMP/PKA/CREB/BCL2 signaling pathway, reducing Aβ-induced neuronal death. It is well established that activation of these pathways is essential for critical neurobiological processes including neurogenesis, synaptic plasticity, and long-term memory formation, all of which become dysregulated in AD. 34 Importantly, dysfunction of ADGRL1 or impairment of its downstream signaling pathways may contribute to the characteristic neuronal death and synaptic loss observed in AD pathogenesis. 35 Similar to ADGRL1, LGALS12 has been shown to interact with key signaling pathways including PKA.36,37 Although direct studies of LGALS12 in AD remain limited, we hypothesize that LGALS12 may participate in AD pathology through PKA/CREB-dependent mechanisms analogous to ADGRL1, based on their shared pathway involvement.
Limitations
A key limitation of this study is that all multi-omics data—including transcriptomic, epigenomic, and metabolomic profiles—were derived from peripheral blood rather than brain tissue or cerebrospinal fluid. While blood-based biomarkers offer clear advantages in terms of accessibility and clinical applicability, they may only partially reflect the molecular processes occurring in the central nervous system, which are critical to AD pathology. Consequently, some subtype-specific signatures, particularly those related to immune or metabolic alterations, should be interpreted with caution. To strengthen the biological relevance of our findings, future studies should incorporate brain- or CSF-derived multi-omics data, and explore the spatial and cell-type-specific patterns of disease-related changes. Integrating such tissue-specific information would provide a more comprehensive understanding of the molecular mechanisms underlying distinct progression trajectories. Another limitation is the relatively limited sample size, with 182 MCI and 35 AD participants, which becomes even smaller after stratification into subtypes. This may reduce the statistical power and affect the robustness of the identified progression trajectories. Additionally, the clinical spectrum of the enrolled cohort is relatively narrow, potentially limiting the generalizability of our findings to broader and more diverse populations. Future studies involving larger, multi-center cohorts with diverse ethnic and demographic backgrounds are warranted to independently validate these subtypes. Moreover, integrating longitudinal follow-up data would enable systematic evaluation of subtype stability and reproducibility over time, providing deeper insights into the temporal evolution of disease progression. Such efforts will be critical for enhancing the clinical applicability and translational potential of subtype-specific biomarkers.
Conclusion
In summary, this study underscores the importance of multi-omics stratification in identifying subtype-specific mechanisms and advancing our understanding of AD progression. Through integrated analysis of transcriptomic, epigenomic, and metabolomic data, we have captured the complex dynamics of neurodegeneration and identified potential biomarkers and therapeutic targets. Our findings demonstrate that AD progression does not follow a uniform trajectory, but rather at least two biologically distinct pathways: one primarily driven by metabolic dysregulation and the other dominated by immune activation. These subtypes exhibit unique baseline characteristics, progression patterns, and molecular signatures. These results pave the way for further investigation into the mechanistic roles of the identified genes and their potential as therapeutic targets, ultimately contributing to the development of more personalized and effective interventions for AD.
Supplemental Material
sj-docx-1-alz-10.1177_13872877251365210 - Supplemental material for Multi-omics profiling reveals two distinct trajectories in the progression from mild cognitive impairment to Alzheimer's disease
Supplemental material, sj-docx-1-alz-10.1177_13872877251365210 for Multi-omics profiling reveals two distinct trajectories in the progression from mild cognitive impairment to Alzheimer's disease by Xiayao Guo, Hongwen Fu, Ming Qin, Jiahui Kan and For the Alzheimer's Disease Neuroimaging Imitative in Journal of Alzheimer's Disease
Footnotes
Acknowledgments
Data collection and sharing for the Alzheimer's Disease Neuroimaging Initiative (ADNI) is funded by the National Institute on Aging (National Institutes of Health Grant U19AG024904). The grantee organization is the Northern California Institute for Research and Education. In the past, ADNI has also received funding from the National Institute of Biomedical Imaging and Bioengineering, the Canadian Institutes of Health Research, and private sector contributions through the Foundation for the National Institutes of Health (FNIH) including generous contributions from the following: AbbVie, Alzheimer's Association; Alzheimer's Drug Discovery Foundation; Araclon Biotech; BioClinica, Inc.; Biogen; Bristol-Myers Squibb Company; CereSpir, Inc.; Cogstate; Eisai Inc.; Elan Pharmaceuticals, Inc.; Eli Lilly and Company; EuroImmun; F. Hoffmann-La Roche Ltd and its affiliated company Genentech, Inc.; Fujirebio; GE Healthcare; IXICO Ltd; Janssen Alzheimer Immunotherapy Research & Development, LLC.; Johnson & Johnson Pharmaceutical Research & Development LLC.; Lumosity; Lundbeck; Merck & Co., Inc.; Meso Scale Diagnostics, LLC.; NeuroRx Research; Neurotrack Technologies; Novartis Pharmaceuticals Corporation; Pfizer Inc.; Piramal Imaging; Servier; Takeda Pharmaceutical Company; and Transition Therapeutics. The metabolomic data collection and sharing for this project was funded by the Alzheimer's Disease Metabolomics Consortium (National Institute on Aging R01AG046171, RF1AG051550 and 3U01AG024904-09S4).
Ethical considerations
Ethics approval for this study was obtained from the institutional review boards of all participating institutions. All procedures involving human participants were conducted in accordance with the ethical standards of the 1964 Helsinki Declaration and its later amendments.
Consent to participate
Written informed consent was obtained from all ADNI participants and/or their authorized representatives before any protocol-specific procedures were carried out.
Author contributions
Funding
The authors received no financial support for the research, authorship, and/or publication of this article.
Declaration of conflicting interests
The authors declared no potential conflicts of interest with respect to the research, authorship, and/or publication of this article.
Data availability statement
Data used in preparation of this article were obtained from the Alzheimer's Disease Neuroimaging Initiative (ADNI) database (adni.loni.usc.edu). As such, the investigators within the ADNI contributed to the design and implementation of ADNI and/or provided data but did not participate in analysis or writing of this report. A complete listing of ADNI investigators can be found at: http://adni.loni.usc.edu/wp-content/uploads/how_to_apply/ADNI_Acknowledgement_List.pdf. The metabolomic data used in preparation of this article were generated by the Alzheimer's Disease Metabolomics Consortium (ADMC). As such, the investigators within the ADMC provided data but did not participate in analysis or writing of this report. A complete listing of ADMC investigators can be found at: ![]()
Supplemental material
Supplemental material for this article is available online.
References
Supplementary Material
Please find the following supplemental material available below.
For Open Access articles published under a Creative Commons License, all supplemental material carries the same license as the article it is associated with.
For non-Open Access articles published, all supplemental material carries a non-exclusive license, and permission requests for re-use of supplemental material or any part of supplemental material shall be sent directly to the copyright owner as specified in the copyright notice associated with the article.