



Abstract
Background
While the correlation between tau deposition and metabolism in Alzheimer's disease (AD) has been observed, the relationship between asymmetric tau deposition and metabolic asymmetry has not been thoroughly studied.
Objective
To analyze the asymmetry of tau deposition in AD and explore its correlation with cerebral metabolic asymmetry.
Methods
We retrospectively enrolled 304 AD patients who underwent 18F-Florzolotau PET imaging, with 238 also receiving 18F-FDG PET. Standardized uptake value ratios (SUVRs) were obtained, and asymmetry indices (AIs) of tau deposition and metabolism were calculated. AD patients were classified into subgroups of left/right-dominant or bilateral symmetric tau deposition and hypometabolism based on AI thresholds. Clinical differences and correlations between tau and metabolic asymmetry were assessed.
Results
Among 304 AD patients, 21.7%, 23.3%, and 4.8% exhibited left-dominant, right-dominant, and bilateral symmetric tau deposition, respectively. For the 238 patients with 18F-FDG PET, 19.3%, 26.9%, and 8.0% had left-dominant, right-dominant, and bilateral symmetric hypometabolism. Longitudinally, tau and 18F-FDG metabolic asymmetries exhibited different trends. Tau deposition subgroups did not differ significantly in age, disease duration, sex, or MMSE scores. Significant negative correlations between tau and metabolic asymmetry were found in 16 ROI pairs (ρ = −0.639 to −0.192, p < 0.05), while no significant correlations were seen in 4 other ROIs (p > 0.05).
Conclusions
Nearly half of AD patients showed asymmetric tau deposition. Although tau asymmetry negatively correlated with metabolic asymmetry, differences in the proportions of asymmetry, variation trends, and clinical characteristics suggest that other factors influence metabolic heterogeneity in AD.
Introduction
Amyloid-β (Aβ), a hallmark pathology of AD, is generally considered a triggering or driving factor in the disease progression by numerous studies. 1 It has been incorporated as a necessary condition for AD diagnosis, 2 and Aβ-negative conditions can generally rule out AD. 3 However, after a decade of imaging studies, a disconnect remains between the diffuse pattern of Aβ deposition and the characteristic pattern of glucose hypometabolism or brain atrophy closely associated with clinical symptoms of AD. 4 Thus, while Aβ pathology may serve as a prerequisite for AD development, there could be other factors involved in regional neurodegeneration and clinical manifestation during the course of the disease.
Tau pathology, characterized by the accumulation of a microtubule-associated protein into intracellular neurofibrillary tangles, 5 has a significant impact on synaptic function in AD. 6 Tau protein is also an important criterion for AD diagnosis and contribute to neurodegeneration independently of Aβ. 3 Moreover, tau pathology patterns demonstrate a stronger correlation with metabolism, characteristic atrophy patterns, and clinical symptoms compared to Aβ. 7 In recent years, tau-specific ligands for PET imaging have been developed, such as 18F-Florzolotau, which exhibits high affinity and selectivity for paired helical filament tau pathology. These ligands provide a unique opportunity to assess regional tau load in vivo. 8 The characteristic pattern of tau PET imaging in the brain reflects the neurodegeneration pattern in AD, showing a strong regional correlation with clinical and anatomical heterogeneity. 7
Recently, asymmetrical staining of tau in the left and right cerebral cortex was observed in 6 out of 14 patients with AD (Modified Braak Stage V-VI). 9 Additionally, it is noteworthy that tau deposition frequently exhibits asymmetrical spatial distribution on tau PET scans, and the heterogeneity of asymmetric tau deposition is associated with clinical characteristics. 10 Although the molecular diversity of tau is considered representative of clinical variability in AD, 11 no in vivo imaging study has comprehensively investigated the proportion of asymmetric tau deposition in AD or the correspondence between lateralized neurodegeneration and lateralized tau deposition.
Previous research found that AD patients often exhibit asymmetric hemispheric hypometabolism in the parietotemporal cortex, frontal lobe, posterior cingulate cortex, and precuneus on brain 18F-FDG PET scans. 12 Furthermore, patients with asymmetric hypometabolism generally show faster cognitive decline and exhibit worse metabolic connectivity.13–15 However, the underlying pathological mechanisms of metabolic asymmetry remain to be explored.
In this study, we aimed to (1) quantify the proportion of asymmetric tau deposition using 18F-Florzolotau PET and (2) investigate the potential correlation between asymmetric tau deposition and asymmetric hypometabolism (assessed via 18F-FDG PET) in Aβ-positive patients. Specifically, based on our previous findings linking asymmetric hypometabolism to clinical heterogeneity in AD, 12 we hypothesized that asymmetric tau deposition would correlate positively with asymmetric hypometabolism in Aβ-positive individuals, reflecting a spatially coupled pathophysiological relationship.
Methods
Patients
A total of 304 patients with AD (AD group) who underwent 18F-Florzolotau PET scans between March 2020 and July 2023 were recruited from the PET center of Huashan Hospital (Shanghai, China), including 238 patients who also received 18F-FDG PET scans during the same period. The inclusion criteria for this study were guided by the 2024 National Institute on Aging-Alzheimer's Association (NIA-AA) research framework 16 for classifying AD. All patients exhibited Aβ PET positive results in the cerebral cortex, consistent with the neuropathological evidence of AD outlined in the framework. Additionally, 35 healthy controls (HCs) who underwent 18F-Florzolotau PET scans and 18F-FDG PET scans during the same period were included, no cognitive impairment and demonstrated normal cognitive test results after a medical history inquiry and physical examination. To ensure Aβ PET negativity, all HCs underwent amyloid-PET imaging. Only individuals with a threshold of SUVR < 1.11 (Centiloid scale < 20), 17 were included in the HC group. The exclusion criteria were applied to all participants as follows: (i) history of encephalitis, head injury, cerebrovascular disease, or psychiatric illness; (ii) meeting core clinical criteria for severe metabolic disease; (iii) presence of structural abnormalities; (iv) major systemic disease; (v) recent use of hormone use or a history of alcohol abuse within the previous 6 months. All 339 participants were right-handed. The AD group consisted of 121 males and 183 females, aged between 36 and 84 years (mean age: 63.4 ± 9.5 years), and the HCs included 14 males and 21 females, aged between 44 and 72 years (mean age: 57.5 ± 7.0 years). Sex was matched between the two groups.
This study was approved by the Institutional Review Board of Huashan Hospital, Fudan University (No. 2018–363) and adhered to the ethical principles of the Helsinki Declaration. Written informed consent was obtained from all participants or their legally authorized representatives prior to study initiation.
Image acquisition and processing
Whole-brain 18F-florbetapir PET imaging was performed on all subjects using a Siemens mCT Flow PET/CT scanner (Siemens, Erlangen, Germany) in 3D acquisition mode. A low-dose CT transmission scan was conducted for attenuation correction prior to PET acquisition. Approximately 370 MBq of 18F-florbetapir was administered intravenously, and static emission data were acquired for a 20-min scan, starting 50 min post-injection. All participants were instructed to cease any AD–related medications at least 24 h before the scan, if applicable.
Whole-brain 18F-Florzolotau PET scan was performed on 304 patients and 35 control subjects using a Siemens mCT Flow PET/CT scanner (Siemens, Erlangen, Germany) in 3D acquisition mode after ceasing any AD related medications for at least 24 h if used. 12 A low-dose CT transmission scan was conducted for attenuation correction before the PET scanning. Static emission recordings were acquired for a 20-min scan, 90 min after the intravenous injection of approximately 260 MBq 18F-Florzolotau in all subjects. On another day less than a week apart, with normal blood glucose level after fasting for over 6 h, 238 patients and 35 control subjects were intravenously injected with approximately 185Mbq 18F-FDG. PET images were acquired for a 10-min scan, 60 min after the injection, in a quiet, dimly lit room. All PET data were reconstructed using the Ordered Subset Expected Maximized 3D (OSEM 3D) method. 18 It is important to note that 18F-Florzolotau, while highly specific to paired helical filament tau, exhibits off-target binding in regions such as the choroid plexus and basal ganglia. 19 Our study did not include MRI acquisitions; all analyses were based on PET imaging (18F-florbetapir, 18F-Florzolotau, and 18F-FDG) and clinical assessments.
The 18F-florbetapir, 18F-Florzolotau, and 18F-FDG PET images were spatially normalized to the Montreal Neurological Institute (MNI) space without additional smoothing, as region-of-interest (ROI) analyses are robust to noise when using anatomically defined regions at this scale. The Statistical Parametric Mapping software (SPM12, Wellcome Centre for Human Neuroimaging, London, UK) software was used for image processing. Based on the standardized Automated Anatomic Labeling (AAL) template, 20 the 18F-Florzolotau and 18F-FDG PET images of the bilateral cerebral hemispheres were divided into a total of 90 regions of interest (45 pairs of ROIs). The standardized uptake value ratios (SUVRs) of the 45 pairs of ROIs in both the hemispheres were calculated using the cerebellum as the reference region. Amyloid burden was quantified by calculating the SUVR using the composite cortex as the target region and the whole cerebellum as the reference region. Subjects with SUVR < 1.10 (corresponding to Centiloid < 20) were classified as amyloid-negative.
Asymmetry index
To account for inherent asymmetry, the SUVR value of each ROI in the left or right hemisphere was divided by the corresponding average SUVR value of the HC group, resulting in a SUVR ratio (SUVRr) value for each subject. The asymmetry index (AI) was then calculated using the formula: 2*(SUVRrL-SUVRrR)/(SUVRrL + SUVRrR), ensuring that the average AI value of each ROI in HC group was 0. 12 To assess the characteristics of asymmetry of tau deposition in AD, we calculated the AIs of 20 pairs of key brain regions known to be affected by AD, including the Frontal lobe (Frontal_Sup, Frontal_Sup_Orb, Frontal_Mid, Frontal_Mid_Orb, Frontal_Inf_Oper, Frontal_Inf_Tri, Frontal_Inf_Orb, Frontal_Sup_Medial, Frontal_Mid_Orb), Parietal lobe (Parietal_Sup, Parietal_Inf, Angular, Precuneus), Temporal lobe (Temporal_Sup, Temporal_Pole_Sup, Temporal_Mid, Temporal_Pole_Mid, Temporal_Inf, Hippocampus) and Cingulum_Post.21,22 AD patients were classified into four groups based on the degree of deviation of their AIs from the corresponding AIs of HC group.
As described in our previous study, 12 the grouping of 18F-FDG was based on the asymmetric grouping method of brain glucose metabolism in our previous study, AD patients with more than half of 18F-FDG-AIs of the 20 pairs of ROIs < -2SD or > 2SD were considered to have left-dominant hypometabolism (FDG-L) or right-dominant hypometabolism (FDG-R), respectively. Those with more than half of the AIs between ± 1SD were considered to have bilateral symmetric metabolism (FDG-BI), and the remaining patients were classified as being in an intermediate state (FDG-IM).
Similarly, 12 AD patients with more than half of tau-AIs of the 20 pairs of ROIs < -2SD or > 2SD were considered to have right-dominant tau deposition (tau-R) or left-dominant tau deposition (tau-L), respectively. Those with more than half of the AIs between ± 1SD were considered to have bilateral symmetric tau deposition (tau-BI), and the remaining patients were classified as being in an intermediate state (tau-IM).
Statistics
The demographic and clinical data of the subjects were analyzed using GraphPad Prism 8.0 (GraphPad Software Inc.). Partial Spearman correlations were calculated to assess the relationship between (i) asymmetry indices of tau deposition and 18F-FDG hypometabolism; and (ii) the SUVRs of tau deposition and 18F-FDG uptake (separately for each hemisphere), adjusting for covariates including age and sex. To address multiple testing inflation, correlation P-values were adjusted using the Benjamini-Hochberg false discovery rate (FDR) method. The chi-square test was used to examine gender differences in tau deposition subgroups or 18F-FDG subgroups. One-way analysis of variance (ANOVA) with Bonferroni correction for post-hoc comparisons was used to compare the duration of disease, age of onset, and MMSE score in the tau deposition subgroups. A significance level of p < 0.05 (FDR-adjusted for correlations) was considered statistically significant.
Results
Characteristics of tau deposition and cerebral hypometabolism in HC and AD group
In the HC group, we found no significant difference in tau deposition or metabolism between the left and right hemispheres across the 45 pairs of ROIs. The 304 AD patients conducted with 18F-Florzolotau can be divided into 66 (21.7%) tau-L patients, 71 (23.4%) tau-R patients, 15 (4.9%) tau-BI patients, and 152 (50%) tau-IM patients. 238 AD patients conducted with 18F-FDG can be divided into 46 (19.3%) FDG-L patients, 64 (26.9%) FDG-R patients, 19 (8.0%) FDG-BI patients, and 109 (46.0%) FDG-IM patients. In the cohort of 238 AD patients with both 18F-Florzolotau and 18F-FDG imaging, the four subgroups based on tau features and the four subgroups based on 18F-FDG features are presented in Supplemental Table 1. In addition, among the 304 AD participants analyzed, the vast majority (290/304, 95.4%) exhibited symmetric Aβ deposition. Asymmetric Aβ deposition was observed in only 14 participants (4.6%), with 8 (2.6%) showing left-dominant asymmetry and 6 (2.0%) showing right-dominant asymmetry.
56 AD patients underwent follow-up 18F-Florzolotau PET imaging for a period of 1 to 2 years (mean: 1.3 ± 0.7 years). Among these patients, 4 individual transitioned from the tau-BI group to the tau-IM group, 2 individual transitioned from the tau-IM group to the tau-BI group,1 patient transitioned from the tau-L group to the tau-IM group, and 1 patient transitioned from the tau-IM group to the tau-R group (Table 1).
The characteristic of tau deposition at baseline and at follow-up in 56 patients with AD.

tau-R: right-dominant tau deposition; tau-L: left-dominant tau deposition; tau-BI: bilateral symmetric tau deposition; tau-IM: intermediate state.
Regarding the 20 pairs of ROIs associated with AD, we observed a significant increase in the absolute value of AI for tau deposition in the posterior cingulate gyrus during the follow-up period compared to baseline (p < 0.05). However, there was no significant change in the remaining 19 pairs of ROIs (p > 0.05).
Clinical differences among three groups of tau deposition in AD
As shown in Table 2, there was no difference in disease duration (p = 0.808, Bonferroni) or age (p = 0.129, Bonferroni) or age of onset (p = 0.153, Bonferroni) or MMSE scores (p = 0.911, Bonferroni) or gender (p = 0.431, chi-square test) among tau-BI, tau-L and tau-R groups (Table 2).
Clinical differences among tau-BI, tau-L, tau-R and tau-IM groups.

tau-R: right-dominant tau deposition; tau-L: left-dominant tau deposition; tau-BI: bilateral symmetric tau deposition; tau-IM: intermediate state; MMSE: Mini-Mental State Examination.
Correlation between 18F-FDG and tau deposition in AD
In the left hemisphere, significant negative correlations were observed between tau deposition and normalized 18F-FDG uptake in 17 ROIs (Table 3). Greater tau deposition was associated with more severe hypometabolism in the left hemisphere. These regions included Frontal_Sup, Frontal_Sup_Orb, Frontal_Mid, Frontal_Mid_Orb, Frontal_Inf_Oper, Frontal_Inf_Tri, Frontal_Inf_Orb, Frontal_Sup_Medial, Frontal_Mid_Orb, Parietal_Sup, Parietal_Inf, Angular, Precuneus, Temporal_Sup, Temporal_Mid, Temporal_Inf, and Cingulum_Post. The partial correlation coefficients in these regions ranged from ρ = −0.616 to −0.173 (all p < 0.05) (controlling for age and sex).
Correlation between 18F-FDG and tau deposition in the left and right hemispheres respectively in AD.

Similarly, in the right hemisphere, there were significant negative correlations between tau deposition and normalized 18F-FDG uptake in 16 ROIs (Table 3). Increased tau deposition was associated with more severe hypometabolism in the right hemisphere. These regions included Frontal_Sup, Frontal_Sup_Orb, Frontal_Mid, Frontal_Mid_Orb, Frontal_Inf_Oper, Frontal_Inf_Tri, Frontal_Inf_Orb, Frontal_Sup_Medial, Frontal_Mid_Orb, Parietal_Sup, Parietal_Inf, Angular, Precuneus, Temporal_Sup, Temporal_Mid, and Temporal_Inf. The partial correlation coefficients in these regions ranged from ρ = −0.537 to −0.181 (all p < 0.05) (controlling for age and sex). To comprehensively characterize the spatial patterns of tau-metabolism coupling, we generated a heatmap of partial correlation coefficients across all lateralized ROIs (Supplemental Figure 1A), and Supplemental Figure 1B further illustrates these relationships through representative scatterplots for regions with the strongest associations (controlling for age and sex).
Among the 20 pairs of ROIs, there were negative correlations between tau-AIs and 18F-FDG-AIs in 16 pairs of ROIs (Figure 1). Greater left-dominant tau deposition was associated with more pronounced left-dominant hypometabolism, as was the case in the right hemisphere. These regions included Frontal_Sup, Frontal_Sup_Orb, Frontal_Mid, Frontal_Mid_Orb, Frontal_Inf_Oper, Frontal_Inf_Tri, Frontal_Inf_Orb, Frontal_Sup_Medial, Frontal_Mid_Orb, Parietal_Sup, Angular, Precuneus, Temporal_Sup, Temporal_Mid, Temporal_Pole_Mid, and Temporal_Inf. The partial correlation coefficients in these regions ranged from ρ = −0.639 to −0.192 (all p < 0.05) (controlling for age and sex). To comprehensively examine the spatial patterns of tau–glucose metabolism coupling in asymmetry, we generated a heatmap depicting the partial correlation coefficients between asymmetry indices of tau-PET and FDG-PET across 45 bilateral region pairs in AD patients, adjusting for age and sex. As shown in the heatmap (Supplemental Figure 2), the correlations varied across regions, suggesting heterogeneity in tau–FDG asymmetry coupling. Notably, several medial temporal and limbic regions—including the hippocampus, parahippocampal gyrus, and amygdala—exhibited moderate positive correlations, indicating that greater asymmetry in tau deposition was associated with corresponding asymmetry in glucose metabolism. Conversely, regions in the frontal and parietal cortices tended to show weaker or negative correlations, implying potential spatial dissociation in asymmetry patterns between tau burden and hypometabolism.
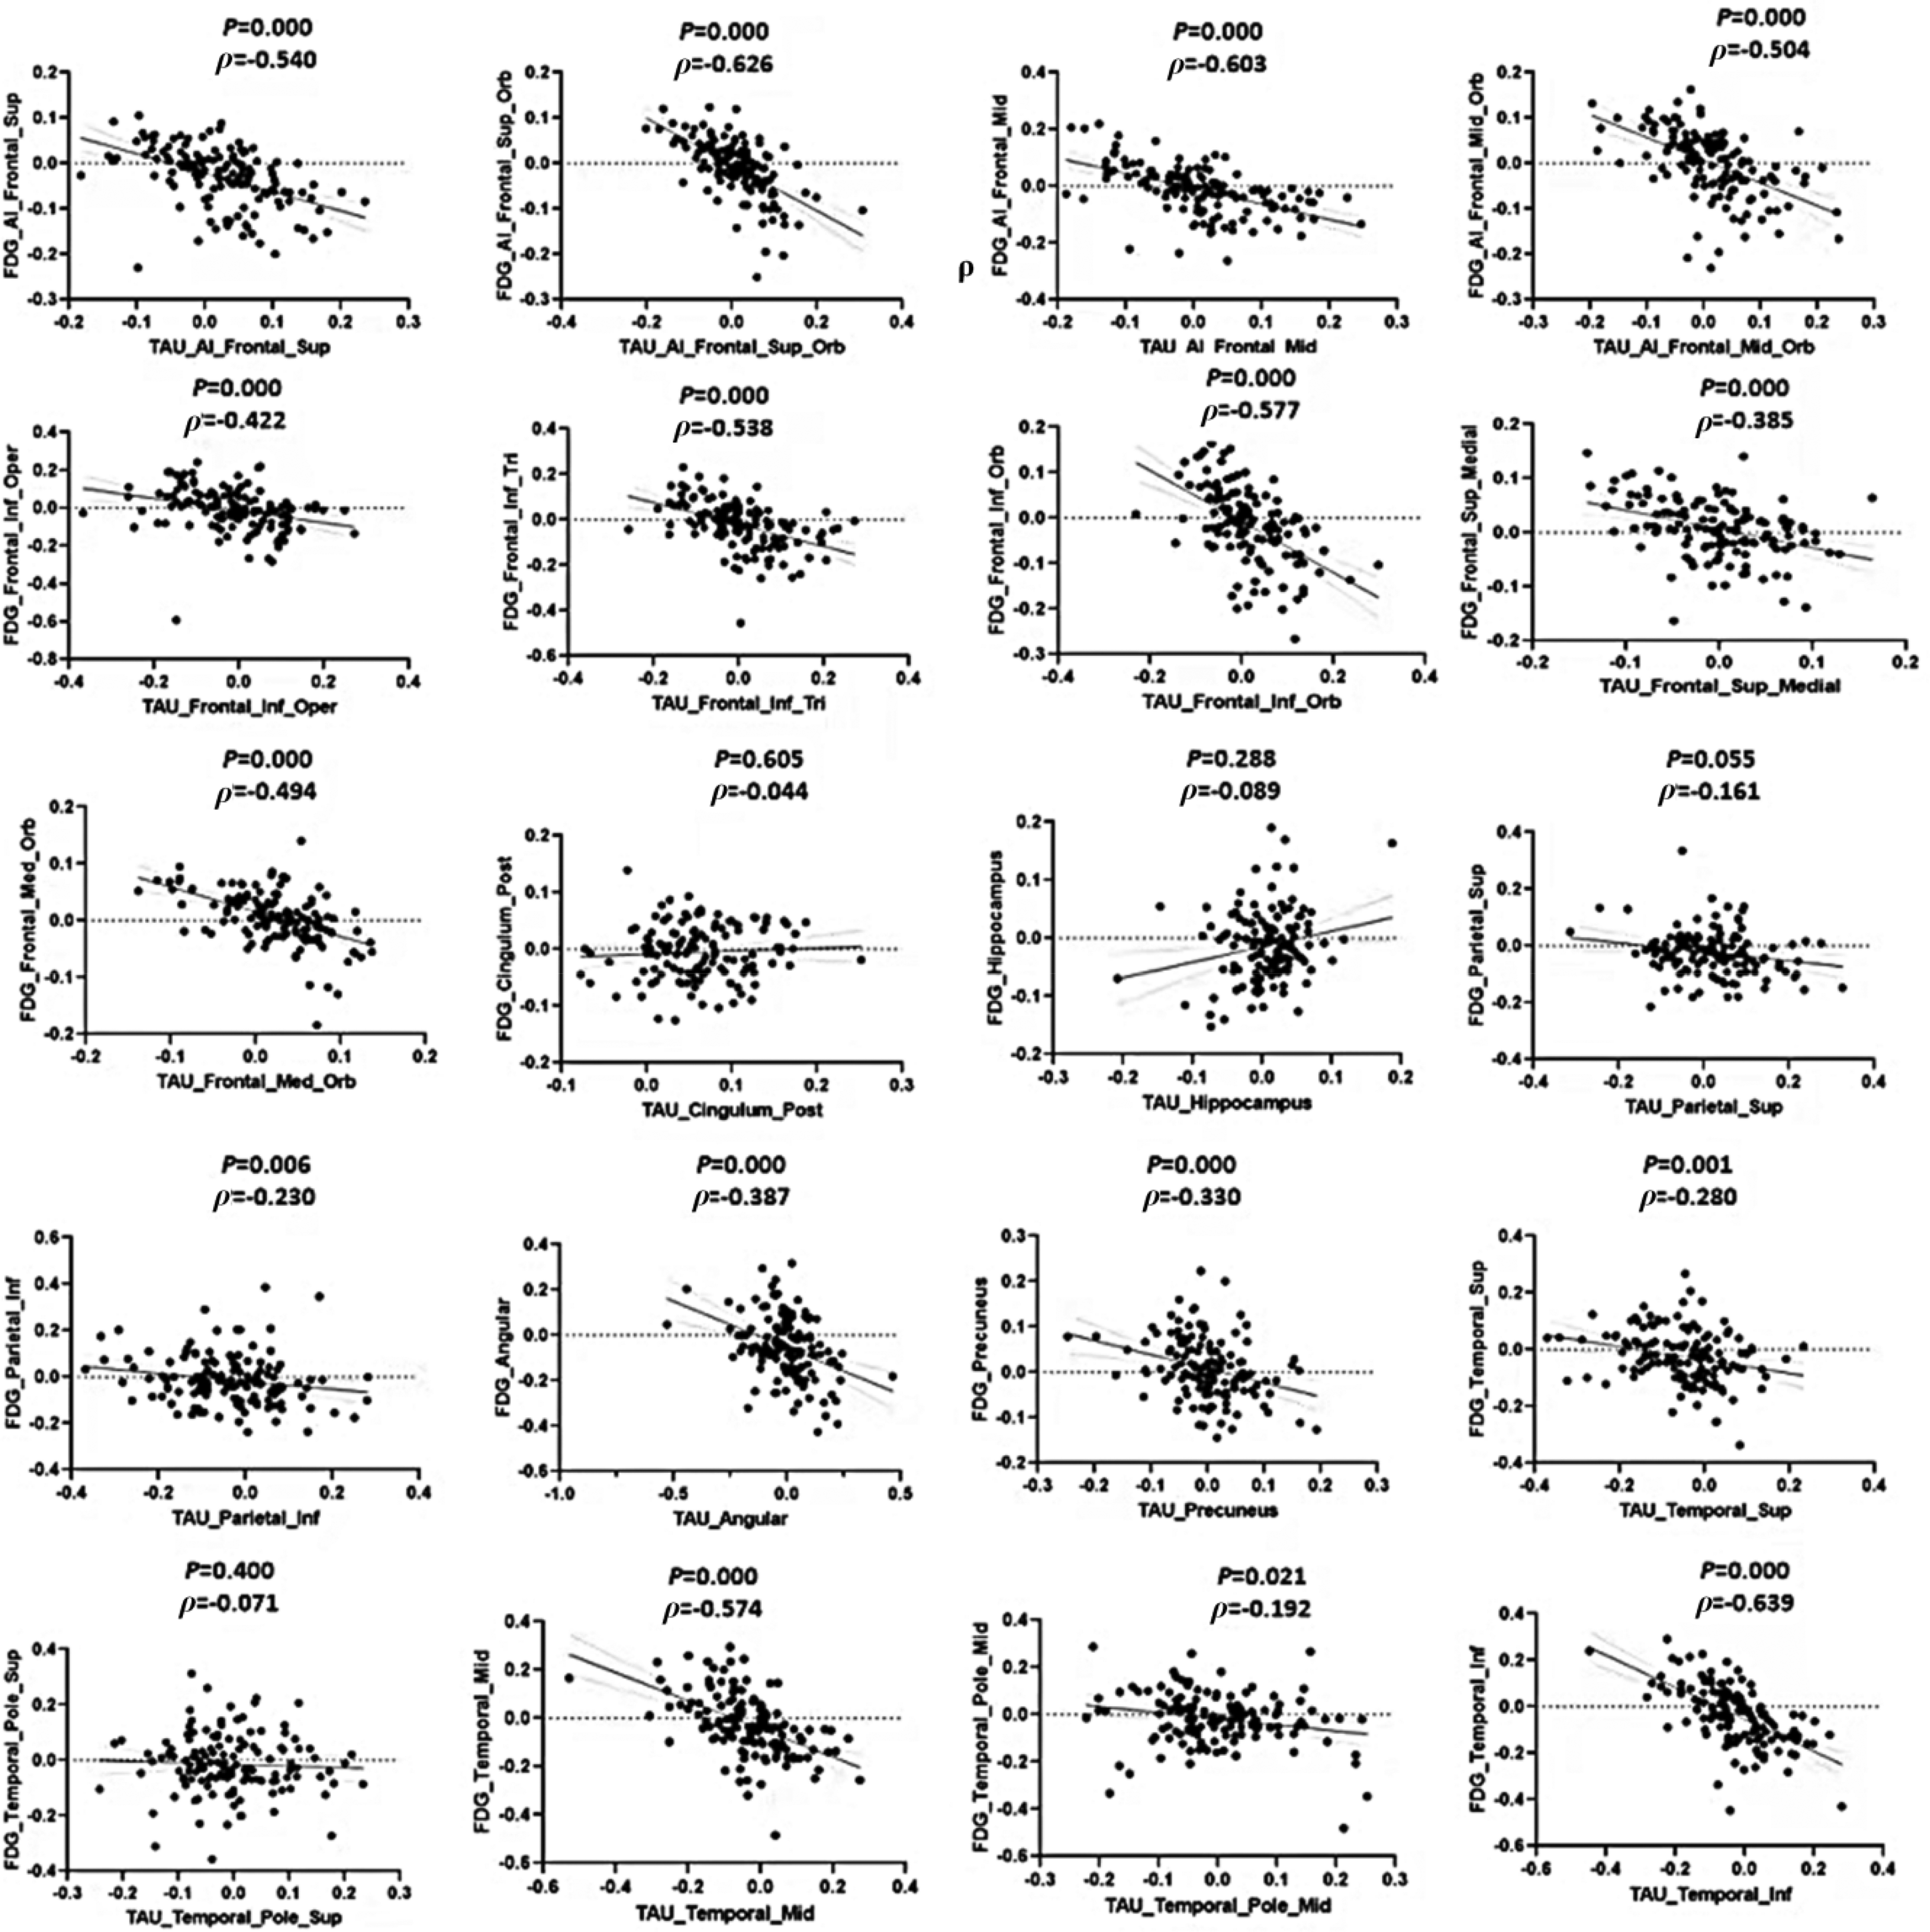
Correlation between 18F-FDG and tau deposition asymmetry indices in AD. The AIs of 18F-FDG was negatively correlated with the AIs of tau deposition in 16 pairs of ROIs (including: Frontal_Sup, Frontal_Sup_Orb, Frontal_Mid, Frontal_Mid_Orb, Frontal_Inf_Oper, Frontal_Inf_Tri, Frontal_Inf_Orb, Frontal_Sup_Medial, Frontal_Mid_Orb, Parietal_Sup, Angular, Precuneus, Temporal_Sup, Temporal_Mid, Temporal_Pole_Mid, Temporal_Inf) (ρ = −0.639 to −0.192, all p < 0.05), but not in the other four ROIs: Parietal_Inf, Temporal_Pole_Sup, Hippocampus, and Cingulum_Post (all p > 0.05).
Discussion
In this study, we observed that nearly half of AD patients exhibited asymmetric tau deposition and a significant negative correlation between asymmetries of tau deposition and hypometabolism in AD. Previous research has shown that asymmetric hypometabolic patients have a younger age of onset and poorer cognitive function compared to symmetric hypometabolic patients, 12 but these characteristics were not observed in the tau subgroups.
As expected, our study revealed significant negative correlations between tau deposition and glucose metabolism specifically within the ipsilateral hemispheres of AD patients. Increased tau burden in the left hemisphere was associated with hypometabolism in the same hemisphere, and a parallel relationship was observed in the right hemisphere. These findings support the notion that tau pathology contributes to local neuronal dysfunction,9,23 as reflected by impaired glucose metabolism. Our results align with previous studies reporting that higher regional tau accumulation correlates with hypometabolism, not only in patients with mild cognitive impairment but across the AD spectrum. 9 This is further supported by postmortem findings showing that tau deposition, in the form of neurofibrillary tangles, 7 is closely related to neuronal loss and reduced metabolic activity in affected regions.
Several pioneering studies have reported the variation of tau pathology in AD. A cross-sectional study of patients with preclinical AD found that approximately 10% showed asymmetric cortical tau patterns using a cutoff of 3 standard deviations away from the cortical asymmetry indices in a large cohort of clinically unimpaired older adults with elevated beta-amyloid (A+), 24 another study based on a small sample found that pathological tau protein was asymmetrically stained in 6 out of 14 patients with Braak grade V-VI AD, and some even had heterogeneous tau deposition in the ipsilateral cerebral hemisphere. 25 Additionally, a study involving individuals with varying degrees of clinical cognitive impairment identified 19.0% asymmetric temporoparietal (lateral temporal) tau deposition with distinct left-sided lateralization in 1143 individuals (including 707 cognitively normal, 223 MCI patients and 213 AD patients). Consistent with our study, the lateralization of tau deposition would increase or even reverse during longitudinal follow-up,26,27 but not in the same way as longitudinal changes in metabolism. 12 Taken together with our results, there is a certain consistency between asymmetric tau deposition and asymmetric hypometabolism.
The spatial patterns of tau deposition and 18F-FDG hypometabolism showed some degree of asymmetry alignment; however, the strength of the correlation was generally modest. To explore this further, we included a full correlation matrix of AIs across all tau-PET and FDG-PET regions (Supplemental Figure 2). This analysis revealed widespread and region-specific negative correlations, particularly in AD-relevant areas including the frontal, parietal, temporal, and posterior cingulate cortices. These findings suggest that although tau asymmetry partially explains the metabolic asymmetry observed in AD, other factors may also contribute. The partial overlap and dissociation in the spatial distribution—where tau accumulates mainly in the temporal lobes while hypometabolism is more prominent in the default mode network—underscore the multifactorial nature of neurodegeneration in AD. Thus, FDG hypometabolism likely reflects a complex interplay of tau pathology along with other mechanisms such as neuroinflammation, synaptic dysfunction, or network disconnection.
Furthermore, the relationship between tau deposition and 18F-FDG hypometabolism with clinical indicators was distinct. 18F-FDG demonstrated a stronger and more direct correlation with clinical measures than tau. This discrepancy is consistent with previous research indicating that 18F-FDG hypometabolism correlates more closely with cognitive decline than tau burden, both in vivo and postmortem. 7 Our study reinforces the notion that metabolic dysfunction, rather than tau pathology, may be a more sensitive indicator of clinical impairment, particularly in the context of disease progression.
A previous study reported that factors such as older age and APOE4 not only serve as risk factors for AD but also influence the expression of the disease by promoting tau pathology, particularly in the medial temporal lobe. 28 This suggests that genetic and biological factors may modulate both tau deposition and metabolic changes in AD. Recent modeling work further indicates that amyloid-driven facilitation of tau pathology 29 creates regional vulnerabilities that could interact with metabolic dysfunction. This supports our call to investigate whether factors like APOE4, TDP-43, vascular inflammation, and Aβ pathology collectively contribute to distinct metabolic patterns. Our study indicated that Aβ deposition in this AD cohort is predominantly symmetric. While asymmetric Aβ patterns exist in a small subset, their low prevalence suggests that Aβ asymmetry is unlikely to be a primary driver of widespread metabolic asymmetry in typical AD presentations. Nevertheless, we acknowledge the value of exploring this relationship further, particularly in populations with atypical presentations or earlier disease stages.
Nonetheless, a larger multicohort study demonstrated that all four subtypes of tau deposition based on PET imaging, including those with more pronounced right-sided patterns, had worse global cognition as measured by the MMSE compared to tau-negative patients, although disease severity was not related to tau load asymmetries.25,27 Moreover, some studies have suggested that other pathologies, such as TDP-43, can also exhibit asymmetry in pathological staining and may correlate with specific clinical manifestations.30,31 These findings further underscore the complexity of AD and suggest that different mechanisms may contribute to the spatial heterogeneity observed in tau deposition and metabolic changes.
This study has several limitations. First, the cross-sectional design limited our ability to explore longitudinal relationships between divergent tau patterns and cognitive decline. Future studies with serial cognitive assessments and tau PET imaging are needed to elucidate how these spatial tau profiles evolve and correlate with clinical progression. Second, although we utilized a relatively large sample of tau PET data, an even larger cohort would improve statistical power and may help identify additional, subtler patterns of tau accumulation. Third, while the data-driven spatial sampling approach enabled us to detect diverse regional tau patterns, these findings remain to be validated through postmortem histopathological confirmation.
In conclusion, we found that nearly half of the AD patients exhibited asymmetric tau deposition. Tau asymmetry was negatively associated with regional hypometabolism, but the patterns of tau deposition and FDG metabolism differed across brain regions. No significant clinical differences were observed between tau-defined subgroups, suggesting that tau asymmetry alone may not fully explain clinical heterogeneity in AD. These findings highlight the complexity of AD pathophysiology and underscore the need for further longitudinal studies to clarify how regional tau burden and metabolic dysfunction interact over time.
Supplemental Material
sj-docx-1-alz-10.1177_13872877251372523 - Supplemental material for The asymmetry of tau deposition and its correlation with cerebral metabolic asymmetry in Alzheimer's disease
Supplemental material, sj-docx-1-alz-10.1177_13872877251372523 for The asymmetry of tau deposition and its correlation with cerebral metabolic asymmetry in Alzheimer's disease by Huamei Lin, Zhemin Huang, Jiaying Lu, Jing Wang, Huiwei Zhang, Jingjie Ge, Ping Wu and Chuantao Zuo in Journal of Alzheimer's Disease
Footnotes
Ethical considerations
This study protocol was approved by the institutional review board of Huashan Hospital, Fudan University.
Consent to participate
Written informed consent was obtained from all participants or their legally authorized representatives prior to study initiation.
Author contributions
Funding
The authors disclosed receipt of the following financial support for the research, authorship, and/or publication of this article: This work was supported by the STI2030-Major Projects, National Natural Science Foundation of China, (grant number 2022ZD0211600, 82021002, 82272039, 82394434).
Declaration of conflicting interests
The authors declared no potential conflicts of interest with respect to the research, authorship, and/or publication of this article.
Data availability statement
The data supporting the findings of this study are available on request from the corresponding author.
Supplemental material
Supplemental material for this article is available online.
References
Supplementary Material
Please find the following supplemental material available below.
For Open Access articles published under a Creative Commons License, all supplemental material carries the same license as the article it is associated with.
For non-Open Access articles published, all supplemental material carries a non-exclusive license, and permission requests for re-use of supplemental material or any part of supplemental material shall be sent directly to the copyright owner as specified in the copyright notice associated with the article.
