



Abstract
Background
To understand the effect of air quality on cognition, air quality measurements should reflect real-world exposure. Currently, air quality exposure is derived from outdoor air quality monitors despite older adults spending most of their time indoors.
Objective
To examine if there are discrepancies between indoor particulate matter 2.5 (PM2.5) at older adults’ personal residences, PM2.5 levels measured with nearest outdoor public air monitors, and remotely accessed gridded ensemble air quality data.
Methods
PM2.5 levels collected in older adults’ residences, collected from the nearest outdoor public air quality monitors and ensemble data from Hazardous Air Quality Ensemble System (HAQES) were compared using Spearman correlation coefficients and Wilcoxon signed-rank tests. Daily PM2.5 profiles in these homes were also examined.
Results
Ambient air quality was assessed in 23 residences of older adults from October 2021 to August 2024. Indoor PM2.5 measurement was lower than outdoor public air monitors for all but 3 homes. Estimates of PM2.5 level from HAQES were also significantly higher than those indoors. High inter- and intra-home variability over time was observed. Spikes in daily indoor PM2.5 levels were common, and they could exceed the United States Environmental Protection Agency (US EPA)'s recommendation for 24 -hour average. Use of home appliances and indoor activities may contribute to changes in indoor PM2.5 level throughout the day.
Conclusions
To optimally estimate air quality exposure risk, monitoring both indoor and outdoor environments is likely needed.
Introduction
A number of studies have observed an increased risk for dementia in association with worse air quality.1–4 The conclusions of these studies are based on estimates of the environmental exposure of study populations to outdoor air quality measurements based on PM2.5 (particulate matter or particles smaller than 2.5 microns) levels provided by community-based, public air monitoring stations. However, these studies did not consider how much time the study population was outdoors and thus truly exposed to such air quality. Healthy older adults may leave their homes on average only 3.5–4.2 h per day.5–7 Further, with increasing age, as well as with the development of cognitive decline with aging, the time out of home further decreases.5–7 Therefore, measuring their indoor air quality exposure may be important. Factors such as the materials that the homes are made of, home appliances and indoor activities can affect their air quality exposure.8–10 It is also important to consider that not all time spent out of home is in the open outdoor environment. Only a small portion of time out of home may be actually spent outdoors as a person transits to another indoor setting. The specificity of location of exposure is further reduced in existing research by the fact that the public air monitors are located relatively far from one another. State and local environmental agencies run a national network of 3900 air monitoring devices covering 3.8 million square miles of U.S. land mass, which is roughly equivalent to one monitor per thousand square miles. In addition, about 120 million Americans, more than one third of the population, live in counties where there are no Environmental Protection Agency (EPA) air monitors. 11 Thus, even though studies use the nearest outdoor public air monitors to the homes of study participants to estimate their air quality exposure, the estimates may not be accurate due to lengthy distances from their everyday living spaces.
Considering these potential limitations, we examined the spatiotemporal relationship between indoor air quality (using indoor environment sensing monitors) and outdoor air quality estimated by the nearest public air monitor. We compared the differences and the correlations between the two measurements in relation to the distances between the indoor and the outdoor public air monitors. The indoor air quality data was collected as part of ongoing studies on how indoor home environments may affect the behavior of persons living with dementia, their caregivers, and older adults with normal cognition. We hypothesized that indoor and outdoor air quality are concordant with each other, but the strength of the relationship may depend on the distance between the two measurements and differ by home. We also examined if the use of Hazardous Air Quality Ensemble System (HAQES) can provide better estimates for indoor air quality. The practical objective of this current work is to provide a closer examination of the fidelity of outdoor relative to indoor air quality measurements. This is particularly important since air quality is an identified risk factor for dementia.
Methods
Air quality data from public outdoor air monitors
Public PM2.5 daily data from 2021 to 2024 were downloaded from the United States EPA website (https://www.epa.gov/outdoor-air-quality-data/download-daily-data). Remotely sensed Hazardous Air Quality Ensemble System (HAQES) data, which uses regional and global models from multiple agencies, including NASA's Goddard Earth Observing System, The Navy Aerosol Analysis and Prediction System (NAAPS) from Naval Research Laboratory, and National Oceanic and Atmospheric Administration (NOAA), were also collected. 12 HAQES data have higher spatial resolution and coverage compared to data provided by public outdoor air monitors alone, additional information on HAQES is provided in the Supplemental Material.
Indoor air quality data
As part of ongoing studies, we collected air quality data (PM2.5) using Awair Omni devices (Awair, San Francisco, CA) installed in the rooms where the participants slept each night. The studies were approved by the Oregon Health & Science University Institutional Review Board (OHSU IRB #18464 and OHSU IRB #24210). This study is a data analysis comparing the indoor air quality versus the outdoor air quality. Awair Omnis measured the PM2.5 level in participant rooms among numerous environmental factors every 5 min. RESET® (https://www.reset.build/) air quality accredited device specifications for the Awair OMNI are - Sensor type: Laser Particle Sensor (Light Scattering); measuring range: 0–1000 µg/m3; Sensor Output Resolution: 1 µg/m3; Accuracy: ± 15 µg/m3 or ±15%. Indoor air quality data was collected from October 2021 to August 2024.
Data analysis
Using the indoor air quality data, we calculated the daily mean indoor PM2.5 measurement for all homes. We then compared these home measures with the nearest public air monitor PM2.5 measurements during the same time period using scatter plots and Spearman correlation coefficients. We next plotted the daily indoor and outdoor PM2.5 measurements versus the date of data capture, along with the EPA 24-h PM2.5 level recommendation (< 35 µg/m3), 13 to examine how often the indoor air quality did not satisfy the recommendations. Examining these data on a daily basis also allows us to see the day-to-day variability within each home. The distances between the homes and the nearest outdoor air monitors were calculated using the longitude and latitude of the sensors and corresponding residences. The relationship of these distances with the indoor versus outdoor air quality correlation coefficients were examined. We also used linear regression to examine whether the correlation depends on the distance between the home and public outdoor monitoring station. A three-way comparison among indoor, HAQES ensemble outdoor air quality data, and outdoor measures was also performed for 16 homes during the last 2 weeks of 2022 using boxplots and Wilcoxon signed-rank tests. The daily hourly mean profiles of PM2.5 for the 5 homes with least variability and the 5 homes with most variability were plotted to examine their intra-day variability.
Results
Participants
Fifteen dyads and 6 older adults living alone (36 participants, total; mean age of 75.5 ± 7.8 (SD) years old; 50% women) were enrolled in these studies. Two dyads were relocated (i.e., contributing two homes), which led to 23 unique residences. Fifteen of our participants had either dementia or mild cognitive impairment which were evaluated and diagnosed according to National Alzheimer's Coordinating Center diagnostic criteria while the rest had normal cognition.
Indoor versus outdoor comparisons
Indoor air monitoring was conducted for a total of 6872 days across the 23 residences. All but one home were located in the state of Oregon in the United States. The homes were monitored for 299 days on average with a standard deviation of 184 days and a range of 33 to 641 days. Table 1 shows the summary statistics of daily indoor and outdoor air quality measured by the nearest public air monitors, the distances between the homes and the nearest public air monitors, and the Spearman correlation coefficients between the indoor and outdoor air quality readings and their 95% confidence intervals (CIs). As seen in Table 1, the mean daily indoor air PM2.5 measurement was lower than that of the nearest public air monitors for all except 3 homes, while the variabilities of indoor air quality were larger than that of the nearest public air monitors for 8 of the homes. Figure 1 shows the scatter plots of PM2.5 from in-home air monitors versus PM2.5 from the nearest public air monitors, with each scatter plot representing one home. Spearman correlation coefficients range from −0.146 to 0.867, with a mean (SD) of 0.442 (0.219).
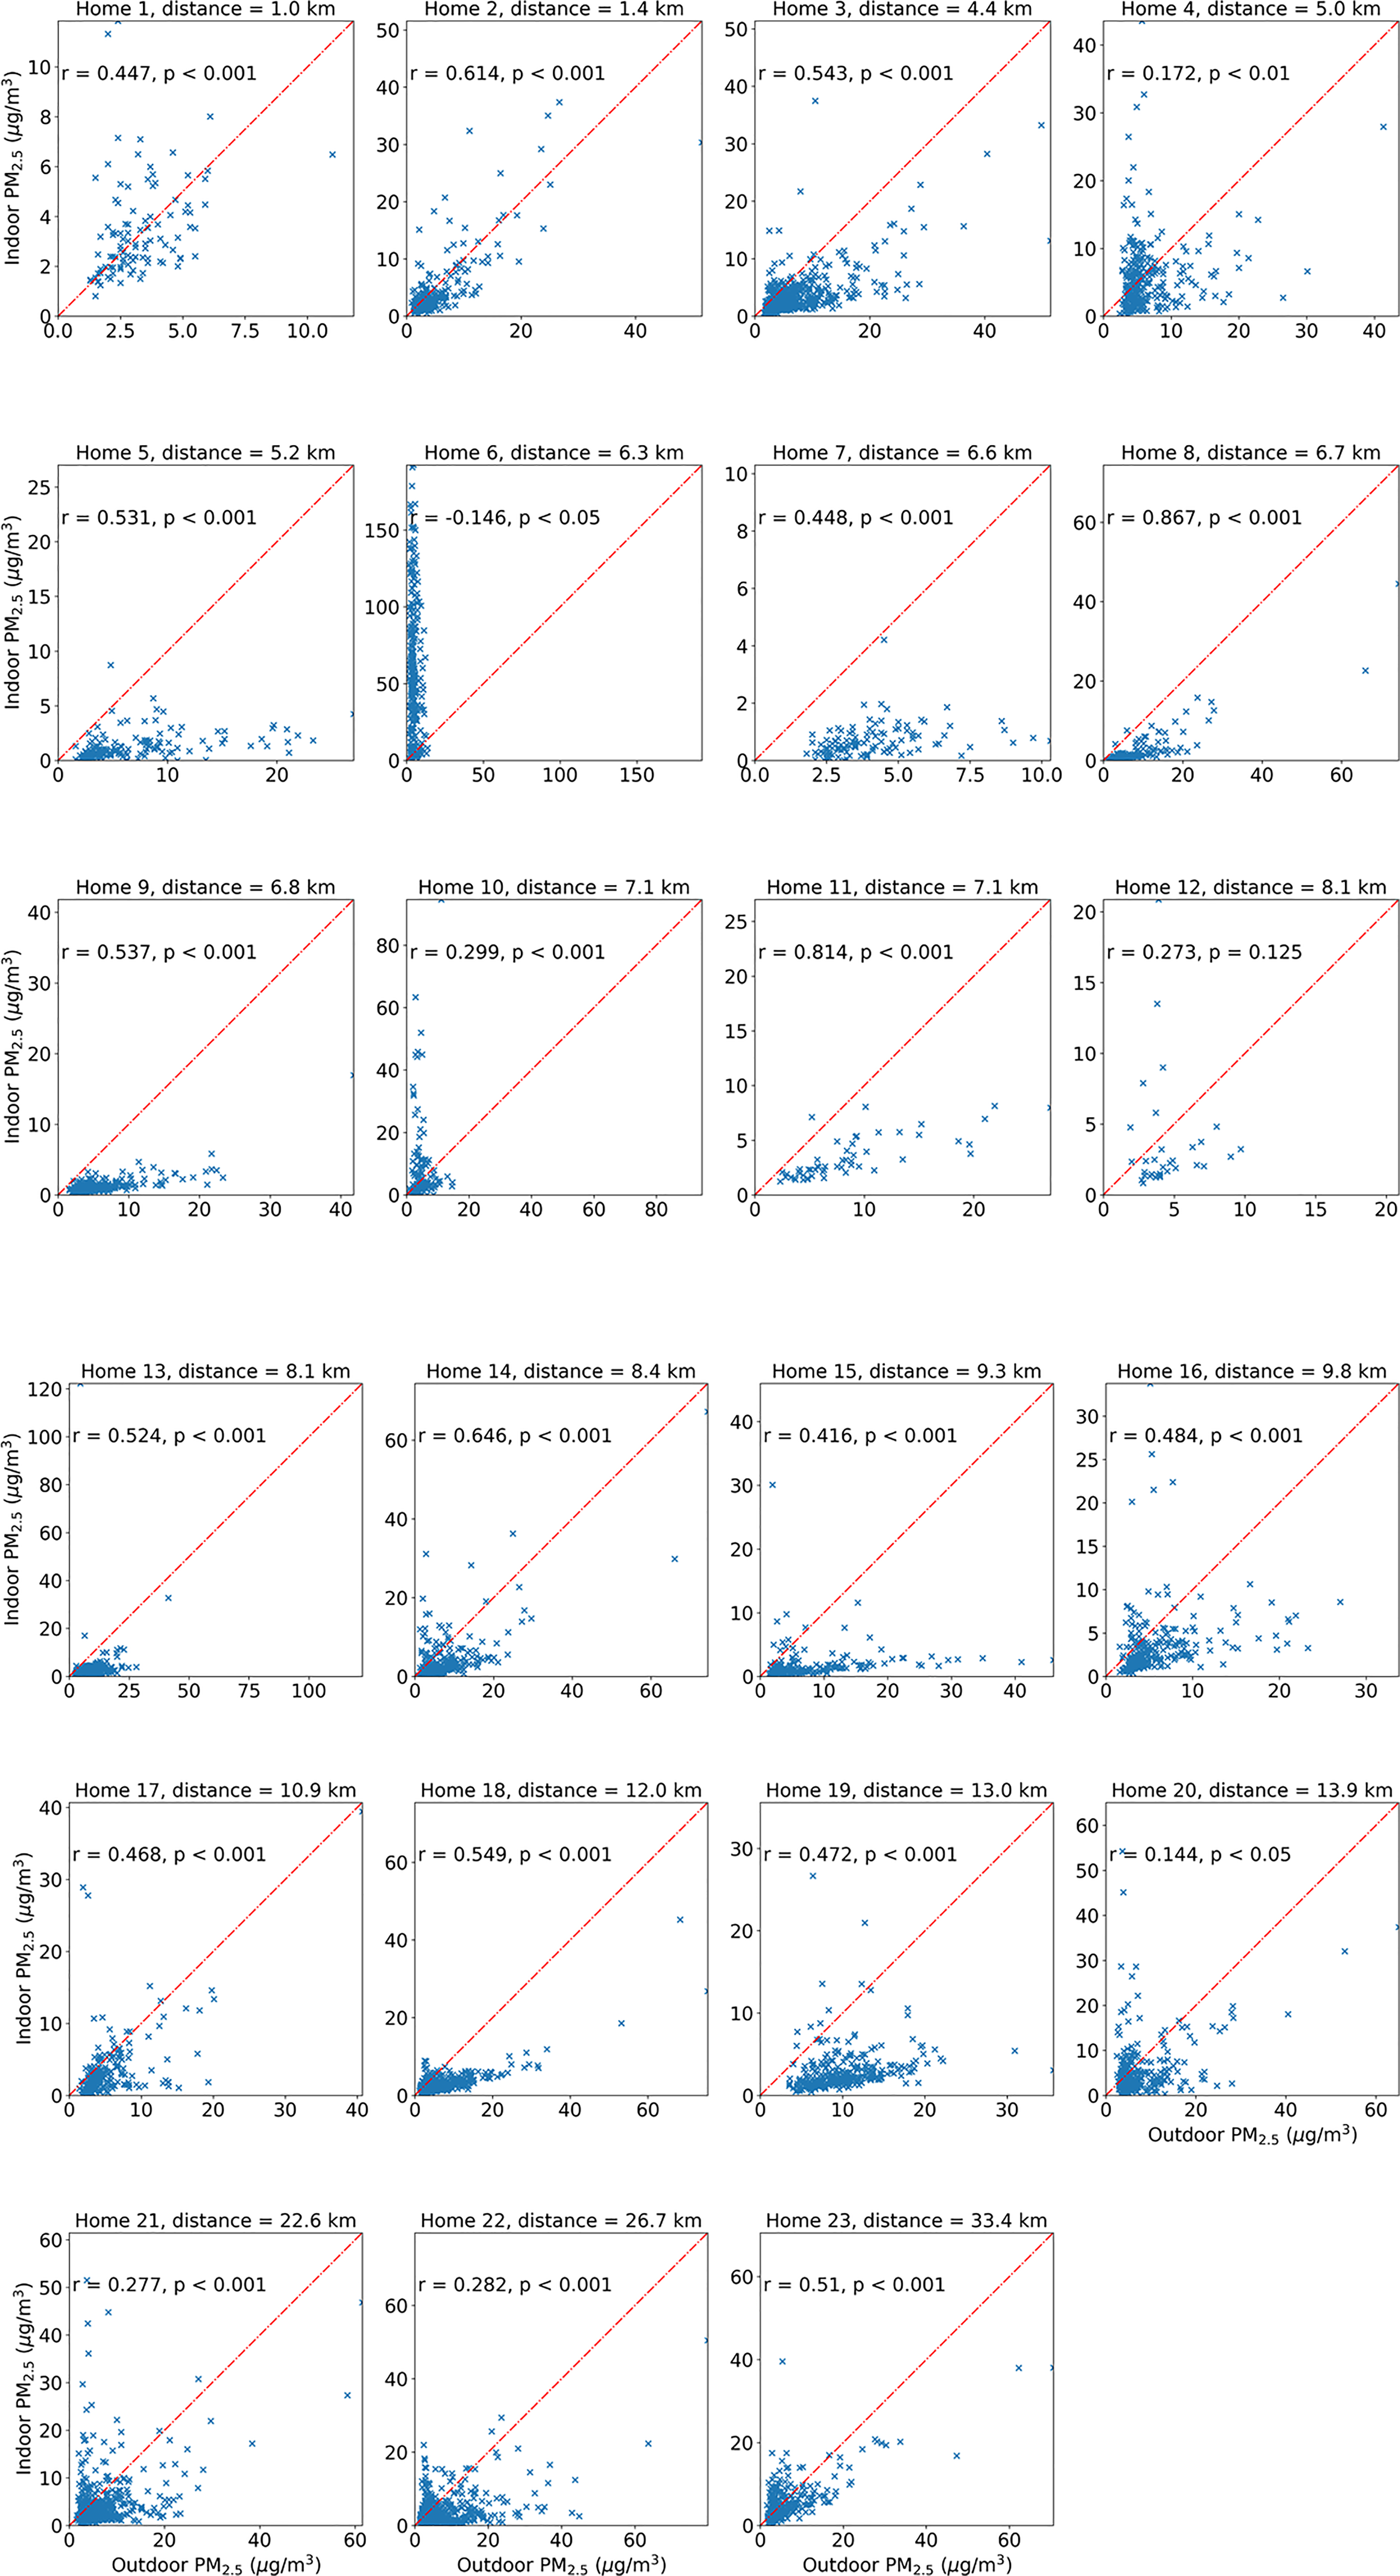
Twenty-three scatter plots (one per home) of PM2.5 measurements from in-home air monitors versus PM2.5 measurements from the nearest EPA air monitors along with the corresponding Spearman correlation coefficients (r) and p-values. The points would fall on the red dashed lines if the indoor and outdoor measurements agree perfectly.
Statistics of indoor and outdoor air quality, the Spearman correlation coefficient (indoor versus nearest outdoor records) per home, and distance between the home and the outdoor public monitor.
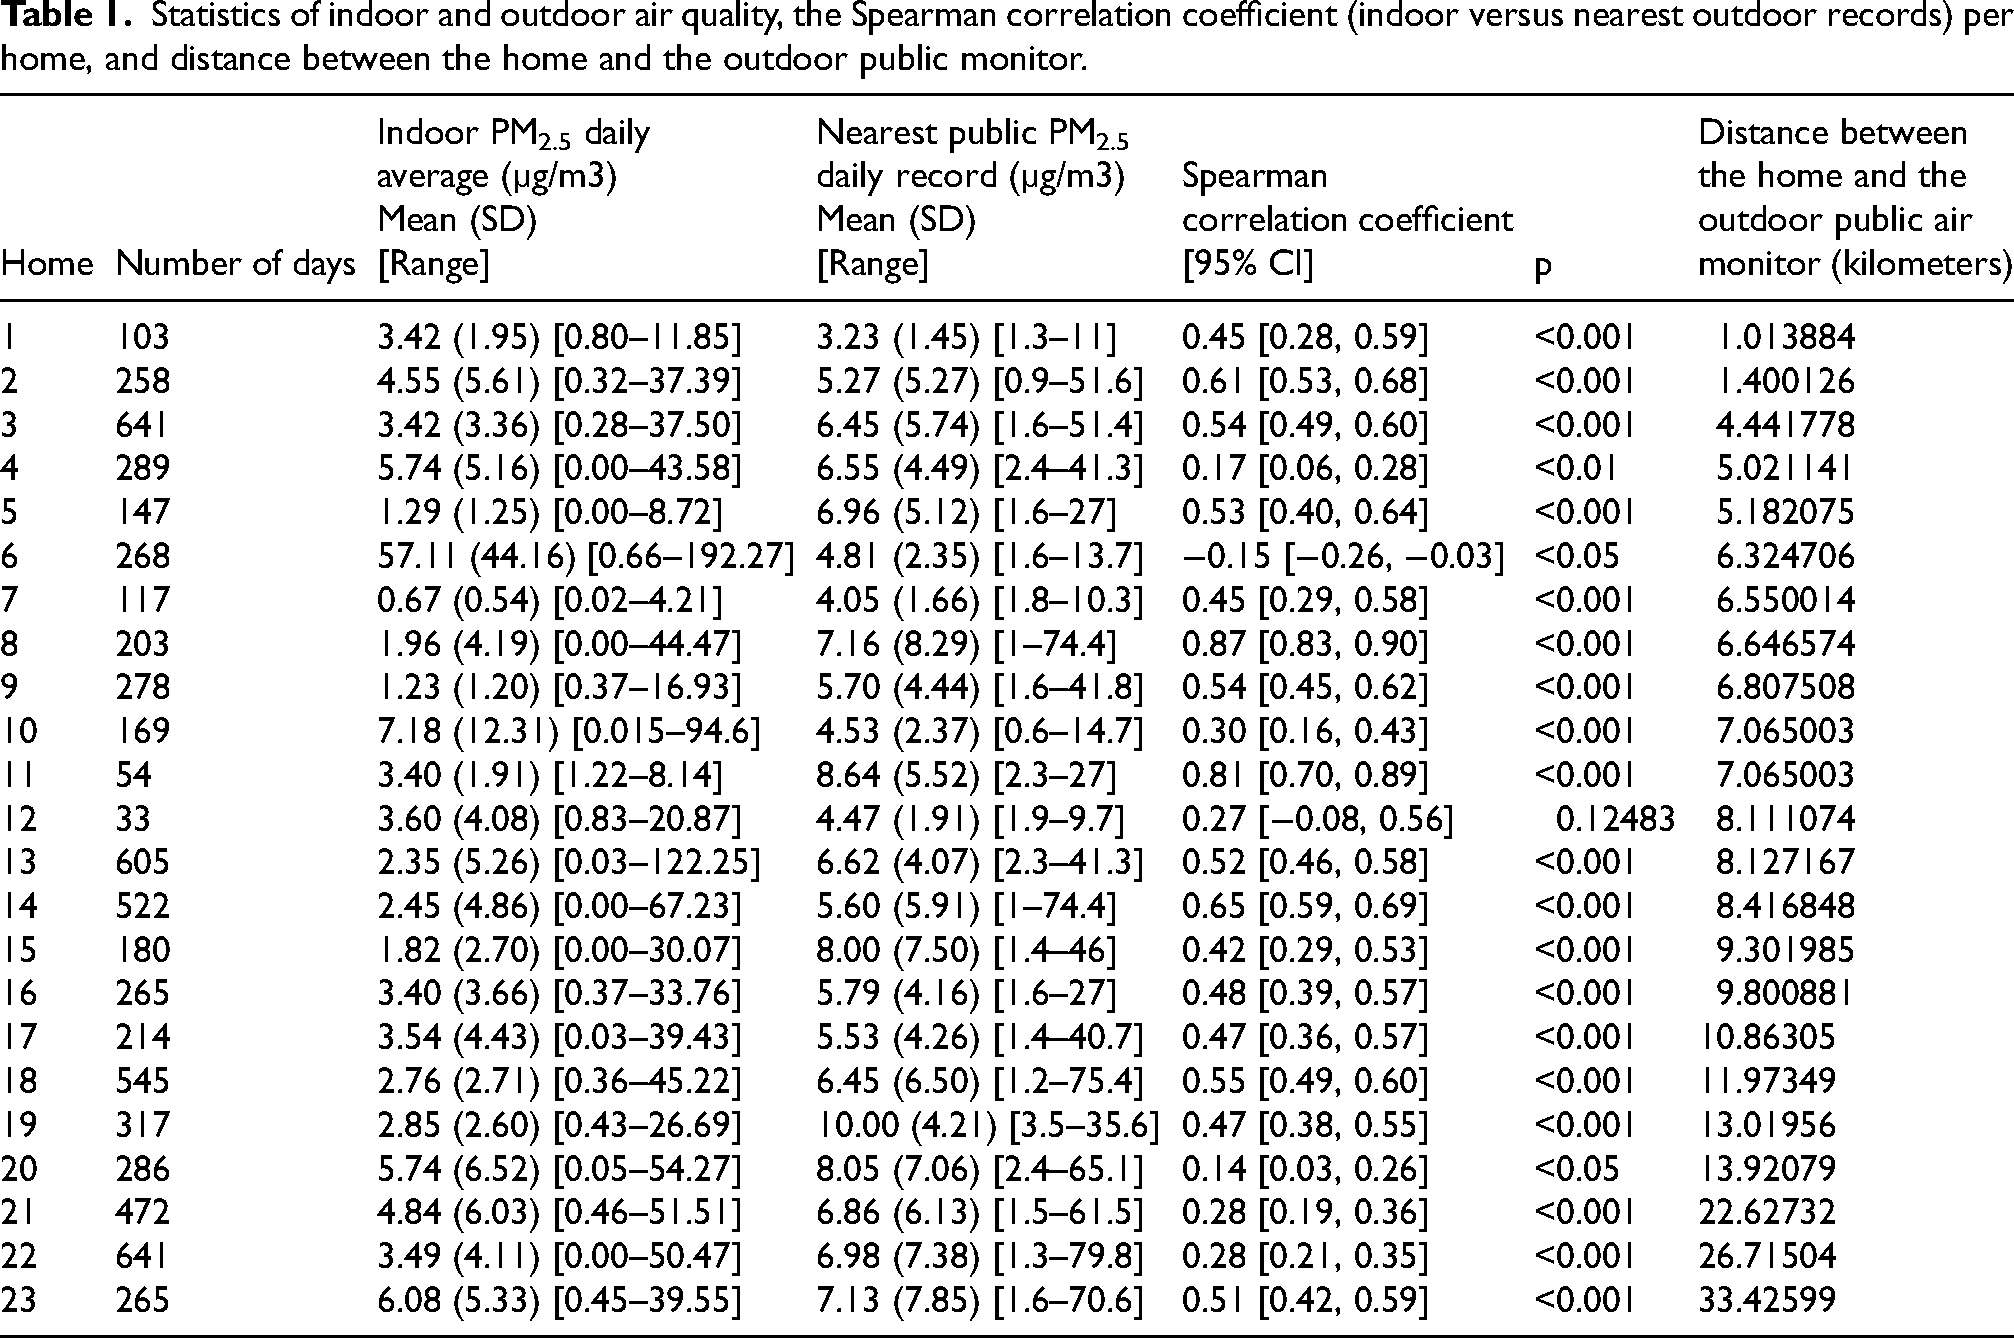
Figure 2 shows the plots of the outdoor PM2.5 measurements from the nearest public air monitors and indoor PM2.5 measurements versus calendar date, along with the EPA's 24-h PM2.5 level recommendation. As seen in both Figures 1 and 2, indoor PM2.5 were generally lower. However, there were days when the indoor air quality was much worse (i.e., higher PM2.5) than the outdoor air quality with frequent large spikes in the indoor PM2.5 measurements. Also, the air qualities were much worse during the month of October 2022 across all homes because of the wildfires that occurred in Oregon during that time. The average indoor PM2.5 measurement from all homes before the month October 2022 was 3.62 µg/m3 while in the month of October 2022 the average indoor PM2.5 measurement was 8.81 µg/m3.
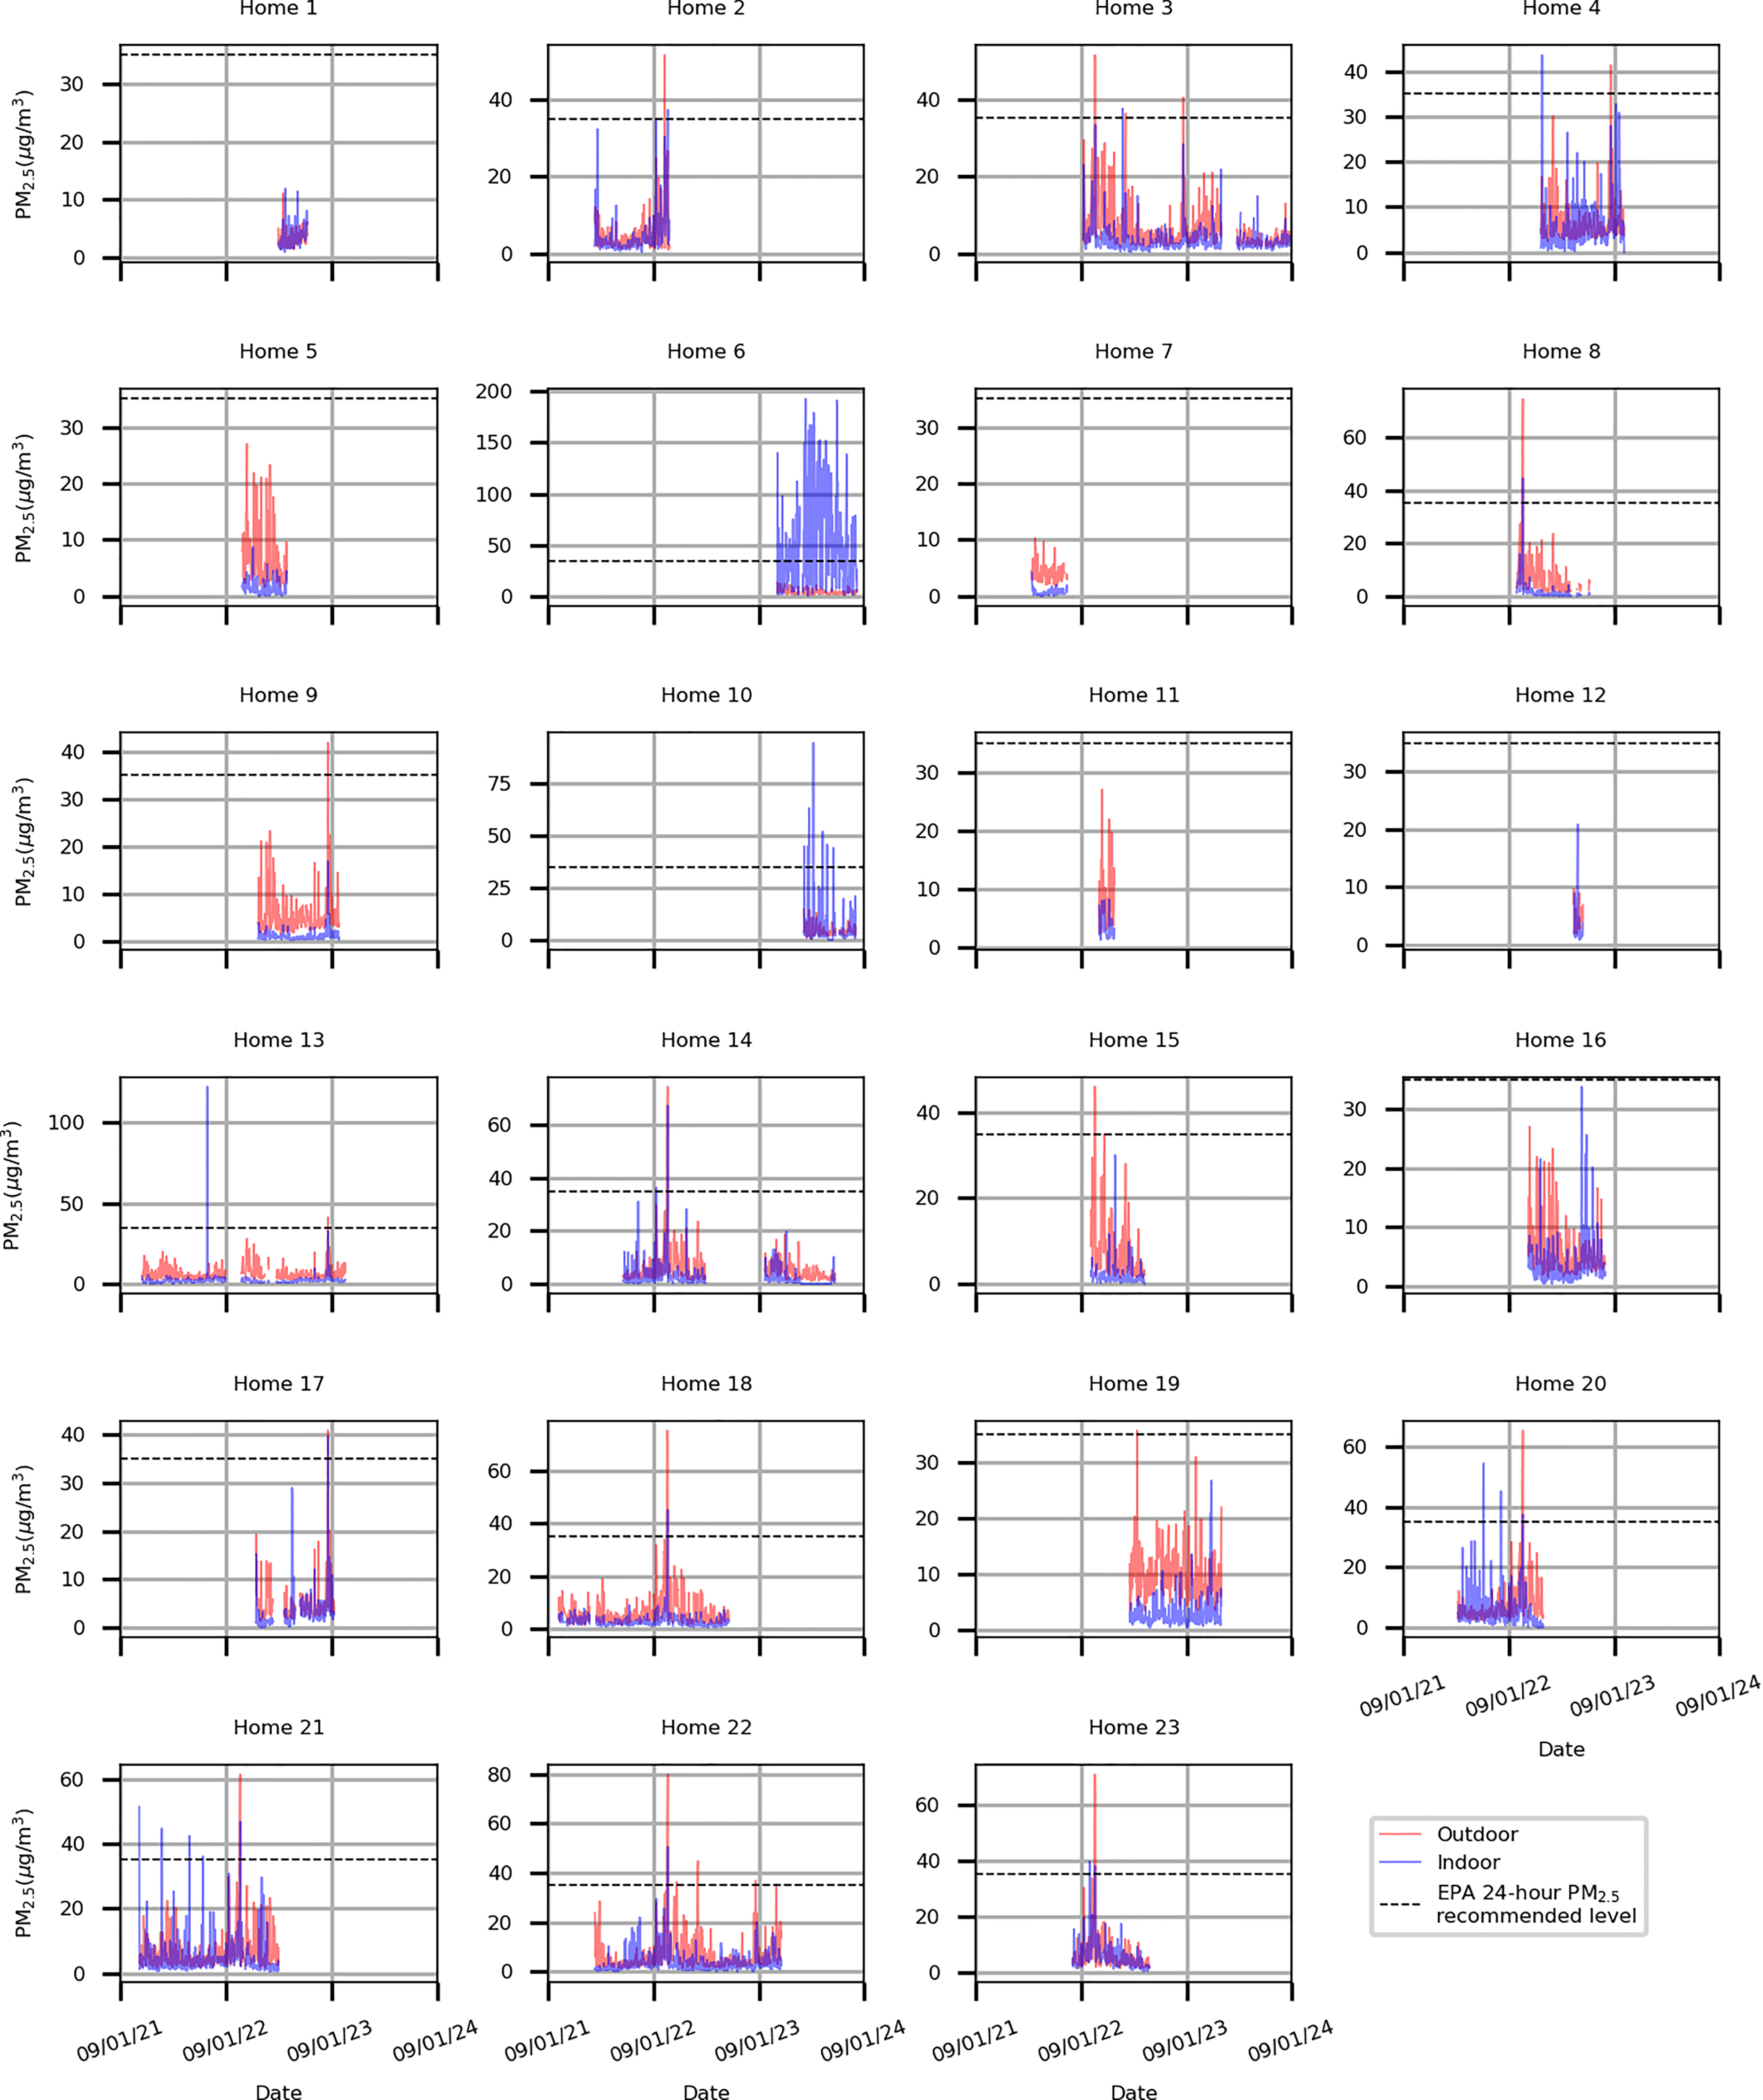
Twenty-three plots (one per home) of outdoor air quality from the nearest public EPA air monitor (red) and indoor air quality (blue) versus date, along with the EPA's 24-h PM2.5 recommendation (dashed black line). Only days with indoor air quality data are shown. Participants living at these homes enrolled into the study on different days and therefore the start dates of data collection are different for these homes.
Correlations versus distances
Figure 3 shows a scatter plot of Spearman correlation coefficients between the indoor and outdoor PM2.5 measurements versus the distances between the homes and the nearest outdoor air monitors for the 23 homes and their linear regression line. As seen from the regression line, the longer the distance between the home and the outdoor air monitor was, the lower the correlation between indoor and outdoor PM2.5 measurements was, even though the association was not significant at the 0.05 level (p-value = 0.42).
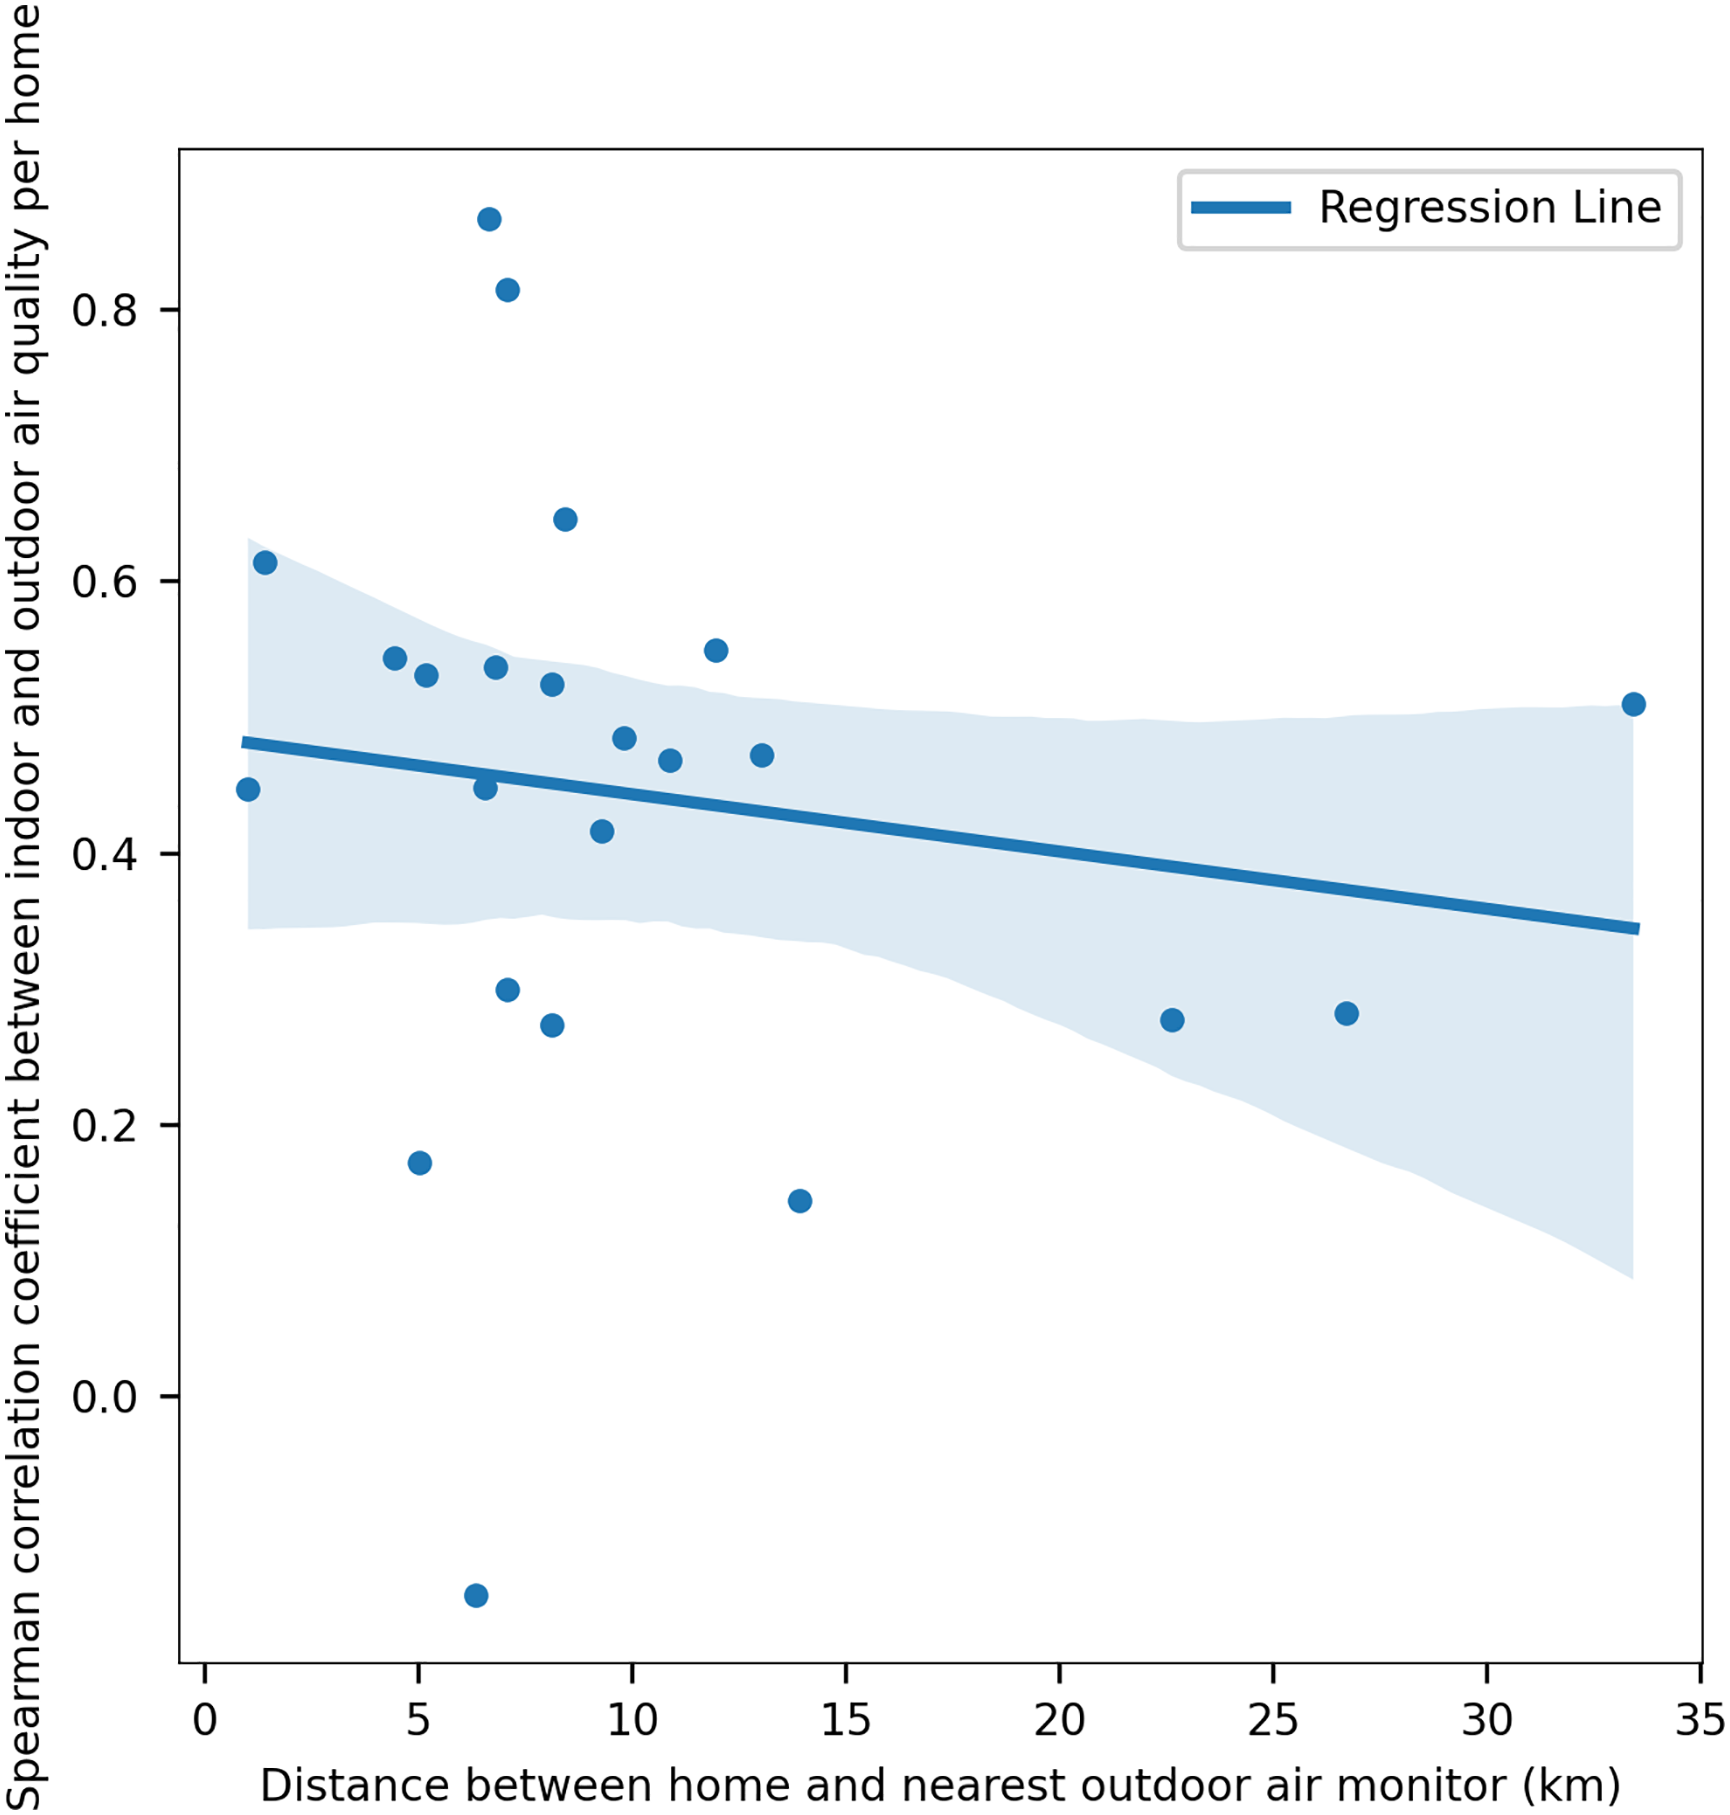
Scatter plot of Spearman correlation coefficient of PM2.5 measurements obtained in home correlated with outdoors versus distance between home and the nearest outdoor air monitor for the 23 homes, regression line and confidence interval (shaded area around the regression line).
Three-way comparison among indoor, HAQES air quality forecast data, and outdoor air quality data
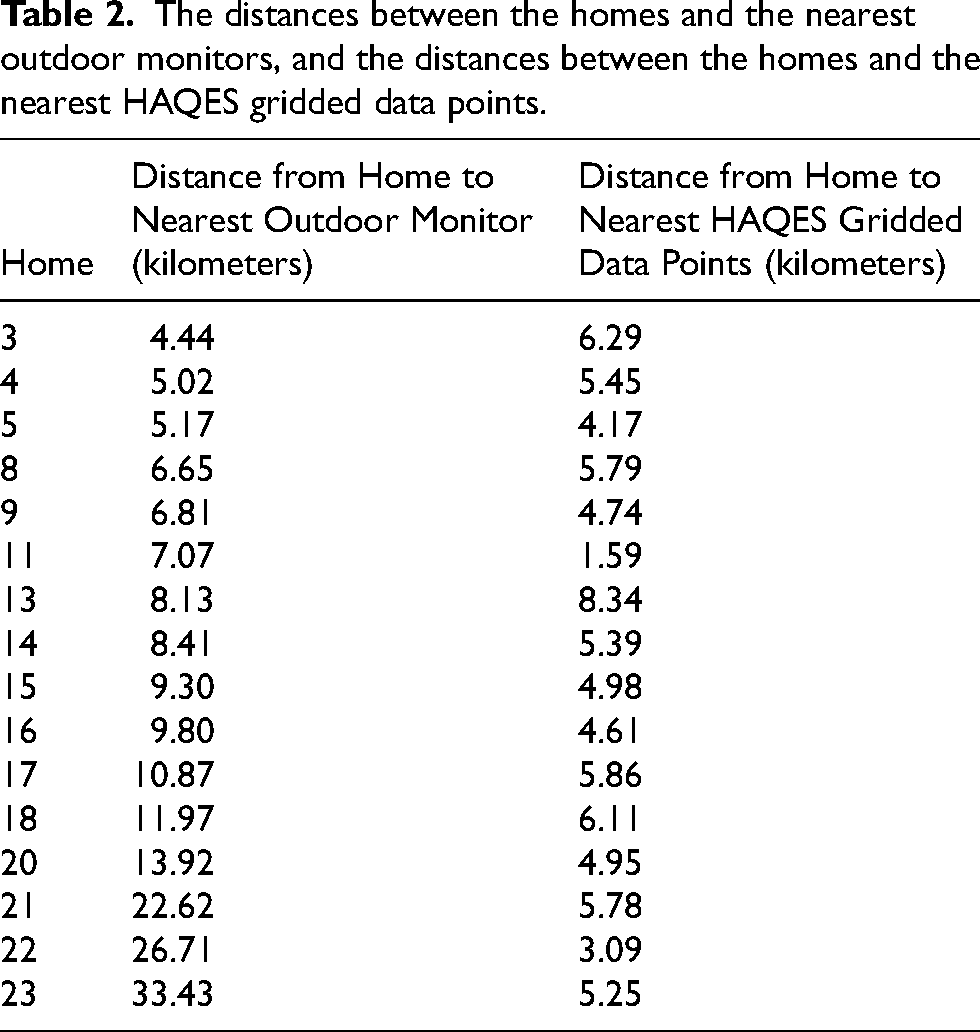
Figure 4 shows a visual of the HAQES data for the estimated average daily PM2.5 level data for December 18–31, 2022. The air quality was worse for the more populated areas. Figure 5 shows the daily average PM2.5 levels for the 16 homes from which data were collected during December 18–31, 2022 along with estimates from the gridded HAQES data and nearest outdoor air monitors. The indoor PM2.5 levels were generally lower but occasionally could spike and even exceeded the US EPA 24-h PM2.5 recommendation (< 35 µgm/m3). Table 2 shows the distances between the homes and the outdoor public air monitors and between the homes and the HAQES gridded data. If the homes and the public air monitors were very far apart, the HAQES provided gridded data that were much closer to the homes.
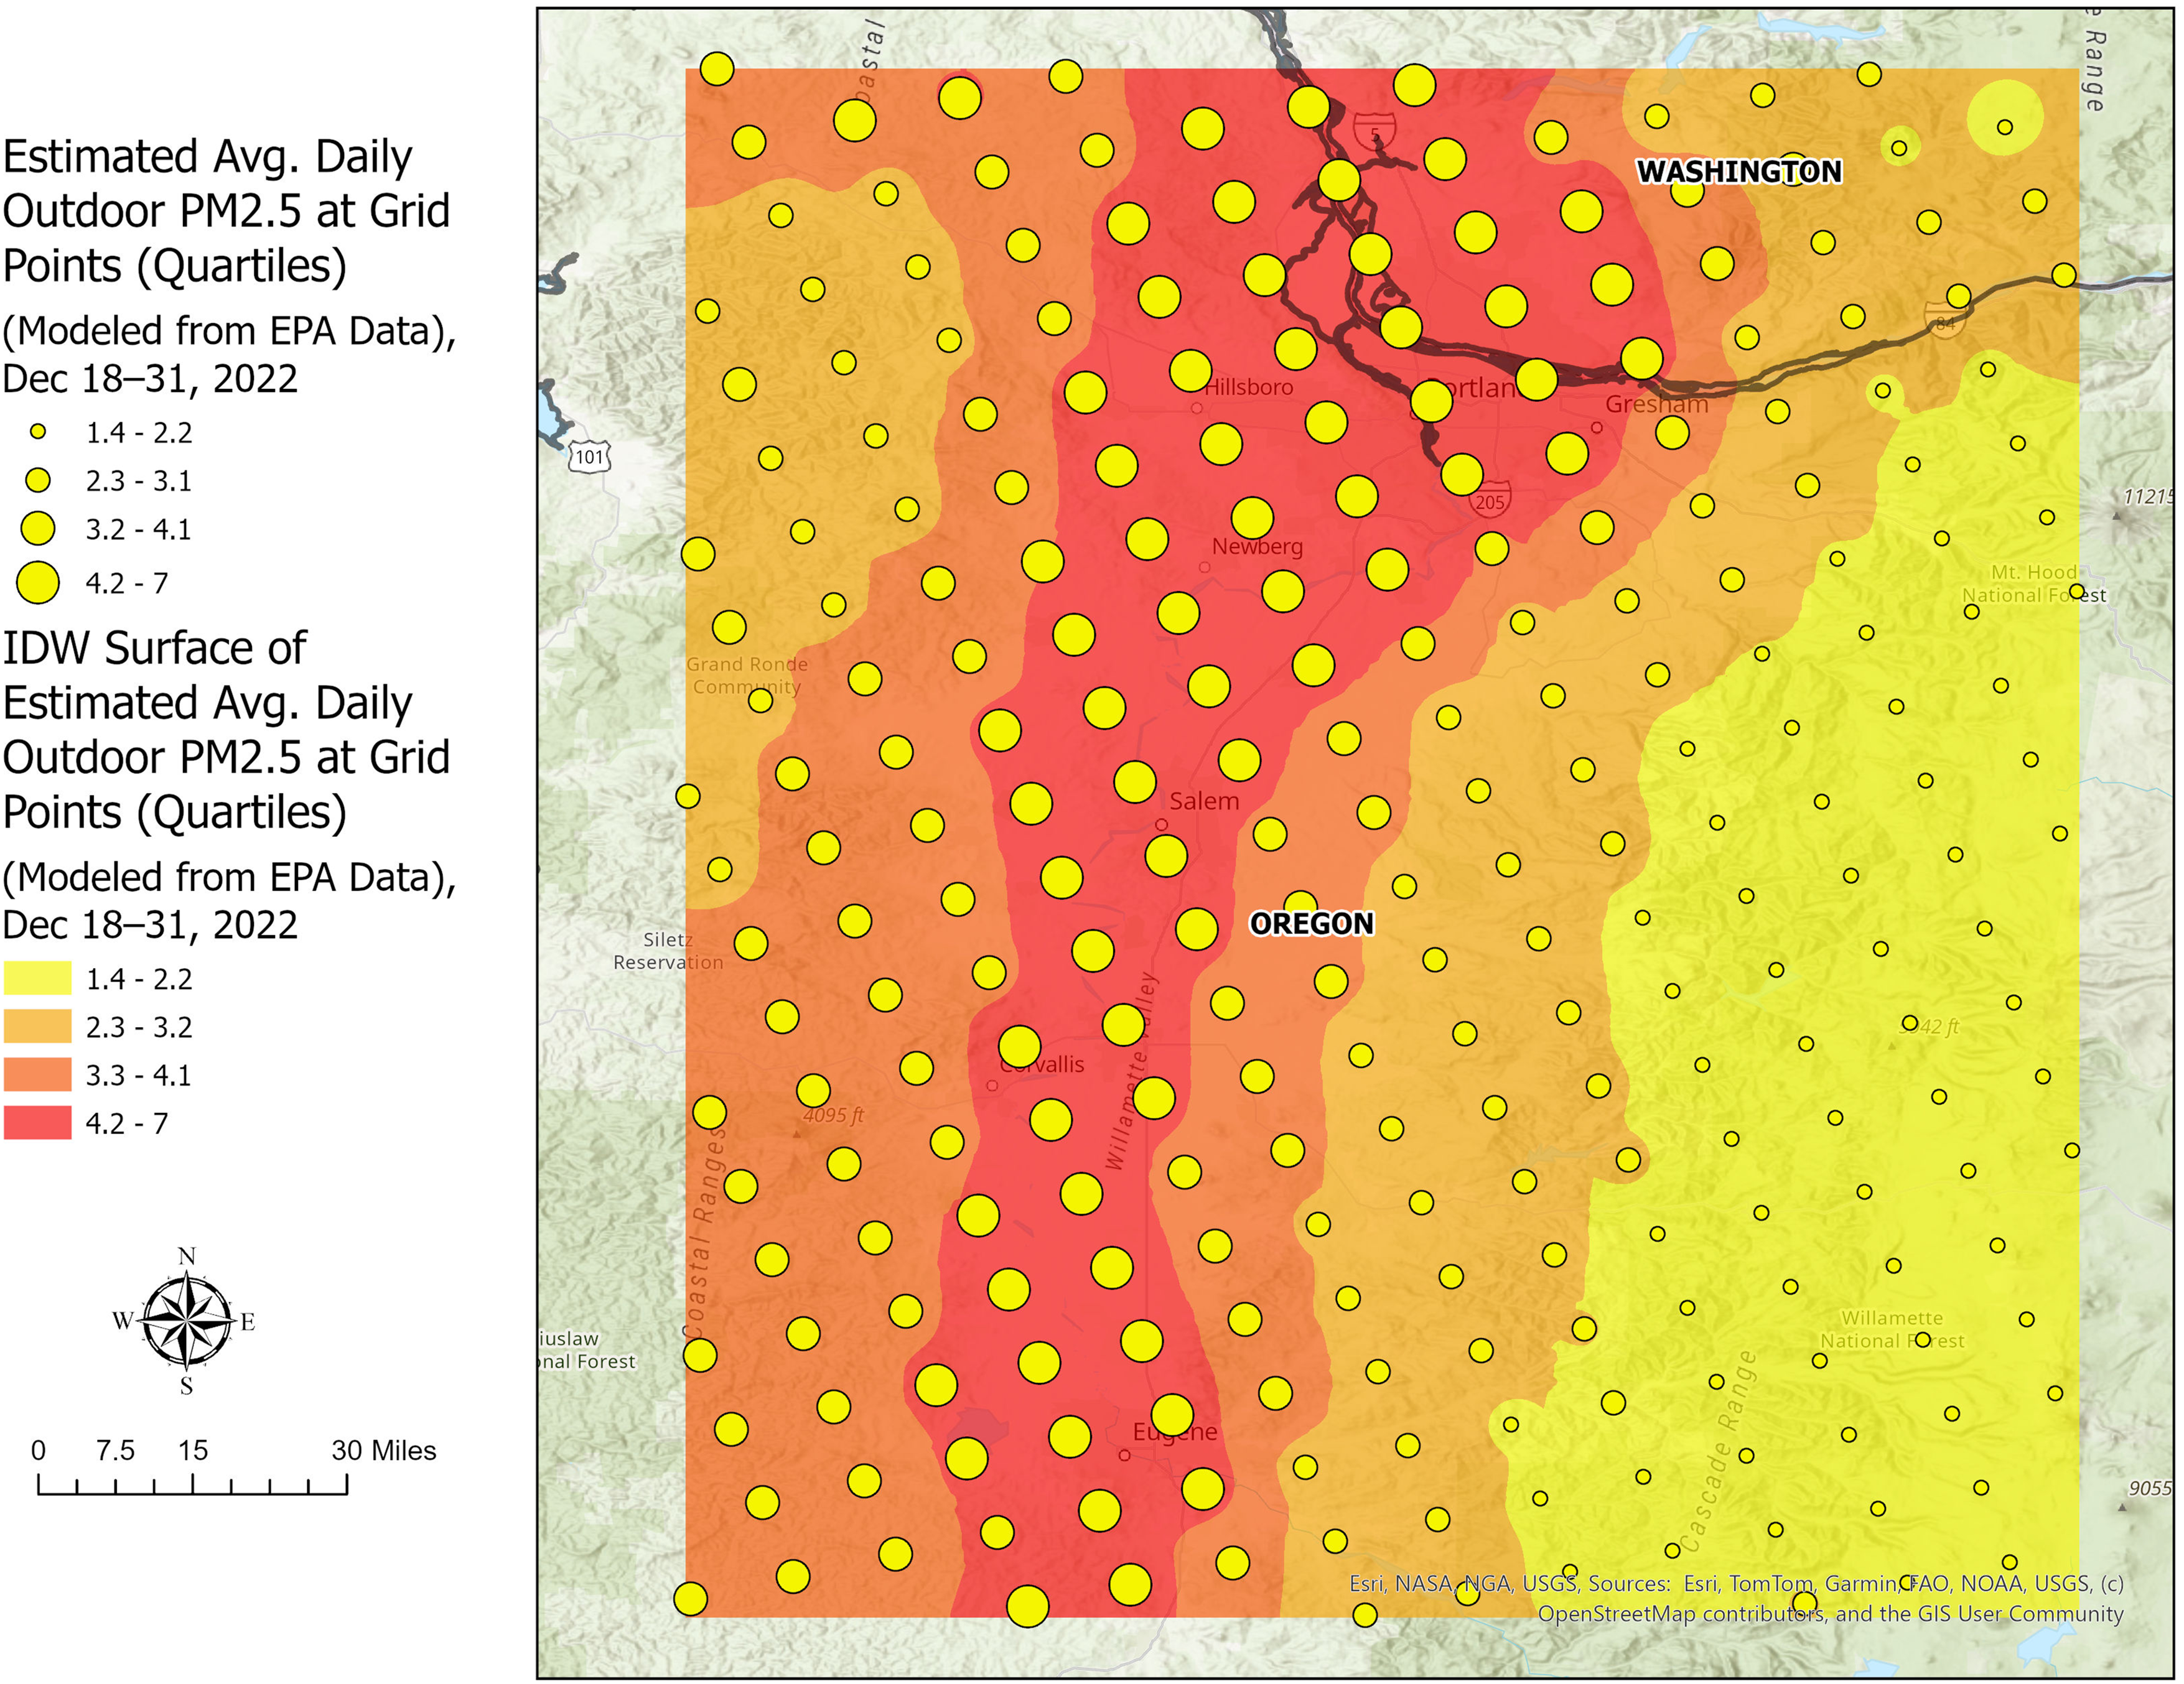
Average daily modeled PM2.5 levels at the grid points from HAQES. Beneath these points is an Inverse Distance Weighted Surface Map based off of the average daily modeled PM2.5 levels.
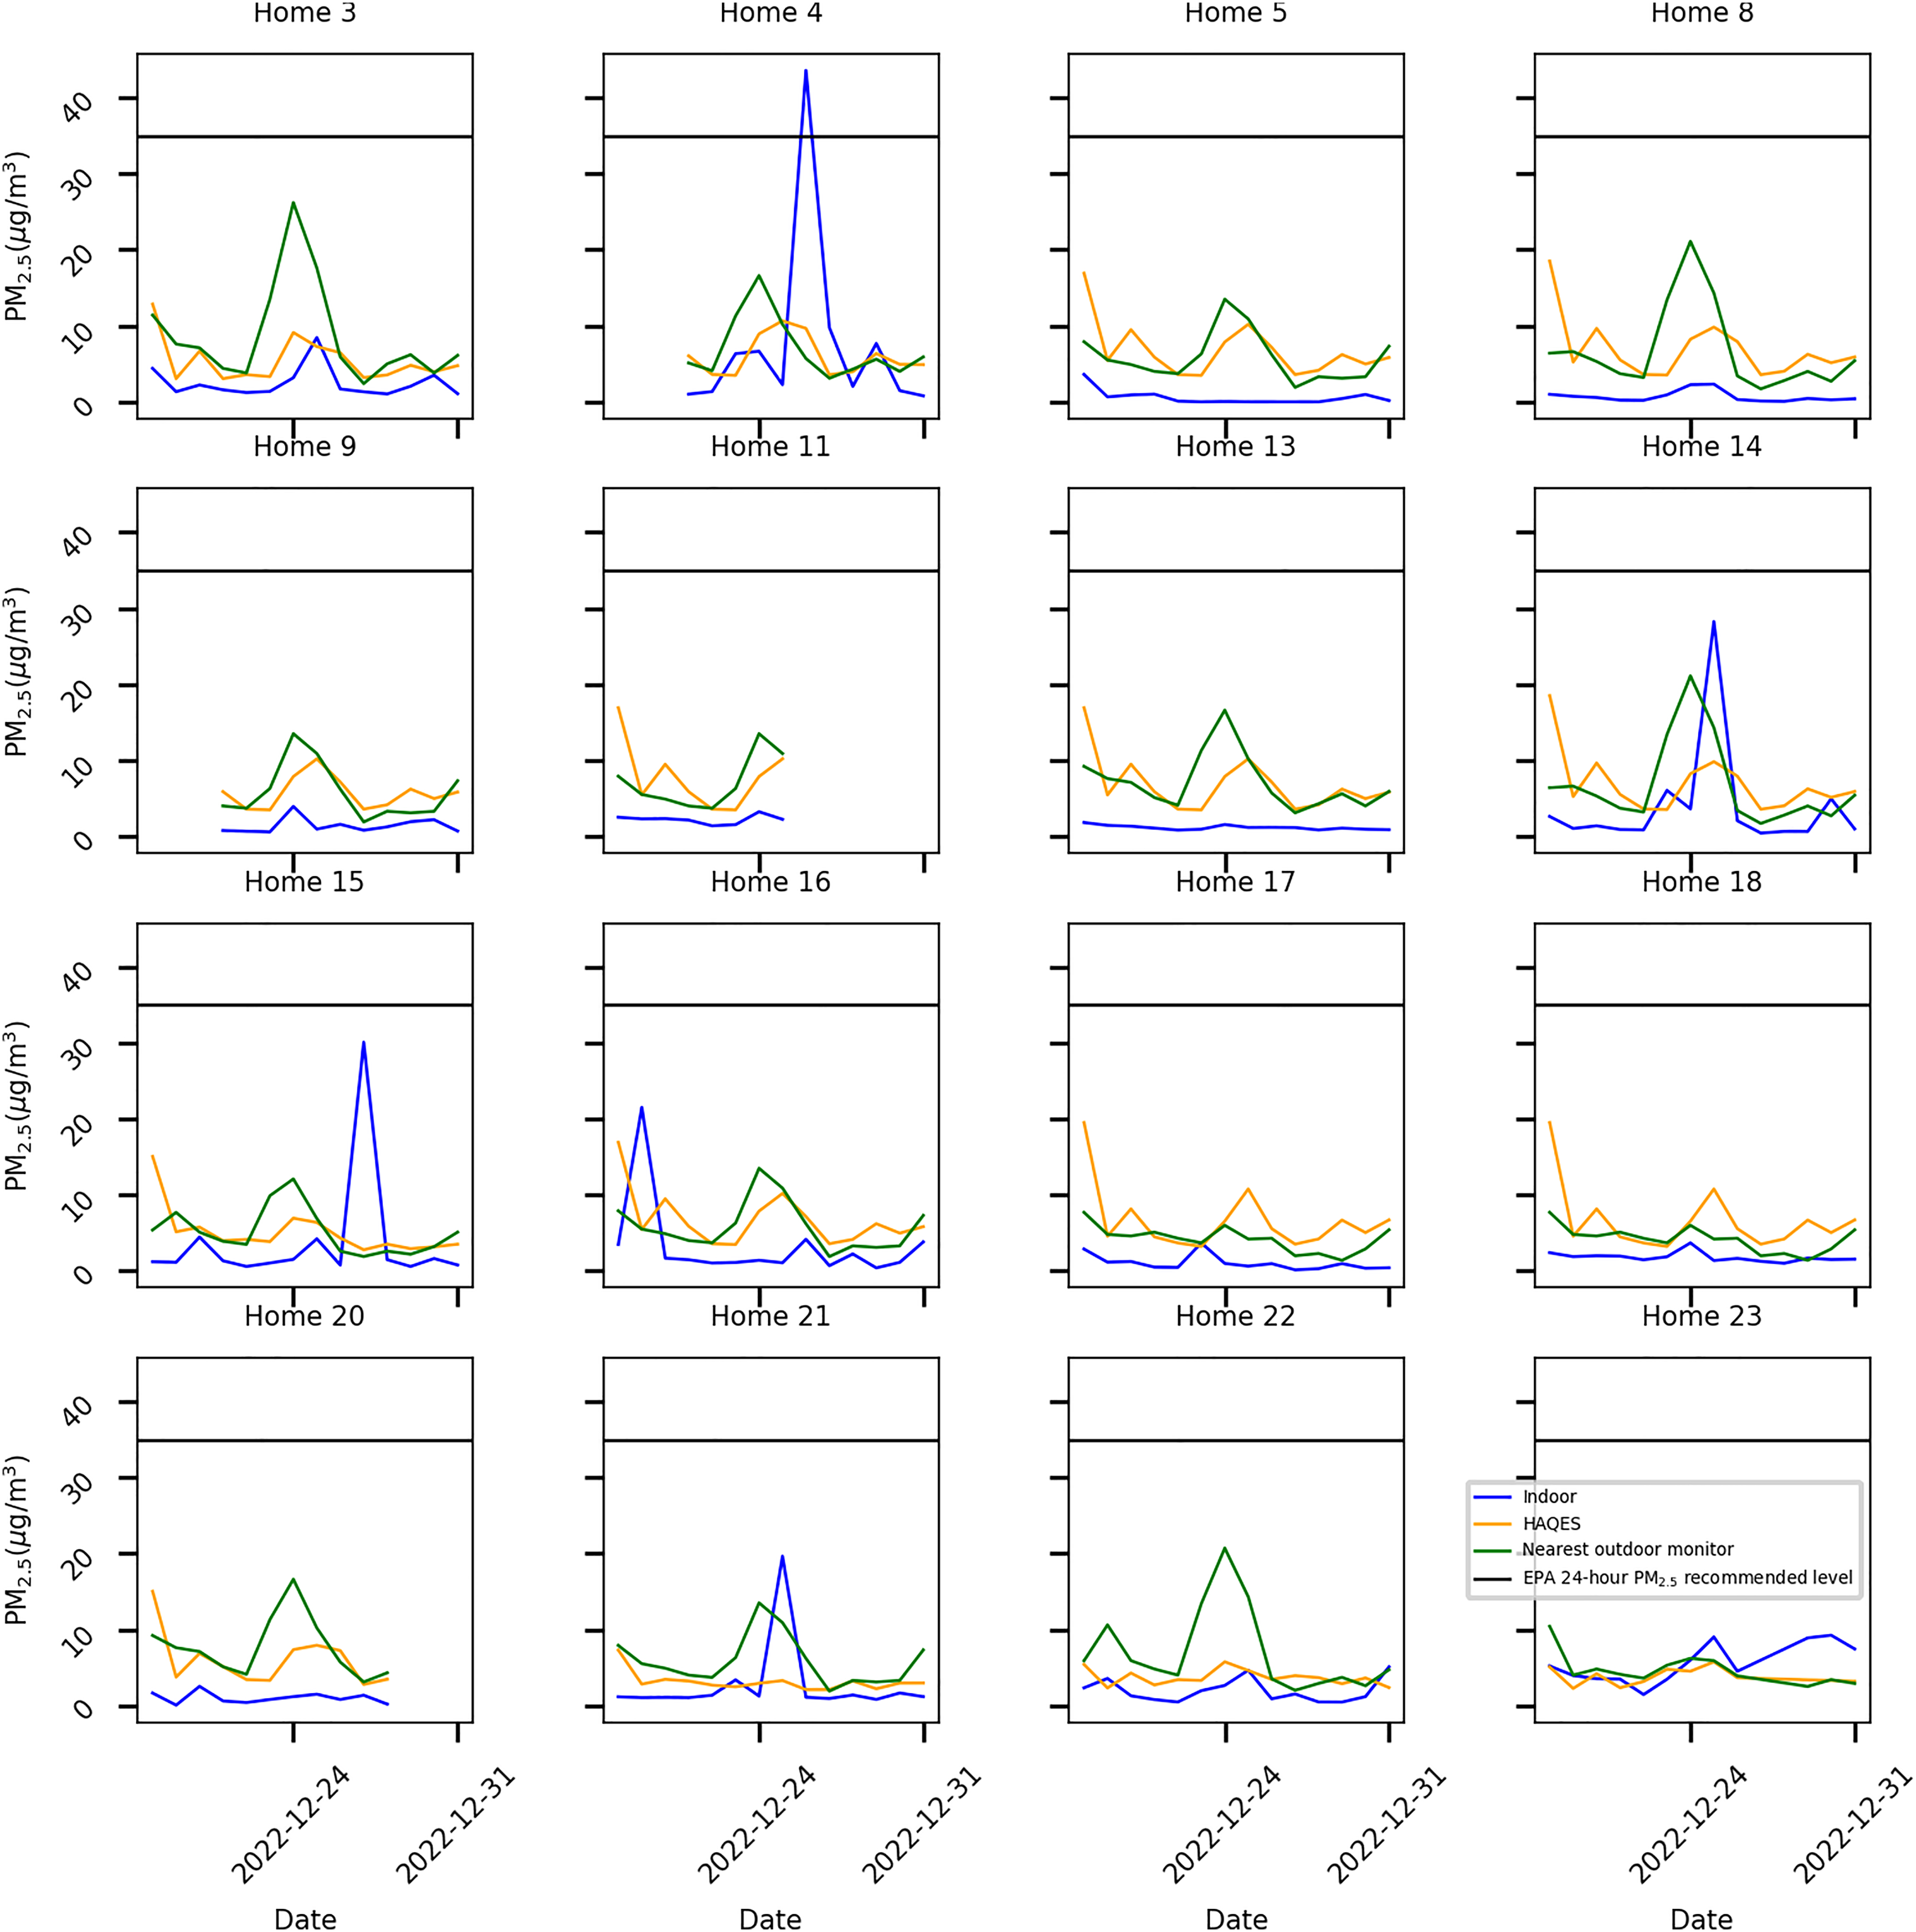
Average daily PM2.5 level measured indoors (blue), estimated through the HAQES data (yellow), and measured through nearest outdoor air monitor (green) for the 16 homes from which data were collected during the last 2 weeks of 2022.
The distances between the homes and the nearest outdoor monitors, and the distances between the homes and the nearest HAQES gridded data points.
As seen from Figure 6, indoor mean PM2.5 levels for the 16 homes were significantly different from both the PM2.5 levels measured by the nearest public outdoor air monitors and forecasted HAQES air quality data. This shows that even though the HAQES ensemble model provides estimates for PM2.5 levels at a higher spatial resolution, they still may not represent the PM2.5 levels indoors.
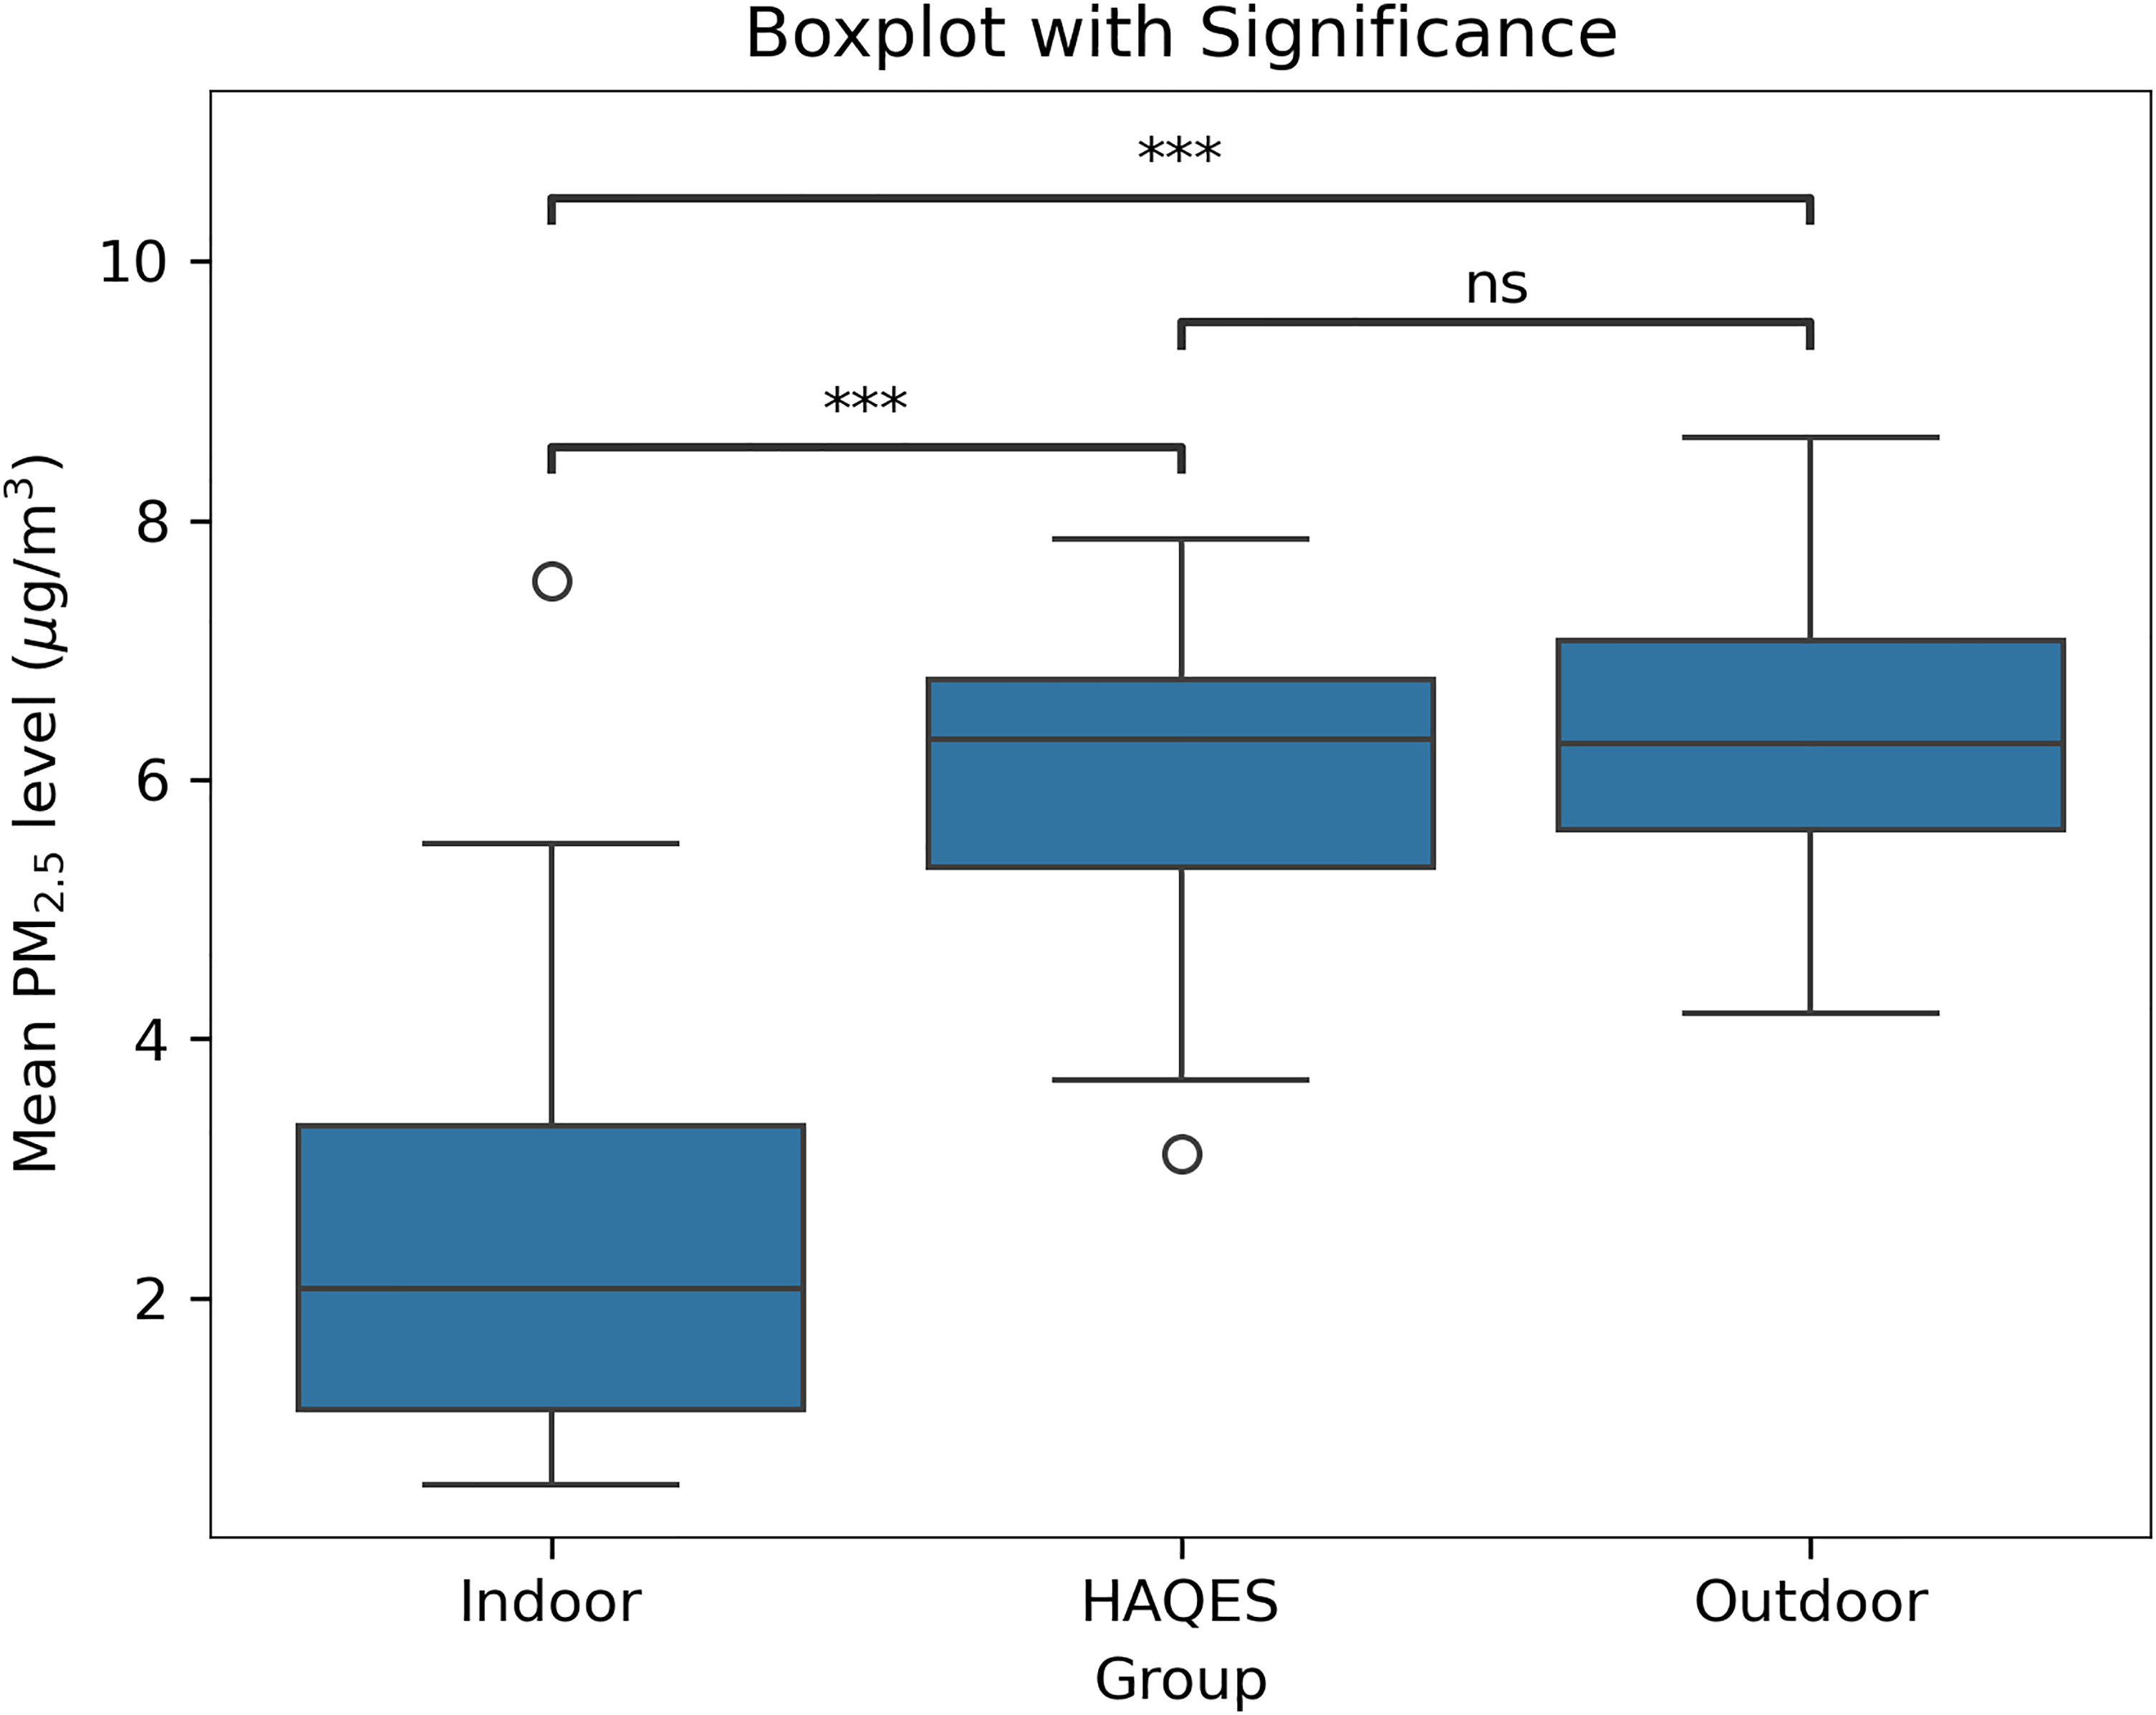
Boxplot showing the mean PM2.5 level measured indoors by the Awair Omni, calculated by HAQES and the nearest outdoor public air monitors for the 16 homes which had data for December 18–31, 2022, along with the significance from Wilcoxon signed-rank tests. ***p < 0.001.
Daily PM2.5 level profile analysis
Figure 7 shows the daily mean profile of PM2.5 at hourly intervals for the 5 homes with least variability and the 5 homes with most variability. For Home 6, the night-time PM2.5 levels were hazardous while for Home 10, both mean PM2.5 level and its variability were higher during the daytime than the night-time. These may be due to use of home appliance during the night and indoor activities during the day.
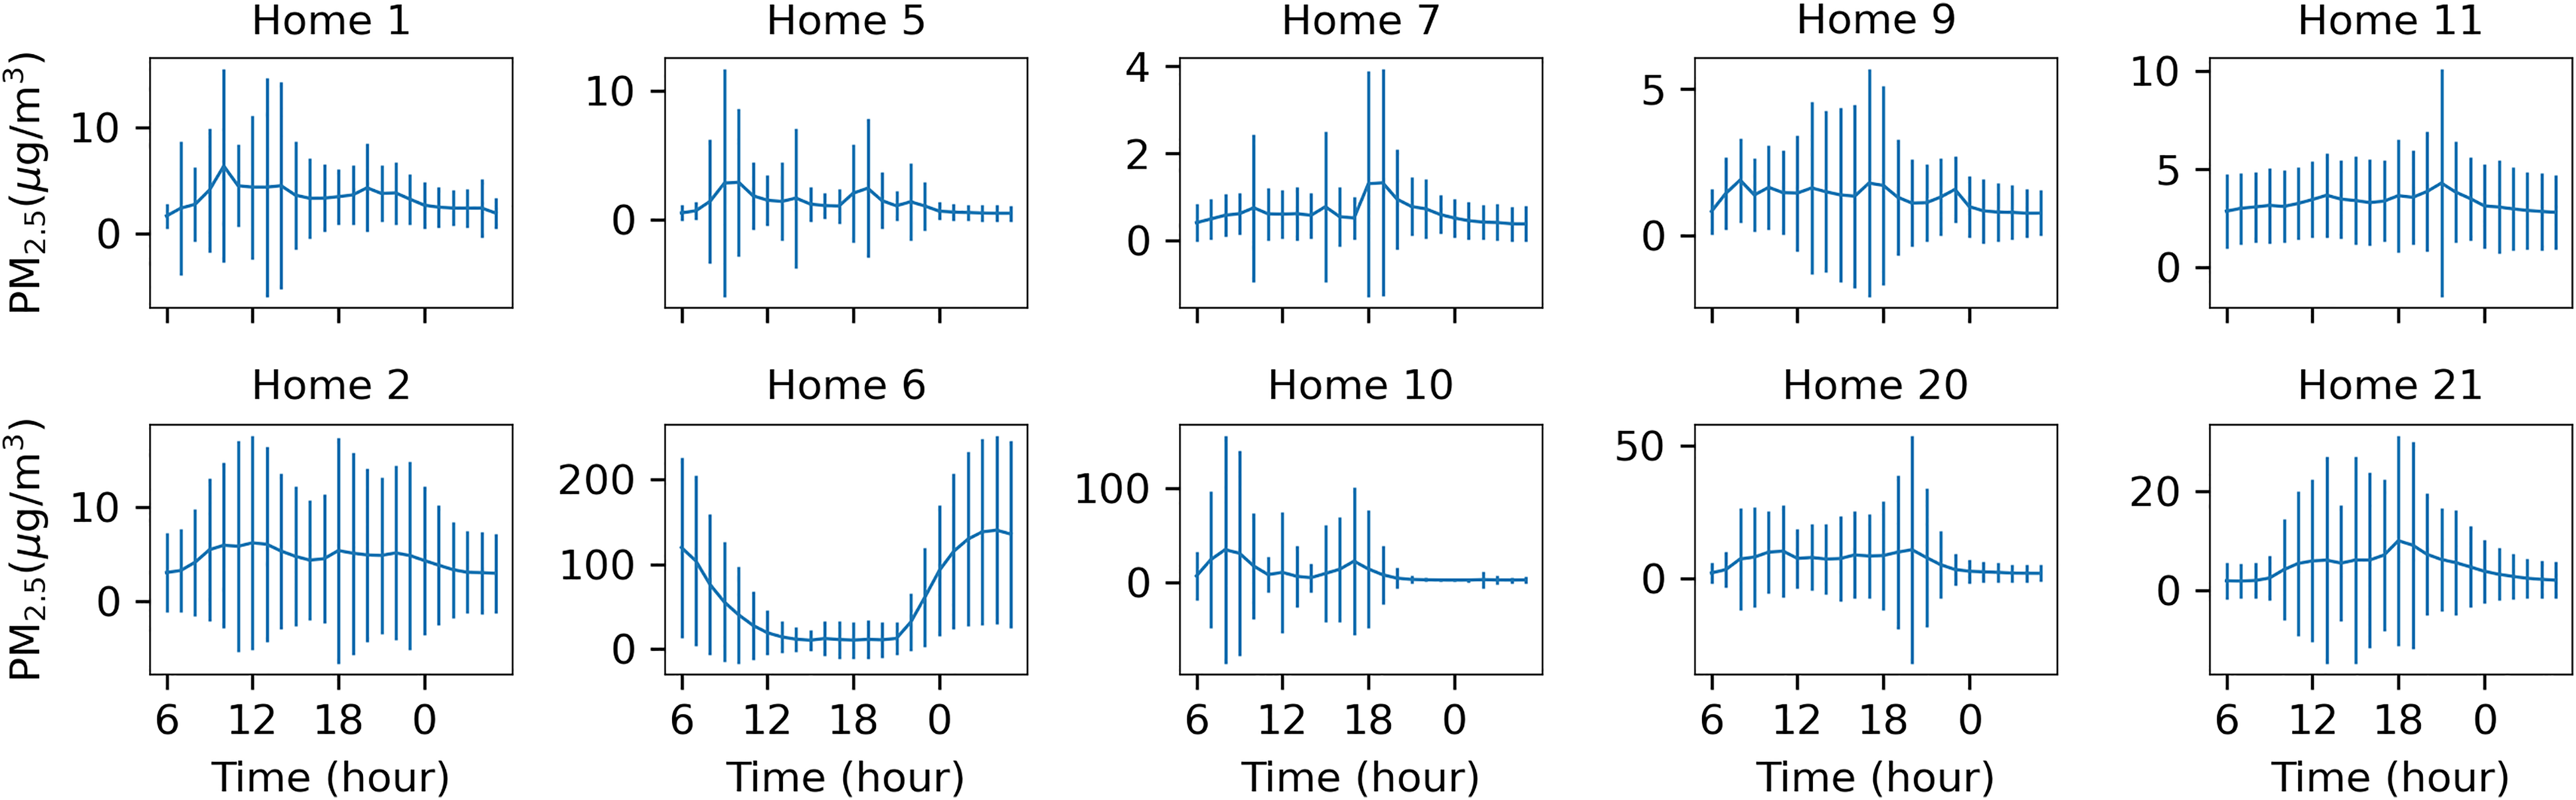
The daily mean profile of PM2.5 at hourly intervals for the 5 homes with the smallest variability of PM2.5 (top row) and the 5 homes with the largest variability of PM2.5 (bottom row). The vertical lines along the profiles are showing the standard deviations for those hours.
Discussion
In this analysis of the relationship of outdoor PM2.5 and estimates from HAQES to indoor, home-based PM2.5 measurements, we found that there was a wide range in the strength of this correlation and the strength of correlation may depend on the distances between the homes and the public air quality monitors though not statistically significant in our data. For each home there was typically high variability in day-to-day readings over time and within this variability, the indoor PM2.5 measurements were usually lower than outdoors. Nevertheless, occasionally indoor PM2.5 was much higher than outdoor measurements. Fourteen of the 23 homes during the monitoring period had levels suggested by the Indoor Air Hygiene Institute to be concerning (spikes in daily PM2.5 levels above 35 μg/m3). 13 Notably the spikes in PM2.5 detected at home were not reflected in most outdoor measures. Such “spike” periods may have been affected by indoor activities and may not be detected by an EPA station located even close to a home such as use of home appliances, burning wood in a fireplace, burning candles, cooking, smoking, or vigorous house cleaning. 14 The HAQES data did not provide a better correlation or proxy for indoor air qualities. This study underscores the importance of indoor air quality monitoring to accurately estimate an older adult's air quality exposure over time.
Despite the fact that the older population tends to spend most of their time indoors in their home and there are imperfect correlations between indoor and outdoor air quality as currently assessed, a majority of epidemiologic studies1–4 have reported a relationship between outdoor air quality and dementia incidence with few exceptions. 15 This may reflect several factors in play. The overall air quality of a region can certainly affect the indoor air quality experienced over time. Thus, for example, during wildfire periods indoor air quality may be uniformly degraded across a large population. 16 However, experienced at the individual level, the degree of this exposure may vary depending on a dwelling's ventilation and air-tightness, 17 as well as each individual may have other personal behaviors that can affect their local home environment over time ranging from pet exposures, use of home appliances, to cleaning and cooking activities. To improve our understanding of the relationship of dementia to air quality and the environment, estimates of air quality exposure will need to improve in several ways. First, at the macro level, providing denser and more evenly spaced air monitor coverage of local areas will allow a more direct tying of the true everyday outdoor ambient environment that a person may experience when outdoors. Second, at the micro or personal home level, assessment of indoor residential sensors will be important as we have shown in this study that the indoor environment could often be hazardous. There were days when indoor air quality reached a concerning range not reflected in the outdoor measurements. Indoor activities and use of for example home appliances such as a humidifier could significantly influence the indoor air quality. 18 Finally, connecting all the air quality data to time of actual exposure by location whether outdoors or within a dwelling, as well as more detailed accounting of the person-level environment (e.g., household size, dwelling type, insulation and air infiltration), and occupants’ behaviors and activities (e.g., periods of cooking, cleaning, smoking), will help provide the most precise data to be able to gain insight into the mechanisms that drive the relationship of air quality to cognitive impairment and dementia over time.
This study had limitations. First, we have air quality data from only 23 homes, with all except one located in the state of Oregon in the United States. Therefore, the results may be limited in their generalizability. Another study limitation is that the devices used for collecting the air quality data are different between outdoor and indoor conditions. The Awair Omnis, which are relatively low-cost commercial-grade indoor air quality monitors were used to collect indoor air quality, while the data sources of outdoor air quality were from publicly available outdoor measurements generated from the EPA's Air Quality System (AQS) networks which use a variety of sensor systems dispersed in the field which are frequently calibrated. 19 It would be ideal to use the same sensors for indoor and outdoor measurements. However, that would not be affordable nor scalable given the cost of the sensors used in the AQS networks. The Awair Omni device has been independently tested by RESET which provides their accreditation to help ensure trusted reliable and scalable indoor air quality assessments to primarily the building industry. As such, within the limitations of inherent variability of these devices and real-world measurements, these data can be considered consistent for the purposes of demonstrating a proof of principle relationship of indoor residential PM2.5 measurements to available public outdoor monitors. Future studies suggesting a relationship of the ambient environment to dementia will need to take these real-world measurement conditions into careful consideration. Another limitation of this study is that limited information was collected regarding the interior characteristics of these homes such as the exact location of ventilation ducts or whether windows were left open or closed. Therefore, we were not able to identify room-specific contributing factors in the discrepancies between indoor and outdoor air quality for most homes. Future studies should collect such data. Last, the indoor air quality monitors were placed in where participants slept as participants most likely spent the most amount of time there. However, this may not capture high PM2.5 levels caused by activities such as cooking in the kitchen if they were far apart. Future studies should deploy air monitors in multiple spaces indoors, combine such air quality data with people's locations within the home, to get the most accurate air quality exposure.
This work represents an essential step toward determining the extent to which existing measures of air quality can be used for understanding cognitive health and dementia risks. While we examine the fidelity of air-quality measures at both regional and individual levels, ideally these measures can be combined with other measures of individual behavior such as time out of home, in-home activity, and home-ventilation status, to provide a more comprehensive picture of environmental- and individual-level risks and associations.
Supplemental Material
sj-docx-1-alz-10.1177_13872877251375966 - Supplemental material for Estimating daily air quality exposure of the aging and dementia population
Supplemental material, sj-docx-1-alz-10.1177_13872877251375966 for Estimating daily air quality exposure of the aging and dementia population by Wan-Tai Michael Au-Yeung, Moiz Usmani, Ryan Ramphul, Chao-YiWu, Hiroko Dodge, Joel Steele, Zachary Beattie and Jeffrey Kaye in Journal of Alzheimer's Disease
Footnotes
Acknowledgements
We thank our participants who let us into their homes to monitor their environment daily.
ORCID iDs

Ethical considerations
The study has been approved by the Oregon Health and Science University Institutional Review Board (OHSU IRB) with study numbers 18464 and 24210.
Consent to participate
Informed consents were obtained from all participants.
Author contributions
Funding
The authors disclosed receipt of the following financial support for the research, authorship, and/or publication of this article: Funded by National Institute on Aging (NIA) grants: P30 AG008017; P30 AG066518; P30 AG024978; U2CAG054397; T32AG055378-03 A1; K25AG071841; Medical Research Foundation Early Clinical Investigator Award.
Declaration of conflicting interests
The authors declared the following potential conflicts of interest with respect to the research, authorship, and/or publication of this article: OHSU and Z Beattie have a financial interest in Life Analytics, Inc., a company that may have a commercial interest in the results of this research and technology. This potential conflict of interest has been reviewed and managed by OHSU.
OHSU and J Kaye have a financial interest in Life Analytics, Inc., a company that may have a commercial interest in the results of this research and technology. This potential conflict of interest has been reviewed and managed by OHSU.
The remaining authors declared no potential conflicts of interest with respect to the research, authorship, and/or publication of this article.
Data availability statement
The data supporting the findings of this study are available on request from the corresponding author. The data are not publicly available due to privacy or ethical restrictions.
Supplemental material
Supplemental material for this article is available online.
References
Supplementary Material
Please find the following supplemental material available below.
For Open Access articles published under a Creative Commons License, all supplemental material carries the same license as the article it is associated with.
For non-Open Access articles published, all supplemental material carries a non-exclusive license, and permission requests for re-use of supplemental material or any part of supplemental material shall be sent directly to the copyright owner as specified in the copyright notice associated with the article.
