



Abstract
Background
Cognitive decline is a pressing global health issue in aging populations. The novel composite biomarker, C-reactive protein-triglyceride glucose index (CTI), may provide a superior tool for early risk stratification.
Objective
This study examined CTI's capacity to independently predict cognitive decline.
Methods
This retrospective cohort analysis utilized data from 5464 middle-aged and older adults without baseline cognitive impairment from the China Health and Retirement Longitudinal Study (CHARLS). The incidence of cognitive decline served as the primary outcome. CTI was calculated as: CTI = 0.412× Ln (CRP [mg/L]) + Ln (TG [mg/dl] ×FPG [mg/dl])/2. Cognitive performance was assessed in 2020 using the Chinese Mini-Mental State Examination (MMSE). Logistic regression and complementary approaches were used to analyze associations.
Results
Over the 9-year follow-up, a significant positive association between CTI and cognitive decline risk was observed. After multifactorial adjustment, individuals in the highest CTI quartile (Q4) demonstrated a 34% elevated risk relative to the lowest quartile (Q1) (HR = 1.34, 95%CI: 1.10–1.63; p = 0.004). A monotonic dose-response gradient was evident (p = 0.005), with restricted cubic splines confirming linearity (p = 0.025). Sensitivity analyses substantiated robustness.
Conclusions
Elevated CTI is independently associated with increased risk of cognitive decline, suggesting its potential as a dual-pathway biomarker for early screening.
Keywords
Introduction
Cognitive impairment represents an urgent global health challenge, profoundly compromising functional independence and well-being while driving escalating healthcare expenditures.1–3 Its prevalence rises disproportionately with population aging, particularly affecting middle-aged and older adults, with projections indicating sustained growth in future decades. The multifactorial etiology involves dynamic interactions,4–6 between genetic susceptibility, 7 environmental exposures, 8 and modifiable lifestyle components. 9 Targeted management of adjustable risk factors is therefore essential to mitigate progression trajectories and optimize quality of life in aging populations.
Insulin resistance (IR) constitutes a pathogenic cornerstone of type 2 diabetes and metabolic syndrome, with contemporary research elucidating intricate molecular pathways and emergent therapeutic targets.10–14 IR mechanistically underpins diverse pathophysiological manifestations, including mitochondrial bioenergetic failure, chronic low-grade inflammation, and gut microbiota dysbiosis.15–17 The triglyceride-glucose (TyG) index, 18 calculated from fasting triglycerides and glucose concentrations, provides a validated surrogate measure for IR. Accumulating evidence demonstrates TyG's superior predictive capacity over conventional markers for cardiovascular disease (CVD),19–22 type 2 diabetes mellitus (T2DM), and nonalcoholic fatty liver disease (NAFLD), 23 while its elevation independently forecasts chronic kidney disease (CKD) progression,24–26 supporting its utility as a pan-systemic metabolic risk indicator. Concurrently, C-reactive protein (CRP) serves as a cardinal systemic inflammation biomarker, implicated in atherosclerosis progression, diabetes pathogenesis, and autoimmune dysregulation. 27 Emerging data further link CRP to neuroinflammatory cascades and oncological outcomes.
The C-reactive protein-triglyceride-glucose index (CTI) represents an integrated biomarker synthesizing inflammatory (CRP) and metabolic dysregulation (TyG index) components. Contemporary evidence establishes CTI's superiority over conventional biomarkers in forecasting cardiovascular outcomes, especially within diabetic and obese subgroups. Significant correlations exist between CTI elevation and atherosclerosis severity, NAFLD progression, 28 and microvascular compromise development. This metric enables dual-pathway risk stratification through concurrent quantification of inflammatory and metabolic derangements. Notwithstanding CTI's validated cardiometabolic predictive capacity, its relationship with cognitive deterioration, particularly in Asian cohorts, remains uncharted territory. We thus hypothesize that CTI independently predicts cognitive decline by capturing convergent metabolic-inflammatory dysregulation.
To bridge this critical knowledge gap, we leveraged the nationally representative China Health and Retirement Longitudinal Study (CHARLS) cohort to elucidate the complex association between CTI and cognitive deterioration risk.
Methods
Study design
This investigation utilized data from the CHARLS—a prospective national cohort implementing multistage probability proportional-to-size sampling. This study is a retrospective cohort analysis utilizing existing waves of CHARLS data collected from 2011 to 2020. Although CHARLS was designed as a prospective cohort study, the present research employed a retrospective analytical approach, utilizing existing waves of data collected from 2011 to 2020. Wave 1 baseline assessment (2011) enrolled 17,705 participants aged ≥ 45 years across 450 villages within 150 county-level divisions spanning 28 Chinese provinces. Standardized questionnaires administered at enrollment captured core demographic and health parameters. Biennial to triennial follow-ups tracked health outcomes, with five completed survey waves (2011, 2013, 2015, 2018, 2020) comprising the analytical dataset. Longitudinal assessments were conducted at five time points, starting with a baseline in 2011, followed by four follow-up assessments. CTI was calculated using baseline (2011) biomarkers, and cognitive outcomes were evaluated during the 2020 follow-up (9 years later).
Study population
Five waves of data collection were conducted in 2011, 2013, 2015, 2018, and 2020, with the baseline assessments serving as the index time point. The 2020 wave provided the primary cognitive outcome. Figure 1 delineates participant selection. The baseline cohort comprised 17,705 Wave 1 participants. We applied sequential exclusions: 1) Participants with missing information on fasting blood glucose, CRP, or triglycerides (TG) at baseline (N = 8421); 2) 205 aged < 45 years; 3) 138 with baseline cognitive disorders; 4) 1436 lacking cognitive assessment data; 5) 886 missing CTI measurements; 6) 1155 with incomplete covariates. The final analytical cohort included 5464 eligible subjects. The age threshold of 45 years was selected in alignment with the original CHARLS sampling framework, which specifically targets middle-aged and older adults. This threshold corresponds to the typical onset age for investigating age-related cognitive decline in epidemiological studies. Baseline cognitive disorders were defined as: 1) Self-reported physician diagnosis of dementia or mild cognitive impairment (MCI); 2) Medical record verification where available. MCI was included.

Flow chart of the study population. CTI: C-reactive protein-triglyceride glucose index; FBG: fasting blood glucose; CRP: C-reactive protein; TG, triglycerides.
Calculation of CTI
The CTI index was obtained by using the following formula 29 : CTI = 0.412×Ln (CRP [mg/L])+Ln (TG [mg/dl]×FPG [mg/dl])/2.
The CTI values were categorized into quartiles (Q1-Q4) based on their distribution within the analytical sample. The quartile cut points were defined as follows: CTI Q1: [3.076, 4.305], CTI Q2: (4.305, 4.665], CTI Q3: (4.665, 5.076], and CTI Q4: (5.076, 7.529]. This stratification facilitated the examination of dose-response relationships while ensuring adequate statistical power within each group.
Assessment of cognitive decline
Cognitive function assessed in 2020 constituted the primary endpoint. Utilizing the validated Chinese Mini-Mental State Examination (MMSE), CHARLS quantified cognition through two domains: 1) Episodic memory: Participants recalled ten Chinese words immediately and after a 5-min delay, scoring one point per correct recall (maximum 20 = immediate + delayed scores). 2) Mental intactness: a) Test of Information and Cognitive Status (TICS) component: Temporal orientation (date/season/weekday) and serial-7 subtraction from 100 (5 trials); b) Visuospatial assessment: Figure replication task (1 point per accurate copy). Mental intactness scores (range 0–11) summed TICS and visuospatial performance. Global cognition (range 0–31) combined both domain scores, with higher values indicating superior function. Cognitive decline was defined as: a) Global score <11; b) Mental intactness score ≤ 2.75 (lowest quartile); c) Episodic memory score ≤5 (lowest quartile).
Assessments of covariates
Trained interviewers systematically captured baseline data through structured instruments, encompassing four domains: 1) Sociodemographic and behavioral characteristics: Sex, age, residential location, educational attainment, marital status, tobacco use, and alcohol consumption patterns. 2) Anthropometric parameters: Height, weight, body mass index (BMI), systolic/diastolic blood pressure (SBP/DBP). 3) Clinical history: Physician-diagnosed CVD, hypertension, diabetes mellitus, dyslipidemia, and corresponding pharmacotherapies. 4) Biochemical assays: Fasting plasma glucose (FPG), total cholesterol (TC), TG, high-/low-density lipoprotein cholesterol (HDL-C/LDL-C), serum creatinine, blood urea nitrogen, CRP, and glycated hemoglobin (HbA1c). All covariates listed above were assessed at baseline (2011) and were treated as time-invariant exposures in the statistical models. Although factors such as lifestyle behaviors are theoretically time-varying, the present analysis utilized their baseline measurements to reflect initial status and ensure consistency with the baseline assessment of the primary exposure (CTI).
Statistical analysis
Missing data were addressed using a complete case analysis approach. Participants with missing data on any variable required for the analysis (including exposure, outcome, or covariates) were excluded from the final analytical cohort, as detailed in Figure 1. This approach was selected over multiple imputation due to the extensive nature of the missing data and concerns that the data may not be missing at random, which could introduce bias if imputed. While multiple imputation was considered in initial analyses, the final models are based on complete cases to ensure transparency and avoid potentially unreliable imputations.
Baseline characteristics were summarized as mean ± standard deviation (SD) or median with interquartile range (IQR) for continuous measures, and frequency (percentage) for categorical measures. Group comparisons (cognitive decline versus normal cognition) employed Student's t-tests, Wilcoxon rank-sum tests, or χ² tests as appropriate. Primary analyses utilized Cox proportional hazards models to evaluate the associations between baseline CTI quartiles and the incidence of cognitive decline. The time-to-event was defined from the baseline measurement to the assessment conducted in 2020. Time-to-event analyses employed Cox proportional hazards models, with a follow-up duration extending from baseline in 2011 until the identification of cognitive decline in 2020. The model incorporated CTI quartiles as time-invariant exposures and adjusted for relevant covariates. Three progressively adjusted multivariate models examined the associations between CTI and cognitive decline: 1) Model 1: Unadjusted (CTI only); 2) Model 2: Model 1 + age and sex; 3) Model 3: Model 2 + HbA1c, creatinine, alcohol/tobacco use, residence, education, and marital status. We used a generalized linear model with binomial family and logit link to estimate the odds of outcome across CTI quartiles, testing for linear trend. All analyses used R 4.4.2. Two-tailed tests established statistical significance at p = 0.05. The key assumption of the Cox proportional hazards model, the proportionality of hazards, was tested for all variables using Schoenfeld residuals. The global test and tests for individual variables indicated no significant deviations from the proportionality assumption. No influential outliers were identified that substantially altered the model estimates.
Results
Population characteristics
The study comprised 5464 participants from the CHARLS cohort. The overall mean age was 57.06 ± 7.73 years, with 2452 (44.9%) being male. Participants were stratified into two groups: 4098 (75.0%) with normal cognition and 1375 (25.2%) with cognitive decline. Individuals with cognitive decline were more likely to be older, female, rural residents, less educated, and unmarried compared to those with normal cognition. Regarding cardiometabolic profiles, the cognitive decline group exhibited lower levels of CTI, creatinine, urea, and TG, but higher levels of HDL-C, LDL-C, and TC. Notably, systolic blood pressure was elevated in the cognitive decline group, while diastolic pressure showed no significant difference. Lifestyle factors revealed lower rates of current smoking and alcohol consumption in the cognitive decline group. Chronic conditions such as hypertension and diabetes did not differ significantly between groups, whereas dyslipidemia was less prevalent in the cognitive decline group. Body measurements indicated that the cognitive decline group had significantly lower height, weight, and BMI values. Table 1 presents the baseline characteristics of the total analytical cohort (N = 5464) from the 2011 wave, stratified by cognitive status in 2020. All variables were measured at study entry, except for the cognitive outcomes assessed in 2020. Comprehensive demographic and clinical profiles of the study cohort are summarized in Table 1.
Baseline (2011) Characteristics of study participants stratified by 2020 cognitive status.
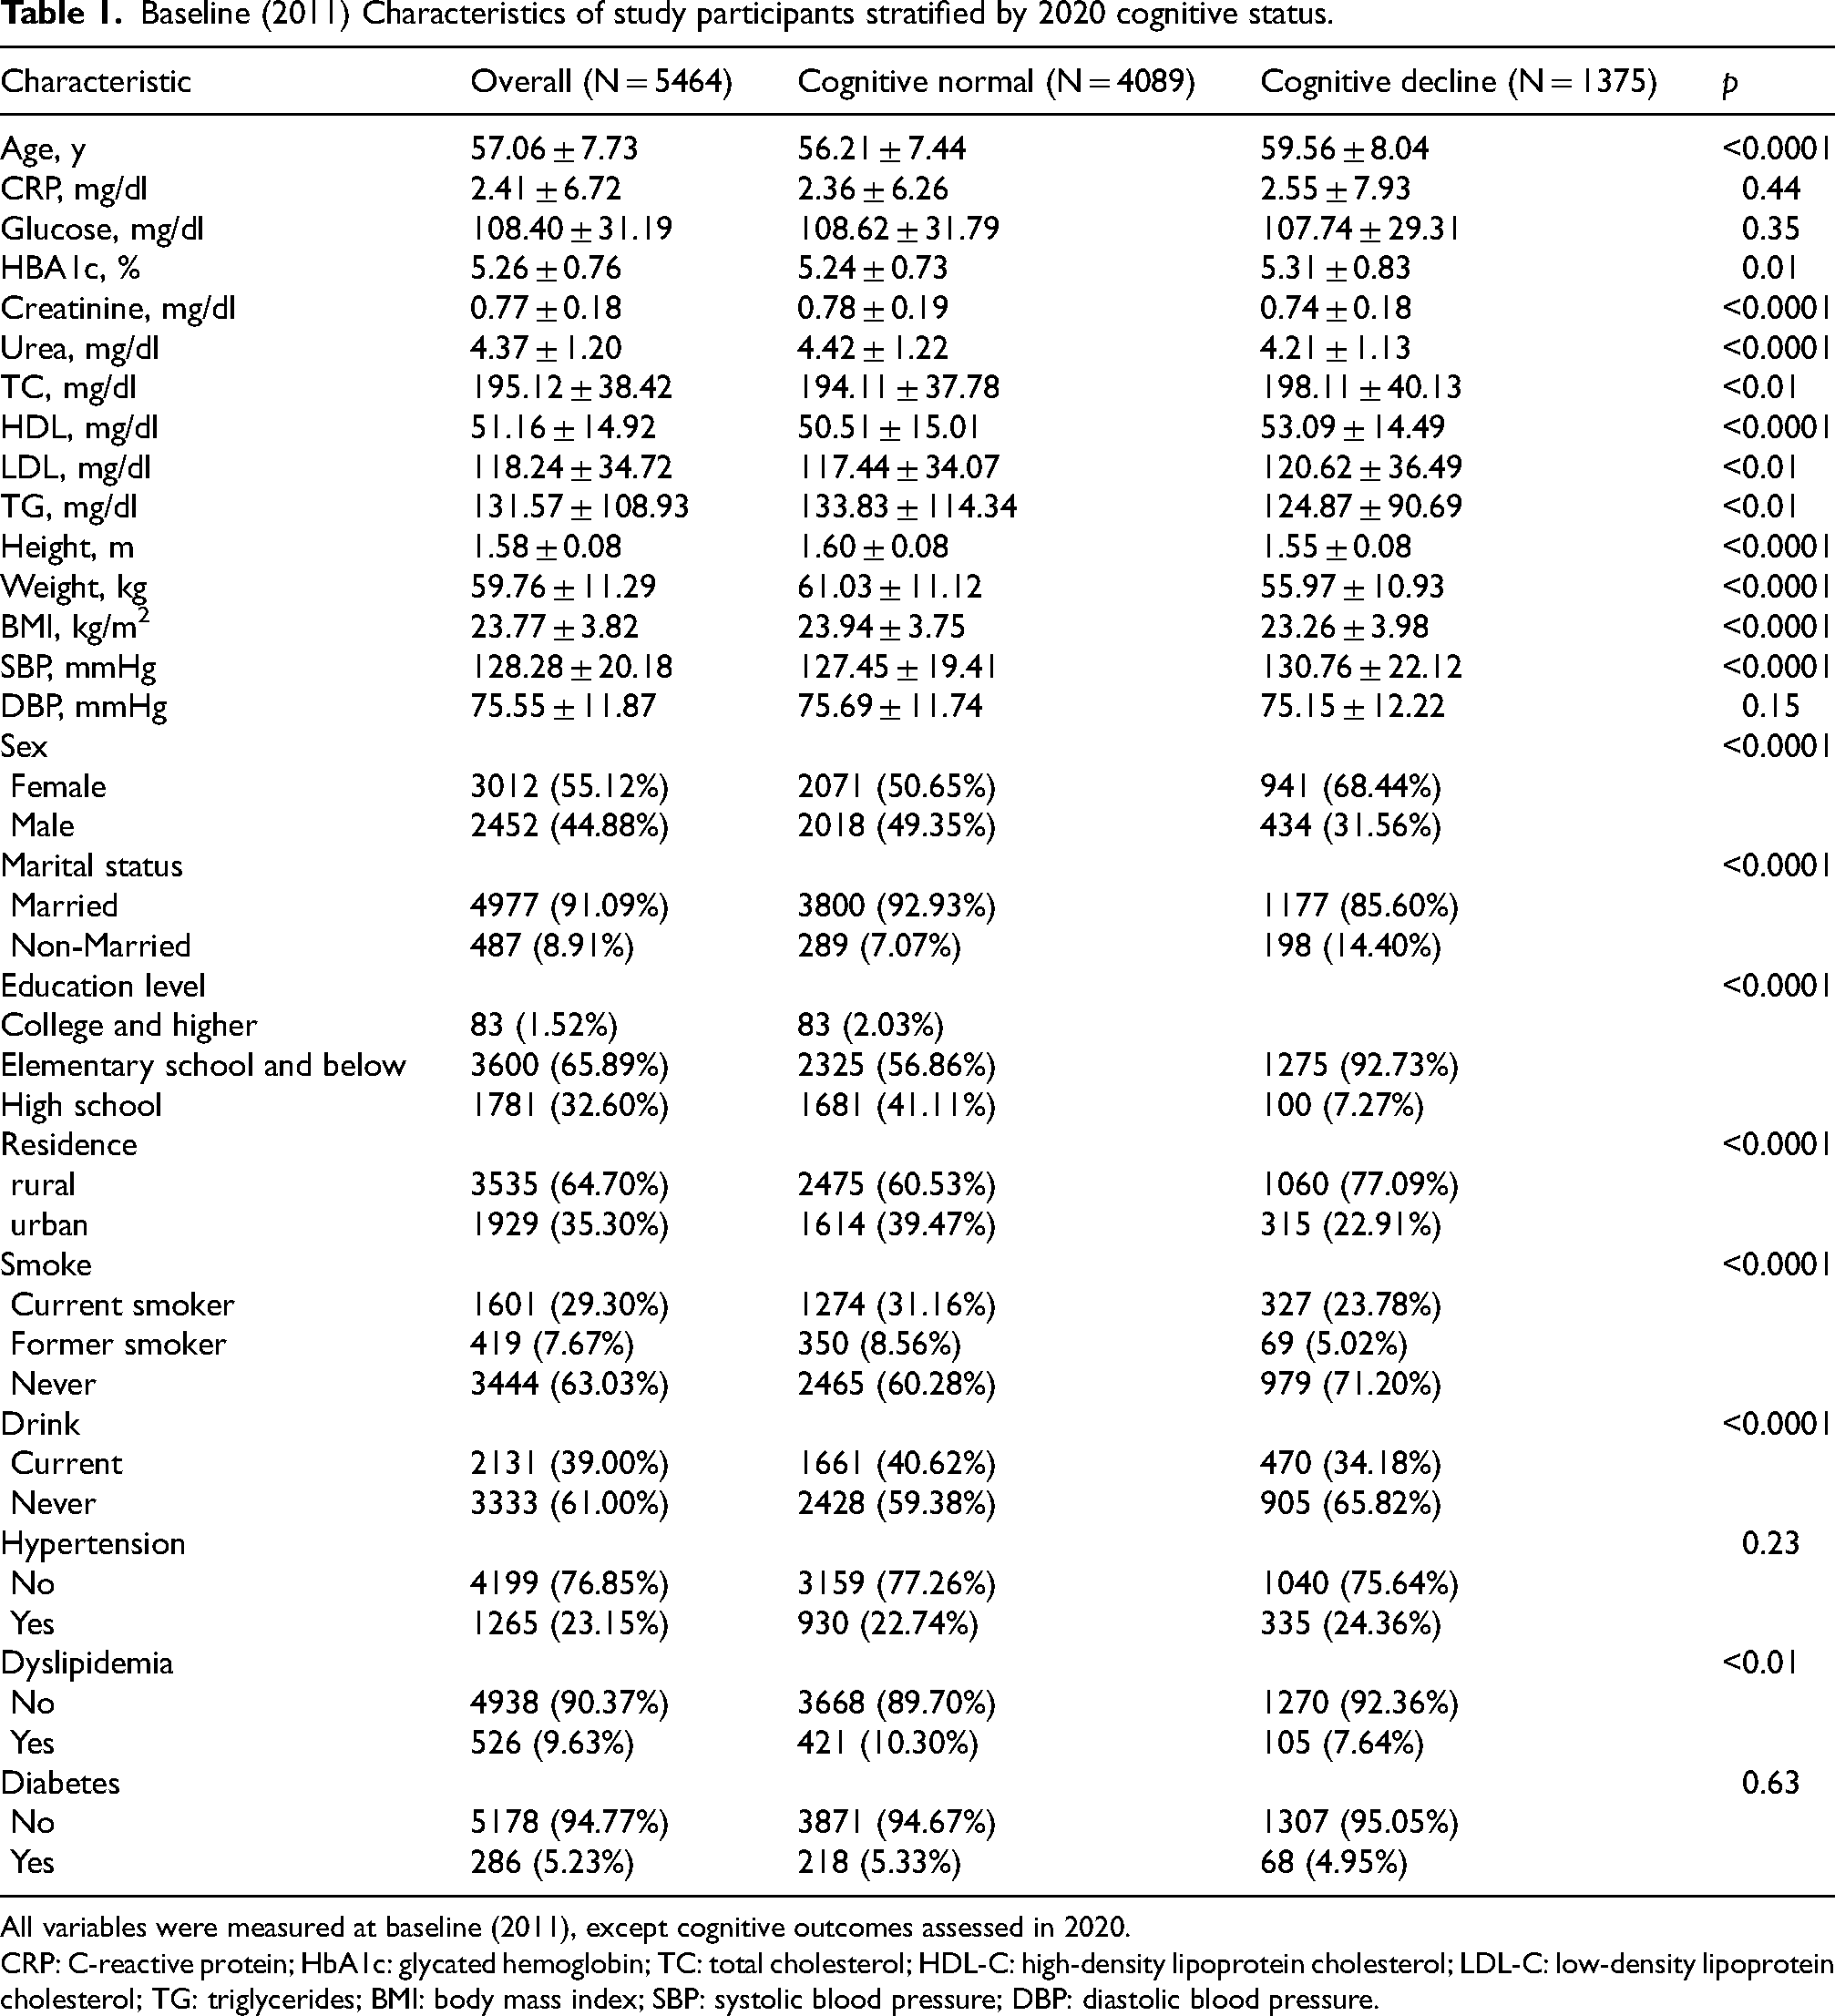
All variables were measured at baseline (2011), except cognitive outcomes assessed in 2020.
CRP: C-reactive protein; HbA1c: glycated hemoglobin; TC: total cholesterol; HDL-C: high-density lipoprotein cholesterol; LDL-C: low-density lipoprotein cholesterol; TG: triglycerides; BMI: body mass index; SBP: systolic blood pressure; DBP: diastolic blood pressure.
Associations between CTI and cognitive decline
Cox proportional hazards models with 9-year follow-up demonstrated: Table 2 delineates CTI quartile associations with cognitive decline risk. Progressively higher CTI quartiles conferred incrementally elevated risk. In the unadjusted model (Model 1), over a 9-year follow-up period, Q4 exhibited 21% greater risk versus Q1 (HR = 1.21, 95%CI 1.02–1.44, P = 0.03), demonstrating significant exposure-response gradation (p = 0.02). Age-sex adjustment (Model 2) amplified this association: Q4 risk increased to 43% (HR = 1.43, 95%CI 1.19–1.72, p < 0.001) with persistent trend significance (p = 0.02). Further adjustment for metabolic markers (HbA1c, creatinine), behavioral factors (tobacco/alcohol use), and sociodemographics (residence/education/marital status) in Model 3 attenuated effects modestly, yet Q4 maintained 34% excess risk (HR = 1.34, 95%CI 1.10–1.63, p = 0.004) with robust trend persistence (p = 0.005). Continuous CTI elevation per unit increment showed progressive risk escalation across quartiles (Figure 2). The 34% residual risk in fully adjusted models underscores CTI's independent prognostic value. Significant exposure-response gradients persisted throughout. These findings demonstrate a robust positive association between CTI elevation and cognitive deterioration risk that persisted despite comprehensive covariate adjustment.
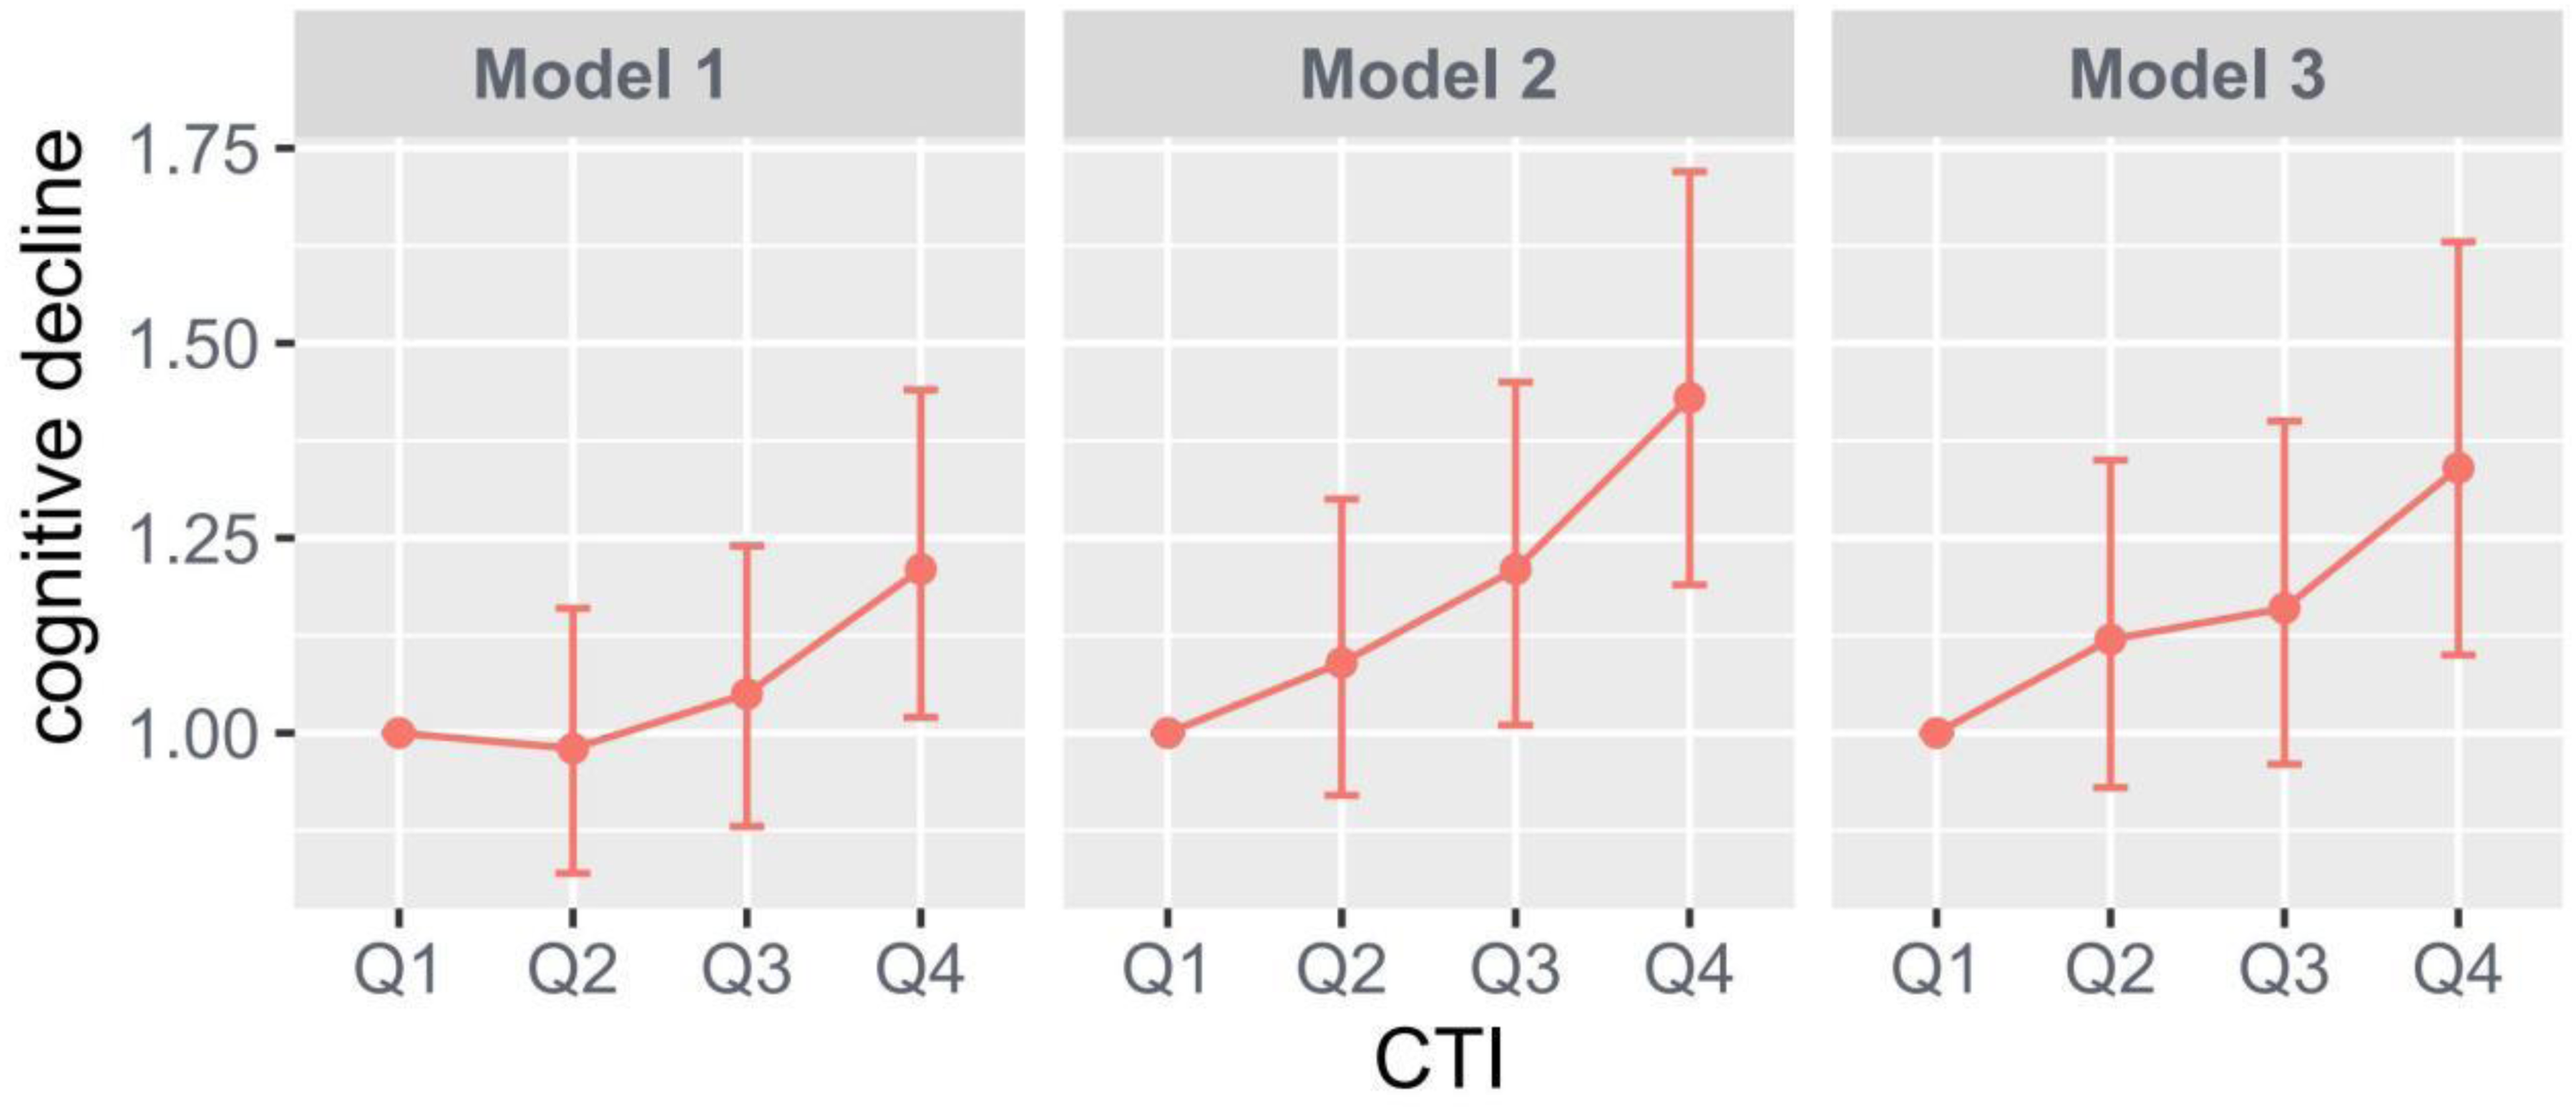
Multi-model analysis of cognitive decline and CTI quartiles. CTI: C-reactive protein-triglyceride glucose index.
Hazard ratios and 95% confidence intervals for cognitive decline risk across CTI quartiles.

Model 1: unadjusted for CTI.
Model 2: Model 1 + sex, age.
Model 3: Model 2 + HBA1c, Creatinine, drink, smoke, residence, education level, marital status.
CTI: C-reactive protein-triglyceride glucose index; HR: hazard ratio; CI: confidence interval; HbA1c: glycated hemoglobin.
We present the results of the restricted cubic spline analysis, which examines the linear association between the CTI and the risk of cognitive decline (Figure 3). The analysis includes three models with varying levels of adjustment. In the unadjusted model (Model 1), the overall association was statistically weak (p = 0.0622), and the non-linear association was also not significant (p = 0.7488), indicating a slight but non-significant increase in the risk of cognitive decline with increasing CTI. In the model adjusted for sex and age (Model 2), the overall association became statistically significant (p = 0.0004), while the non-linear association remained non-significant (p = 0.2813), suggesting a more pronounced linear increase in the risk of cognitive decline with higher CTI levels. In the fully adjusted model (Model 3), which included additional covariates such as HbA1c, creatinine, drinking, smoking, residence, education level, and marital status, the overall association remained statistically significant (p = 0.0246), but the non-linear association was still not significant (p = 0.3562), indicating a modest increase in the risk of cognitive decline with CTI. These findings suggest that there is a linear relationship between CTI and the risk of cognitive decline, with the association being most robust in the model adjusted for sex and age. Collectively, the RCS analysis did not detect a significant non-linear relationship, supporting the use of a linear model to describe the association between CTI and cognitive decline risk.

Restricted Cubic Spline Analysis of CTI's Dose-Response Relationship with Cognitive Decline Risk. CTI, C-reactive protein-triglyceride glucose index.
Sensitivity analysis
Sensitivity analyses consistently corroborated primary findings, affirming result robustness: In Model 1 (unadjusted), Q4 conferred 21% elevated cognitive decline risk versus Q1 (HR = 1.21, 95%CI 1.02–1.44, p = 0.03) with significant exposure-response gradient (p = 0.02); Model 2 (age-sex adjusted) showed Q4 risk escalation to 43% (HR = 1.43, 1.19–1.72, p < 0.001) while maintaining significant trend (p = 0.02); despite attenuation from metabolic (HbA1c, creatinine), behavioral (smoking, alcohol), and sociodemographic (residence/education/marital status) adjustments in Model 3 (fully adjusted), Q4 retained 34% excess risk (HR = 1.34, 1.10–1.63, p = 0.004) with persistent graded association (p = 0.005).
Discussion
Our findings should be interpreted within the methodological framework of this retrospective cohort analysis utilizing CHARLS data. Although the original CHARLS study was designed prospectively, the present investigation employed existing waves of data from 2011 to 2020 to examine associations between baseline CTI and incident cognitive decline.
This pioneering large-scale investigation establishes CTI as a quantifiable predictor of cognitive deterioration risk, revealing a robust monotonic dose-response relationship. Elevated CTI levels demonstrate significant associations with accelerated cognitive decline, supporting its utility as a promising novel biomarker. The clinical relevance of CTI for early risk stratification warrants substantive consideration.
CTI, developed by Ruan for cancer prognosis prediction, 17 integrates the CRP and triglyceride glucose index (TyG index) as biomarkers of inflammation and IR, respectively. Accumulating evidence supports its clinical utility across diverse pathologies. Significant stroke risk associations are established in normoglycemic/prediabetic individuals and hypertensive populations,29,30 alongside enhanced coronary heart disease detection. 31 CTI demonstrates linear diabetes risk prediction with gender-specific manifestations: male testosterone decline/erectile dysfunction and female endometriosis risk.32–35 Positive correlations with depressive symptom severity further confirm neuropsychiatric applications. 36 This expanding evidence base underscores CTI's versatility as a multi-system biomarker.
The CTI confers distinct advantages over isolated TyG index or CRP measurements by enabling integrated metabolic-inflammatory profiling. Unlike TyG's exclusive focus on IR risk or CRP's singular reflection of inflammation, CTI captures synergistic pathophysiological processes. Sole reliance on individual biomarkers provides unidimensional risk assessment, whereas CTI's dual-pathway integration yields multidimensional risk stratification. Crucially, CTI accounts for inter-individual biomarker variance by concurrently evaluating metabolic (TyG) and inflammatory (CRP) axes from complementary biological perspectives. This synthesis enhances predictive utility for high-risk subpopulation identification.
Analysis of 5464 CHARLS participants revealed a robust independent association between elevated CTI levels and cognitive deterioration risk, with restricted cubic spline (RCS) analysis confirming a significant positive linear exposure-response relationship. These findings position CTI reduction as a viable preventive strategy for cognitive preservation in aging populations. Notably, the lower smoking/alcohol consumption rates observed in the cognitive decline group suggest lifestyle modifications (particularly smoking cessation and moderated alcohol intake) may mediate neuroprotection. Furthermore, the higher cognitive decline prevalence among rural residents likely reflects tripartite disadvantages in healthcare accessibility, health education, and lifestyle patterns, collectively delineating actionable targets for public health interventions.
Systolic hypertension management emerges as a critical intervention focus, given significantly elevated SBP in cognitive decline groups versus cognitively normal counterparts (p < 0.001), contrasting with non-significant diastolic pressure differences. This implicates SBP as a pivotal modifiable risk factor, necessitating stringent systolic control in hypertensive populations for cognitive preservation. Paradoxically, the cognitive decline cohort exhibited elevated high-/low-density lipoprotein (HDL-C/LDL-C) and TC alongside reduced TG, revealing complex lipid-cognition interactions warranting mechanistic investigation. Anthropometrically, significantly lower height, weight, and BMI in cognitive decline groups suggest malnutrition may accelerate cognitive deterioration, positioning nutritional optimization as a potential prevention strategy.
The strong correlation between elevated CTI indices and cognitive decline may stem from the synergistic effects of chronic low-grade inflammation and metabolic dysregulation, which are hallmarks of the two major neurodegenerative pathologies. The following hypothesis elucidates this correlation more effectively: 1) Inflammatory pathways6,27: As an acute-phase reactive protein, systemic inflammation reflected by CRP may act through the following pathways: a) Disrupting the integrity of the blood-brain barrier through the activation of matrix metalloproteinases. b) Promoting microglial activation and amyloid-β deposition. 2) Metabolic dysregulation11,28: The TyG component of CTI captures IR, the effects of which include reduced cerebral glucose uptake, leading to insufficient neuronal energy supply, exacerbated tau protein hyperphosphorylation, and the development of Alzheimer-like pathological changes. Notably, we found that SBP was significantly elevated in the cognitive decline group, suggesting a possible vascular mechanism. Hypertension may amplify the effects of CTI by promoting cerebral small vessel disease, 1 a known causative agent of vascular cognitive decline.
While the TyG index and CRP alone predict cognitive risk, the strength of the CTI lies in its bi-directional capture of metabolic-inflammatory interactions. This includes direct metabolic parameters such as FPG and TG, which are critical for diabetes-related dementia subtypes. 10 This dual assessment makes the CTI particularly suitable for primary care scenarios. A single CTI calculation, which requires only routine testing, can effectively identify high-risk patients in need of neuropsychological evaluation.
The negative association of TG with cognitive decline may appear paradoxical; however, it aligns with recent studies indicating that low TG levels in cognitively impaired individuals may reflect malnutrition, a known characteristic of advanced dementia. 9 This indicates that the predictive utility of CTI may vary depending on the stage of the disease. Malnutrition may alter the pattern of dyslipidemia in the later stages of the disease. For instance, reduced dietary fat intake may lead to a decline in TG in patients with advanced cognitive impairment. This suggests that CTI may have greater predictive value in the pre-malnutritional stage. Elevated HDL-C may represent a compensatory anti-inflammatory response, 23 as HDL particles transport CRP-scavenging proteins. Notably, the NHANES cohort observed a similar lipid pattern when examining the association between CTI and depression, suggesting the presence of systemic metabolic-inflammatory dysregulation. 36
This study establishes CTI as a validated metric for predicting cognitive deterioration in community-dwelling populations, offering a clinically actionable tool for early risk stratification. Against the backdrop of escalating global cognitive decline burden, timely identification of high-risk individuals becomes imperative. Our findings advocate integrating CTI monitoring into routine practice, maintaining levels within optimal thresholds to mitigate cognitive impairment progression in a cost-effective preventive approach for aging societies.
This investigation offers three key methodological strengths: (1) Novelty as the first large-scale evidence establishing CTI-cognitive decline associations, yielding novel mechanistic and clinical implications; (2) Robust design via a prospective nationwide cohort with representative sampling (n = 5464), ensuring high validity; and (3) Clinical translatability wherein CTI's operational simplicity facilitates seamless integration into routine practice. Collectively, these advantages position CTI as a scalable biomarker for population-level cognitive risk stratification.
This study presents several limitations. First, while the MMSE is widely utilized in epidemiological research, its exclusive application without additional cognitive assessments may have constrained our capacity to identify specific domain impairments. Second, the potential for unmeasured confounding factors, such as APOE ε4 status and dietary patterns. Third, the observational design of the study limits the ability to draw causal inferences, as the observed associations may be influenced by residual confounding. Fourth, since the CHARLS participants were exclusively Chinese adults, the generalizability of the findings to other ethnic groups necessitates further investigation. Fifth, our use of a complete case analysis to handle missing data may have introduced selection bias and potentially limited the generalizability of our findings, if the excluded participants systematically differed from those included. Although multiple imputation was initially considered, the pattern and extent of missingness led us to favor a more conservative complete case approach. Nevertheless, these constraints do not compromise the core findings regarding CTI's prognostic utility for cognitive deterioration.
Conclusion
In summary, this study confirms a significant monotonic dose-response relationship between elevated CTI levels and cognitive deterioration risk. This association persisted after comprehensive adjustment for key confounders including demographic characteristics, lifestyle factors, and metabolic markers, solidifying CTI's robustness as an innovative composite biomarker. Our findings support CTI's clinical implementation for early detection of high-risk individuals, enabling targeted preventive strategies. Future research should validate these associations across multi-ethnic cohorts and develop public health interventions focused on CTI modulation.
Footnotes
Acknowledgements
This investigation leveraged data from the China Health and Retirement Longitudinal Study (CHARLS). The authors gratefully acknowledge the CHARLS research team and all study participants for their invaluable contributions.

Ethical considerations
The CHARLS study protocol received ethical clearance from Peking University's Institutional Review Board under approval codes IRB00001052-11015 (household survey) and IRB00001052-11014 (biological specimens).
Consent to participate
Written informed consent was obtained from all participants prior to study enrollment.
Consent for publication
Informed consent for publication was obtained from all participants during the original CHARLS data collection process.
Author contribution(s)
Funding
The authors received no financial support for the research, authorship, and/or publication of this article.
Declaration of conflicting interests
The authors declared no potential conflicts of interest with respect to the research, authorship, and/or publication of this article.