



Abstract
Background
Recent evidence suggests that prerequisites for Alzheimer's disease (AD) can form during prenatal and early postnatal development. These prerequisites have been identified to some extent in OXYS rats: a model of the sporadic form of AD.
Objective
Here, we continue to study the role of delayed brain maturation in the development of the AD-like pathology much later in OXYS rats.
Methods
We assess synaptic-density changes and gene expression profiles in the prefrontal cortex (PFC) and hippocampus of OXYS and Wistar rats (parental strain; control) between ages “postnatal day 0” (P0) and P20.
Results
We found that at birth, the synaptic population in the PFC of OXYS rats is half of that in Wistar rats. The proportion of both symmetric (inhibitory) contacts and asymmetric (excitatory) contacts in the hippocampus of OXYS rats at P14 and P20 matched these parameters in Wistar rats at P7 and P14, respectively. The transcriptome analysis of the PFC and hippocampus showed that gene expression profiles related to synapses are different between Wistar and OXYS rats. Next, we identified “age-specific” genes and “brain region-specific” genes whose changes in the expression can obviously contribute to the specific features of synapse formation in OXYS rats. Finally, analyses of cell-specific (neurons, astrocytes, microglia, oligodendrocytes, and endothelial cells) gene expression suggested that at P3–P20 in the PFC and hippocampus, more than 50% of downregulated genes are associated with glia: key regulators of neural-network functioning.
Conclusions
Collectively, these data indicate a delay in the formation of interneuronal connections and in their efficiency in the OXYS strain.
Introduction
The cognitive deficits in Alzheimer's disease (AD) are strongly associated with synaptic dysfunction and loss of synapses.1,2 Evidence suggests that the preclinical period of AD can last for decades, and impairment of synapse functions occurs early, before clinical manifestation of disease. 3 Nonetheless, the question of what happens to synapses before the development of cognitive deficits remains largely unanswered. This is due, among other things, to the fact that synapses contain thousands of proteins that are distributed differently among synapses, thus creating a huge variety of synapse types determined by their molecular composition, protein half-life, and subsynaptic architecture along with complex biological and signaling properties of cells. 2
In humans, most synapses assemble during prenatal development and first 2 years of life. 4 This is a critical period for the developing brain because at this time, when synaptogenesis is most active and its effectiveness is influenced both by other major maturational changes and by life experience, including learning and maternal care. Approximately half of all synapses are “pruned” during childhood and adolescence. 5 Most synapses surviving adolescent pruning are stably maintained in adulthood; therefore, the activity of neural networks in the future depends on how effectively synaptic contacts are formed by this time point (i.e., adolescent pruning). Although a subset of synapses continues to be eliminated and formed throughout the lifespan, their functional activities are altered according to life experience too. 4 Thus, neuronal plasticity of the developing brain, on the one hand, depends on plasticity/learning, and on the other hand, is influenced by external factors, disorders, and diseases. 4
Only recently have the results of studies begun to appear in this field and indicate that the prerequisites for AD can form during embryonic development and at the completion of brain development in the early postnatal period. These prerequisites can be caused by various factors, including a reduction (even a slight one) in the duration of gestation, low birth weight due to trophic insufficiency, the formation of aberrant neural networks,6–11 and early life experience.12–15 All these prerequisites have been identified to some extent in OXYS rats: a model of the sporadic form of AD. OXYS rats show decreased duration of gestation, lower birth weight, delayed physical development, and delayed formation of reflexes during the completion of brain formation. 16 We have found that in OXYS rats, the sequence of development of key signs of the AD-like pathology (amyloid-β deposits and hyperphosphorylated tau) indicates that the amyloid pathology (from 7 months of age) is preceded by an increase in the level of tau protein and its phosphorylated forms (from 3 months of age), neurodegenerative and synaptic processes (from 3 months of age), and mitochondrial dysfunction (from 20 days of age).17–21 It is still generally accepted that tau protein hyperphosphorylation in the pathogenesis of AD is caused by toxic forms of amyloid. Based on our results, we propose that multiple age-related degenerative processes precede the toxic accumulation of amyloid-β, which in turn triggers the final stage of sporadic AD and becomes the fatal hallmark of the disease. In addition, even earlier—in OXYS rats at ages “postnatal day 0” [P0] to P20—we have identified the features of brain maturation that can act as prerequisites for the development of initial neurodegenerative changes at a later age.22–25 Here, we continue to study the role of delayed brain maturation in the development of the AD-like pathology much later, and we assess synaptic-density changes and gene expression profiles related to synapses in the hippocampus and prefrontal cortex (PFC) of Wistar (parental strain) and OXYS rats between ages P0 and P20.
Methods
Animals
OXYS and Wistar rats were obtained from the Breeding Experimental Animal Laboratory of the ICG SB RAS (Novosibirsk, Russia). The OXYS rat strain (Institute of Cytology and Genetics, Siberian Branch of the Russian Academy of Sciences) was developed as previously described. 18 In OXYS rats in addition to development of the phenotype similar to human geriatric disease at early age, accelerated brain aging with symptoms similar to those seen in sporadic AD develops. 17 OXYS rats brains are characterized by neurodegenerative changes, synapse loss, mitochondrial dysfunction, hyperphosphorylated tau, and amyloid-β deposits without nonsynonymous AD mutations in the genes App, Psen1, and Psen2, which are identified in autosomal dominant early-onset AD. Rats were kept at 22 +/– 0.2°C on a 12–12 h day-night cycle and provided with food and water ad libitum. Standard rat feed was obtained from Laboratorsnab, Ltd, Moscow, Russia.
Electron microscopy examination
For this purpose, small samples (2 × 2 × 2 mm) from the PFC and hippocampus were excised from male rat brains (ages P0–P20, n = 4 per group) and fixed with a buffer (2.5% of glutaraldehyde, 1.5% of paraformaldehyde, 0.1 M cacodylate buffer) for 1 h at room temperature (RT), washed twice in the buffer, then post-fixed with a 1% aqueous solution of osmium tetroxide containing a few crystals of potassium ferricyanide (K3[Fe(CN)6]) for 1 h at RT, and finally incubated in a 1% aqueous solution of uranyl acetate overnight. Next day, the samples were dehydrated in a grade series of ethanol and in acetone and embedded in Epon 812 Resin (Electron Microscopy Sciences, USA). Complete polymerization of samples was implemented by keeping them in a 60°C oven for 3 days. Ultrathin (65 nm) sections were obtained by means of a Leica Ultracut EM UC6 (Leica Microsystems GmbH, Germany) ultra-microtome (Leica Microsystems GmbH, Germany). The sections were examined under a JEOL JEM 1400 transmission electron microscope (JEOL Ltd, Japan) at 60 kV at the Multi-Access Center for Microscopic Analysis of Biological Objects (ICG SB RAS, Novosibirsk, Russia) at 12,000 × magnification. Identification of brain structures (layer IV of the PFC [Bregma 4.68 to Bregma 3.72 mm] and CA1 region of the hippocampus [Bregma −2.28 to Bregma −3.60 mm]) was performed according to Paxinos and Watson. 26
We determined the numbers of axons, dendrites, and synaptic contacts (per visual field of 50 µm2) and calculated the number of axonal and dendritic processes, and synapses per of 100 µm2. In the neuropil, the intertwined neuronal (axonal and dendritic processes, synapses) and glial profiles were identified according to criteria well defined previously.27,28 Individual synaptic contacts were identified based on the presence of pre- and postsynaptic terminals containing synaptic vesicles or a clear postsynaptic density, respectively. Asymmetrical and symmetrical synapses were also counted. Asymmetrical synapses are characterized by a postsynaptic density; in contrast, symmetric synapses do not contain an obvious postsynaptic density. The synapses were classified (by the length of the active contact zone) into small (<300 nm), medium (300–500 nm), large (500–700 nm), and very large (>700 nm). The photos were processed in Adobe Photoshop. The sample size (n) for quantitative ultrastructural analyses of axonal and dendritic processes, synapses was used as previously performed.29,30 From each animal, 3–4 sections were acquired, and each section contained 15 photos, for a total of 45–60 photos per rat. Statistical analysis was performed on averaged data for each section from each animal (n = 12–15 per group).
Western blotting
All male rats were euthanized by CO2 asphyxiation and decapitation. The PFC and hippocampus (ages P0–P20, n = 4 to 6 per group) were carefully removed, transferred into a microfuge tube, flash-frozen in liquid nitrogen, and stored at −70°C.
The frozen brain tissue samples were homogenized in RIPA buffer (150 mM NaCl, 50 mM Tris-HCl pH 7.4, 1% of sodium deoxycholate, 1% of Triton X-100, 0.1% of sodium dodecyl sulfate, and 1 mM EDTA) supplemented with phosphatase and protease inhibitor cocktails (cat. ## P8340, P5726-5ML, and P0044-5ML; Sigma-Aldrich, St Louis, MO, USA). After 20 min of incubation on ice, the samples were centrifuged for 30 min at 12,000 × g and 4°C, and the supernatants were collected. Total protein was quantified using the BCA Pierce Protein Assay Kit (cat. # 23225; Thermo Fisher Scientific, Waltham, MA, USA). Protein fractions were electrotransferred onto nitrocellulose membranes. After blocking with 5% bovine serum albumin (BSA; cat. # SLBJ8588 V; Sigma-Aldrich) in phosphate-buffered saline (PBS) containing 0.1% of Tween 20 for 1 h, the membranes were probed overnight at 4°C with one of the following primary antibodies: anti-PSD95 and anti-synaptophysin (cat. # PA5-104637 and MA5-14532, ThermoFisher, Waltham, MA, USA). The membranes were then incubated with a secondary antibody (cat. # ab150115 or ab96886; Abcam; 1:5000) for 1 h. For normalization of the western-blot data, we used staining with an anti–β-actin antibody (dilution 1:5000 in 5% BSA; cat. # ab1801, Abcam, Cambridge, UK) for 1 h at RT. Protein bands were detected using a ChemiDoc MP Imaging System (Bio-Rad, Hercules, CA, USA). Quantification of the protein bands was performed by volumetric densitometry in the ImageJ software (NIH, Bethesda, MD, USA).
Immunohistochemistry and confocal microscopy
Brain sections of all male rats (ages P7–P20, n = 4 to 6 per strain and age) were prepared as previously described. 23 For the GFAP and PSD95 staining the brain slices were probed according to. 23 The primary antibodies used were GFAP and PSD95 (cat. # ab7260, Abcam, Cambridge, MA, USA, and cat. # PA5-104637, ThermoFisher, Waltham, MA, USA, respectively). The secondary antibodies were Alexa Fluor 488 or 568 (cat. # ab150073 and ab175472, respectively, Abcam). The GFAP and PSD95 signals were detected using an LSM 780 NLO confocal laser scanning microscope (Zeiss, Oberkochen, Germany) with a 63× objective lens. The microscopy was conducted at the Multi-Access Center for Microscopy of Biological Objects (ICG SB RAS, Novosibirsk, Russia). The number of images in the z-stack was 10, and all calculations were carried out in ZEN and ImageJ software. Identification of brain structures (CA1, CA3, and dentate gyrus [DG] regions of the hippocampus) was performed according to Paxinos and Watson (Lateral 0.40 to Lateral 0.90 mm). 26
RNA-Seq analysis
PFC and HIP tissue from all male rats (ages P3 and P10, n = 3, for each time point) for high-throughput RNA sequencing (RNA-Seq) was prepared as previously described. 25 The RNA-Seq data were obtained as described earlier. 19 Briefly, the sequencing data were preprocessed using the Cutadapt tool. The resulting reads were mapped onto the Rnor_5.0 reference genome assembly in the TopHat2 software. The data were then converted into gene count tables using ENSEMBL and RefSeq gene annotation data. Differential gene expression was derived from these tables using DESeq2. Genes with padj < 0.05 were designated as differentially expressed.
Analysis of expression of genes related to synaptic function
The list of genes related to synaptic function was obtained in the Rat Genome Data-base (RGD; 2095 rat genes) by searching for the term “synapse”. To identify the Gene Ontology (GO) terms over-represented in a differentially expressed gene (DEG) list, the detected DEGs were subjected to functional enrichment analyses by means of the DAVID tool. Gene interaction networks were identified with the help of STRING. The visualization of the expression of genes was performed by means of the pheatmap R package; prcomp was employed for principal component analysis (PCA) calculations, whereas the FactoMineR R package for plotting a center and scale by default; the GOplot R package in SRplot was used for to show the relationship between GO term and genes. 31 Lists of genes that are selectively expressed in neurons, astrocytes, oligodendrocytes, microglia, and endothelial cells were generated on the basis of data from single-cell RNA-seq. 32
Statistics
The data were processed by analysis of variance (ANOVA; STATISTICA 10.0, Statsoft, Tulsa, OK, USA). Two-way ANOVA was conducted to evaluate age-dependent effects (age × genotype [strain]). The Newman–Keuls test was applied to significant main effects and interactions to assess the differences between some sets of means. The data are presented as mean ± SEM. The differences were considered statistically significant at p < 0.05.
Results
Postnatal features of formation of axons and dendrites
During development, neurons are generated, migrate, and grow short- and long-range axons and extensive dendritic trees that constitute the structural basis of synaptic plasticity.5,33 We first tried to determine whether there were any specific features of altered formation of axons and dendrites in OXYS rats in the early postnatal period. The density of axonal and dendritic processes in layer IV of the PFC and in the CA1 region of the hippocampus (Figures 1(a)–(c)) naturally increased from P0 to P20 in Wistar and OXYS rats (F3,91 = 280.5, p < 0.0001, and F3,91 = 259.6, p < 0.0001, respectively, for the PFC; F2,66 = 28.9, p < 0.0001, and F2,66 = 16.8, p < 0.0001, respectively, for the hippocampus).
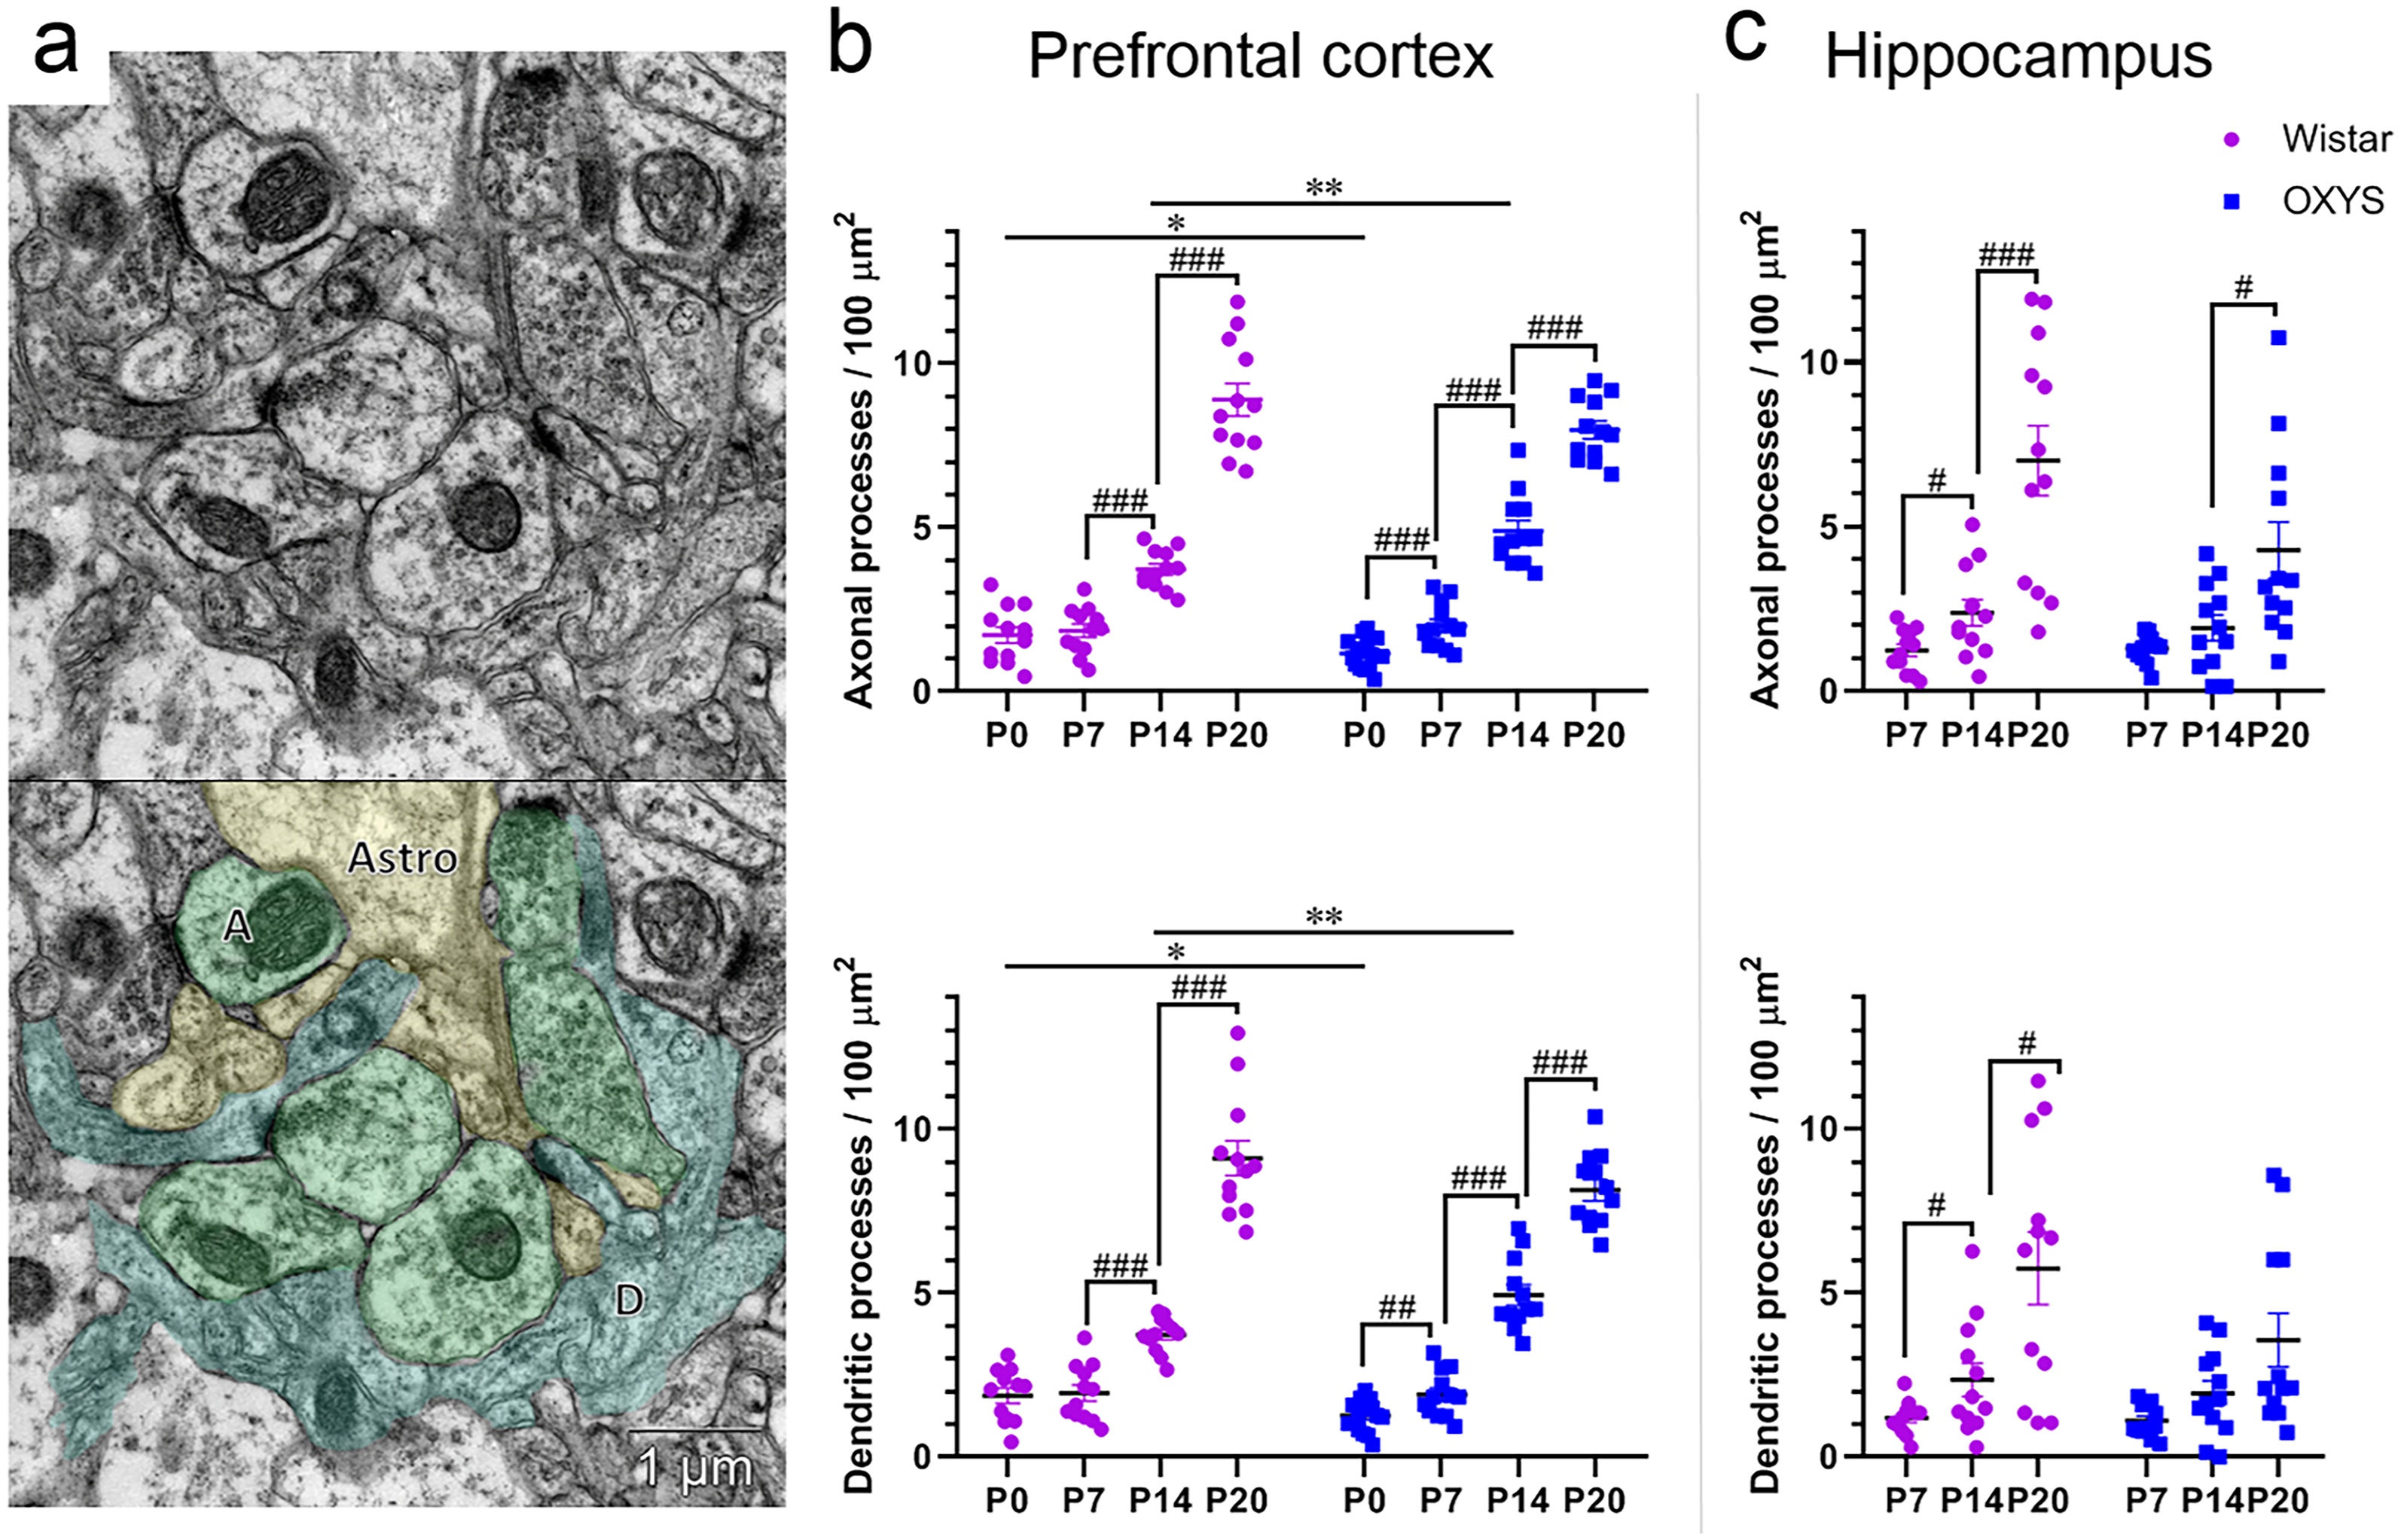
Features of formation of axons and dendrites. The electron micrograph (upper panel) illustrates a typical neuropil of layer IV of the rat PFC at P14 (a). The electron micrograph (lower panel) is colored according to the object type: A: axons (green); D: dendrites (blue); Astro: astrocytes (yellow). Age-dependent alterations in axonal and dendritic processes (n = 12 image sections [4 animals and 3 sections/animal] per group) in the PFC (b) and hippocampus (c). The data are presented as mean ± SEM. Significant differences: *p < 0.05 or **p < 0.01 for a comparison between the strains at the same age; #p < 0.05, ##p < 0.01, or ###p < 0.001 as compared to a previous age.
At birth (at age P0), the number of axonal and dendritic processes in the PFC of both rat strains was minimal, and these parameters were lower in OXYS rats than in Wistar rats (p < 0.05, for both; Figure 1(b)). By age P7, the density of axonal and dendritic processes in the PFC significantly increased only in OXYS rats (p < 0.001). By age P14, these parameters increased in both rat strains (p < 0.001), but the formation of axons and dendrites was greater in OXYS rats, and the number of neuronal processes went up as compared to Wistar rats (p < 0.01, for both). By age P20, these parameters rose in both rat strains (p < 0.001, for both).
In the hippocampus (Figure 1(c)), we found that the density of axonal and dendritic processes was lower in OXYS rats (F1,66 = 4.4, p < 0.05, and a marginal difference, F1,66 = 3.1, p = 0.08, respectively). An age-dependent significant increase in these parameters was noted only in Wistar rats (p < 0.05, for both). In OXYS rats, a significant increase in the density of processes was observed only for axons by age P20 (p < 0.05).
Postnatal features of synapse formation
Synapse formation represents a multicomponent process whereby an initial synaptic contact nucleates organization of pre- and postsynaptic specializations that are subsequently specified. 5 Synapse heterogeneity is organized in accordance with five modules of the synaptic contact: a vesicle cluster, active zone, synaptic cleft, postsynaptic density, and associated glial compartments. 34 In the PFC and hippocampus of both rat strains in the early postnatal period, simple imperforated axospinous and axodendritic synapses predominated in the synaptic population (Figure 2(a)). ANOVA showed that synapse density in layer IV of the PFC (Figure 2(b)) and in the hippocampal CA1 region (Figure 2(c)) naturally increased with age in Wistar and OXYS rats (F3,132 = 163.7, p < 0.0001, and F2,84 = 11.4, p < 0.0001, respectively) and was lower in OXYS rats (F1,132 = 24.5, p < 0.0001, and F1,84 = 4.1, p < 0.05, respectively).
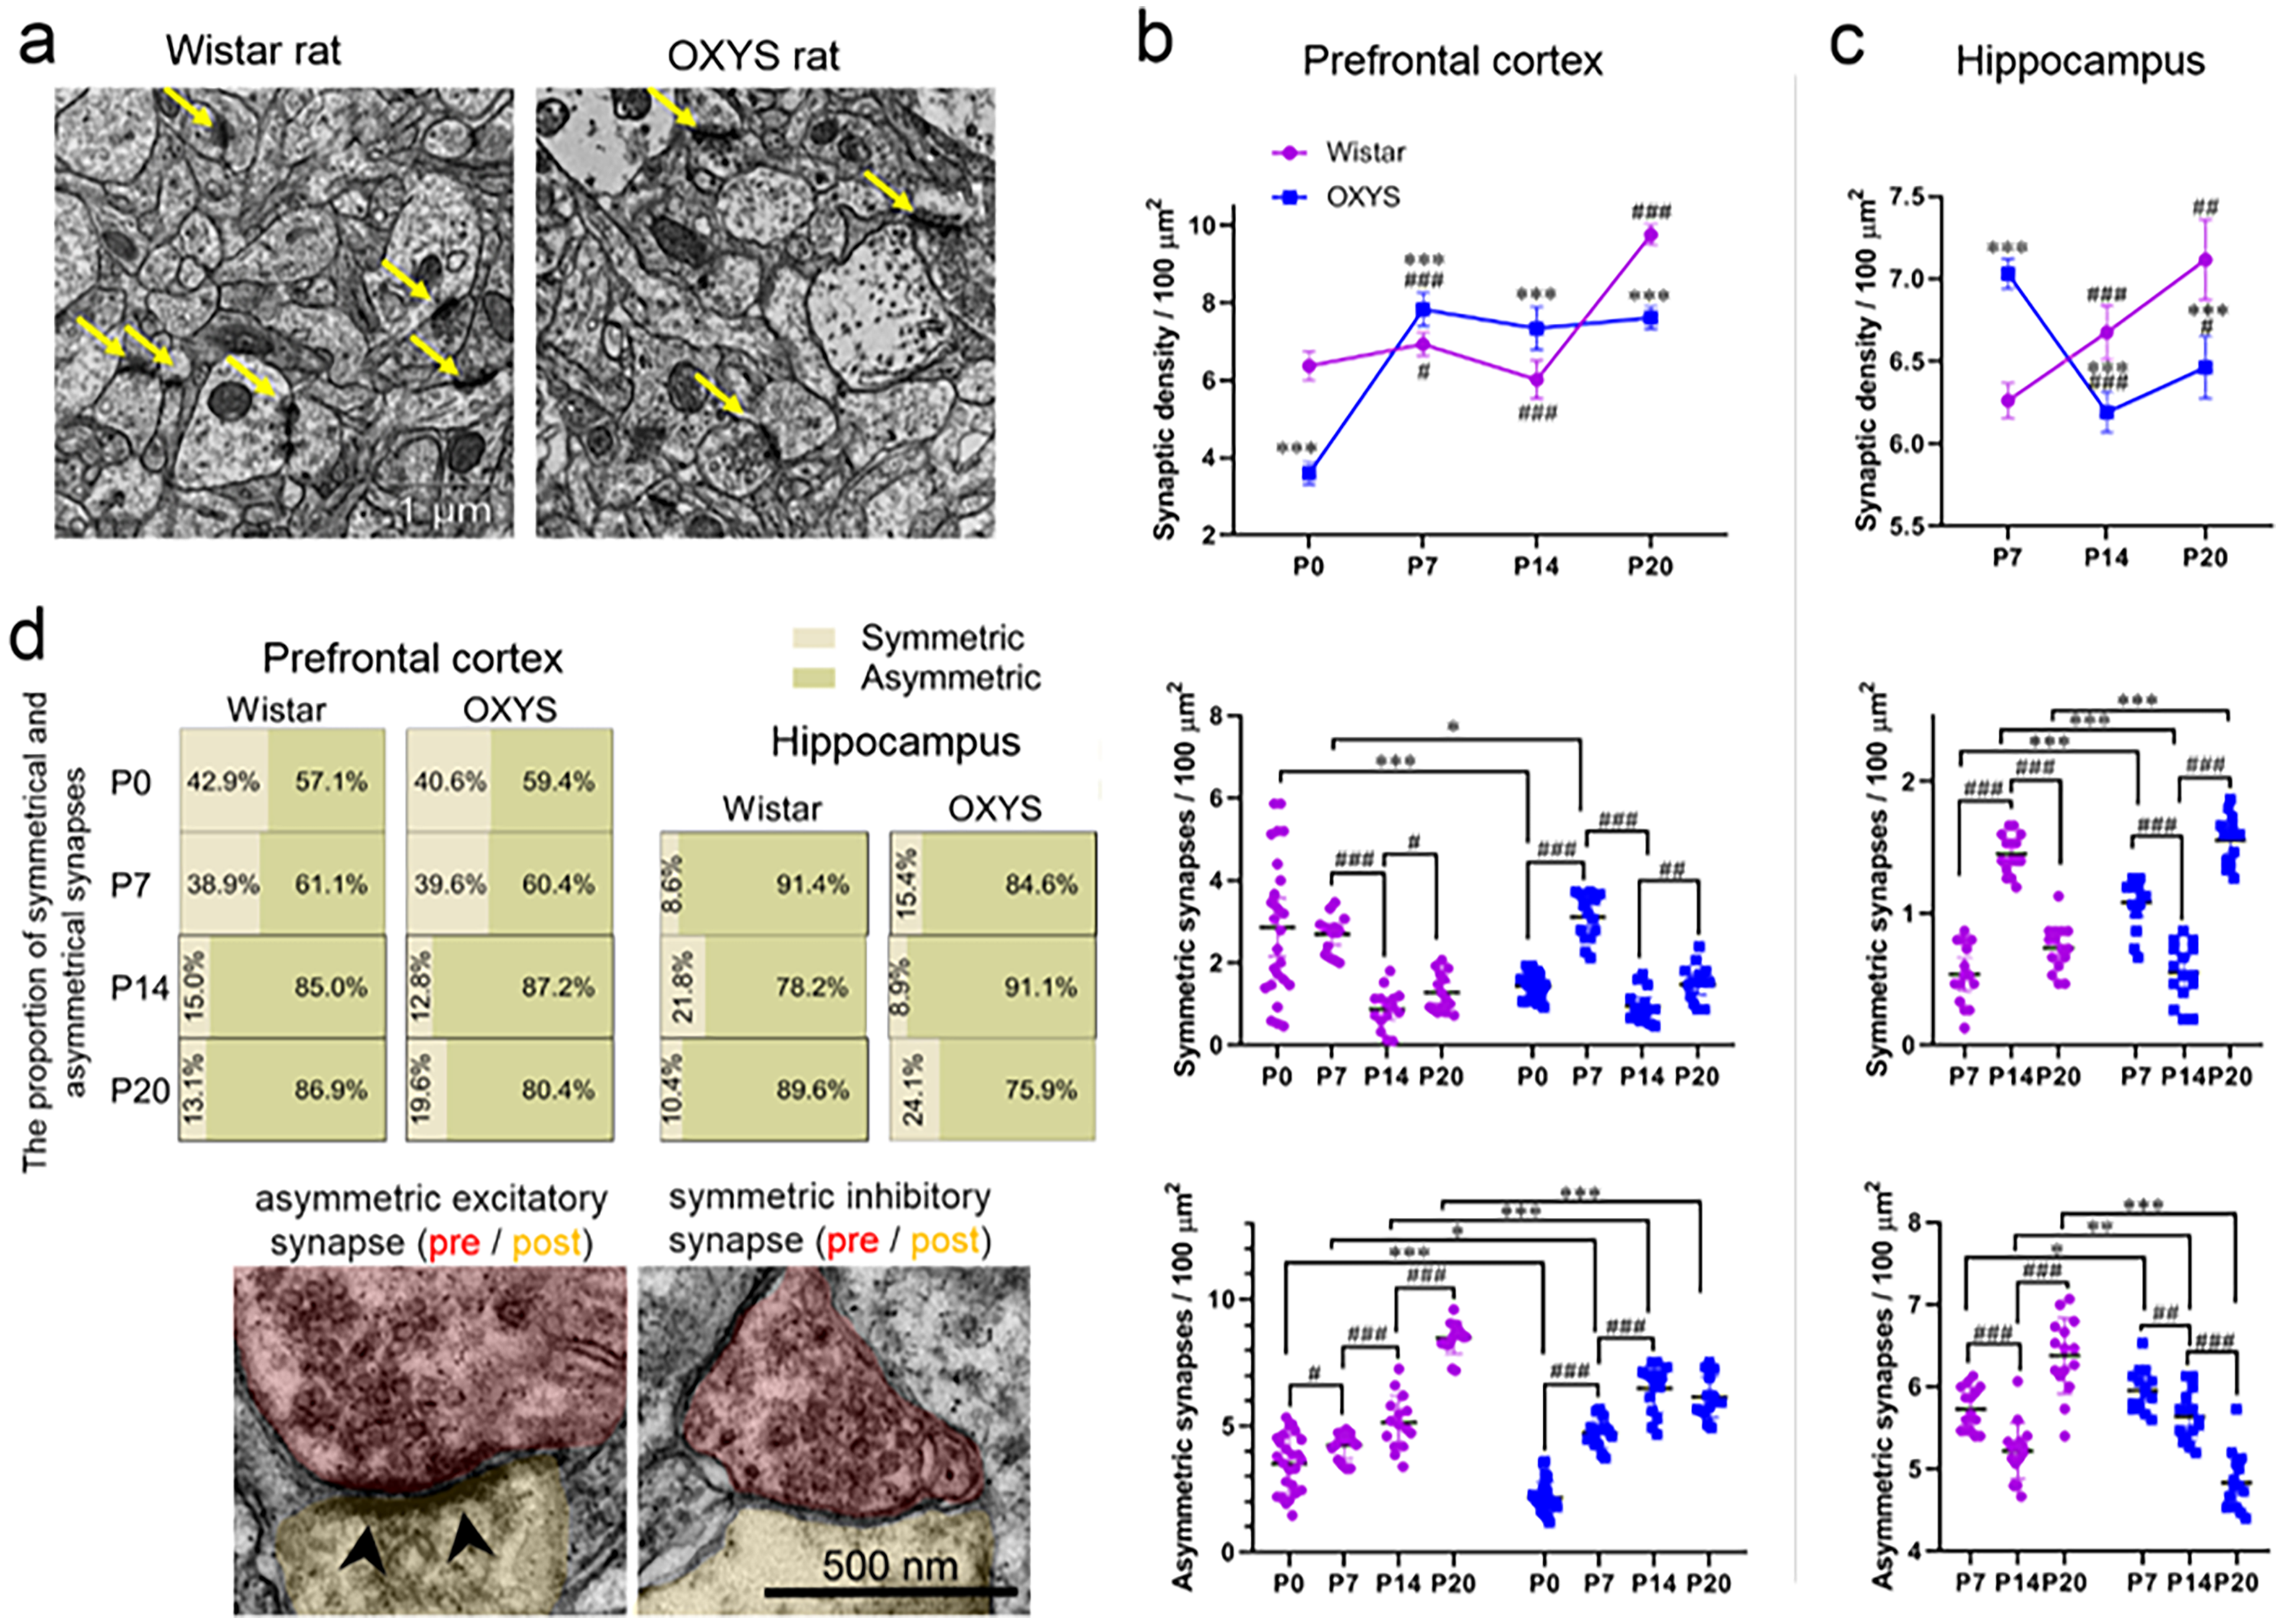
Features of synapse formation. The electron micrographs illustrate typical synaptic neuropil of layer IV in the PFC of both rat strains at P14 (a). Age-dependent alterations of synapse density for symmetric and asymmetric synapses (n = 15 image sections [4 animals and 3–4 sections/animal] per group) in the PFC (b) and hippocampus (c). The proportion of symmetric and asymmetric synapses in the total synapse density within the PFC and hippocampus (d). The electron micrographs illustrate an example of excitatory and inhibitory synapse morphology. Left: An electron micrograph of an asymmetric, excitatory synapse on a dendritic spine head. Note the consistently round appearance of the synaptic vesicles and the prominent postsynaptic density (arrowheads). Right: An electron micrograph of a symmetric, inhibitory synapse on a dendritic shaft. Note the flattened appearance of many synaptic vesicles and the absence of the postsynaptic density. The scale bar applies to both sets of images. The data are presented as mean ± SEM. Significant differences: *p < 0.05, **p < 0.01, or ***p < 0.001 for a comparison between the strains; #p < 0.05, ##p < 0.01, or ###p < 0.001 as compared to a previous age.
At birth (age P0), the total density of synapses in layer IV of the PFC of OXYS rats was almost two times lower than that in Wistar rats (p < 0.001; Figure 2(b)), due to both symmetrical (inhibitory) contacts (p < 0.001; Figure 2(b)) and asymmetric (excitatory) contacts (p < 0.001; Figure 2(b)). At the same time, the proportion of symmetric and asymmetric contacts among all synapses in both rat strains did not differ and amounted to ∼40% and ∼60%, respectively (Figure 2(d)). It should be pointed out that newborn rats are characterized by immaturity of synapse ultrastructure, which manifests itself as a small number of synaptic vesicles diffusely distributed in the cytoplasm of the presynaptic process and as a small size of active zones: the region in the presynaptic bouton that mediates a neuro-transmitter release.
A noticeable complication of the ultrastructure of synapses in layer IV of the PFC was observed toward the end of the first week of life: electron density of the cytoplasm of the processes at points of contact increased, and the thickening of the pre- and postsynaptic membranes became more pronounced. By age P7 in the PFC (Figure 2(b)) of Wistar rats, the density of synapses slightly increased (p < 0.05), while in OXYS rats, it more than doubled (p < 0.001) and became higher than that in Wistar rats (p < 0.001). The increase in synapse density in OXYS rats occurred due to asymmetric and symmetric contacts (twofold; p < 0.001 for both). At the same time, their proportion in the PFC did not differ between the rat strains and, just as at P0, amounted to ∼40% and ∼60%, respectively (Figure 2(d)). In the hippocampal CA1 region (Figure 2(c)) of OXYS rats at the age of P7, the total synapse density was also higher (p < 0.001) than that in Wistar rats owing to an increase in the number of symmetric contacts (twofold; p < 0.001). As for percentages of symmetrical and asymmetrical contacts, the proportion of inhibitory synapses in OXYS rats was higher, and the proportion of excitatory synapses was lower as compared to Wistar rats (p < 0.001 for both; Figure 2(d)).
By the age of P14, the structure of interneuron contacts became similar to the structure of synapses in adult animals (Figure 2(a)). In the PFC (Figure 2(b)), synapse density diminished significantly only in Wistar rats (p < 0.001)—but remained lower than that in OXYS rats (p < 0.001)—owing to asymmetric contacts (p < 0.001). The number of symmetrical contacts decreased in rats of both strains (p < 0.001), and interstrain differences disappeared. The proportion of symmetric and asymmetric contacts in the total population of synapses did not differ between the rat strains and was about 15% and 85%, respectively (Figure 2(d)). In the hippocampus (Figure 2(c)), by the end of the second week of life, the total synapse density rose in Wistar rats and declined in OXYS rats (p < 0.001 for both). The number of symmetrical contacts increased in Wistar rats and decreased in OXYS rats (p < 0.001 for both); the number of asymmetrical ones diminished in both rat strains (p < 0.05). The proportions of symmetric and asymmetric contacts differed between the rat strains (p < 0.001): in Wistar rats, the proportion of inhibitory synapses was higher (p < 0.01) while the proportion of excitatory synapses was lower (p < 0.001) as compared to OXYS rats. It is noteworthy that in OXYS rats at P14, the proportions of symmetric and asymmetric contacts in the hippocampus matched these parameters of Wistar rats at P7 (Figure 2(d)).
By the age of P20 in Wistar rats, the density of synapses in the PFC went up by 40% (p < 0.001; Figure 2(b)), and in the hippocampus by 6% (p < 0.01; Figure 2(c)). In OXYS rats, the number of synapses in the PFC did not change, while in the hippocampus, this parameter slightly increased (p < 0.05) by the age of P20. These parameters became lower than those in Wistar rats (p < 0.001). In addition, the proportion of symmetrical synapses in the hippocampus and PFC of OXYS rats was higher (p < 0.01), and the proportion of asymmetric contacts was smaller (p < 0.01) in comparison with Wistar rats (Figure 2(d)).
Postnatal alterations of the synaptic active zone and of levels of pre- and postsynaptic proteins
The presynaptic active zone of a synapse is a highly dynamic compartment in which synaptic vesicles fuse and release neurotransmitters. 35 As revealed by our analysis of active zones (Figure 3(c)), at birth (P0) in the PFC (Figure 3(a)) of OXYS rats, zones with a length of <300 nm predominated (constituted ∼60%), while in Wistar rats, zones >300 nm were prevalent (more than 60%; p < 0.001). By the age of P7 in the PFC of OXYS rats, the proportion of active zones with a length of <300 nm decreased (p < 0.001) to the level of Wistar rats, and the proportion of active zones with a length of 500–700 nm was greater than that in Wistar rats (p < 0.001). In the hippocampus of OXYS rats at P7, the proportion of active zones was similar to that in the cortex at P0: zones with a length of <300 nm pre-dominated (more than 60%; p < 0.001; Figure 3(b)). At P14 in the PFC, the proportion of active zones was similar between OXYS and Wistar rats, while in the hippocampus, the proportion of active zones with a length of <300 nm was smaller and of zones 300–500 nm was greater in OXYS rats than in Wistar rats (p < 0.001 for both). By the age of P20 in both rat strains, the proportion of active zones with a length of <300 nm rose (p < 0.001) and of zones with a length of >300 nm declined (p < 0.001) in the PFC and hippocampus.
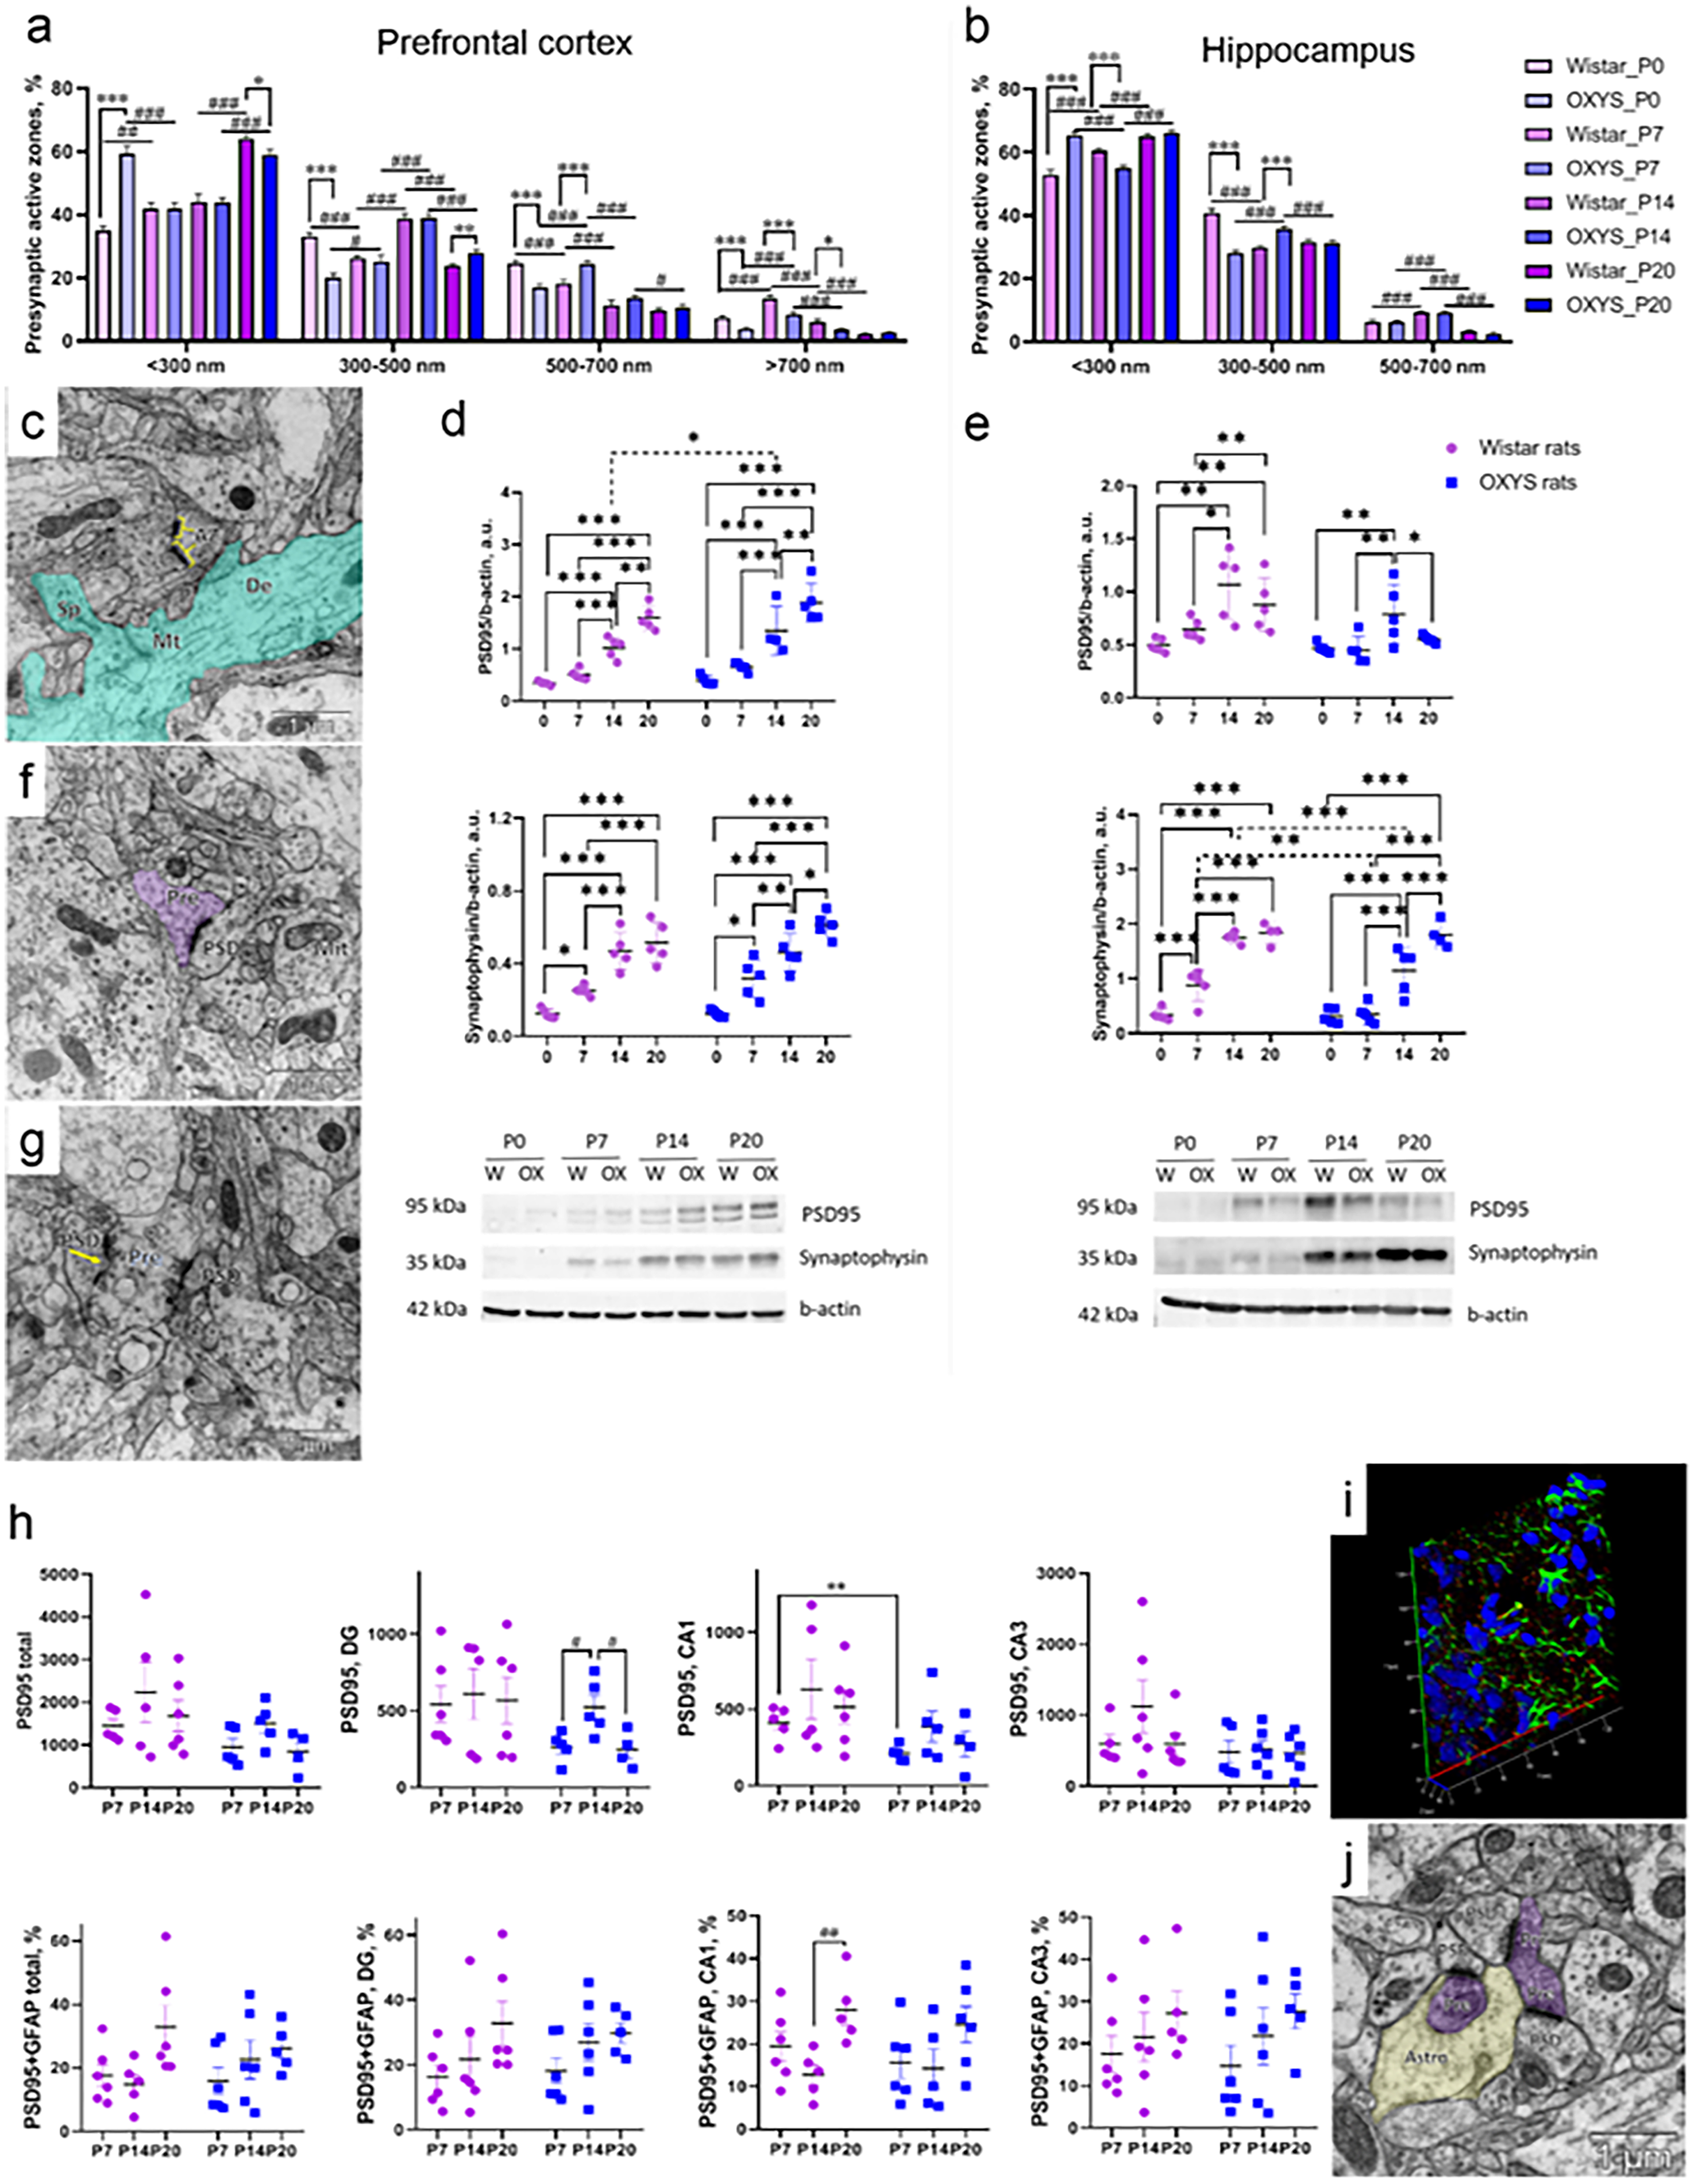
Features of postnatal alterations of the synaptic active zone and levels of pre- and postsynaptic proteins. Age-dependent changes in the length of the presynaptic active zone (n = 15 image sections [4 animals and 3–4 sections/animal] per group) in the neuropil of layer IV of the PFC (a) and of the CA1 region of hippocampus (b). The electron micrograph (c) depicts a perforated contact with two active zones (AZ; yellow brackets indicate their length) in the PFC of OXYS rat at P14. Turquoise pseudo-coloring = a dendrite process (De) with a dendritic spine (Sp) and microtubules (Mt). Age-dependent shifts of protein levels of PSD95 and synaptophysin in the PFC (d) and hippocampus (e) of Wistar and OXYS rats according to western blotting assays (n = 4–6 animals per group). The electron micrographs (f, g) present examples of presynaptic (Pre) and postsynaptic (PSD) terminals in the PFC of an OXYS rat at P14. Purple pseudo-coloring = a presynaptic terminal of a glutamatergic contact; Mito: mitochondria (f). The yellow arrow (g) indicates an asymmetric perforated synapse with pronounced invagination of the membrane, and this invagination may be a sign of activation of compensatory processes. Age-dependent changes in protein levels of PSD95 and in the proportion of tripartite synapses (h) in the CA1 and CA3 regions and dentate gyrus (DG) of hippocampus of Wistar and OXYS rats (n = 6) according to confocal microscopy (i). Blue: DAPI, green: GFAP+, red: PSD95 + . The electron micrograph shows an example of the tripartite synapses. Purple pseudo-coloring = presynaptic terminals of asymmetric contacts, yellow pseudo-coloring = astrocyte (j). The data are presented as mean ± SEM. For the electron and confocal microscopy analyses, significant differences: *p < 0.05, **p < 0.01, or ***p < 0.001 for a comparison between the strains; #p < 0.05, ##p < 0.01, or ###p < 0.001 as compared to a previous age. For western blotting analyses, significant differences: *p < 0.05, **p < 0.01, or ***p < 0.001. A dashed line indicates a significant difference between Wistar and OXYS rats. W: Wistar rats; OX: OXYS rats.
Postsynaptic terminals of excitatory synapses commonly contain a postsynaptic density (Figure 3(f), (g)) that harbors receptors for a neurotransmitter and numerous proteins such as PSD95. Here, we analyzed protein levels of synaptophysin (an integral membrane protein localized to synaptic vesicles) and PSD95 (a major synaptic scaffolding protein that plays a key role in synaptic plasticity). In the PFC, the protein levels of PSD95 and synaptophysin were minimal at birth (P0) and gradually increased until P20 (p < 0.01; Figure 3(d)) in both Wistar and OXYS rats. As for significant differences between the strains, only in the PFC of OXYS rats at P14 did we observe a significant increase in the protein level of PSD95 (p < 0.05). In the hippocampus, in Wistar rats the protein levels of PSD95 and synaptophysin gradually went up from P0 until P14 (p < 0.01; Figure 3(e)) and remained at the same level at P20. In OXYS rats, the level of synaptophysin gradually increased from P0 until P20 (p < 0.01), whereas the amount of PSD95 rose from P0 until P14 (p < 0.001) and diminished until P20 (p < 0.05). No significant differences in PSD95 levels were observed between the strains at P0-P20; as for synaptophysin, in OXYS rats its protein level was lower than that in Wistar rats at P7 and P14 (p < 0.01).
In addition, we analyzed the formation of tripartite synapses in hippocampal regions of OXYS and Wistar rats by confocal microscopy (Figure 3(h)–(j)). Between the pre- and postsynaptic neurons, astrocytes exchange information with synaptic neuronal elements, thereby responding to synaptic activity and in turn regulating synaptic transmission. 36 In the whole hippocampus, the dynamics of age-related differences between Wistar and OXYS rats in PSD95 levels were similar to those for PSD95 according to western blotting assays. Nonetheless, analyses of hippocampal regions showed that in OXYS rats at P7, amounts of PSD95 in the dentate gyrus and CA1 region were lower than those in Wistar rats (marginal significance p = 0.07 and p < 0.01, respectively). As for the proportion of tripartite synapses, we found no significant differences between the two rat strains in percentage of PSD95 + GFAP + cases. With age (from P14 to P20) the proportion of tripartite synapses increased in both rat strains, but this increase was significant only in Wistar rats in the CA1 region (p < 0.01), with only marginal significance in the whole hippocampus (p = 0.051).
Gene expression profiles related to synapses
To determine gene expression shifts associated with synaptic processes in OXYS rats, we examined our previous RNA-seq data in the PFC and hippocampal tissues from 3-, 10-, and 20-day-old OXYS and Wistar rats. 25 In the PFC, in the set of DEGs between OXYS and Wistar rats, 25 at age P3 in OXYS rats, we identified 382 (padj < 0.05) genes (according to the RGD) related to synapses (Figure 4(a)). There were 238 such DEGs at P10 and 35 at P20. In the hippocampus, there were 141 synapse-related DEGs at P3, 363 at P10, and 31 at P20 (Figure 4(c)). PCA showed that the gene expression profile in the PFC (Figure 4(b)) and hippocampus (Figure 4(d)) at P3, P10, and P20 was different between OXYS and Wistar rats. Gene expression levels in the PFC and hippocampus of both rat strains is presented in Figure 4(e) and Figure 4(f), respectively. According to GO analysis by DAVID, for the set of DEGs in the PFC and for the set of DEGs in the hippocampus at P3–P20, the most statistically significant GO terms were synapse, glutamatergic synapse, postsynaptic density, dendrite, axon, protein binding, and others (Figure 4(g)).
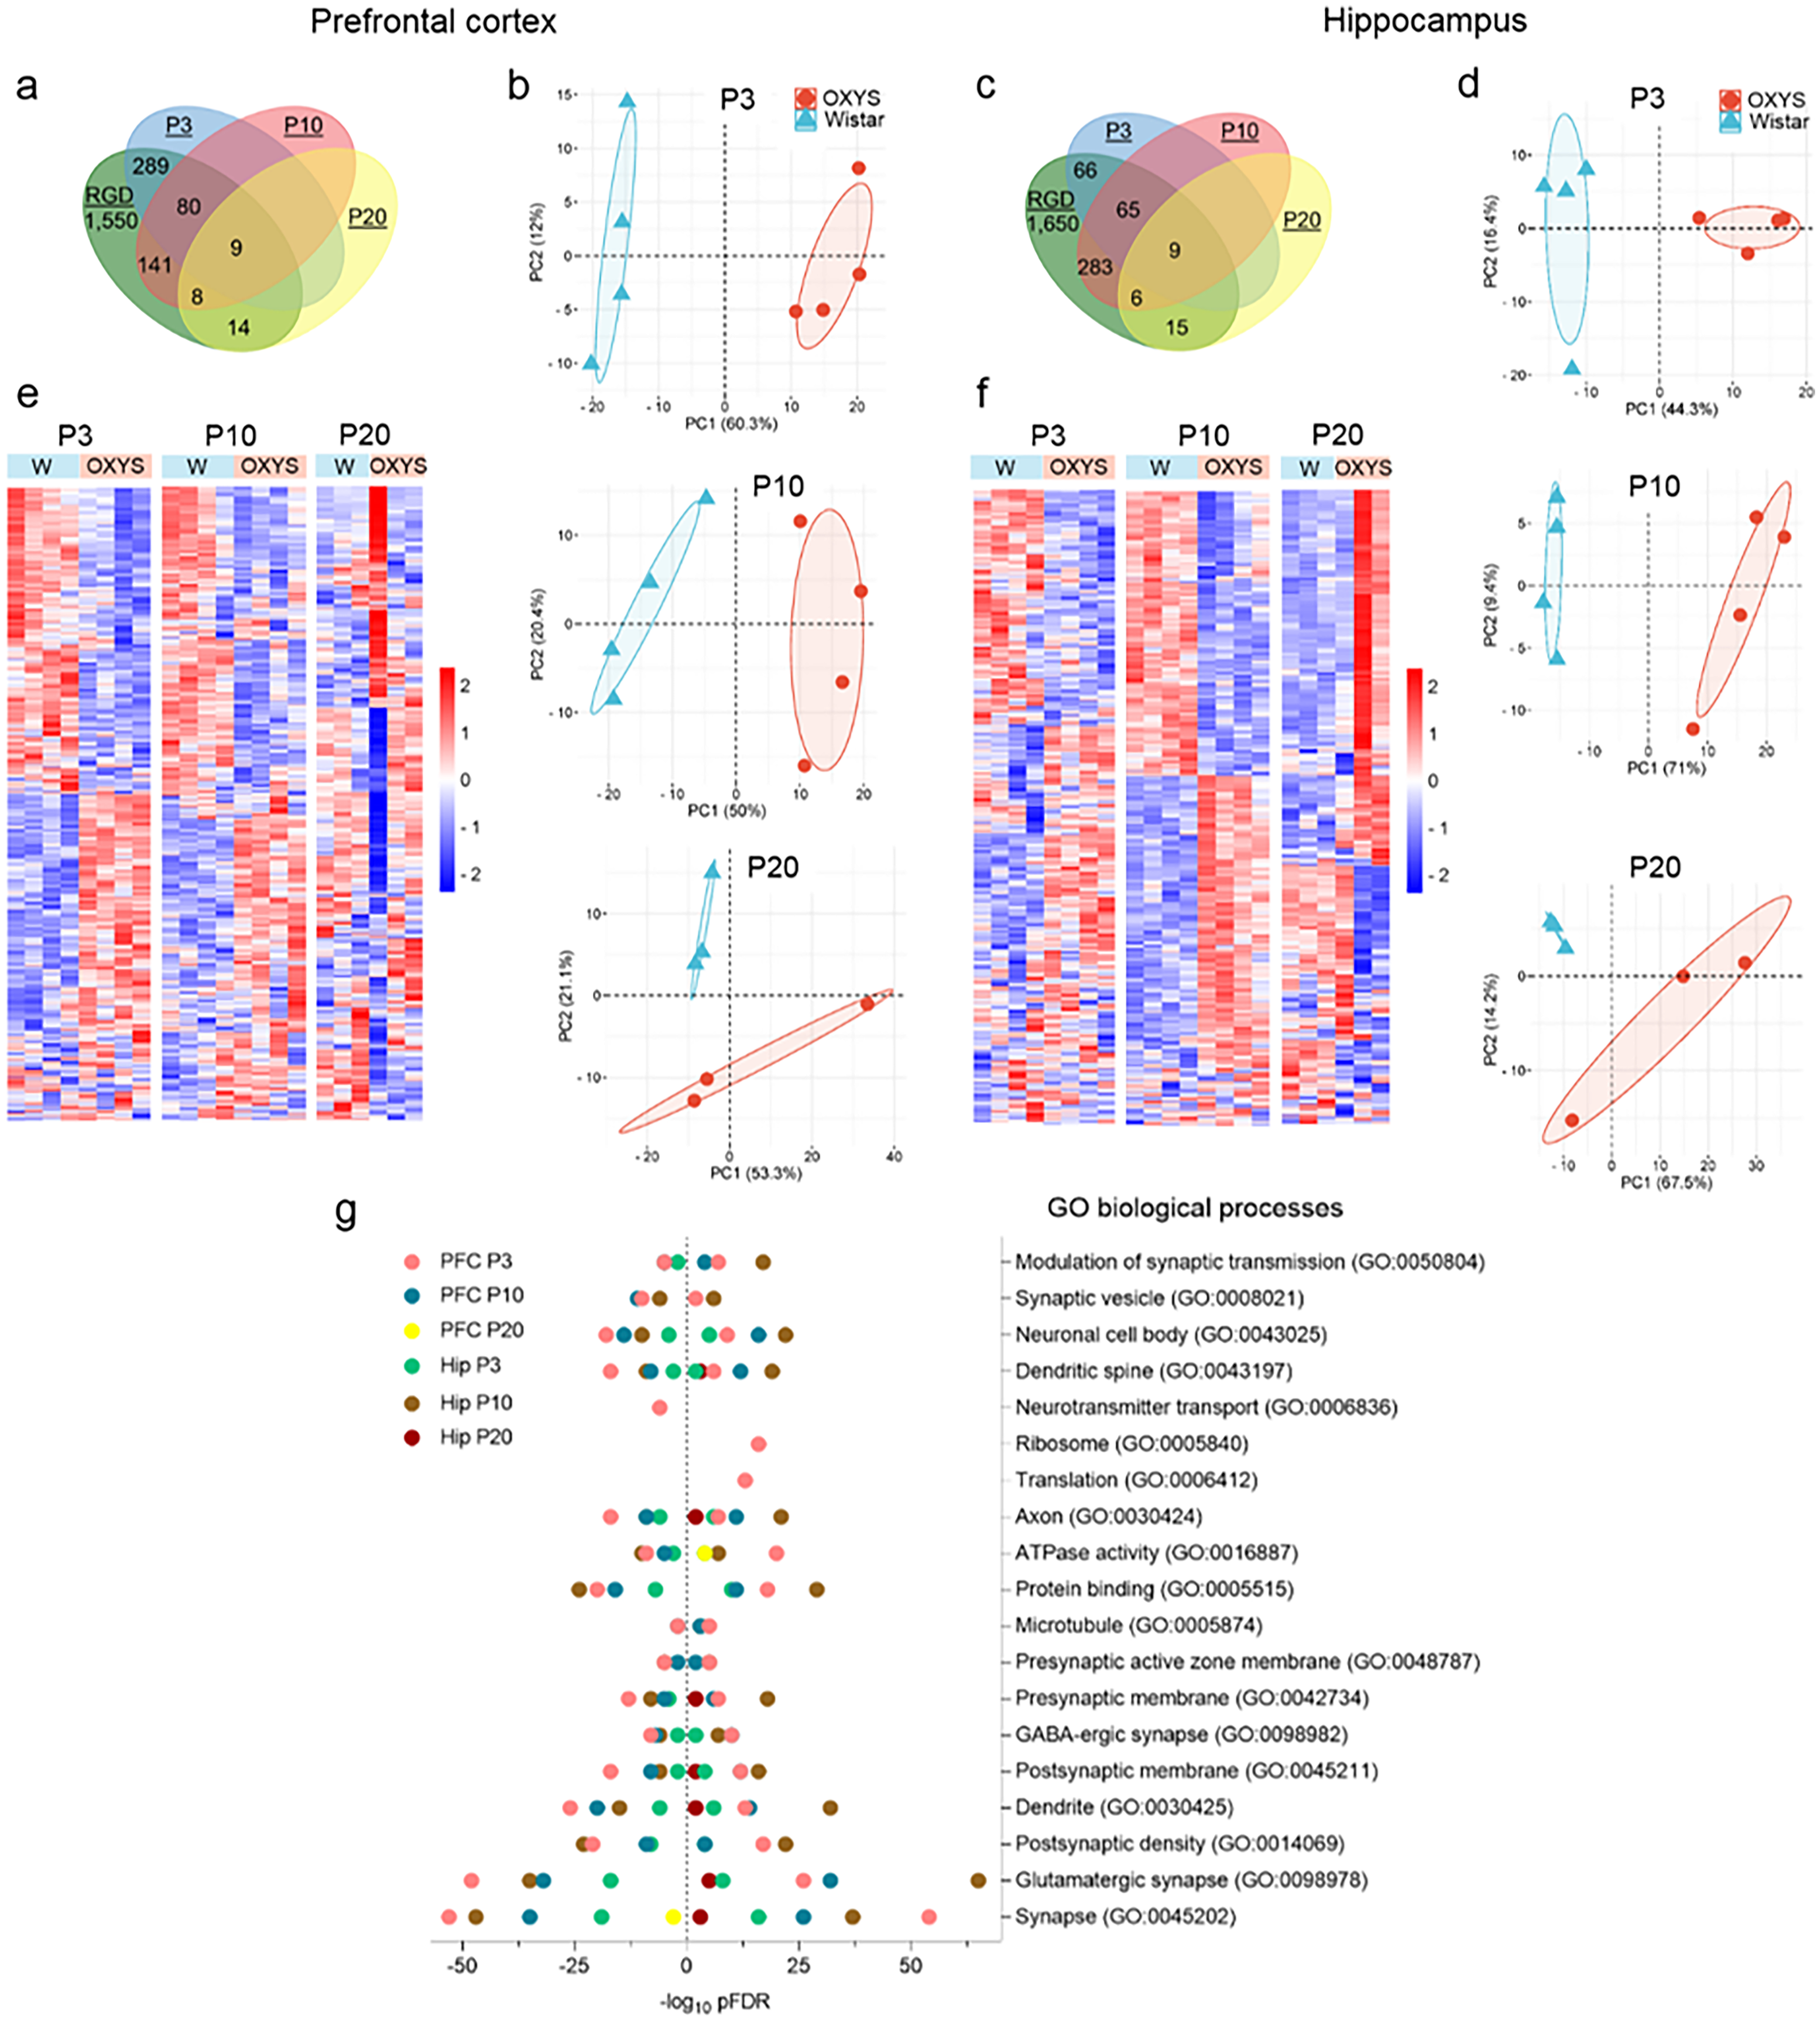
Expression profiles of synapse-related genes. The number of DEGs related to synapses (according to RGD) in the PFC (a) and hippocampus (c) of OXYS rats compared with Wistar rats. The samples of the PFC (b) and hippocampus (d) of OXYS and Wistar rats at P3, P10, and P20 are projected onto the space spanned by PCA. Gene expression levels (rows) in the PFC (e) and hippocampus (f) for an individual animal (columns) of the Wistar or OXYS strain. DAVID analysis was performed on synapse-related DEGs expressed in the PFC and hippocampus of OXYS rats and identified the most statistically significant GO terms (g).
Next, we identified “age-specific” genes by performing a comparative analysis of interstrain DEGs among time points P3–P20 in the PFC and hippocampus of OXYS rats. We found that for DEGs at P3 and P10 (but not at P20), changes of expression were unidirectional when the two brain regions were compared (Figure 5(a) and (b)). Although the sets of DEGs were different among the time points, DEGs were associated with the same GO cellular components: “cell junction,” “postsynapse,” “dendrite,” “glutamatergic synapse,” and “presynapse.” Additionally, we found “brain region-specific” genes at P3, P10, and P20. In the PFC, nine DEGs common among these time points were identified (Figure 5(c)). These genes were related to glutamatergic neurons (Arc, Grin3b, and Grm2), ATP binding activity (Atp13a5, Vps4b, and Rhobtb3), regulation of gene transcription (Egr3), extracellular matrix formation and migration (Fam107a), and autophagosome–lysosome fusion (Stx17). There were nine shared DEGs in the hippocampus (Figure 5(d)), and they are associated with glutamatergic neurons (Grin3b and Grm6), ATP binding activity (Abca17, P2rx4, and Rhobtb3), extracellular matrix (Sparcl), trafficking and exocytosis (Syt15), and modulating axonal architecture and synaptic plasticity (Rapgef4 and Sncg). Thus, our results indicate that the level of Grin3b mRNA in the PFC and hippocampus was higher in OXYS rats than in Wistar rats at P3–P20.
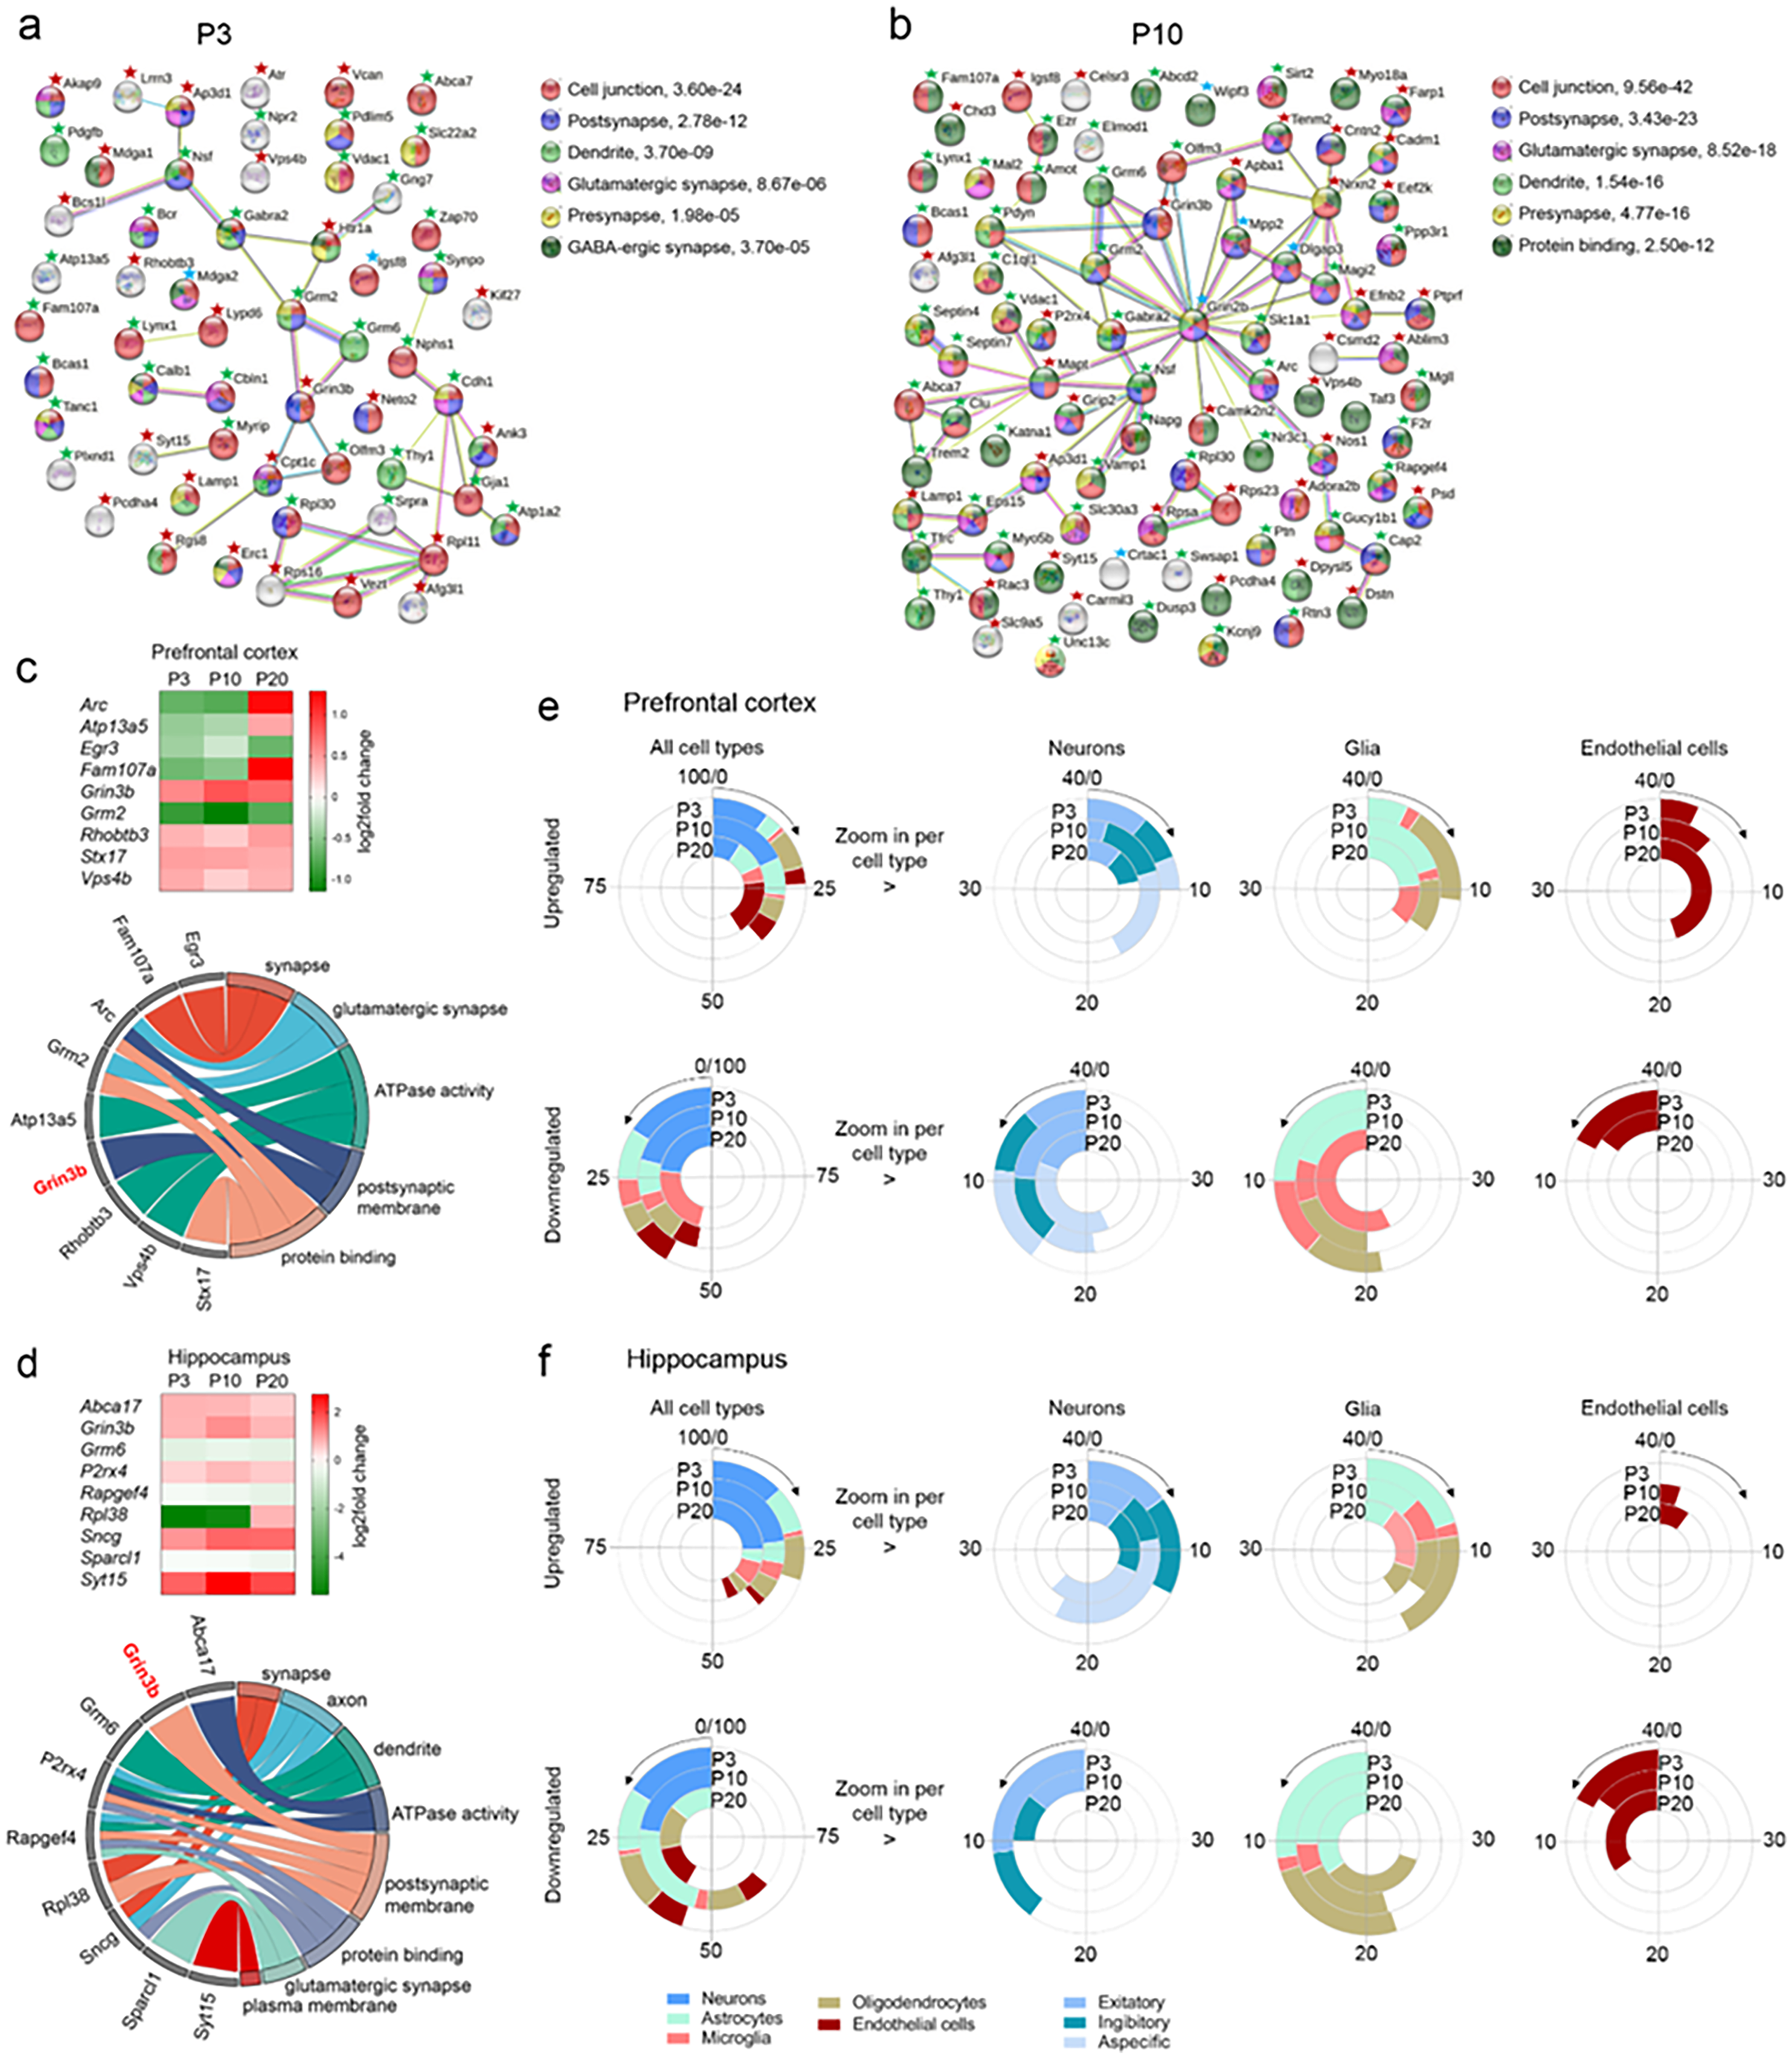
Differential expression of genes: the effect of the genotype. Upregulated (red asterisk) and downregulated (green asterisk) DEGs in the PFC and hippocampus of 3- and 10-day-old OXYS rats compared to age-matched Wistar rats. GO terms according to STRING for sets of DEGs in both brain regions at P3 (a) and at P10 (b). Blue asterisks indicate DEGs (in terms of differential expression between OXYS rats and age-matched Wistar rats) with expression changes directed differently if the PFC and hippocampus are compared. Matching genes that significantly changed expression in the PFC (c) and hippocampus (d) between ages P3 and P20 in OXYS rats are presented too. The DEGs are red if upregulated and green if downregulated. The chord plots show the relation between GO terms (according to DAVID) and matching DEGs in the PFC (c) and hippocampus at P3–P20. Cell-type-specificity signatures for synapse-associated genes manifesting increased or decreased expression in the PFC (e) and hippocampus (f). The circle diagram on the left shows all cell types combined. Genes that could not be assigned to a specific cell type were not plotted (no color to 100% in the circle diagrams on the left). The circle diagrams on the right zoom into subcategories of specific cell types (neurons, glia, immune cells, and endothelial cells).
Finally, we examined the cell-specific gene expression associated with synapses in the PFC (Figure 5(e)) and hippocampus (Figure 5(f)). At P3–P20, the proportions of DEGs specific for neurons, astrocytes, microglia, oligodendrocytes, and endothelial cells did not significantly differ between the two brain regions. Nonetheless, in the hippocampus of OXYS rats at P3, there was the highest proportion of genes specific for excitatory and inhibitory neurons. Moreover, in the PFC and hippocampus, more than 50% of downregulated genes were associated with glia. The highest proportion of endothelial-cell–specific genes was found in the PFC during brain maturation (P3–P20).
Discussion
Synapse density increases between birth and early adulthood—while causing differentiation of brain regions and neuronal networks—and potentially has implications for the trajectory of cognitive function across the lifespan. 37 Here, we quantified the density of axons, dendrites, and synapses and found that in the PFC and hippocampus of both rat strains, there is a rapid initial increase in the first 3 weeks of the postnatal period. Nonetheless, we found that at birth, the synaptic population in the PFC of OXYS rats is half of that in Wistar rats. Besides, in OXYS rats, contacts with the short active zones were twice as large; this phenomenon may reflect impaired efficiency of synaptic transmission. It is generally accepted that a larger synaptic active zone is more effective at exciting postsynaptic neurons. 5
By the end of the first week of life, synaptogenesis in the PFC of OXYS rats was significantly enhanced, apparently due to compensation for its delay at birth, and active formation of interneuronal contacts with larger synaptic active zones was observed. In general, in the rat hippocampus, neurogenesis of pyramidal neurons and interneurons occurs in the last days of embryonic life; synaptic connections begin to get established after birth with the growth of axons and dendrites, which reach properties of an adult by the end of the second postnatal week. 38 Our data indicate that in the hippocampus of OXYS rats, the formation of contacts occurs with a delay and apparently less effectively: the proportion of inhibitory synapses was larger, and the proportion of excitatory synapses was smaller as compared to Wistar rats. In addition, the contacts with the short active zones were greater and protein levels of PSD95 and synaptophysin were lower in OXYS rats. Furthermore, our previous study on the maturation of mossy fibers in the hippocampus has shown that at birth (P0), OXYS rats have only stand-alone axons in the region of the suprapyramidal bundle, whereas in Wistar rats, a bundle is already formed. 22 Moreover, in OXYS rats, the fibers forming supra- and infrapyramidal bundles are less compactly arranged throughout the early postnatal period, which may be associated with less active fasciculation of granule cell axons. 22
Immature neurons initially communicate via voltage-dependent currents. 39 The timing of the transition of the GABA action potential from depolarization to an inhibitory effect depends on brain structure and neuron type but is thought to occur around the second postnatal week in rodents (∼first postnatal week in humans). 11 According to our current findings, by the end of the second week of life, the density of axons, dendrites, and synapses in the PFC of OXYS rats remained higher than that in Wistar rats, while the proportion of symmetric and asymmetric contacts in the total population of synapses did not differ between the two rat strains. In the hippocampus, the density of axons and dendrites did not differ between the strains. On the other hand, the density of synapses was significantly lower in OXYS rats than in Wistar rats. Nevertheless, the formation of inter-neuronal contacts took place probably more actively in OXYS than in Wistar rats: the proportion of asymmetric contacts with larger synaptic active zones was higher.
By the end of the third week of life, the period of completion of the brain formation in rats, the synapse density was found to increase in the hippocampus and to a greater extent in the PFC of Wistar rats, while in OXYS rats, it remained virtually unchanged and as a consequence became lower. Moreover, the number of excitatory synapses in both brain regions of OXYS rats was found to become smaller. It is worth mentioning that in OXYS rats at P14 and P20, the proportion of symmetric and asymmetric contacts in the hippocampus matched these parameters in Wistar rats at P7 and P14, respectively. Thus, these data, just as the data on the PFC, indicate a delay in the formation of interneuronal connections and their efficiency in the OXYS strain. In addition, we have previously demonstrated that brain maturation in OXYS rats occurs concurrently with a delay in pre- and postnatal waves of neurogenesis and neuronal maturation. 23
In the context of studying synaptogenesis in the early postnatal period, it is important to note that Wistar and OXYS pups are under maternal care until the age of 20 days. It is possible that the delay in the formation of interneuronal contacts may be promoted by the low maternal care of OXYS rats. 16 There is evidence for a direct relationship between maternal behavior and hippocampal development, synaptogenesis. 40 Specifically, pups raised by low maternal care show more anxiety-like behaviors, depressive-like behaviors, and increased stress vulnerability in adulthood. 41 Animals exposed to abnormal maternal care have been shown to exhibit progressive cognitive deficits in adulthood. They also display impaired hippocampal long-term potentiation and synaptic degeneration. 42 The replacement of OXYS rat mothers with health recipient mothers led to faster maturation of neonatal reflexes and a change in the density of neurons in the hippocampus in the offspring. 43
All of the above results are consistent with our transcriptome analysis of the PFC and hippocampus here: DEGs related to synapses in OXYS rats turned out to be associated with postsynaptic density, glutamatergic synapse, dendrite, axon, protein binding, and other relevant GO terms. Among the brain region–specific genes, some genes are of interest. In the PFC of OXYS rats, the expression of Arc, encoding a cytoskeleton-associated protein, proved to be decreased at P3 and P10 and elevated at P20. ARC is a master regulator of synaptic plasticity and plays an important role in the control of large-scale signaling networks involved in learning, memory consolidation, and behavior. 44 Arc transcription can be induced by a brief behavioral event leading to synaptic activation. Expression of another gene related to glutamatergic neurons—Grin3b—was found to be upregulated in both brain regions of OXYS rats at P3–P20. It should be noted that its expression proved to be upregulated in the PFC and hippocampus of OXYS rats (p < 0.05) during the periods of manifestation (age 5 months) and progression (age 18 months) of signs of the AD-like pathology. 19 GRIN3B participates in learning and memory, synaptic plasticity, and synaptogenesis. 45 Recently, transcriptomic analysis of 400 monozygotic twins showed that a decrease in cognitive function correlates with the upregulation of GRIN3B. 46 Additionally, our colleagues have reported overexpression of Grin3b in the brainstem of adult Wistar rats 2 h after an acute stress exposure. 47
Synapse formation requires changes in the extracellular environment. Cell adhesion molecules, including Sparc-like protein 1 (SPARCL), take part in modulation of the synaptic extracellular environment and synaptic connectivity. The presence of SPARCL may help create the appropriate environment required for synapse formation during postnatal development and for synapse remodeling in the adult brain. 48 In the present work, Sparcl expression in OXYS rats was found to be reduced in the hippocampus at P3–P20. Furthermore, our results indicate downregulation at P3 and P10 and upregulation at P20 for the Fam107a gene in the PFC; this gene is related to extracellular-matrix formation and cell migration. It has been shown that during cortical development, outer radial glia highly express the FAM107A gene. 49 Pericytes play an important role in angiogenesis, blood–brain barrier integrity maintenance, and cerebral blood flow regulation. 50 Atp13a5 is a specific marker of CNS pericytes that cover small blood vessels. 51 In OXYS rats, the expression of Atp13a5 was found to be downregulated at P3 and P10 and upregulated at P20.
Finally, our data indicate a significant contribution of glia to the formation of inter-neuronal contacts: among the interstrain DEGs associated with synapses, ∼50% of DEGs in the PFC and hippocampus of OXYS rats at P3–P20 proved to be specific for astrocytes, microglia, and oligodendrocytes: key regulators of neural-network functioning. Moreover, in both brain regions, more than 50% of downregulated DEGs are associated with glia.
Conclusions
In conclusion, our previous and present results support the supposition that prerequisites for subsequent development of neurodegenerative disorders are formed during the completion of brain maturation, in accordance with the so-called neurodevelopmental hypothesis of neurodegenerative disorders. 52 Our previous data have uncovered features of neuro- and gliogenesis.23,25 and point to a delay and insufficient efficiency of the formation of interneuronal contacts in the brain of OXYS rats in the early postnatal period. Here we demonstrated that these effects in the PFC and hippocampus may be due to shifts in the expression of synapse-related genes associated with glial cells; the latter control neurogenesis and regulate neuronal migration, axon growth, angiogenesis, synapse formation, and ultimately the maturation and functioning of neural networks.
Footnotes
Acknowledgements
The animals were kindly provided by the Breeding Experimental Animal Laboratory of the ICG SB RAS (Novosibirsk, Russia). The authors would like to thank the Multi-Access Chemical Research Centre SB RAS.

Ethical considerations
The study was conducted according to Directive 2010/63/EU of the European Parliament and of the European Council of 22 September 2010 and was approved by the Commission on Bioethics at the ICG SB RAS (decision # 34 of 15 June 2016), Novosibirsk, Russia.
Author contribution(s)
Funding
The authors disclosed receipt of the following financial support for the research, authorship, and/or publication of this article: This work was supported by the basic-research project, (grant number FWNR-2022-0016).
Declaration of conflicting interests
The authors declared no potential conflicts of interest with respect to the research, authorship, and/or publication of this article.
Data availability statement
The data supporting the findings of this study are available on request from the corresponding author. The data are not publicly available due to privacy or ethical restrictions.