



Abstract
Background
While it is clear that abnormal tau structures contribute to the clinical symptoms of Alzheimer's disease (AD), which of the many structural entities found in the AD brain underlie templated misfolding and progression of disease remains uncertain. However, their identification is crucial to target for more effective diagnostics and therapeutics.
Objective
To identify the most pathogenic tau species driving Alzheimer's disease progression.
Methods
We compared the biochemical and templated seeding properties of tau isolated from post-mortem brain tissue of patients with varying rates of clinical progression, categorized as rapid, slow, or typical, based on longitudinal decline in cognitive performance assessed by Clinical Dementia Rating Sum of Boxes scores. Sarkosyl-insoluble filamentous preparations were compared to aqueous-soluble preparations. Focusing on the aqueous-soluble proteins, we further characterized the most efficient seeding species using size-exclusion chromatography and quantifying oligomers using dot blot under both native and denaturing conditions.
Results
A rapidly progressive course corresponded to enhanced tau seeding behavior, with the strongest correlations observed in the aqueous-soluble fraction. Using size-exclusion chromatography, we demonstrated that the seeding activity of fractions containing oligomers, correlated most strongly with disease aggressiveness. Moreover, quantifying oligomers using dot blot under both native and denaturing conditions, we found that rapid progressors had higher levels of oligomeric tau, which was also more stable.
Conclusions
Aqueous-soluble oligomeric tau species may be an important driver of AD progression. Substantial heterogeneity was observed even in purified samples, suggesting that variations in tau conformers among patients may contribute to differences in clinical disease progression.
Keywords
Introduction
Alzheimer's disease (AD) is a heterogeneous disorder characterized by significant variability in disease progression rates among individuals.1–3 While it has long been obvious in clinical studies that some individuals progress more rapidly than others, it has been difficult to discern whether this was due to differential underlying pathologies (e.g., overlapping with concurrent other diseases) or to differences in the phenotypic presentation of AD itself among individuals. A subtype of AD, known as rapidly progressive Alzheimer's disease (rpAD), was initially identified in prion reference centers as cases showing AD neuropathological changes but without evidence of prion disease, despite an unusually rapid clinical course, that might be suggestive of prion disorders.2,4 Known genetic and environmental factors account for only about 30% of phenotypic variability, and notably, rpAD cases exhibit a low frequency of APOE ε4 alleles.3,5–8 Additionally, distinct amyloid-β (Aβ) conformers with extended C termini (Aβ42) have been observed in rpAD, 9 and the seeding capacity of soluble and insoluble tau has been correlated with faster disease progression.10,11 Moreover, rpAD is characterized by specific tau conformers that display increased seeding activity and stability. 12
The pathological role of tau in AD is complex, as multiple tau species—including phosphorylated tau monomers (pTau), oligomers, fibrils, and truncated forms—are implicated in disease progression.13–29 While tau fibrils have traditionally been considered the most pathological due to their ease of detection in neurodegenerative disorders and specific cryo-EM conformations, 30 recent evidence suggests that tau oligomers may also play a crucial role in AD pathophysiology, potentially through distinct mechanisms of action.31,32 Furthermore, our earlier studies 10 suggested that the seeding potential of oligomeric tau (defined here as tau that is soluble, present in an aqueous extract of human AD cortex, and which appears in an early “high molecular weight (HMW) fraction on size exclusion chromatography) correlates with the speed of progression of the clinical course of the patient. A similar result was detected in the soluble fraction of tau derived from patients with PS1 mutations who had been followed longitudinally until death. 33
The variability in AD progression rates provides a unique opportunity to investigate the most pathological tau species. By leveraging differences in disease progression, we seek to elucidate the role of various tau species in AD pathology and assess their potential as biomarkers for improved diagnosis and targeted treatment strategies. This study aims to explore the relationship between tau molecular diversity and clinical heterogeneity in AD, with a particular focus on identifying and characterizing distinct, highly potent tau seed conformers in rapidly progressing cases. Specifically, we sought to identify the most pathological tau species by comparing the bioactivity and stability of multiple tau species extracted from patients with rapidly progressive AD and slowly progressive AD.
In this work, we confirmed in a second independent cohort of sporadic AD our previous findings suggesting a relationship between pathological soluble tau and the rate of disease progression. 10 We also extended prior research by directly comparing soluble tau species derived from AD brains with the well-studied fibrillar, sarkosyl-insoluble tau species. Furthermore, we performed new biochemical characterizations of soluble tau species to gain deeper insights into the mechanisms underlying their aggressiveness.
Methods
Cohort selection
This cross-sectional postmortem study included 20 human brains obtained from the Massachusetts Alzheimer's Disease Research Center (MADRC) Longitudinal Cohort study based on the following criteria: 1) a postmortem diagnosis of AD by a neuropathologist with Braak neurofibrillary tangles (NFTs) stage V or VI; 2) cognitive status assessed at least three times by a clinical expert at the MADRC, with scoring based on the staging dementia rating scale sum of box (CDR-SOB); and 3) no neuropathological or neurological comorbidities other than vascular disease.
Cases with a CDR-SOB slope below the 10th percentile were included in the slow progressors group (n = 5); cases with a CDR-SOB slope above the 90th percentile were included in the rapid progressors group (n = 5); and 10 randomly selected cases with a CDR-SOB slope between the 25th and 75th percentiles were included in the typical progressors group.
We approximated the rates of progression by applying a linear regression model to the longitudinal CDR-SOB scores (from onset to CDR-SOB = 18, or from onset to the last available score if CDR-SOB = 18 was not reached). Demographic characteristics and neuropathologic data are summarized in the Table 1.
Demographic, clinical, and neuropathological characteristics of the study groups classified by disease progression rate (Slow, Typical, Rapid).

Values are expressed as percentages with absolute numbers in parentheses (% (No.)) for categorical variables and as mean ± standard deviation (SD) with minimum and maximum values (Min | Max) for continuous variables.
Group comparisons were performed using Kruskall-wallis test with multiple comparisons, and p values indicate the level of significance for pairwise comparisons between groups: rapid versus slow, rapid versus typical, and typical versus slow.
APOE: apolipoprotein E genotype; CDR: Clinical Dementia Rating; MMSE: Mini-Mental State Examination; ADNC: Alzheimer's Disease Neuropathologic Change; Thal: Thal amyloid phase; Braak: Braak neurofibrillary tangle stage.
Tissue
Tissue was provided by the MADRC with approval from the Mass General Brigham IRB (1999P009556). Autopsy tissue from human brains was collected at Massachusetts General Hospital (MGH) with informed consent from patients or their relatives, and approval from local institutional review boards.
PBS soluble proteins extraction
For each case, frozen tissue (Bodmann area 8, 1 g/case) was split into two equal parts. Half was used for immunostaining and the other half was dissected to separate the gray matter and the white matter. Gray matter was Dounce homogenized (20-ml glass homogenizer, 3099C K54 Glas-Col, set at 70% maximum power) in 10 volumes (v/w) of PBS containing 1× protease inhibitor (#5871, Cell Signaling Technology) with 30 strokes on ice. The homogenates were transferred to a 5-ml tube and centrifuged at 10 000 × g for 10 min at 4°C. The supernatants (PBS soluble extracts) were collected and kept at −80°C until further processing. The pellets were collected and used for sarkosyl-insoluble extraction.34–36
Size exclusion chromatography
0.5 ml of PBS soluble brain extracts were separated by size exclusion chromatography (SEC) on a single Superdex 200 10/300GL column (no. 17–5175-01, GE Healthcare, Chicago, IL, United States) in PBS, at a flow rate of 0.5 ml/min using an AKTA purifier 10 (GE Healthcare). Twenty-eight fractions of 0.5 ml were collected.
Sarkosyl-insoluble proteins extraction
For each case, 9 volumes/weight (v/w) of high salt buffer (10 mM Tris pH 7.4, 10% sucrose, 0.8 M NaCl, 1 mM EDTA, 0.1% sarkosyl, and 1× protease/phosphatase inhibitor cocktail, #5872, Cell Signaling Technology) were added to the pellet obtained after centrifuging the PBS-soluble protein extraction at 10,000 × g. The homogenates were transferred to a 5 ml tube and centrifuged again at 10,000 × g for 10 min at 4°C. The supernatants were collected and filtered through a Kimwipe into a 10 ml Falcon tube. A 25% sarkosyl solution in distilled water was then added to the supernatant to achieve a final concentration of 1% sarkosyl, followed by 1 h of incubation under agitation at room temperature (RT). The supernatants were ultracentrifuged at 70,000 × g for 2 h at 4°C (rotor Type 70.1Ti, Optima XPN, Beckman Coulter, Brea, CA, United States). The supernatant was discarded, and the pellets were rinsed twice with PBS, then resuspended in 1 ml PBS before a second ultracentrifugation at 250,000 × g for 30 min at 4°C (rotor MLA-130, Optima Max-XP, Beckman Coulter). The pellets were resuspended and broken into small pieces in 1 ml PBS and left overnight under agitation at RT. After a brief centrifugation (1 min at 1000 × g), the pellets were further broken down using a 27-gauge needle and sonicated with 20 short pulses at power 2 of 6 on ice using a handheld sonicator (QSonica). The samples were then centrifuged for 30 min at 100,000 × g at 4°C (rotor MLA-130, Optima Max-XP, Beckman Coulter), the supernatant discarded, and the pellets resuspended in 75μl of 1× PBS per gram of tissue. The resuspended pellets were sonicated with 60 short pulses before final centrifugation for 30 min at 10,000 × g at 4°C. The resulting supernatant, containing the sarkosyl-insoluble tau species, was stored at −80°C for further use.34,35
Total tau quantification by western blot
Each PBS soluble fraction, sarkosyl insoluble fraction were run on a denaturing Western blot to quantify total tau monomer equivalents. The same volume of each sample was diluted in 1× NuPAGE LDS sample buffer (Thermo Fisher) and 1× NuPAGE sample reducing agent (Thermo Fisher), incubated for 5 min at 95°C, and loaded onto a NuPAGE 4%-12% Tris/Bis gel (Thermo Fisher) using NuPAGE MOPS running buffer (Thermo Fisher). Proteins were then transferred onto a nitrocellulose membrane using the iBlot 2 gel transfer device (7 min 30 s at 25 V, Thermo Fisher). Membranes were blocked for 1 h at room temperature (RT) in Intercept blocking buffer (LI-COR, Lincoln, NE), followed by overnight incubation at 4°C with anti-total tau primary antibody (1:5000, D5D8N, Cell Signaling Technology). After a 1-h incubation at RT with donkey anti-rabbit secondary antibody, membranes were visualized using the LI-COR Odyssey CLx system. Recombinant 2N4R human Tau (Tau441, AG960, Millipore, Burlington, MA, United States) was used at serial dilutions ranging from 20 mg/ml to 0 mg/ml to generate a calibration curve and calculate total tau levels in the samples and then normalizing it to the weight of the tissue from which the various preparations were extracted.34,35
Total tau quantification by dot blot
High molecular weight (HMW) tau fractions were run on a dot blot to quantify total tau monomer equivalents, either under native or semi-denaturing conditions. The same volume of each sample was diluted in either PBS or PBS with guanidine 6 M (final guanidine concentration = 3 M), incubated for 30 min at room temperature (RT), and then loaded into a Bio-Dot Apparatus (#1706545, Bio-Rad) containing a nitrocellulose membrane. After a 30-min incubation, vacuum suction was applied to draw the samples through the membrane.
Membranes were blocked for 1 h at RT using Intercept blocking buffer (LI-COR), followed by overnight incubation at 4°C with anti-total tau primary antibody (1:5000, D5D8N, Cell Signaling Technology). After a 1-h incubation at RT with a donkey anti-rabbit or anti-mouse secondary antibody, the membranes were visualized using the LI-COR Odyssey CLx system.
Recombinant 2N4R human Tau (Tau441, AG960, Millipore) at serial dilutions ranging from 0 to 20 mg/ml was used to generate a calibration curve and calculate total tau levels in the samples and then normalizing it to the weight of the tissue from which the various preparations were extracted. 35
In vitro seeding assay
For the in vitro seeding assay, we utilized the well-established FRET-biosensor assay, employing cells that stably expressed the P301S tau repeat domain conjugated to either cyan fluorescent protein (CFP) or yellow fluorescent protein (YFP) (TauRD-P301S-CFP/YFP). Briefly, cells were plated in 96-well plates (Costar), pre-coated with a 1:20 dilution of poly-D-lysine, at a density of 30,000 cells per well. The cells were cultured for 24 h at 37°C with 5% CO2 in Dulbecco's Modified Eagle Medium (DMEM) supplemented with 10% fetal bovine serum (FBS) and 1% penicillin-streptomycin.
PBS-soluble fractions (25 μl/well), sarkosyl-insoluble fractions (1 μl/well), SEC fractions (25 μl/well), or HMW fractions (pooled SEC fractions 7–10; 2.5 μl/well) were mixed with 1% Lipofectamine 2000 (Thermo Fisher) in Opti-MEM (Thermo Fisher) to a final volume of 50 μl/well and incubated for 20 min at RT. The culture DMEM was aspirated, and the mixture containing brain extract was then added to the cells. Each condition was applied in triplicate
After 24 h, the cells were harvested: the culture medium was removed, and 50 μl of 1× trypsin was added to each well for 5 min at 37°C. The trypsinization was stopped by adding 150 μl of fresh medium (DMEM supplemented with 10% FBS and 1% penicillin-streptomycin). Cells were transferred to 96-well U-bottom plates (Corning, Corning, NY, United States), pelleted at 1500 rpm for 10 min, and then resuspended in 2% paraformaldehyde (PFA) in PBS for 20 min at RT. Following this, the cells were pelleted again at 1500 rpm for 10 min, resuspended in 150 μl of PBS per well, and analyzed using the MACSQuant VYB flow cytometer (Miltenyi, Bergisch Gladbach, Germany), following the previously described methodology. 36
For each well, the tau seeding value was calculated by multiplying the percentage of FRET-positive cells by the median fluorescence intensity of the FRET-positive population, a metric referred to as seeding activity—and then normalizing it to the weight of the tissue from which the various preparations were extracted. Each sample was assayed in triplicate.10,34,35,37
Staining with Tau-RD probe
Twelve-micrometer-thick cryosections, were fixed with 4% PFA for 10 min at RT and then washed three times with PBS. The sections were incubated with the Tau-RD probe (myc-297-391 recombinant protein), diluted in PBS at a tau concentration of 10 μg/ml, for 24 h at 4°C. After PBS washes, the sections were incubated with primary antibodies for 24 h at 4°C, followed by another PBS wash. Secondary antibodies and DAPI were applied if necessary. Slides were mounted and scanned using an Olympus VS120-S6-W virtual slide microscope at ×40 magnification. 36
Post-imaging analysis
Fluorescent signals for tau (AT8) and the tau-RD probe (myc) in brain slices were analyzed using QuPath with the pixel classifier module. A control brain and an AD brain were used to train the classifier to distinguish positive from negative signals for each marker. The trained classifier was then applied to the entire analyzable cortical surface of each case. Signal burden was quantified as the area covered, and values were averaged across the full cortical region analyzed. All imaging and quantification were performed blinded to case identity.
Statistical analysis
Statistical analyses were performed using GraphPad Prism software. Non-parametric tests were employed throughout. Data are presented as mean ± standard error of the mean (SEM). Two-tailed Spearman's rank correlation coefficients (Spearman's r) were used to assess correlations between variables obtained from individual participants.
Results
Description of the cohort
The flow chart for cohort selection and the distribution of patients based on their CDR slope are depicted in Figure 1A and 1B. A total of 64 cases fulfilled the inclusion criteria. The 6 cases with a CDR slope above the 90th percentile and the 6 cases below the 10th percentile were defined relative to this internal cohort, and tissue was available for 5 cases in each of these groups. Additionally, 10 cases with a CDR slope between the 25th and 75th percentile were randomly selected to constitute the typical progressor group.
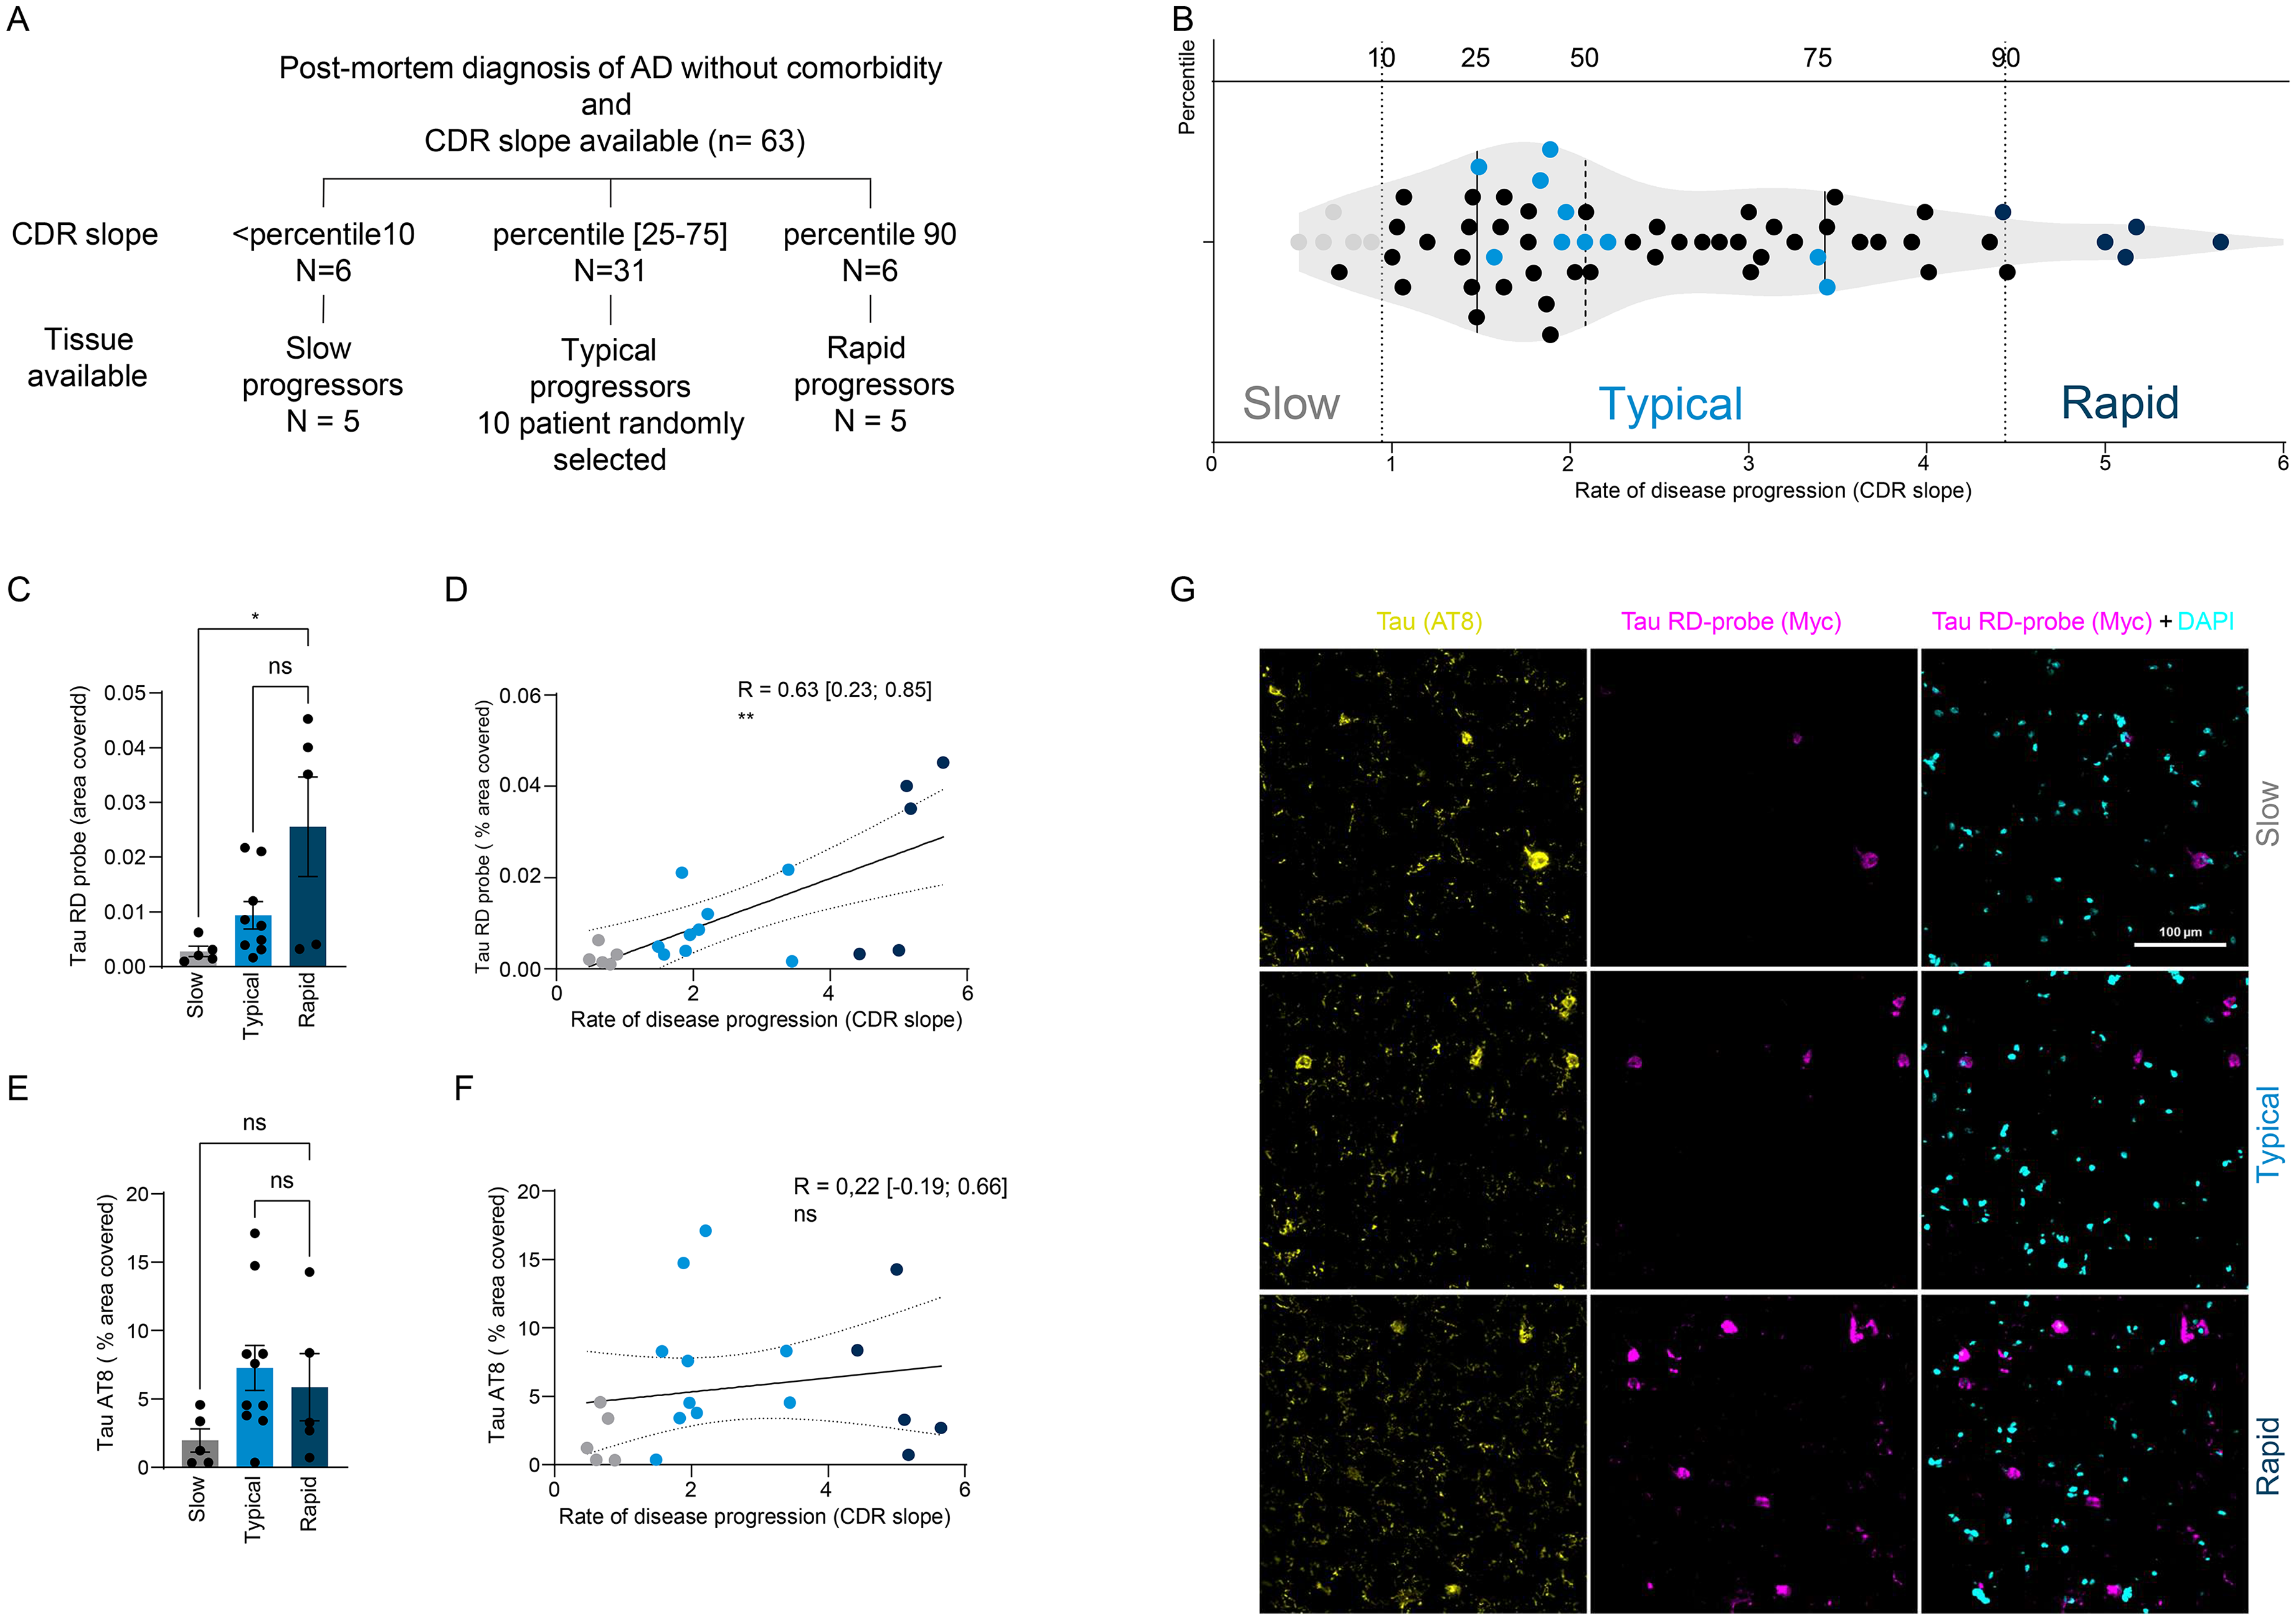
(A) Flow chart illustrating the selection of cases and the formation of the three groups. Cases from the Massachusetts Alzheimer's Disease Research Center Longitudinal Cohort Study with a postmortem diagnosis of Alzheimer's disease (Braak neurofibrillary tangle stage V or VI), without neurological comorbidities other than vascular disease and amyloid angiopathy, and with cognitive assessments based on the CDR-SOB (Clinical Dementia Rating Sum of Boxes) conducted at least three times were included. The rate of disease progression was calculated by applying a linear regression model to the longitudinal CDR-SOB scores. Cases with a CDR slope below the 1st decile were classified as “slow progressors”; 10 randomly selected cases with a CDR slope between the 2nd and 3rd quartiles were designated as “typical progressors”; and cases with a CDR slope above the 9th decile were classified as “rapid progressors.”(B) Violin chart showing the distribution of cases by rate of disease progression, highlighting the selected cases. (C-G) Cryosections of Brodmann area 8/9 were co-stained with a ptau antibody and the Tau RD probe, and the signal was quantified for each case. (C, D) The area covered by the Tau RD probe was higher in rapid progressors compared to slow progressors (rapid versus slow, p = 0.016; rapid versus typical, p = 0.61) and was positively correlated with the rate of disease progression (R = 0.63 [0.23; 0.85], p = 0.004). (E, F) No significant differences were observed between groups for pTau immunostaining (rapid versus slow, p = 0.44; rapid versus typical, p = 0.88), nor was there a significant correlation with the rate of disease progression (R = 0.22 [-0.19; 0.66], p = 0.22). (G) Representative screenshots of virtual slides showing staining with the pTau antibody, Tau RD probe and DAPI. Kruskall-wallis test with multiple comparisons and Bonferroni corrected alpha value *p < 0.05; **p < 0.01. Two-tailed Spearman's rank non-parametric correlation test was used, and r are indicated on the plots. *p < 0.05; **p < 0.01.
Demographic and clinical data, including gender, race, education level, ApoE status, age of onset, age of death, disease duration, CDR slope, Thal score, ADNC score, and NFT Braak score, are summarized in Table 1 and Supplemental Table 1. The age of onset was not significantly lower in the rapidly progressive group compared to the slow progressive group (64.8 ± 6.2 versus 81.8 ± 7.2; p = 0.06) but it was lower in the typical progressive group compared to the slow progressive group (64.6 ± 10.1 versus 81.8 ± 7.2; p = 0.014). The age at death was significantly lower in the rapidly progressive group compared to the slow progressive group (73.4 ± 8.1 versus 91.2 ± 5.6; p = 0.018) and it was lower in the typical progressive group compared to the slow progressive group (73.4 ± 8.1 versus 91.2 ± 5.6; p = 0.032). The disease duration did not differ significantly between the groups. As a validation of the cohort, we also confirmed that the CDR slope was markedly higher in the rapid progressors (5.1 ± 0.44 versus 0.69 ± 0.15; p = 0.0002) and, the number of MMSE points lost per year was significantly higher in the rapidly progressive group compared to the slow progressive group (−8.7 ± 6.1 versus −0.77 ± 1.8; p = 0.029). However, no significant differences were observed in the Thal score, ADNC score, or NFT Braak score between the two groups.
Tau seeding activity is correlated with the rate of disease progression
Previous studies10,11 have shown that the aggressiveness of AD correlates with tau seeding activity. To further investigate this, we employed a method developed in our laboratory to quantify in-situ tau seeding capacity, which enables the staining of tau seeds directly in tissue samples. 36 This method is based on the recruitment of a fluorescent TauRD probe by endogenous tau seeds, mimicking the prion-like process of protein aggregation. The fluorescence signal, reflecting the extent of probe recruitment, is then quantified using fluorescence microscopy, thereby providing a direct measure of tau seeding activity in-situ. Tau seeding capacity, assessed by the in-situ seeding assay, was significantly higher in rapid progressors compared to slow progressors (0.026 ± 0.0091 versus 0.0028 ± 0.00095; p = 0.017) (Figure 1C) and showed a positive correlation with CDR slope (R = 0.63, 95% CI [0.23–0.85]; p = 0.004) (Figure 1D). However, no statistically significant difference was observed for AT8-positive immunohistochemistry between the rapid and slow groups (5.87 ± 2.4 versus 1.98 ± 0.85; p = 0.44) (Figure 1E), and pTau was not correlated with the CDR slope (R = 0.22 [-0.19; 0.66], p = 0.22) (Figure 1F). Staining is illustrated in Figure 1G.
Tau seeding capacity is correlated with in vitro tau seeding capacity in PBS soluble proteins fraction but not sarkosyl-insoluble proteins fraction
To better understand the differences in tau seeding capacity between the two groups, we investigated the seeding activity of PBS-soluble and sarkosyl-insoluble tau fractions. Previously, we demonstrated that both fractions exhibit seeding capacity but spread differently in mouse models. 34 However, there is no evidence to suggest that one type of seed is more toxic than the other in the human brain. This analysis aimed to determine whether these tau fractions corelate differently to disease progression in rapidly versus slowly progressive cases.
After extracting PBS soluble proteins and sarkosyl insoluble proteins from frontal cortex (BA 8) we measured tau seeding activity capacity in-vitro and tau concentration using western blot (Figure 2A). Tau seeding capacity in the PBS-soluble fraction was significantly higher in rapid progressors than in slow progressors (557.3 ± 126.3 versus 102.6 ± 53.8; p = 0.015) (Figure 2B) and positively correlated with the CDR slope (r = 0.64 [0.27; 0.85]; p = 0.0023) (Figure 2C). Conversely, although there was quantitatively more sarkosyl insoluble tau in the rapid group, this did not achieve statistical significance, and no statistically significant difference in seeding capacity was observed for the sarkosyl-insoluble fraction between the rapid group and the slow group (122.2 ± 28.5 versus 55.4 ± 27.0; p = 0.15) (Figure 2E), nor was there any correlation with the CDR slope (R = 0.30 [-0.17; 0.67], p = 0.18) (Figure 2F). Total tau concentrations were not different between the groups (Figure 2D, G) and were not correlated with the CDR slope for either fraction (data not shown).
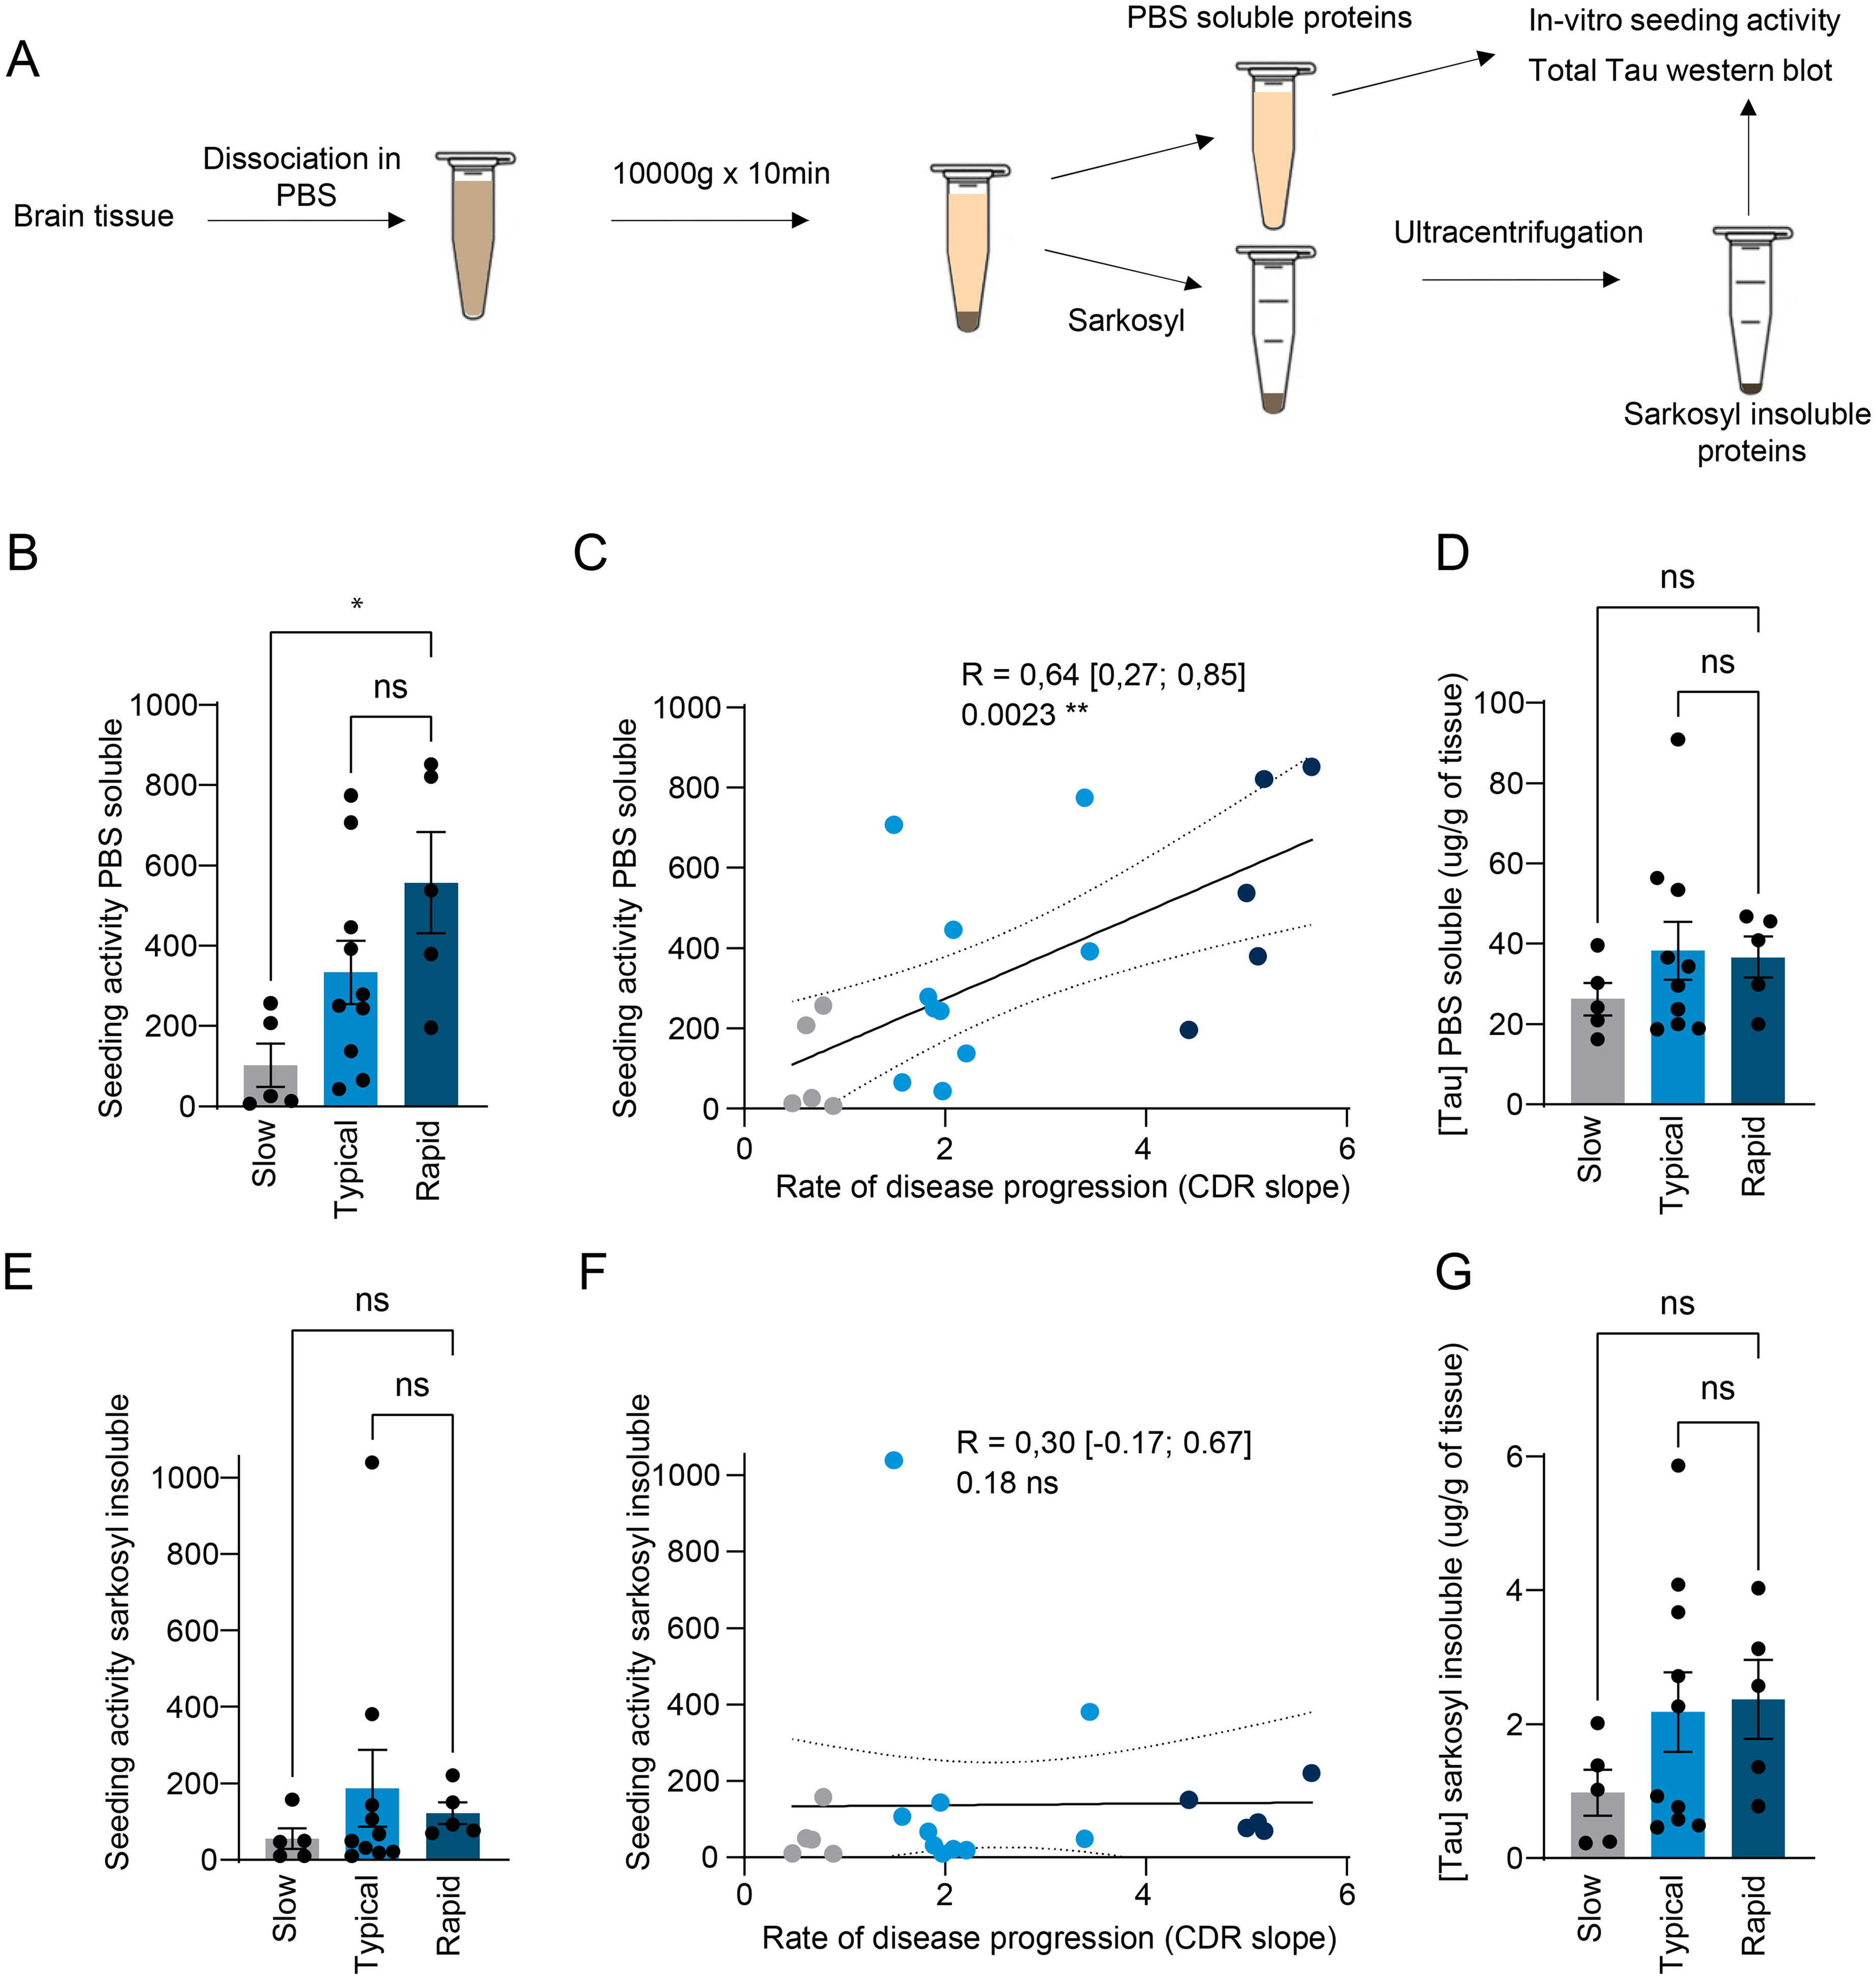
(A) Schematic of the experimental design: tissue was homogenized in PBS and centrifuged. The supernatant contained PBS-soluble proteins, while the pellet was used to extract Sarkosyl-insoluble proteins. Total tau concentration was measured by Western blot under denaturing conditions, and tau seeding activity was assessed in vitro. (B-D) PBS soluble fraction: The seeding activity was higher in rapid progressors compared to slow progressors and typical progressors (rapid versus slow, p = 0.015; rapid versus typical, p = 0.43) and was positively correlated with the rate of disease progression (R = 0.64 [0.27; 0.85], p = 0.0023). No significant differences were observed between groups for tau concentration (rapid versus slow, p = 0.48; rapid versus typical, p > 0.99). (E-G) Sarkosyl-insoluble fraction: No significant differences were observed between groups for seeding activity (rapid versus slow, p = 0.16; rapid versus typical, p = 0.51)), nor was there a significant correlation with the rate of disease progression (R = 0.30 [-0.17; 0.67], p = 0.18). No significant differences were observed between groups for tau concentration (rapid versus slow, p = 0.21; rapid versus typical, p > 0.99). In-vitro seeding assay were performed in triplicate, and each experiment was repeated three times. Kruskall-wallis test with multiple comparisons and Bonferroni corrected alpha value *p < 0.05; **p < 0.01. Two-tailed Spearman's rank non-parametric correlation test was used, and r are indicated on the plots. *p < 0.05; **p < 0.01.
Tau seeds are present primarily in the oligomeric fraction as isolated on size exclusion chromatography
The PBS soluble fraction contains tau molecules of various sizes as illustrated in the native page in Supplemental Figure 1B. Previous studies have demonstrated that most of the seeds in the PBS-soluble fraction consist of oligomeric tau. However, it remains unclear whether the difference in disease aggressiveness was primarily due to oligomeric tau, monomeric tau or truncated tau, and, if the seed size distribution varied with disease severity. To investigate this, we fractionated the PBS-soluble proteins using size exclusion chromatography and measured the tau seeding capacity of each fraction in vitro (Figure 3A).
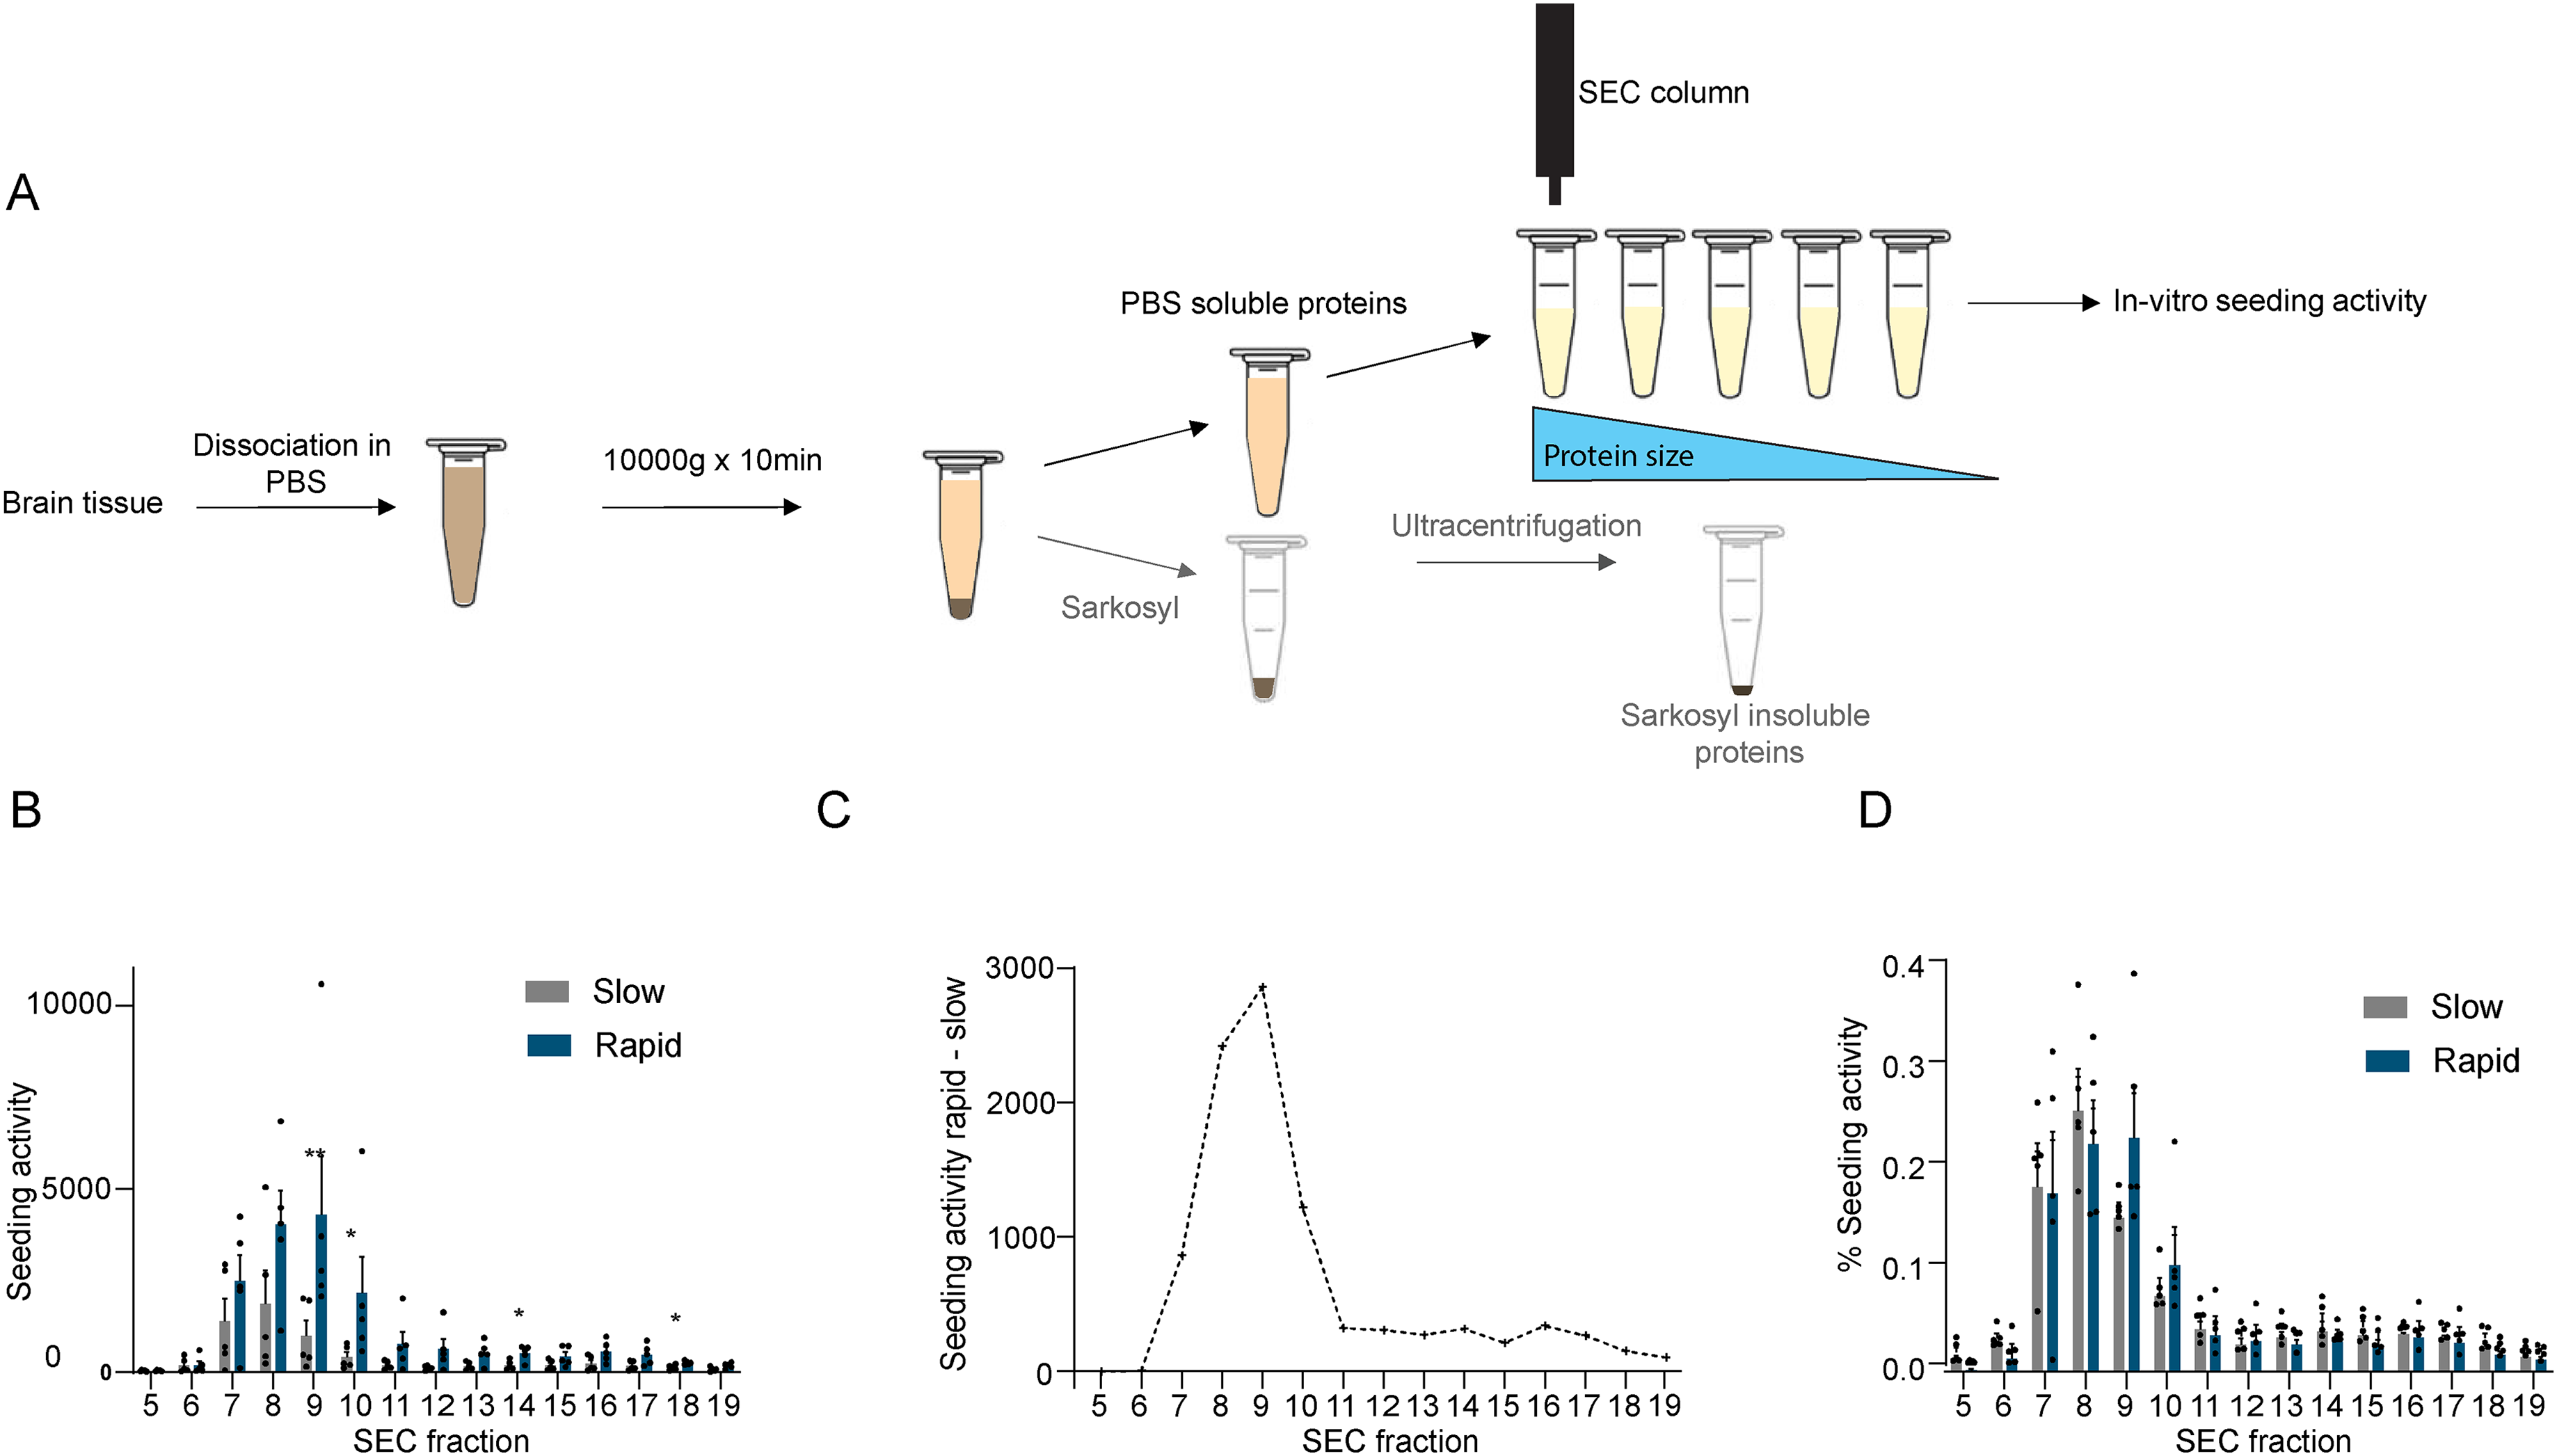
(A) Schematic of the experimental design: tissue was homogenized in PBS and centrifuged. The supernatant, containing PBS-soluble proteins, was fractionated using size exclusion chromatography (SEC). Tau seeding activity was assessed in each fraction in vitro. (B) Tau seeding activity was significantly higher in the rapid progressor group compared to the slow progressor group in fractions 9 (p = 0.0079), 10 (p = 0.032), 14 (p = 0.032), and 18 (p = 0.032). (C) The difference in Tau seeding activity between the rapid and slow progressor groups was calculated for each SEC fraction, with the largest differences observed in fractions 7 to 10. (D) The percentage of seeding activity was calculated for each case and fraction using the following formula:
Our results revealed that tau seeding capacity was highest in the fractions containing oligomers. While not statistically significant for all fractions, tau seeding activity was consistently higher in the rapid progressors across all fractions (Figure 3B). Notably, the highest difference in seeding activity between the groups was observed in fractions 7 to 10, which contain oligomers (Figure 3C). Then, to study the size distribution of seeds for each case, we calculated the percentage of seeds in each fraction for each patient. The percentage of seeding activity was calculated for each case and fraction using the following formula: %Seeding Activity = (tau seeding activity fraction Y for patient X) / (Σ Tau seeding activity fractions 5–19 for patient X). This analysis showed that the relative distribution of seeds across fractions was not different between the two groups (Figure 3D), with the ratio of seeding capacity being approximately three times higher in the rapid progressors than the slow progressors (Supplemental Figure 1C).
We next sought to understand why tau seeding activity was higher in rapid progressors. One hypothesis was that the seed concentration was higher in these individuals. Alternatively, but not necessarily exclusively, the relative seeding capacity per tau molecule might be greater.
To examine these possibilities, we pooled for each patient the fractions with the highest seeding activity (fractions 7–10, containing HMW proteins, including tau oligomers) due to insufficient sample volumes for measuring tau concentration in each fraction individually (Figure 4A).
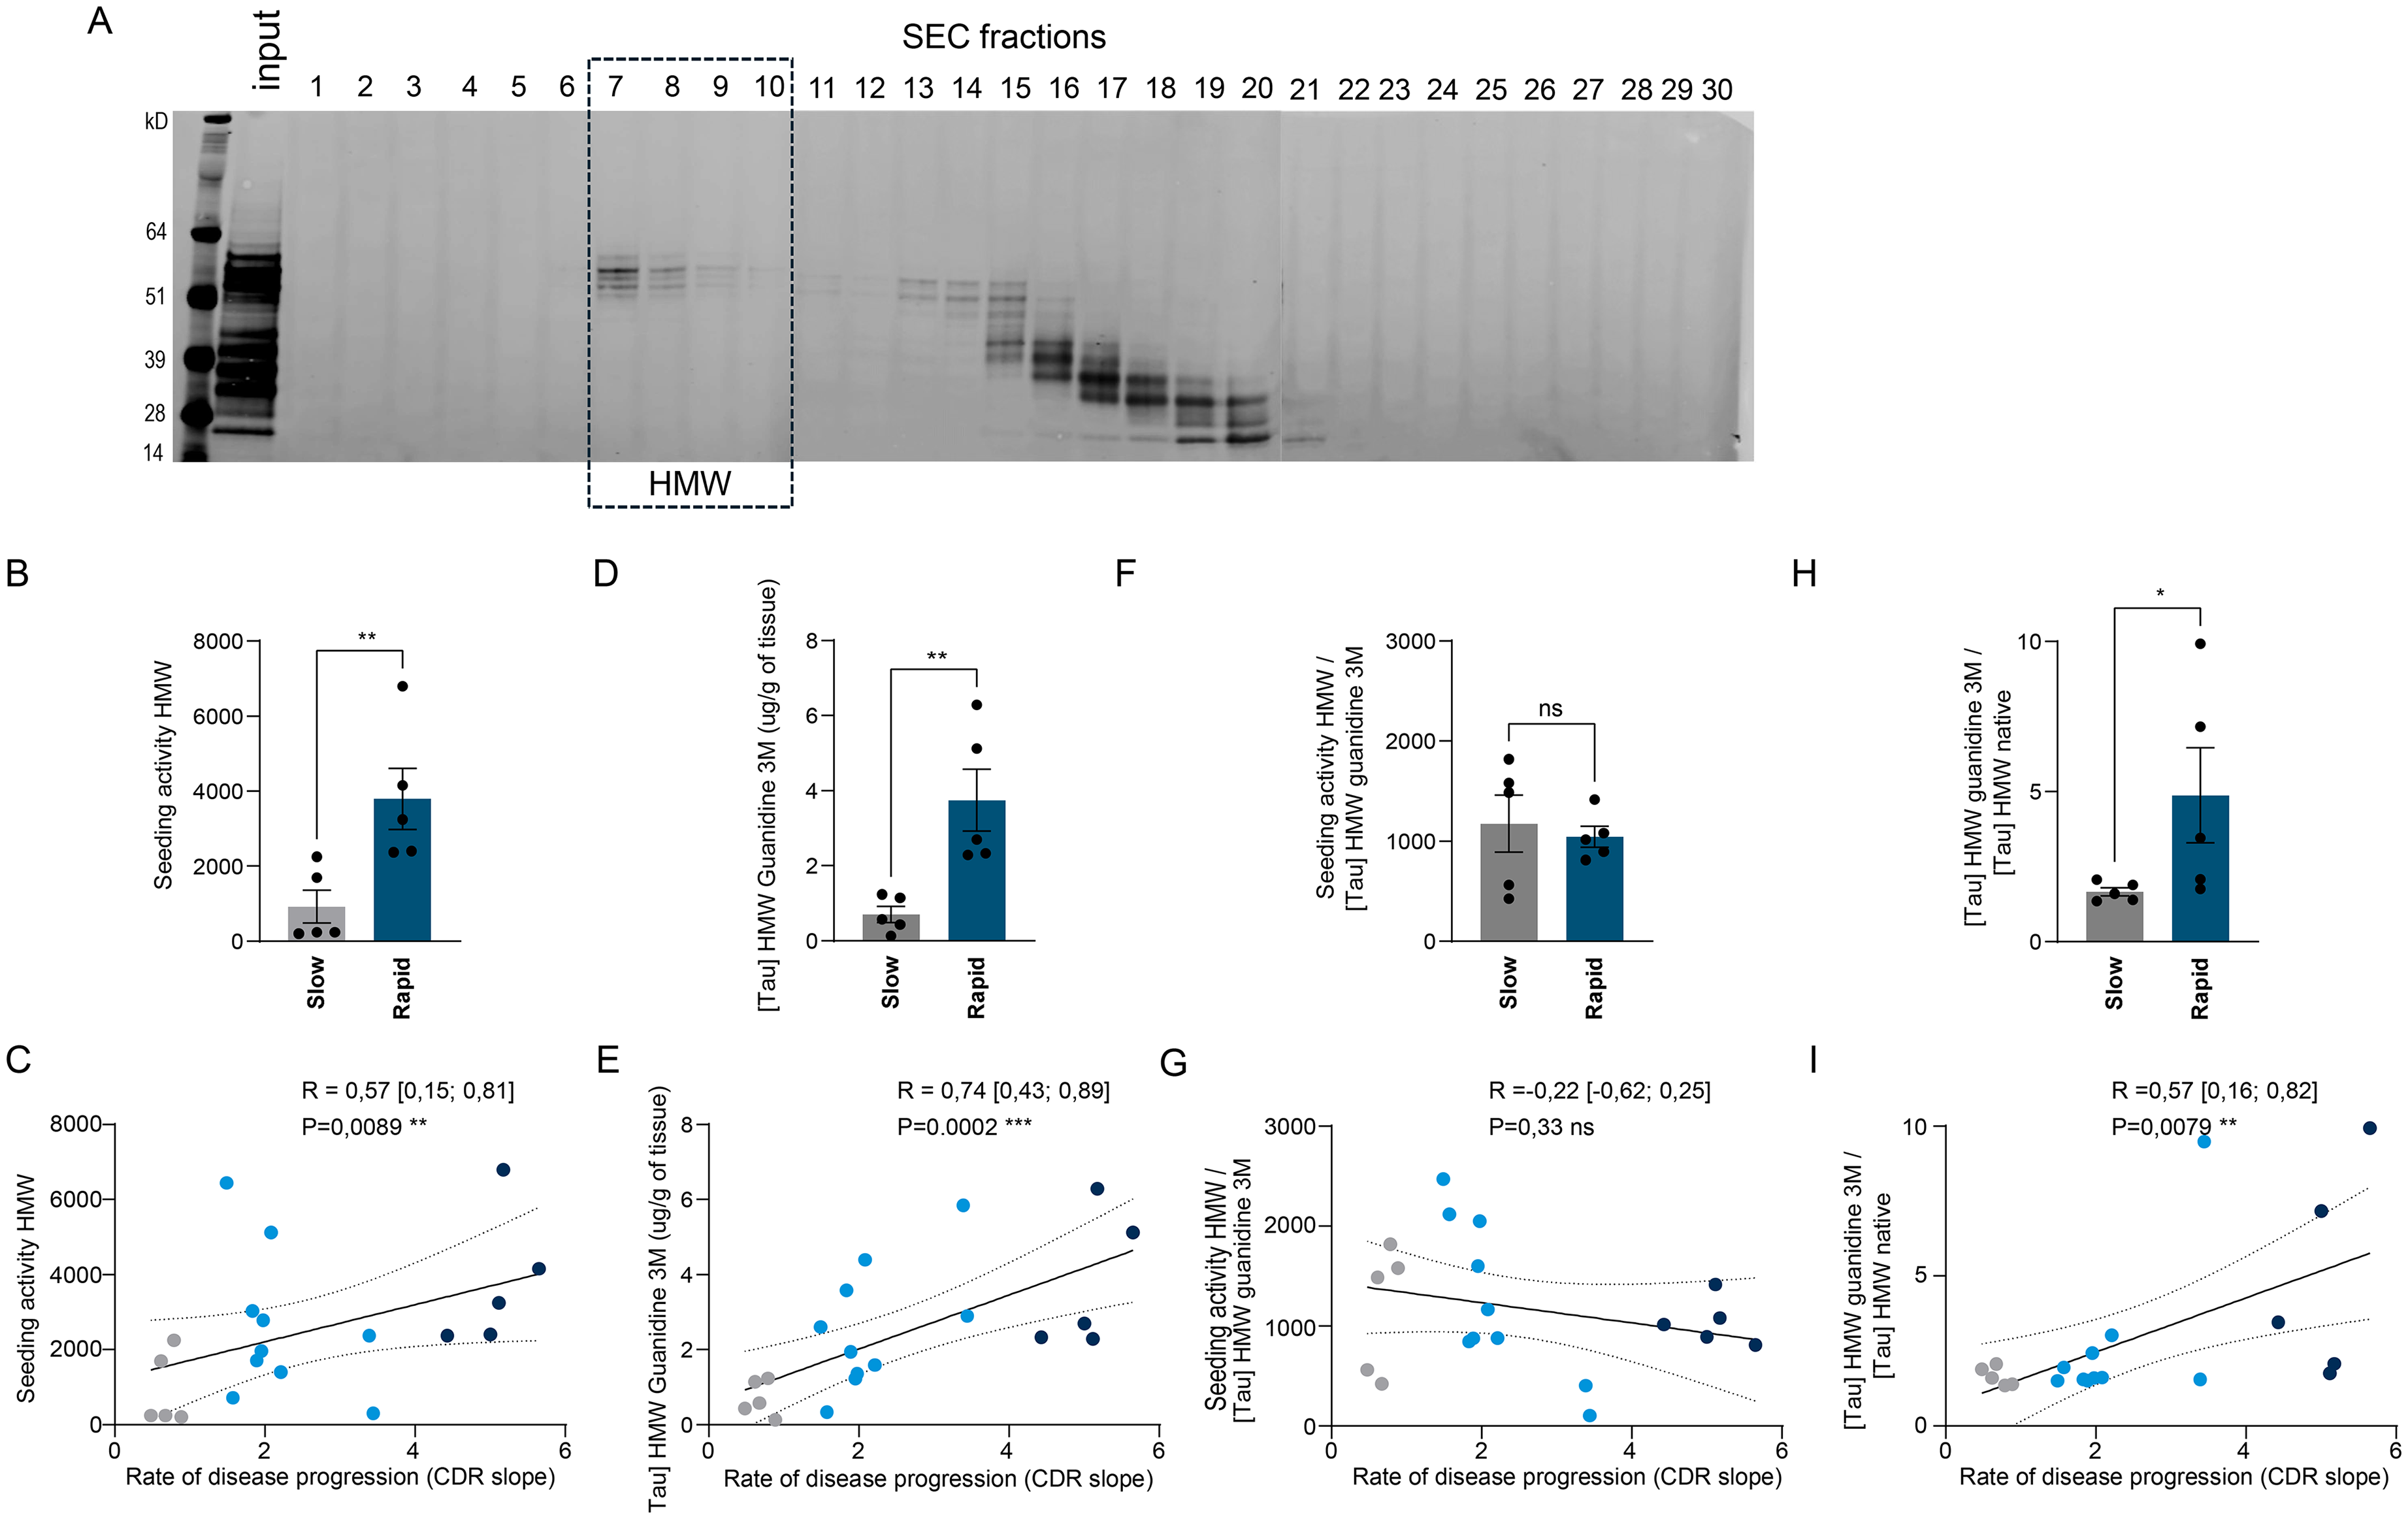
(A) Western blot of SEC fractions under denaturing conditions, probed with a tau antibody (D5D8N clone) to detect tau protein levels across the fractions. Bands correspond to monomeric tau species, including full-length and truncated isoforms, all of which may carry post-translational modifications. The high-molecular-weight (HMW) fraction corresponds to pooled fractions 7–10. (B-I) SEC fractions 7 to 10 were pooled to measure total tau concentration under native and semi-denaturing conditions using dot blot, and tau seeding activity was assessed in vitro. (B, C) Tau seeding activity (measured in-vitro) was higher in rapid progressors (p = 0.0079) and positively correlated with the CDR slope (R = 0.57 [0.15; 0.81], p = 0.0089). (D, E) Tau concentration was significantly higher in rapid progressors under semi-denaturing conditions (p = 0.0079) and positively correlated with the CDR slope (R = 0.74 [0.43; 0.89], p = 0.0002). (F, G) The relative seeding activity per seed (seeding activity HMW/[Tau] HMW guanidine 3 M) was not significantly different (p = 0.69) and did not correlate with the CDR slope (R = -0.22 [-0.62; 0.25], p = 0.33). (H, I) The ratio of [Tau] HMW guanidine 3 M to [Tau] HMW native was significantly different between the two groups (p = 0.031) and was positively correlated with the CDR Slope (R = 0.57 [0.16; 0.82], p = 0.0079). In-vitro seeding assay were performed in triplicate, and each experiment was repeated three times. Two-tailed Mann-Whitney test: *p < 0.05; **p < 0.01. Two-tailed Spearman's rank non-parametric correlation test was used, and correlation coefficients (r) are indicated on the plots.
First, we confirmed that the seeding capacity of the HMW fraction was significantly higher—nearly fourfold—in rapid progressors compared to slow progressors (3794 ± 818.5 versus 926.6 ± 435.5; p = 0.0079) (Figure 4B). Tau concentration, measured under denaturing conditions, was also significantly higher in the HMW fraction in the rapid progressors by approximately the same degree (3.7 ± 0.82 versus 0.70 ± 0.21; p = 0.0079) (Figure 4D).
However, when we calculate the relative seeding activity (tau seeding activity divided by total tau concentration in denaturing conditions), we did not detect a significant difference between the groups (1043 ± 104.10 versus 1175 ± 284.1; p = 0.69) (Figure 4F). These data suggest that rapid progressors have more seeds, but we are likely underpowered to distinguish whether the increased number of seeds also contain seeds with increased seeding potential. To further examine these issues, we measured tau concentration under native conditions and calculated the ratio of tau concentration measured in denaturing conditions to that measured in native conditions, postulating that conformational differences might lead to discrepancies between the two (as has been demonstrated in prion diseases). The ratio was significantly higher in the HMW fraction in the rapid progressors than the slow progressors (4.9 ± 1.58 versus 1.7 ± 0.14; p = 0.032) (Figure 4H). We speculate that tau seeds in rapid progressors may have a different stable folding conformation compared to those in slow progressors, which could contribute to the higher quantity of seeds and disease progression. These four statistical analyses (Figure 4B, D, F, H) comparing rapid progressors versus slow progressors have been confirmed using a correlation approach, including all three groups of patients (Figure 4C, E, G, I).
Discussion
The wide variability in rates of progression among patients with AD has been broadly attributed to either co-morbid conditions, which are exceedingly common in elderly individuals with AD, or to genetic 38 or socio-economic factors. However, by analogy with prion diseases in which both prion protein and host factors help define the aggressiveness of the clinical disease, we explored the possibility that differences in the activity of tau bioactive seeds might contribute to the rate of progression of the illness. In an initial set of 32 sporadic AD cases, 10 and a subsequent study evaluating tissue from a cohort of individuals from the Columbian kindred with presenilin mutations, 33 we showed that tau present in a soluble fraction of the AD brain had enhanced bioactivity that correlated with the rate of progression of clinical illness measured during life. In addition, Kim et al. 11 studied a group of rapidly progressive AD individuals and found, in a sarkosyl insoluble fraction, evidence for enhanced bioactivity and unique conformers of tau compared to individuals with average rates of progression.
To further explore the factors that mediate tau's potential impact on rate of progression, we selected a distinct (from the first cohort we studied) set of AD patients, selected for having “pure” AD, and for having rapid, average, or slow rates of progression, by analogy to the criteria used in the Kim et al. study. 11 Extending the previous studies, we also directly compared the soluble tau species to the sarkosyl-insoluble, fibrillar preparations from the same cases. We were able to replicate our observation that the soluble, HMW fraction of tau oligomers has increased (roughly 4-fold) bioactivity associated with it in the rapid progressing group. Moreover, the tau in the rapid progressors had some unique biochemical characteristics: it was relatively resistant to denaturing agents, suggesting a stable oligomeric or complex structure. We also developed an in-situ technique to visualize seed competent species in tissue, and again the rapid group had elevated levels of activity in this orthogonal assay. Somewhat surprisingly, while the sarkosyl-insoluble fraction, as expected, also showed seeding activity, which was directionally aligned with increased activity in the rapid group by about 2-fold, we did not detect a statistically significant difference in relative seeding activity among the rapid, average, or slow cohorts. We may have been underpowered to observe what may be a slightly smaller difference in the sarkosyl-insoluble fraction. Nonetheless, the data from the seeding assays, the in-situ detection of conformationally bioactive tau, and the biochemical studies are all consistent with and highlight the possibility that heterogeneity in tau conformers, and structural diversity in tau species, may contribute to clinical heterogeneity in the rate of progression of AD. Our data suggest that there is previously unappreciated heterogeneity in the properties of tau oligomers even within size exclusion chromatography isolated fractions, raising the possibility that further efforts at purification will reveal additional features of importance in determining potential for templated misfolding.
Moreover, it would be highly informative to investigate how the biochemical differences of the tau seeds affect cellular biology, such as toxicity at the cellular or synaptic level. For example, we recently published electrophysiological experiments showing that injection of purified high-molecular-weight tau impairs neuronal bursting. 39 It would be valuable to examine whether seeds extracted from high-progressor versus low-progressor patients produce distinct effects. Identifying which tau species contribute to tau propagation and to clinical aggressiveness is important to guide the development of biomarkers aiming to help predict clinical course. It would have value both in the clinical setting and in the setting of disease-modifying clinical trials trying to alter the course of disease in a population. The tau species identified here confirm our earlier observations that modifications in tau bioactivity in a soluble fraction derived from the human brain correlate with clinical rates of progression. While certainly other factors may also contribute, the current study helps to demonstrate the potential role tau conformers might have in how AD presents clinically.
Supplemental Material
sj-docx-1-alz-10.1177_13872877251400798 - Supplemental material for Seed-competent tau oligomers’ activity correlates with the rate of progression in sporadic Alzheimer's disease patients
Supplemental material, sj-docx-1-alz-10.1177_13872877251400798 for Seed-competent tau oligomers’ activity correlates with the rate of progression in sporadic Alzheimer's disease patients by Romain Perbet, Anne E Wiedmer, Noe Quitot, Harshil Bhavsar, Florian Perrin, Angelica Gaona, Anastasie Mate de Gerando, Theresa Gomez Isla, Matthew P Frosch, Sudeshna Das and Bradley T Hyman in Journal of Alzheimer's Disease
Footnotes
Acknowledgements
The authors have no acknowledgments to report.

Ethical considerations
Tissue was provided by the MADRC with approval from the Mass General Brigham IRB (1999P009556).
Consent to participate
Autopsy tissue from human brains was collected at Massachusetts General Hospital (MGH) with informed consent from patients or their relatives, and approval from local institutional review boards.
Consent for publication
Not applicable.
Author contribution(s)
Funding
The authors disclosed receipt of the following financial support for the research, authorship, and/or publication of this article: Rainwater Foundation, the JPB Foundation, Cure Alzheimer Fund, NIH grant AG073236, Philippe foundation and Fondation Philippe Chatrier.
Common Fund, Philippe Foundation, Cure Alzheimer's Fund, JPB Foundation, Rainwater Charitable Foundation, Fondation Philippe Chatrier, (grant number AG073236).
Declaration of conflicting interests
The authors declared the following potential conflicts of interest with respect to the research, authorship, and/or publication of this article: Dr Hyman owns stock in Novartis; he serves on the SAB of Dewpoint and has an option for stock. He serves on a scientific advisory board or is a consultant for AbbVie,Alexion, Ambagon, Aprinoia Therapeutics, Arvinas, Avrobio, AstraZenica, Biogen, Bioinsights, BMS, Cure Alz Fund, Cell Signaling, Dewpoint, Latus, Merck, Novartis, Pfizer, Sanofi, Sofinnova, Takeda, TD Cowen, Vigil, Violet, Voyager, WaveBreak. His laboratory is supported by research grants from the National Institutes of Health, Cure Alzheimer's Fund, Tau Consortium, and the JPB Foundation – and sponsored research agreement from Abbvie and Sanofi. He has a collaborative project with Biogen and Neurimmune.
Data availability statement
All data are available from the authors upon reasonable request.
Supplemental material
Supplemental material for this article is available online.
References
Supplementary Material
Please find the following supplemental material available below.
For Open Access articles published under a Creative Commons License, all supplemental material carries the same license as the article it is associated with.
For non-Open Access articles published, all supplemental material carries a non-exclusive license, and permission requests for re-use of supplemental material or any part of supplemental material shall be sent directly to the copyright owner as specified in the copyright notice associated with the article.
