



Abstract
Background
Proteostasis dysfunction plays a central role in Alzheimer's disease (AD), where aberrant accumulation of amyloid precursor protein (APP)-derived peptides, including APP-C99 and amyloid-β (Aβ), contributes to neurotoxicity. Previous work with an APP-C99 neuronal cell model revealed impaired proteasome activity, lysosomal dysfunction, and increased autophagic markers LC3 and p62.
Objective
To identify small molecule modulators of proteostasis that reduce Aβ-mediated toxicity and to evaluate their mechanism of action in both cellular and C. elegans models of AD.
Methods
We screened a library of small molecule proteostasis modulators in the APP-C99 cell model to identify compounds that reduce Aβ-mediated cell death. Hits were further analyzed for their effects on APP-C99/Aβ clearance, autophagy, and proteasomal function. Neuroprotective effects were validated in an AD C. elegans model.
Results
The USP14 deubiquitinase inhibitor IU1 increased cell survival by 40%, reduced APP-C99 and Aβ accumulation, restored proteasomal activity, LC3 and p62 levels to control. IU1 also decreased neuronal loss and improved survival and behavior in AD worms. Notably, autophagy activators, including mTOR inhibitors rapamycin, everolimus, and temsirolimus, worsened Aβ toxicity. Conversely, autophagy inhibitors such as Bafilomycin A and chloroquine reduced APP-C99/Aβ accumulation, enhanced proteasomal activity, decreased cell death, and improved neurodegeneration and behavior in the worm model.
Conclusions
This study reveals that, under Aβ-mediated proteostasis dysfunction, autophagy activation exacerbates toxicity, whereas proteasome activation via allosteric inhibition of USP14 using IU1 was neuroprotective. These findings provide evidence to suggest that targeting proteasome stimulation via pharmacological inhibition of USP14 offers a promising therapeutic strategy for AD.
Keywords
Introduction
The most common neurodegenerative diseases are characterized by an accumulation of aggregation-prone amyloid proteins concomitant with a loss of protein homeostasis or “proteostasis”, resulting in the progressive death of neurons. 1 Aβ accumulation is a hallmark pathological feature of AD and is central to cell death and neurodegeneration. 2 Aβ is a 39–43 amino acid long amyloidogenic protein produced by sequential proteolytic cleavage of APP. The initial step, by β-secretase 1 (BACE1) at the APP N-terminus, produces the βAPP fragment (APP-C99), is followed by γ-secretase cleavage at the C-terminus of APP-C99. Evidence is accumulating that other APP fragments, particularly those produced by β-secretase cleavage, also play crucial roles in both neuronal health and in AD.3–7 Proteotoxicity is a key contributor to the development and progression of AD. Therefore, activating the proteostasis pathways to promote the clearance of APP-C99 and Aβ serves as an attractive therapeutic target.8–14 Growing evidence seems to favor a strategy of enhancing the efficacy of the aggregate protein clearance by reversing the impairments of the specific processes that are disrupted.
Cellular proteostasis is primarily maintained by autophagy and the Ubiquitin-proteasome system (UPS), with their impairment being implicated in AD pathogenesis. Accumulating evidence shows that autophagy markers are elevated in AD, whereas UPS or proteasome activity is markedly reduced. 15 In contrast to normal aging, AD brains show excessive accumulation of autophagosomes and lysosomes, commonly referred to as autophagy vesicles (AVs). 16 Whether AV accumulation is due to autophagy dysfunction or excessive autophagy, is still to be determined conclusively.17–19 We previously reported increased accumulation of the autophagosome marker, microtubule-associated protein 1A/1B-light chain 3 (LC3), in cells producing APP-C99 and Aβ. 20 This is similar to pathology observed in postmortem AD brains, indicating disruption in the lysosomal clearance and accumulation of immature AVs. 16 Increased autophagy can also be considered to be a mitigating response to increased protein aggregation in AD.21,22
Autophagy activation has received much attention and compounds that activate this pathway have shown benefits in neurodegenerative disease models.10,11,23 However, other studies caution the potential detrimental effects of its overactivation.24,25 In some neurodegenerative disease models with impaired lysosomal clearance, inducing autophagy has been shown to accelerate pathology, suggesting that the success of any autophagy-based intervention may depend on whether lysosomal clearance is functional. 26 Additionally, the effects of autophagy activation may vary significantly depending on the physiological state of the cell, especially during proteotoxic stress. Studies even suggest that autophagy activation may be harmful in ageing conditions with pre-existing pathology, especially AD.25,27
Decreased proteasome activity has been reported in a broad array of chronic neurodegenerative diseases. 28 Impaired proteasome function has been implicated as a primary cause, or a secondary consequence, in the pathogenesis of many neurodegenerative diseases, including AD, Parkinson's and Huntington's diseases.29–32 However, the majority of sporadic AD is idiopathic in origin and the involvement of the proteasome is less clear. 28 Evidence also suggests that aggregated proteins like APP-C99, Aβ, and tau can interact with and impair proteasome activity.33–39 UPS is also a therapeutic target but has not received much attention because of its limitations in the clearance of large protein aggregates. However recent findings show that the mammalian proteasome holoenzyme possess fibril-fragmenting activity 40 and can target soluble oligomers assembled from ubiquitin-modified proteins. 41
Previously, we used a well-established human central nervous system (CNS) derived cell line, MC65, which generates Aβ by γ-secretase cleavage from a stably transfected C99 fragment of the APP on a tetracycline promoter (Tet-off) system to model AD.20,42–50 Our findings showed increased accumulation of both LC3I and LC3II isoforms in cells producing APP-C99. We also developed a Tet-spiking assay to measure clearance of APP-C99 and Aβ in this model. 20 Here in the present study, we show that the APP-C99/Aβ producing MC65 cells have severely impaired proteasome activity. Wherein increased levels of autophagy protein markers were associated with APP-C99/Aβ accumulation and cell death. We further adapted this cell line as a high throughput assay to screen a library of 156 small molecule proteostasis modulators and identify inhibitors of cell death. Our screening identified IU1, a small-molecule inhibitor of deubiquitinase enzyme USP14 that markedly reduced Aβ toxicity in the AD cell model. IU1 reduced accumulation of APP-C99 and Aβ and build-up of LC3 and p62 and their colocalization while restoring lysosomal and proteasomal activity. Notably, autophagy activators, including mTOR inhibitors rapamycin, everolimus and temsirolimus increased APP-C99/Aβ accumulation and cell death. While in contrast, autophagy-lysosomal inhibitors such as Bafilomycin A (BafA) and chloroquine reduced APP-C99/Aβ accumulation and cell death, while simultaneously enhancing proteasomal activity. For further validation in vivo, this study used a transgenic Caenorhabditis elegans (C. elegans) model of Aβ induced neurodegeneration to evaluate the neuroprotective effects of IU1, BafA and chloroquine. 51 IU1, BafA and chloroquine demonstrated a strong attenuation of Aβ-mediated toxicity and improvement in behavioral defects and survival of the C. elegans model. Overall, this is the first study to report neuroprotective benefits of IU1 in alleviating Aβ mediated proteostasis dysfunction and neurodegeneration in AD.
Methods
Culture and maintenance of MC65
We used the MC65 human CNS derived cell line which generates Aβ by γ-secretase cleavage from the C99 fragment of APP on a Tet-Off tetracycline control promoter. 52 The removal of tetracycline induces APP-C99 expression from the transgene. The MC65 cells were cultured in DMEM/F12 (Thermo Scientific, 11320082) with 10% fetal calf serum (FCS, Thermo Scientific, 10100147), 1 µg/ml tetracycline (Merck, T7660) with 0.2 mg/ml G418 (Merck, G5013) for routine maintenance. 0.4 mg/ml G418 and 1 µg/ml tetracycline was used for selection. Cells were stored in liquid nitrogen in 10% dimethylsulfoxide (DMSO, Merck, D8418) in FCS containing 0.1 µg/ml tetracycline. For experiments, G418 was completely removed, and cells were plated in DMEM/F12 with 10% FCS with or without tetracycline. After three days, the media was replaced with opti-MEM (Thermo Scientific, 22600134), followed by treatments.
Proteasome activity assay
To assess proteasome activity, we used the Proteasome Activity Assay Kit (Abcam, ab107921) which takes advantage of the chymotrypsin-like activity, using an AMC-tagged peptide substrate (Succ-LLVY-AMC). This releases a highly fluorescent AMC (Ex/Em 350/440 nM) in the presence of proteolytic activity. Using the specific proteasome inhibitor, MG132, which suppresses all proteolytic activity due to proteasomes, we differentiated proteasome activity from other protease activity which may be present in samples. All samples and the positive control were assayed with and without proteasome inhibitor. Measurement of the wells which do not contain the proteasome inhibitor MG132, shows total proteolytic activity (RFU) and the wells containing proteasome inhibitor shows non-proteasome activity iRFU. Subtraction of iRFU from RFU represented the total proteasome activity in the cells.
Immunofluorescence
MC65 cells were analyzed by immunofluorescence analysis using a previously described protocol by Ariyath et al. 53 After treatment, MC65 cells were washed 3 times with PBS (Merck, 11666789001), pH 7.4, and fixed with 4% formaldehyde (BioScientific, 18814-20) for 15 min at room temperature. Subsequently, cells were washed again in PBS, pH 7.4, and permeabilized using 0.1% Triton X100 (Bio-Rad, 1610407). The detergent was removed by further PBS washes, then cells were blocked in 1% bovine serum albumin (Merck, A9418). Cells were then incubated overnight at 4˚C with the primary antibody combinations, LC3 (Cell Signalling Technology, 4108, 1:250) and P62 (Cell Signalling Technology, 88588, 1:500). Unbound antibody was removed with 3 washes in PBS, and incubated with the specific secondary antibodies, anti- rabbit IgG (Cell Signalling Technology, 4414, 1:5000) and anti-mouse IgG (Cell Signalling Technology, 4408, 1:5000). Finally, nuclei were stained with 1 µg/ml Hoechst (Cell Signalling Technology, 33342) and imaged under a fluorescence microscope (Nikon Eclipse Ti2).
Western immunoblotting
Cell extracts were analyzed by denaturing sodium dodecyl sulphate- polyacrylamide gel electrophoresis (SDS-PAGE) followed by western immunoblotting analysis as previously described. 10 Total cell protein extracts were used for immunoblotting. Frozen cell pellets were resuspended in 150 µL of cold lysis buffer (0.7% SDS, 0.3% Triton X-100, 1XPBS) with freshly added 1X protease inhibitor cocktail (Roche). Following centrifugation at 18000 x g for 10 min, the supernatant was collected, and protein concentration of each sample was measured using micro bicinchoninic acid (BCA) protein assay kit (Thermo Scientific, 23235). The cell lysates were trichloroacetic acid/acetone precipitated and a total of 20 μg total protein of each sample was loaded and separated by electrophoresis on 4–12% Bis-Tris gels or 4–12% Bolt Gels (Thermo Scientific, NW04125BOX). The proteins were transferred to nitrocellulose membranes using the Biorad semi dry transfer (Bio-Rad 1704270). Membranes were then blocked in 5% skim milk in Tris buffered saline (TBS, 2.4 g Tris [Sigma, T1503] and 8.8 g NaCl [Sigma, S3014] in 900 mL water), pH 7.4 for 1 h. Primary antibodies were diluted in TBST (TBS with 0.5% skim milk 0.05% Tween-20 [Sigma, P7949]). Incubation was performed at room temperature for 1–2 h followed by three washes in TBST. Horseradish peroxidase (HP) conjugated secondary antibodies anti-mouse (GE Healthcare, GENA931, 1:5000) or anti-rabbit (GE Healthcare, GENA934, 1:5000) were diluted in 0.5% skim milk in TBST at concentrations of 1/5000 and incubated with the membranes for 1 h. After washing with TBST and TBS, the membranes were incubated for 2 min with HP reactive ECL (Enhanced chemiluminescence) reagent (Merck, GERPN2106). The membranes were imaged using a Vilber Fusion FX6 imager. The immunoreactive bands were later quantified using Biorad Image lab software (version 6.0). For secreted protein analysis, 400 µl of conditioned media was precipitated with trichloroacetic acid and acetone, followed by denaturing SDS-PAGE and western immunoblotting analysis as described above.
Antibodies
Antibodies used for western blotting analysis were targeted against Aβ (6E10, Covance, SIG-39300), APP-C99 (C1/6.1, Covance, SIG-39152, 1:1000) LC3 (Cell Signalling Technology, 4108, 1:1000) and P62 (Cell Signalling Technology, 88588, 1:1000), cleaved caspase-3 (Cell Signalling Technology, 9661, 1:1000) and GAPDH (Cell Signalling Technology, 5174, 1:1000), Hsp40 (Abcam, ab69402, 1:1000), Hsp90 (Abcam, ab13492), Presenilin (Thermo Scientific MA1-751, 1:1000).
Immunoblot analysis and quantification
For measuring changes in protein levels using densitometric analysis of immunoreactive bands, we followed previously published guidelines for quantification of western blot data. 54 The camera-based imaging method using the Vilber Fusion FX6 (accumulation mode, high-sensitivity) and densitometric analysis using Image Lab software (version 6, Bio-Rad), allowed accurate quantification of relative optical densities for each protein band and to confirm that the western images were not saturated (Supplemental Figure 1). The volume analysis tools of Image Lab were used to select and determine the background-subtracted optical density of the bands in all the blots. The averages of these values were plotted against the actual total protein loaded (µg) to assess the linear dynamic range. This linear range of detection was comparable to previously published guidelines 54 and showed that band optical intensity is directly proportional to target abundance, within the protein concentrations tested. Since multiple antibodies were used to measure changes in levels of each respective target protein in the lysates, we used a uniform protein load (20 µg total protein of cell lysate per well) across all western blot experiments, with a standardized exposure limit for each antibody. The exposure times are as follows: GAPDH (1 min), 6E10 (37.5 min), C1/6.1 (10 min), LC3 (25 min) and p62 (25 min). All densitometric data was represented as a relative percent of the control value.
Cell viability analysis
Cell viability of MC65 cells expressing APP-C99 and Aβ was assessed as described previously. 55 Cells were seeded in 96-well plates, at a density of 20,000 cells per well and incubated for 48 h in a 5% CO2/95% air humidified incubator at 37°C. Prior to treating the cells, the culture media was exchanged with fresh treatment media containing Opti-MEM supplemented with 1X Glutamax (Thermo Scientific, 35050061) with or without tetracycline. Subsequently, cells were incubated with test compounds at different concentrations for 3 days and then analyzed by 3-(4,5-dimethylthiazol-2-yl)-5-(3-carboxymethoxyphenyl)-2-(4-sulfophenyl)-2H-tetrazolium (MTS) assay (Abcam, ab197010) to assess the cell viability. MTS (%viability) assays were performed according to the manufacturers protocol (Abcam). The MTS assay provides sensitive colorimetric quantification of viable cells in proliferation and cytotoxicity experiments.
LysoTracker staining: MC65 cells
Cells were seeded onto 96-well plates at a density of 20,000 cells per well and incubated for 48 h in a humidified incubator at 37°C with 5% CO2. Prior to treatment, the medium was changed with fresh Opti-MEM enriched with 1X Glutamax, with or without tetracycline, subsequently followed by the introduction of test compounds at varying doses. Following three days of treatment, cells were stained with LysoTracker (Thermo Scientific, L12492) by diluting a 1 mM stock solution to a final concentration of 50 nM in prewarmed growth media. The existing media was removed, and a LysoTracker containing media was introduced, allowing the cells to incubate for 30 min to 2 h to label lysosomes. To reduce artefacts, dye concentration was maintained at a minimal level. Subsequent to staining, the medium was substituted with new media, and the cells were examined using a fluorescence microscope.
Drug screening analysis
A characterized library of 156 small molecule autophagy modulators (Selleck Chemicals) (Supplemental Table 1) was screened to identify inhibitors of Aβ toxicity using the MC65 cells producing APP-C99/Aβ. The chemical library included molecules targeting a wide range of pathways such as proteasomes, hypoxia-inducing factor, histone deacetylases, aurora kinase, sirtuin, E3 ligase and calcium channels. Each compound was tested in triplicate in control cells (+Tet) and APP-C99/Aβ producing cells (-Tet). The entire screening process was conducted twice in triplicate. Concentrations of each compound based on EC50 were provided by the supplier. To identify inhibitors of APP-C99/Aβ induced neurotoxicity, cells were treated with the compounds for 3 days followed by evaluation of cell death using the MTS assay.
Tet-spiking assay
Clearance of APP-C99 and Aβ was assessed in MC65 cells, a human derived cell line that produces Aβ through switchable expression of the amyloid precursor protein APP fragment C99. MC65 cells were grown without tetracycline for three days to activate APPC99 and Aβ production, followed by spiking with tetracycline to block APP-C99/Aβ production. After spiking with tetracycline (1 μg/mL), cell lysates were collected at 6 and 24 h to measure levels of Aβ and APP-C99 by western immunoblotting analysis.
C. elegans strains
The C. elegans DA1240 and UA198 strain used in this study was generously provided by Laura A. Berkowitz, Ph.D, Lab manager from Caldwell Laboratory, University of Alabama.
Nematode growth media preparation
Nematode growth medium (NGM) plates supplemented with E. coli strain OP50 were employed for the growth of C. elegans. NGM was prepared by mixing 3 g of NaCl, 17 g of agar (Thermo Scientific, 22700025), and 2.5 g of peptone (MP Biomedicals, 0210480801) in 975 ml of distilled water in a 2-liter Erle nMeyer flask. The flask was wrapped in aluminum foil and autoclaved. Following autoclaving, the medium was cooled to 55°C in a water bath for 15 min. Subsequently, 0.3 ml of 1 M CaCl2 (DKSH Australia Pty Ltd, VWRC27810.295), 0.3 ml of 5 mg/ml cholesterol (dissolved in ethanol, [Sigma, C8667]), 0.3 ml of 1 M MgSO4 (Sigma, M2643), and 7.5 ml of 1 M KPO4 buffer (16.282 g of K2HPO4 [Sigma, P3786], 0.888 g of KH2PO4 [Sigma, PHR1330]) were added to the flask and gently mixed to ensure uniformity. The NGM medium for behavioral assay plates was supplemented with 100 µl of fluorodeoxyuridine (FUDR, Sigma, F0503). The medium was thereafter dispensed into petri dishes using a peristaltic pump or manually, ensuring uniform distribution. Plates were filled to approximately two-thirds capacity and kept at room temperature for 2–3 days to promote the evaporation of moisture and to evaluate any contamination. Following the preparation of the plates, E. coli OP50 was cultured in suspension, and one volume of the bacterial culture was mixed with twenty-four volumes of NGM liquid before inoculating the plates. Adult C. elegans (four to five animals) were transferred to OP50-seeded NGM plates for routine maintenance.
Preparation of E. coli OP50 for C. elegans cultures
A revised technique derived from Byerly et al. was employed to prepare E. coli OP50 as the bacterial feeding for C. elegans. 56 A starter culture of E. coli OP50 was graciously supplied by Laura A. Berkowitz, PhD, Caldwell Laboratory, University of Alabama. The culture was inoculated onto LB agar plates (10 g Bacto-tryptone [Sigma, T9410], 5 g Bacto-yeast [BD Bioscience, 212730], 5 g NaCl, 15 g agar, pH 7.5, with H2O to 1 liter) to isolate individual colonies. Additionally, a solitary colony from the streak plate was aseptically inoculated into LB broth (10 g Bacto-tryptone, 5 g Bacto-yeast, 5 g NaCl, pH 7.0, with H2O to 1 liter) and cultured overnight at 37°C. The broth was previously autoclaved in 500 ml screw-cap bottles, which can be maintained at ambient temperature for several months. The overnight E. coli OP50 culture was subsequently utilized to inoculate NGM plates for nematode maintenance. The OP50 streak plates and liquid cultures were preserved at 4°C and remained viable for several months.
Maintenance of C. elegans
C. elegans were cultured on NGM plates inoculated with E. coli OP50. Employing sterile procedure, 0.1 ml of an overnight E. coli OP50 culture was inoculated into small or medium NGM plates, whereas 0.4 ml was utilized for large NGM plates. Precautions were taken to prevent the spreading of the OP50 culture towards the peripheries of the plates, as this could cause worms to migrate to the plate edges, potentially resulting in worm death. The plates were incubated overnight at ambient temperature to facilitate the growth of the OP50 lawn. The plates may be subsequently cooled to room temperature prior to the introduction of worms.
Pharmacological treatments of C. elegans
Pharmacological compounds IU1 (100 µM, Sigma, I1911), chloroquine (100 µM, Sigma, C6628), Bafilomycin A1 (100 µM, Millennium Sciences, MCE-HY-100558), and thapsigargin (1 µM, Millennium Sciences, MCE-HY-13433) was dissolved in dimethyl sulfoxide (DMSO) and added to NGM plates. All the compounds were supplemented on the surface of OP50 layer. C. elegans were allowed to grow on OP50 seeded NGM plates supplemented with pharmacological active compounds for 3 days. On the 3rd day L4 worms are transferred onto OP50 seeded FUDR plates supplemented with pharmacological compounds on its surface and further used for experiments. The FUDR plates were changed depending on the condition of the plates based on different experimental conditions.
Neurodegeneration assay
C. elegans strains were cultivated on NGM plates inoculated with E. coli OP50 at 20°C to examine Aβ expression in the glutamatergic tails. Plates were prepared according to the general maintenance protocol, and the synchronized population of L4 worms was transferred on the third day of hatching to plates containing fluorodeoxyuridine (FUDR, 100 μM) to inhibit progeny production during the assay while preserving the degenerative phenotype. The plates were replaced on alternate days. Glutamatergic tail neurons producing Aβ were analyzed by immobilizing the hermaphrodites on the seventh day of maturity using 3 mM levamisole (Sigma, L0380000). The worms were affixed to glass coverslips and meticulously relocated onto 2% agarose pads on microscope slides for examination. Each group of animals was replicated about three times, with a minimum of 20 worms (n = 60). The worms were subsequently examined under the microscope and assessed for all five normal fluorescent tail neurons, which exhibited no abnormalities.
C. elegans life span assay
Lifespan experiments were conducted utilizing a modified procedure from Hsin and Kenyon, 1999. 57 Plates were made according to the standard maintenance routine, and a synchronized batch of 60 L4 worms across 3 distinct groups was analyzed. On the third day post-hatching, worms were transferred to plates containing 100 μM FUDR to suppress progeny production at 20°C. The plates were replaced every three days until the tenth day of adulthood. Plates were observed for food and replaced if required. The animals were evaluated based on their locomotory reaction to tapping in the tail region, responsiveness to tactile stimulation with a platinum loop. The animals were deemed dead if they exhibited no reaction to the tactile stimuli. The plates were kept at 20°C until the experiments were concluded. The results were examined utilizing GraphPad Prism and statistical tools.
Mechanosensation assay
The sensitivity of C. elegans hermaphrodites to gentle touch was tested by softly stroking the anterior and posterior regions of the worms using an eyelash hair attached to a Pasteur pipette or a pipette tip. Each worm was softly stroked on the head and then on the tail, just below the anus, to evaluate backwards movement. If the worm started moving forward or stopped going backwards, it was considered a favorable reaction to mild touch sensitivity. Out of the 3 tests that each animal underwent, the number of positive reactions to anterior and posterior contact was noted. A total of 20 worms per strain were evaluated for each biological replicate, and the average reaction rate for the whole population was used to determine the percentage of posterior touch response. Sixty worms (n = 60 worms) were used in this experiment, which was conducted three times. The results show the average of the three biological replicates.
Drop test
C. elegans worms were moved on the seventh day to a non-OP50 seeded NGM plate to acclimatize for 1–2 min onto the NGM plate using an eyelash hair affixed to a Pasteur pipette or a pipette tip. A 50% glycerol solution (1:1 glycerol to distilled water, Merck, G5516) was used at room temperature. Individual worms were gently moved. A droplet of glycerol was placed on the worms’ route near to its head region, and the response was documented when the worm's head made contact with the droplet. A quick change in direction within 4 s was recorded as a favorable response. Each biological replication consisted of 20 worms per strain, and the average reaction rate of the whole population was used to calculate the percentage response. Sixty worms (n = 60 worms) were used in this experiment, which was performed thrice. The data are the mean of the three biological replicates.
LysoTracker staining: C. elegans
After a 7-day treatment with pharmacological compounds, C. elegans were subjected to LysoTracker staining. Approximately 40 adult worms were incubated in 100 µL of Hank's Balanced Salt Solution (HBSS) or M9 buffer (Thermo Scientific, 14175103) containing 50 µM LysoTracker, specifically targeting the tail region. The staining process was carried out for one h at 20°C in the dark to prevent photo bleaching. Following staining, the worms were transferred onto NGM plates seeded with fresh E. coli OP50 and allowed to recover for one h at 20°C in darkness. Fluorescence microscopy was then used to analyze the stained worms.
Amytracker staining
Live-cell detection of intracellular Aβ aggregates was performed using Amytracker™ 680 (Ebba Biotech, A680-A-100), a luminescent conjugated oligothiophene dye with high specificity for β-sheet-rich amyloid structures. After a 7-day treatment with pharmacological compounds, C. elegans worms were subjected to Amytracker 680 staining. The worms were incubated for 1 h in Amytracker solution and subsequently allowed to recover in NGM agar for 1 h. Fluorescence microscopy was performed using a Nikon Eclipse Ti2 fluorescence microscope to visualize Aβ accumulation. Unstained worms were used as controls.
Statistical analysis
Data were evaluated with GraphPad Prism using unpaired T-tests. Values represent mean ± SD.
Results
APP-C99/Aβ producing cells exhibit autophagy dysfunction and impaired proteasomal activity
Autophagy and proteasomes show distinct functional impairment in AD. 58 Animal models and post-mortem studies of AD brain tissues show an activation of autophagy, while proteasome activity is inhibited. We previously reported increased accumulation of the autophagosome marker LC3 in cells producing APP-C99 and Aβ, which is notably similar to pathology observed in postmortem AD brains-indicating disruption in the lysosomal clearance of autophagosomes.16,21,25,26,59 In the current report, we investigated both autophagy and proteasome activity using the APP-C99/Aβ producing cell model to determine whether impairment in these pathways is associated with increased APP-C99 and Aβ accumulation and cell death. We first measured the expression levels of APP-C99 and Aβ oligomer using western immunoblotting of cell extracts at 6 h and 24 h following induction by removal of tetracycline (-Tet, Figure 1A). Based on the migration in SDS-PAGE, expression of Aβ oligomers was observed from 6 h of induction (Figure 1A). We also noticed, the lowest-molecular weight Aβ species (∼4 kDa) was detectable only at the earliest time points following induction, consistent with rapid oligomerization of monomeric Aβ. As shown in our data, higher, order Aβ species were far more prominent, indicating that oligomers form quickly and remain the predominant species (Supplemental Figure 1). We also checked this finding was similar to the previous reports of Aβ expression in the MC65 cell model.42,60,61
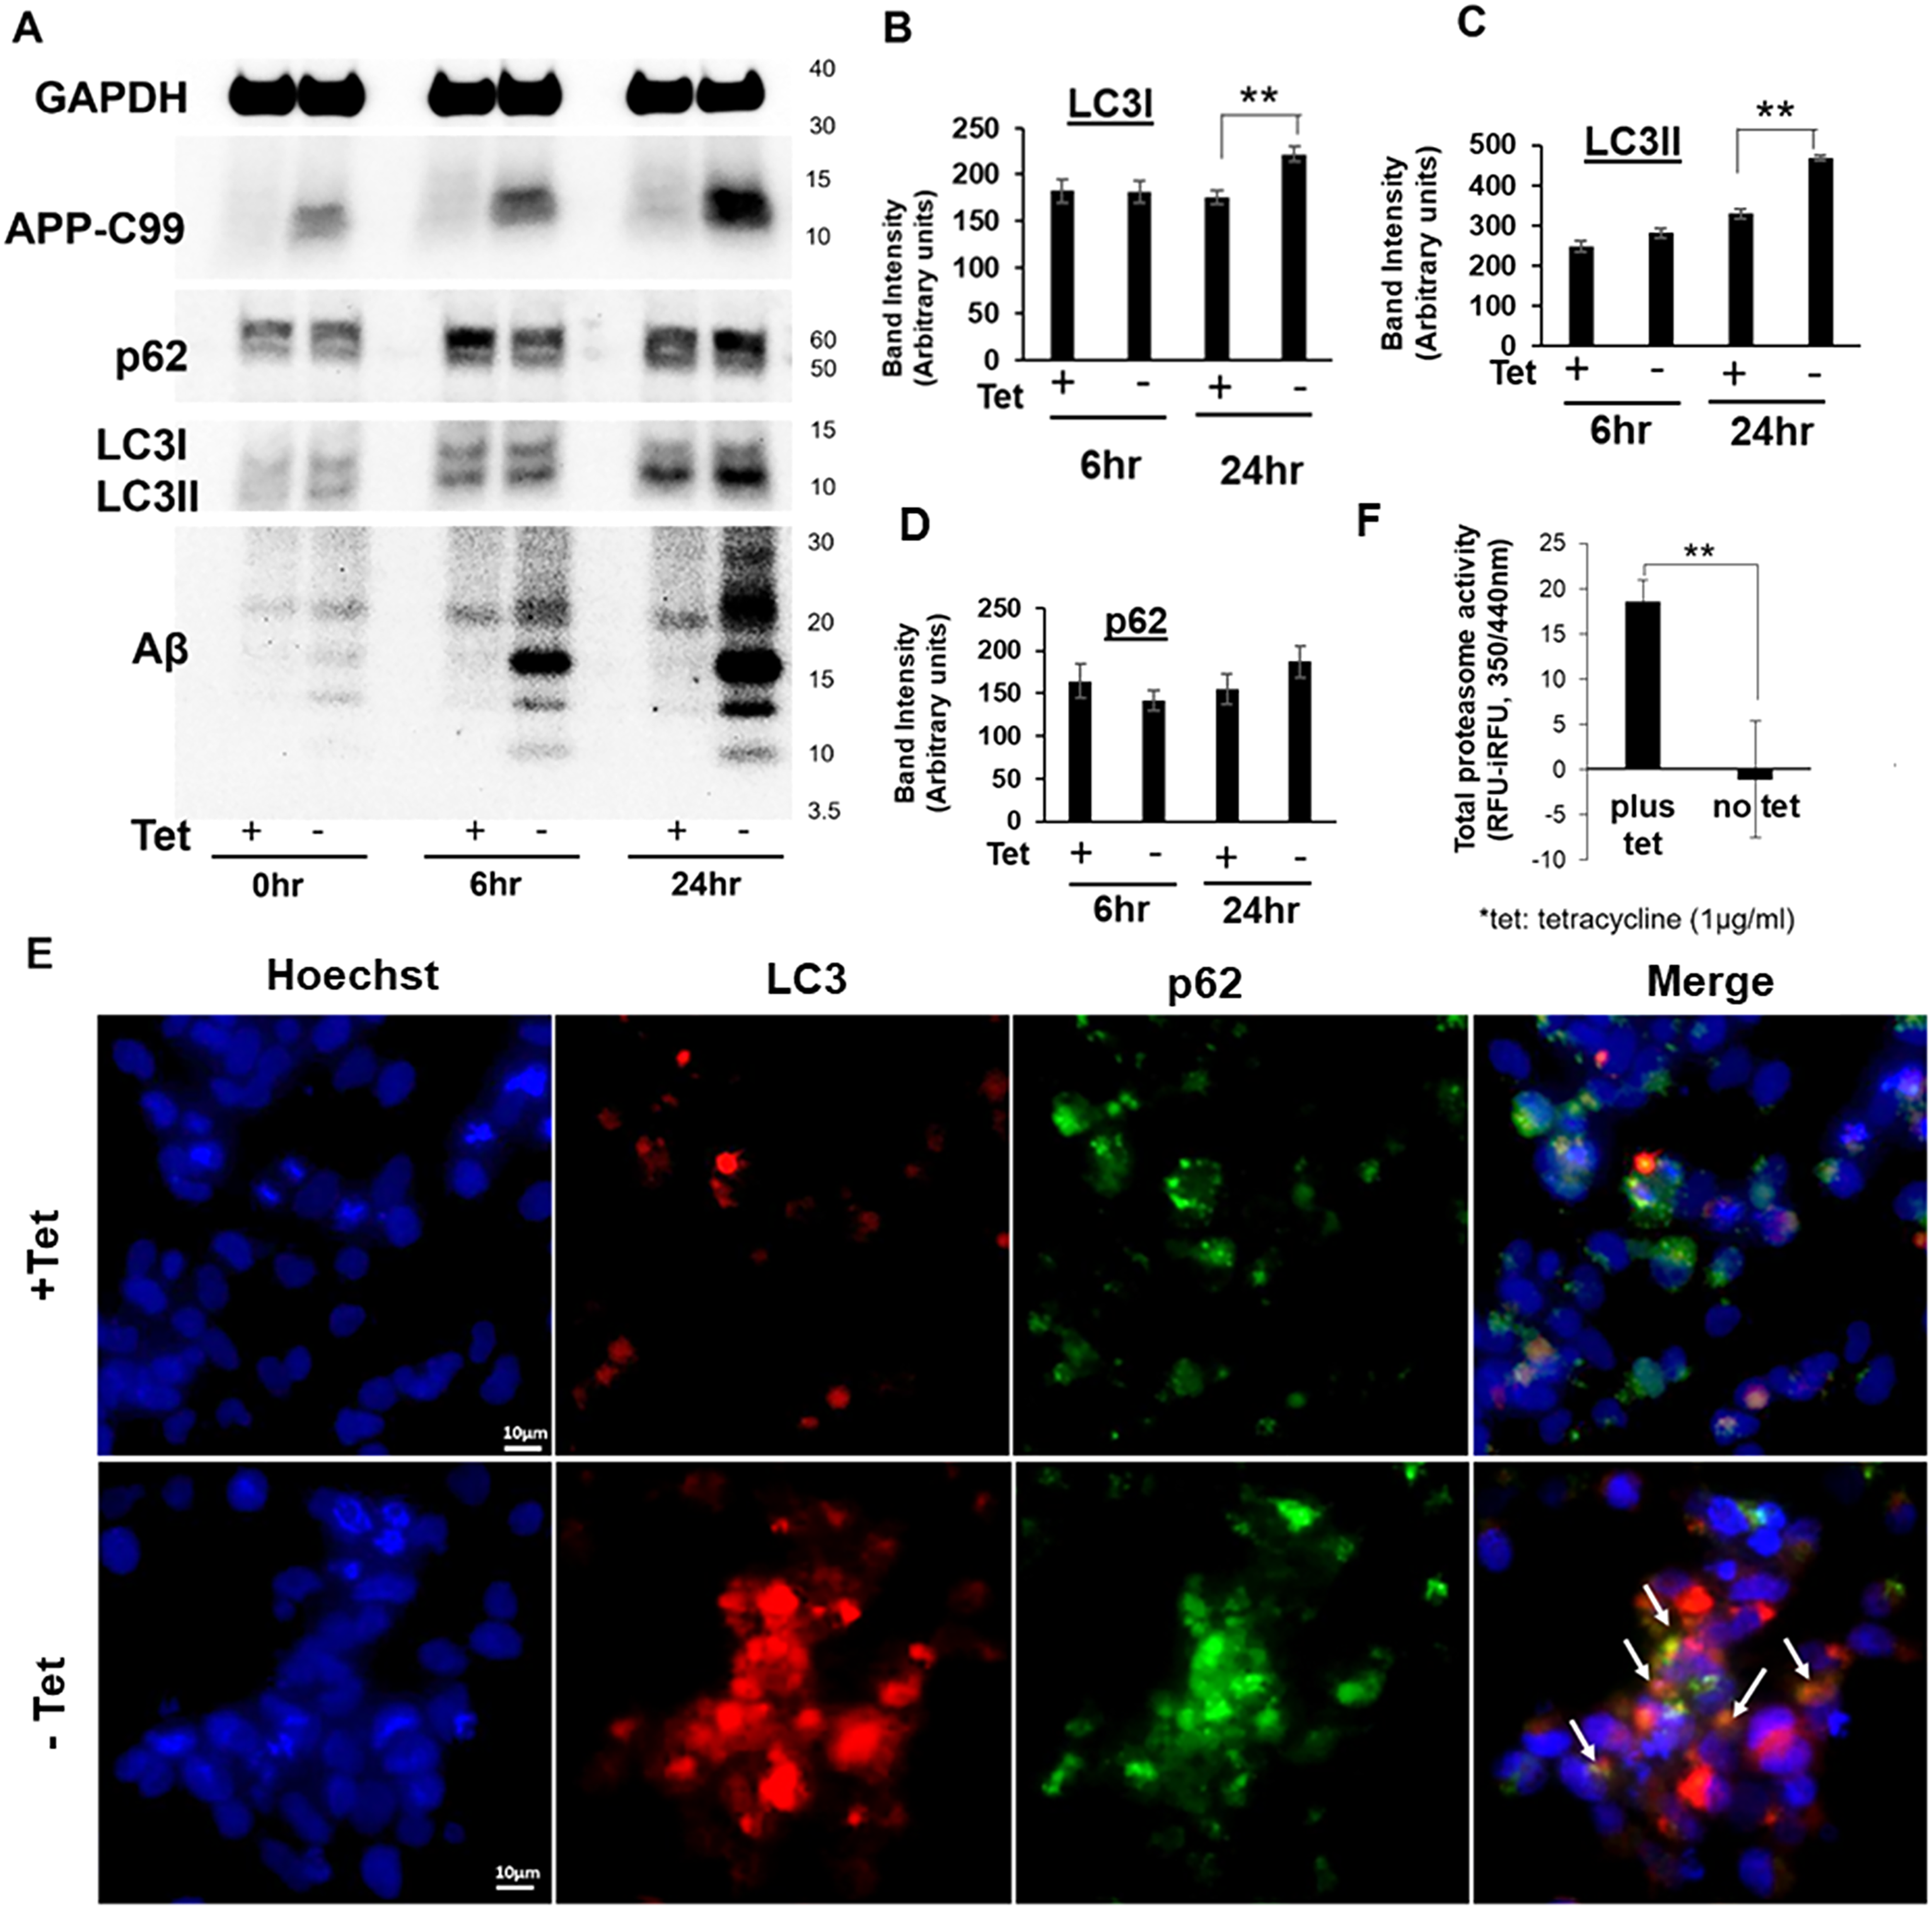
Autophagy and proteasome dysfunction in APP-C99/Aβ producing cells. Expression levels of APP-C99, Aβ, autophagy markers LC3 and p62, AV accumulation and proteasome activity were assessed in MC65 cells. Cells were grown without tetracycline to induce APP-C99 expression, or with it to suppress expression. Cell lysates were collected at 0 h, 6 h and 24 h to measure levels of GAPDH, Aβ, APP-C99, p62, LC3I, and LC3II using western immunoblotting (A-D). A representative image of the western blot is shown here (A). Levels of LC3I (B), LC3II (C) and p62 (D) were quantified using Image Lab version 6.0 (Biorad). APP-C99/Aβ producing MC65 cells showed increased accumulation of LC3I and LC3II at 24 h, (**p < 0.001, n = 4). Immunofluorescence staining was performed using the MC65 cell model. The MC65 cell model works based on the Tet based promoter system, were cell grown without tetracycline induced APP-C99 expression, or with it to suppress the expression (E). Similar to the immunoblotting analysis in (A), cells producing APP-C99/Aβ (-Tet) showed increased levels of LC3 as compared to control cells (+Tet) (E) Increased LC3 and co-localization with p62 was observed in cells producing Aβ (E) which is coinciding with the results seen in immunoblotting studies, there is an Aβ induced disruption in the lysosomal clearance of Avs. Arrows point towards the accumulation of LC3 and p62. Scalebar: 10 µm. Proteasome activity (AMC hydrolysis, Abcam, ab107921) in MC65 cells grown with and without tetracycline was also measured (F). Proteasome activity was almost completely abolished in cells producing APP-C99/Aβ as compared to control (**p < 0.001, n = 4).
Next, we evaluated autophagy and proteosome activity in APP-C99 producing cells. We initially measured levels of autophagosome membrane marker LC3 and ubiquitin-binding/autophagosome cargo protein p62 using western immunoblotting in cell extracts at 6 and 24 h following APP-C99 induction. During autophagy, the cytosolic form of LC3 (LC3I) is conjugated to phosphatidylethanolamine to form LC3-phosphatidylethanolamine conjugate (LC3II), which is recruited to autophagosomal membranes. 62 Consistent with our previous report, 20 both LC3I and LC3II were increased by about 100% and 200% respectively in APP-C99 producing cells compared to the uninduced control (+Tet) (Figure 1B, C). p62 levels were increased in APP-C99/Aβ producing cells but no significant change was observed (Figure 1D). To further validate our findings, we assessed distribution and intracellular localization of LC3 and p62 in APP-C99/Aβ producing cells. Similar to the immunoblotting analysis in Figure 1A, cells producing APP-C99/Aβ (-Tet) showed increased levels of LC3 and p62 as compared to control cells (+Tet) (Figure 1E). In addition, increased co-localization of p62 and LC3 was observed in cells producing APP-C99/Aβ (Figure 1E). These results support the findings from the immunoblotting analysis.
Proteasome activity was measured in APP-C99/Aβ expressing cells using an AMC-tagged peptide substrate (Succ-LLVY-AMC), which releases a highly fluorescent 7-amino-4-methylcoumarin (AMC, Ex/Em 350/440 nM) after proteolytic activity. Using MG132, a specific proteasome inhibitor to assay all samples, we quantified proteasome activity (Figure 1F). In contrast to the autophagy markers, proteasome activity was almost completely abolished in APP-C99/Aβ expressing cells (Figure 1F). In summary, this model showed APP-C99/Aβ induced proteostasis dysfunction with severe disturbances in autophagy and proteasome pathways, similar to previous reports in AD post-mortem studies and animal models. 21
USP14 deubiquitinase inhibitor IU1 inhibits APP-C99/Aβ induced cell death
Activating autophagy via modulating mTOR (mammalian target of rapamycin) and AMPK (5’ AMP-activated protein kinase) pathways has received the most attention.63–66 We previously showed that the anti-histamine drug, latrepirdine, reduced Aβ toxicity and cognitive loss in mouse models through the inhibition of mTOR.10,67 A range of proteostasis modulators have been developed with the aim to promote clearance of toxic protein aggregates, such as Aβ. 9 Here, we adapted the APP-C99/Aβ producing cell model (Figure 1) as a high-throughput assay to screen and identify small molecule proteostasis modulators that inhibit cell death.55,68 We screened a library of 156 small molecule proteostasis modulators in the APP-C99/Aβ cell model (Supplemental Table 1). Based on a cut-off range of 75% viability in control cells, five inhibitors including IU1, Carbamazepine, Omeprazole, Rotundine, and Loperamide were identified to improve survival of APP-C99/Aβ producing cells (Figure 2A). Notably, autophagy activators, rapamycin, everolimus and temsirolimus promoted APP-C99/Aβ accumulation and exacerbated cell death, while autophagy inhibitors such as Bafilomycin A (BafA) and chloroquine alleviated APP-C99/Aβ accumulation and cell death (Figure 2A). The lead candidate drug, which exhibited more than 40% increase in cell survival, was IU1. IU1 is a selective inhibitor of the deubiquitinase enzyme, USP14. IU1 derivatives IU1-47 and IU1-248 also inhibited Aβ toxicity but were less potent as compared to IU1 (Supplemental Figure 8). Additionally, IU1 showed a dose-dependent increase in cell survival in the APP-C99/Aβ producing cells (Figure 2B), validating our findings from the drug screening. This study is the first report demonstrating a protective effect for IU1 in an AD cell model. Interestingly, autophagy inhibitors BafA and chloroquine increased cell survival rate for APP-C99/Aβ producing cells by 55% and 130% respectively. Other candidates including Carbamazepine, Omeprazole, Rotundine, Loperamide are known inhibitors of sodium channel, proton pump and calcium-channel respectively. These exhibited an increased cell survival of between 15% to 25%, which was consistent with previous AD mouse 69 and cell models. 60 IU1 is an allosteric inhibitor of USP14 and an activator of proteasomal degradation. 70 IU1 has been shown to promote protein degradation through modulation of autophagy and proteasome activity, so we focused further analysis on this along with the 2 autophagy inhibitors BafA and chloroquine.

Effect of small molecule proteostasis modulators on Aβ toxicity. To identify inhibitors of APP-C99/Aβ induced cell death, we screened a library of 156 small molecule proteostasis modulators in MC65 cells. The chemical library included molecules targeting a wide range of pathways such as proteasome, hypoxia-inducing factor, histone deacetylases, aurora kinase, sirtuin, E3 ligase and calcium channels. Each compound tested in triplicate in control cells (+Tet) and APP-C99/Aβ producing cells (-Tet) and the whole screening was conducted twice. Concentrations of each compound based on EC50 provided by supplier. To determine inhibitors of APP-C99/Aβ induced neurotoxicity, cells treated with the compounds for 3 days followed by evaluation of cell death using MTS assay, a colorimetric assay based on the reduction of the MTS tetrazolium compound by viable cells to generate a coloured formazan dye. 10 Based on a cut-off range of 75% for drug toxicity, 5 inhibitors including IU1, Carbamazepine, Omeprazole, Rotundine, Loperamide were identified to improve survival of APP-C99/Aβ producing cells (A). Notably, autophagic activators, rapamycin, everolimus and temsirolimus exacerbated cell death in the AD cell model. While in contrast, autophagy inhibitors such as Bafilomycin A (BafA) and chloroquine reduced APP-C99/Aβ accumulation and cell death. IU1, the lead molecule identified in the screening, also showed a dose-dependent increase in cell survival of APP-C99/Aβ producing cells (##p < 0.001) (B).
IU1 alleviates autophagy and proteasomal dysfunction and promotes clearance of Aβ and APP-C99
Deubiquitinase enzymes (DUBs) are a large group of proteases, most of which are part of the USP/UBP superfamily, including the Ub-specific protease 14 (USP14). Different lines of evidence show that IU1 promotes clearance of aggregated proteins implicated in neurodegenerative diseases, via enhancing proteasomal degradation.70–75 IU1 treatment enhanced degradation of proteasomal substrates, oxidized proteins, 70 reduced PrPSc (pathogenic isoform of prion protein) levels in prion-infected neuronal cells72,76 and also tau in cultured neurons. 71 Loss of USP14 results in a decrease in the steady-state levels of aggregate-prone proteins, such as tau and ataxin-3 in cell culture models.73,75 In a more recent report, USP14 has been found to help to maintain the basal level of autophagic flux in the cell. 74 Validation of the effect of USP14 suppression was seen when genetic inhibition was compared with pharmacological inhibition, where it was found to correct an in vivo model of impaired mitophagy. 77 Xu et al. showed that IU1 increases K63 ubiquitination of Beclin1, which has a central role in regulating both autophagy and apoptosis. 78
Given these effects of IU1 on autophagy and the proteasome, we investigated the ability of IU1 to modulate these pathways in APP-C99/Aβ producing cells. First, we measured levels of APP-C99, Aβ, autophagy markers p62, and LC3 in APP-C99/Aβ expressing cells treated with IU1 using immunoblotting (Figure 3A-F). IU1 (1 µM) reduced APP-C99 (Figure 3B) and Aβ levels by ∼40% (Figure 3C). As shown before, both LC3I and LC3II was increased by ∼100% and 200% respectively in APP-C99/Aβ expressing cells as compared to control (Figure 3D, E). IU1 reduced both LC3I and LC3II by ∼40% (Figure 3D, E). IU1 treatment showed a decreasing trend in p62 levels but no significant change was observed (Figure 3F). Also, we wanted to check whether IU1 alters Aβ production rather than clearance, we examined the expression of APP and key APP-processing enzyme component Presenilin 1 (PS1). Western blot analysis showed no detectable changes in PS1 and APP across + Tet, -Tet, IU1-treated, or chloroquine-treated conditions. These findings indicate that IU1 does not affect APP processing and that the observed reduction in Aβ is attributable to enhanced clearance rather than decreased generation (Supplemental Figure 1D, E). Quantification of Aβ40 and Aβ42 levels in MC65 cells under + Tet and -Tet conditions were assayed using the SIMOA (Single Molecule Array) assay. No detectable Aβ40 or Aβ42 was observed in + Tet cells, whereas -Tet cells showed elevated levels of both peptides. Increased NFL (neurofilament light), a neurodegeneration biomarker was observed in the MC65 cell supernatant when grown without tetracycline, while NFL levels were reduced in cell lysate (Supplemental Figure 1F).
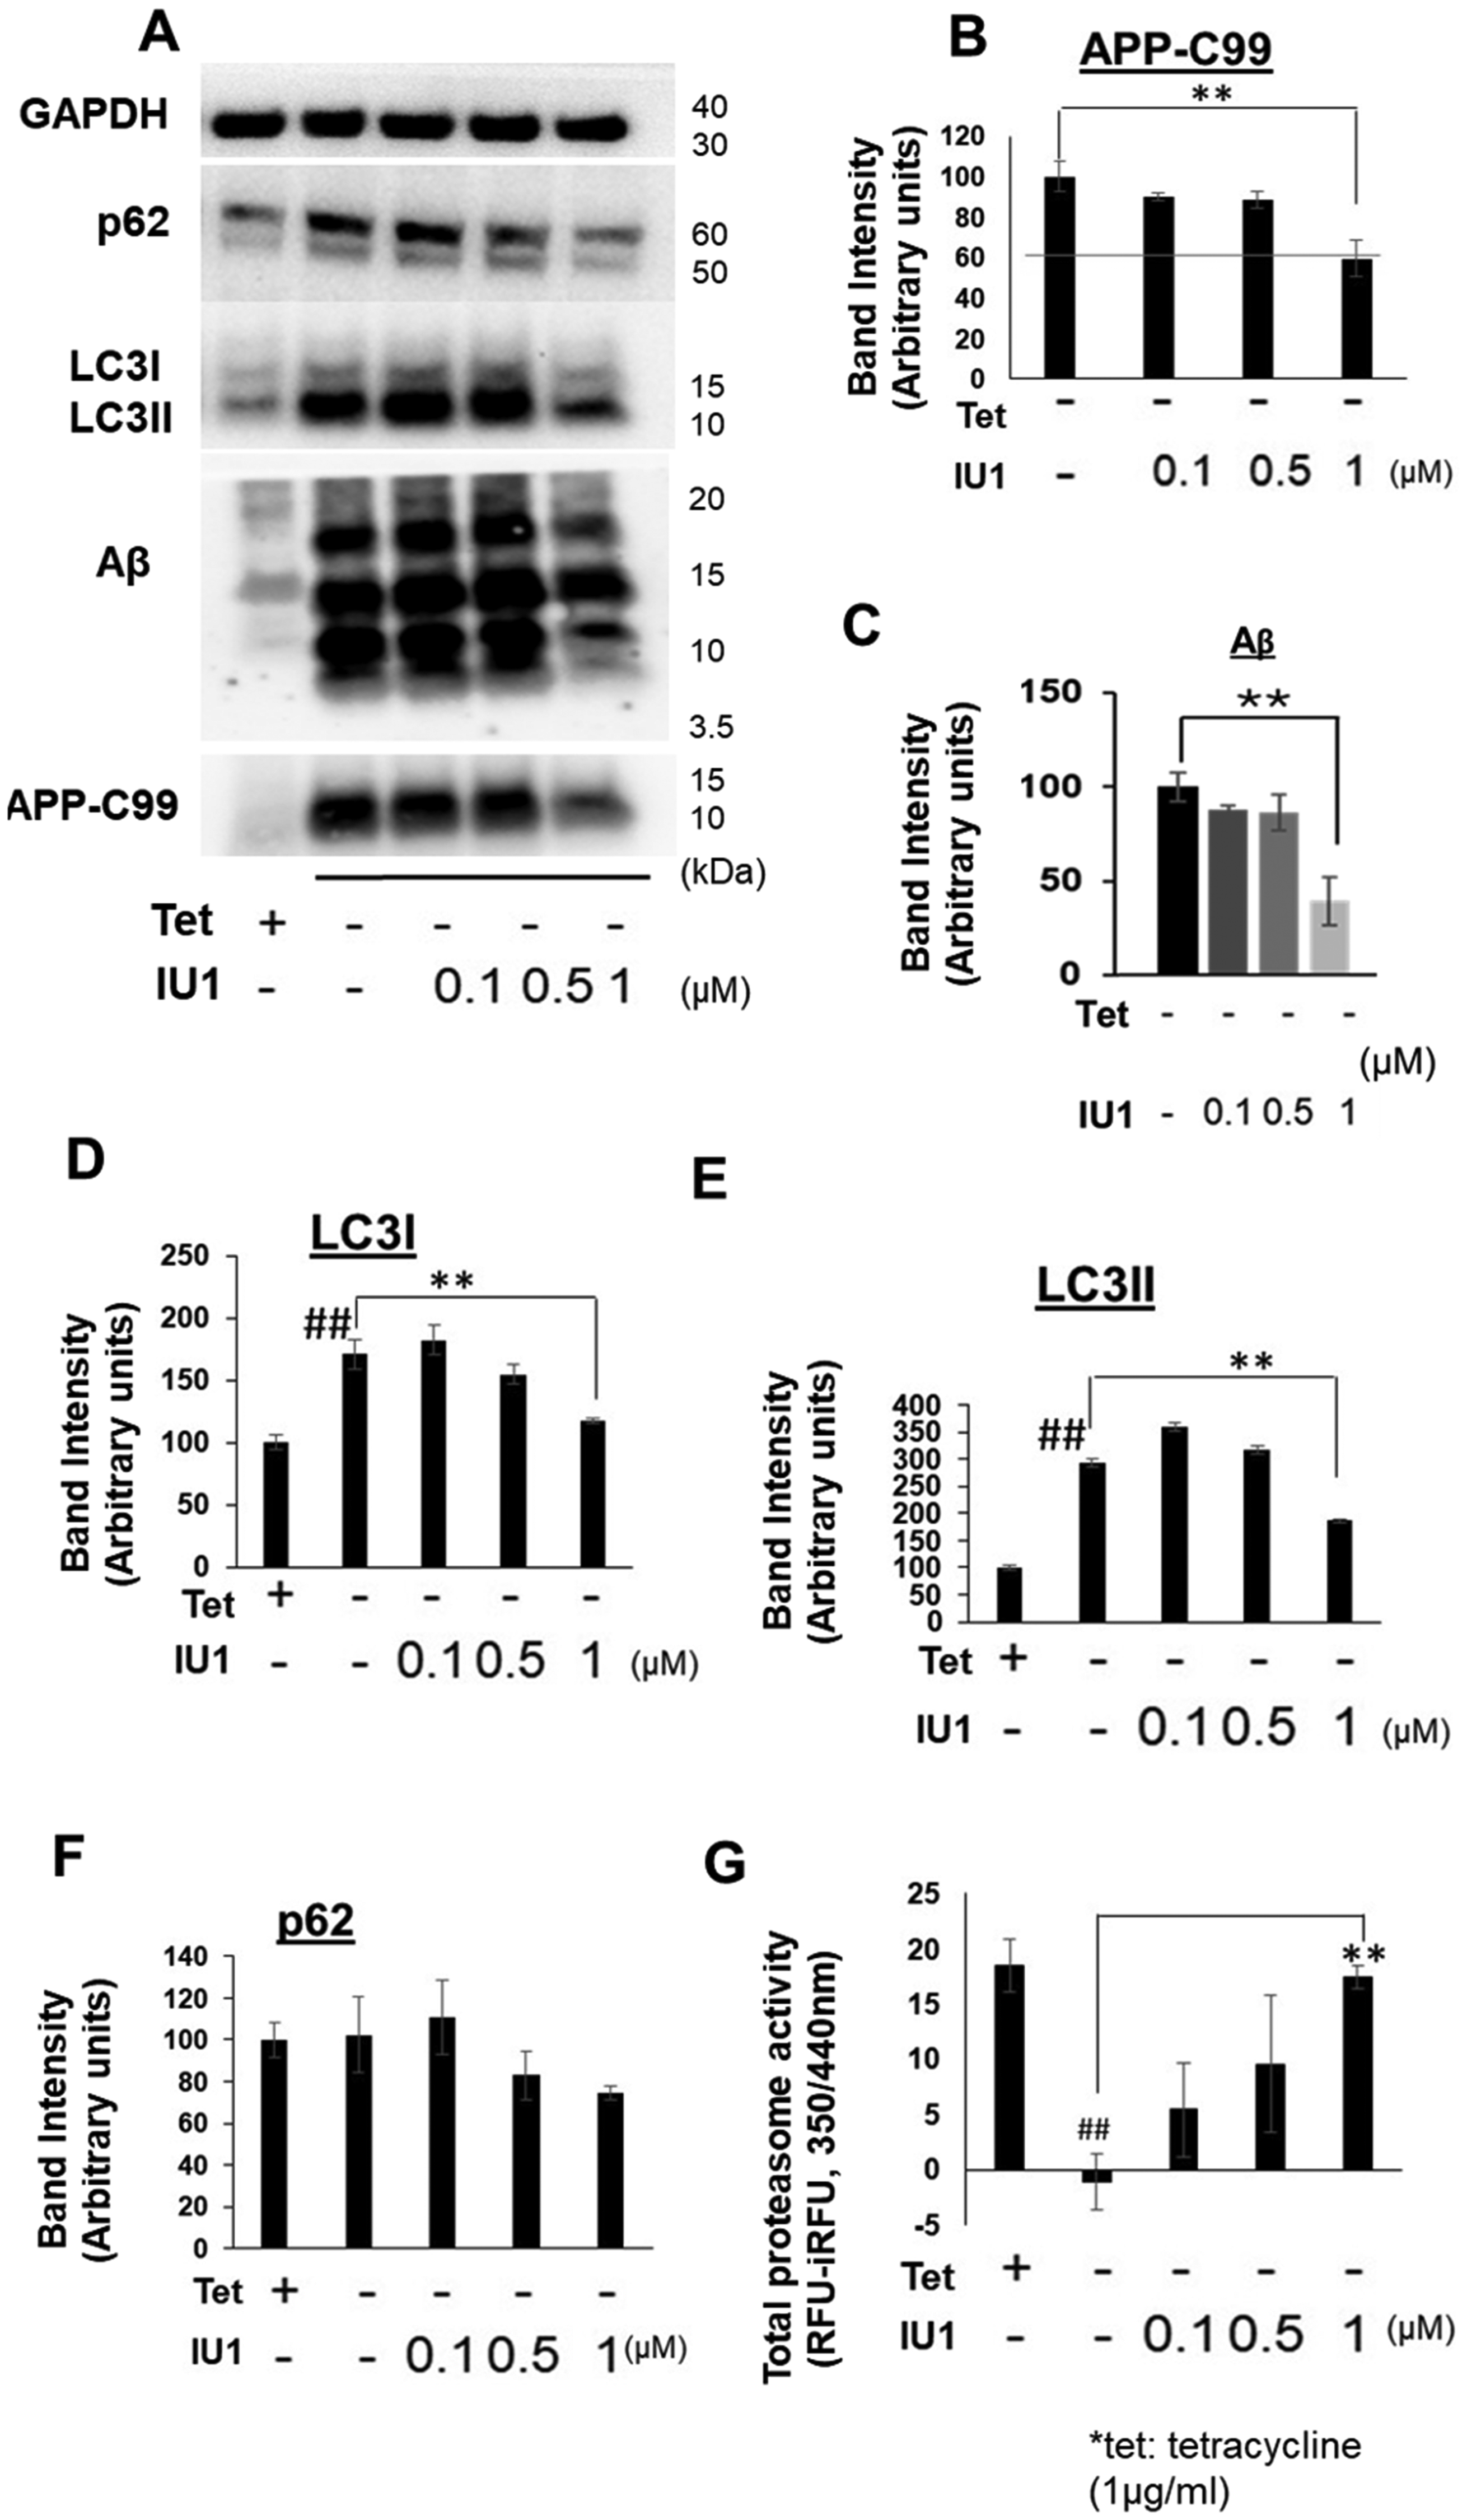
IU1 reduces APP-C99 and Aβ levels. Expression levels of APP-C99, Aβ, autophagy markers LC3 and p62 and proteasome activity was assessed in MC65 cells treated with increasing doses of IU1 using immunoblot analysis. MC65 cells growing without tetracycline were treated with IU1 (0.1, 0.5 and 1 µM) for 24 h and cell lysates were collected to measure levels of GAPDH, Aβ, p62, APP-C99, LC3I, LC3II, using western immunoblotting (A-F). A representative blot of Aβ producing MC65 cells treated with IU1 (0.1, 0.5 and 1 µM) is shown here (A). Levels of APP-C99 (B), Aβ (C), LC3I (D), LC3II (E), p62 (F). IU1 treatment reduced APP-C99 and levels of Aβ including (**p < 0.001, n = 4). In addition, IU1 reduced LC3I and LC3II (##,**p < 0.001). Proteasome activity (AMC hydrolysis, Abcam ab107921) in Aβ producing MC65 cells treated with IU1 (0.1, 0.5 and 1 µM) was also measured (G). Proteasome activity was almost completely abolished in cells producing APP-C99/Aβ as compared to control (##p < 0.001, n = 4). IU1 treatment increased it in a dose-dependent fashion (**p < 0.001, n = 4).
We further analyzed localization of p62, and LC3 in APP-C99/Aβ expressing cells treated with IU1 using immunofluorescence staining. Similar to Figure 1, increased LC3 and p62 co-localization was observed in cells producing Aβ (Figure 4A). When treated with IU1, APP-C99/Aβ producing cells showed reduced accumulation of LC3 and p62. In addition, IU1 treatment decreased the co-localization of LC3 and p62 (Figure 4A). AV accumulation in MC65 cells was assessed using LysoTracker staining (Figure 4C). Similar to elevated LC3II levels and p62 colocalization, APP-C99/Aβ expressing cells also exhibited increased AV accumulation compared to control (Figure 4C). Whereas IU1 treatment reduced AV accumulation to the levels observed in control cells (Figure 4C). Next, to examine whether Aβ co-localises with lysosomal marker, we performed immunofluorescence co-localization studies using LysoTracker together with Aβ staining. In -Tet MC65 cells, we observed pronounced co-localization of Aβ with lysosomal markers. IU1 treatment markedly reduced this lysosomal build-up indicating that Aβ is sequestered into lysosomal vesicles and targeted for degradation via the autophagy-lysosomal pathway (Figure 4B). IU1 derivatives IU1-47 and IU1-248 decreased the co-localization of LC3 and p62 but similar to its limited ability to improve survival in the APP-C99/Aβ expressing cells (Supplemental Figure 8); however, in line with their limited efficacy in enhancing survival of APP-C99/Aβ-expressing cells (Supplemental Figure 8), their capacity to alter LC3 and p62 co-accumulation was comparatively modest. We also assessed whether IU1 treatment affected viability and autophagy in wild-type cells (+Tet) using MTS and LysoTracker staining. Notably, IU1 treatment had no detectable effect in wild-type cells in both viability and LysoTracker assay (+Tet) cells (Supplemental Figure 6A-C). Overall, these findings suggested that IU1 alleviated APP-C99/Aβ induced autophagy dysfunction. Next, we measured whether IU1 altered proteasomal activity in APP-C99/Aβ expressing cells. IU1 treatment resulted in a dose-dependent increase in proteasome activity compared to untreated cells, with the highest concentration (1 µM) completely restoring the proteolytic activity (Figure 3G). Overall, IU1 showed the ability to reverse the proteostasis defects and reduce accumulation of APP-C99 and Aβ in the AD cell model.
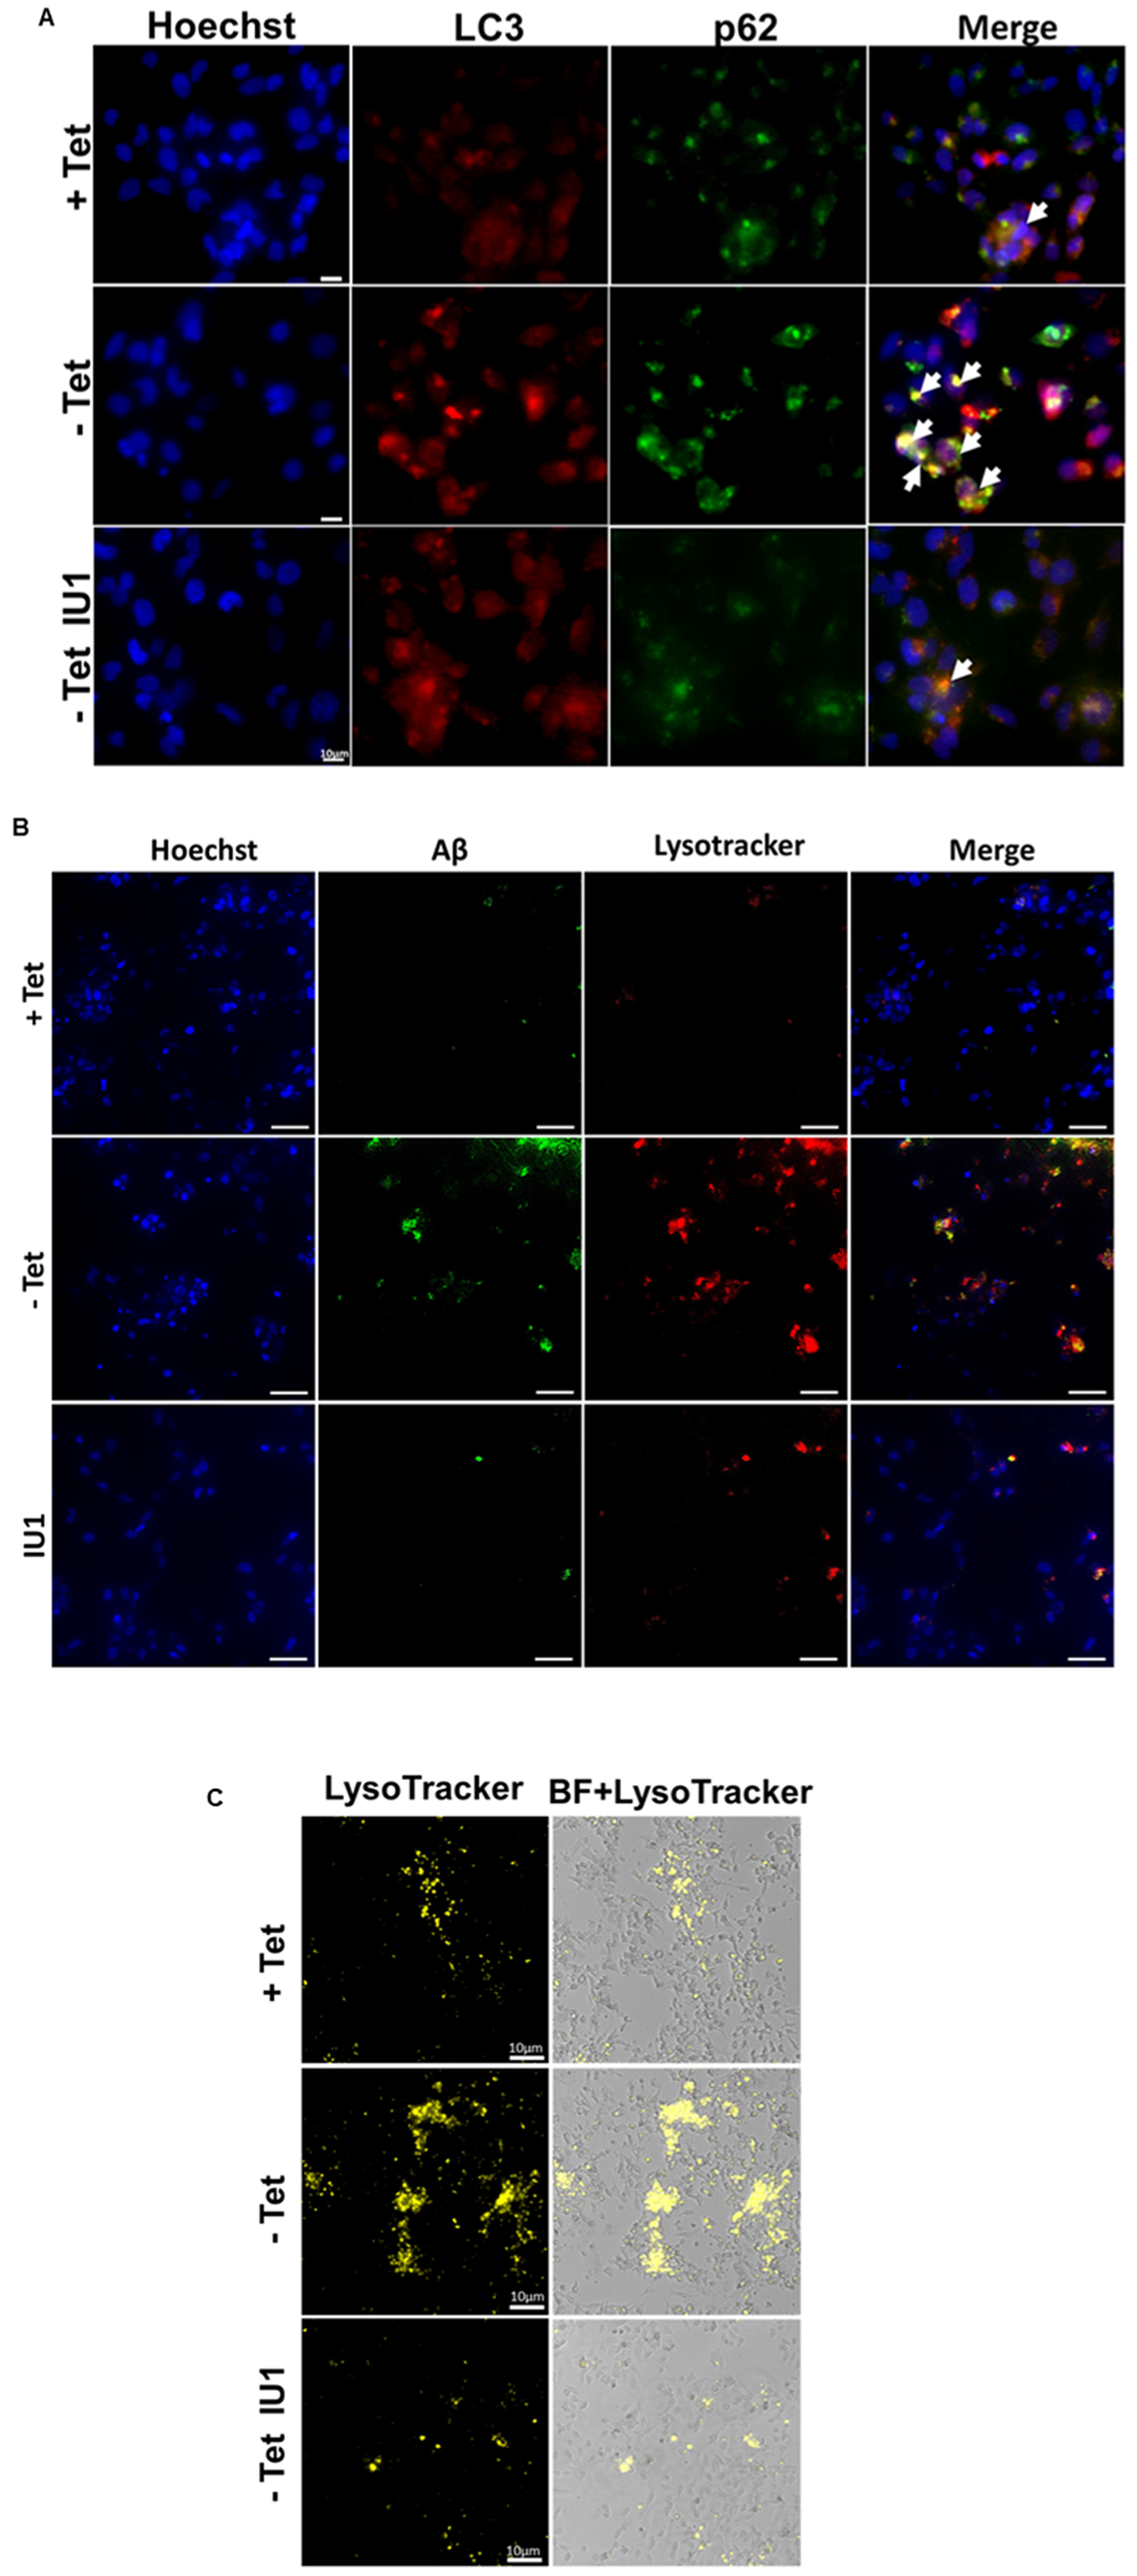
IU1 reduces Aβ and autophagic dysfunction. Immunofluorescence staining was performed on MC65 cells treated with IU1 (1 µM) concentration to access its effect on autophagic markers LC3 and p62. IU1 showed to reduce the accumulation of LC3 and p62 in comparison to APP-C99/Aβ producing cells (A), further IU1 was able to bring the level similar to the -Tet group. Aβ producing cells treated with IU1 showed reduced accumulation of LC3 and p62. In addition, IU1 treated cells showed decreased co-localization of LC3 and p62 (A). (B) Immunofluorescence studies in -Tet MC65 cells, observed pronounced co-localization of Aβ with lysosomal markers, consistent with lysosomal accumulation under Aβ-producing conditions. IU1 treatment markedly reduced this lysosomal build-up. Arrows denote the LC3 co-localization with p62. LysoTracker staining was used to evaluate lysosomal function in MC65 cells (C). IU1 showed reduced fluorescence binding to acidic compartments like lysosomes in comparison to APP-C99/Aβ producing cells, showing improved lysosomal function. These findings suggested that IU1 alleviated Aβ induced disruption in the lysosomal clearance of AVs. Arrows denote the LC3 co-localization with p62. Scale bar: 10 μm.
We further evaluated if IU1 promotes APP-C99/Aβ clearance using the “Tet spiking” assay. 59 For this, the APP-C99/Aβ producing cells were grown without tetracycline for three days to induce APP-C99/Aβ production. This was followed by spiking with tetracycline (Tet-spiking) in the presence or absence of IU1. After Tet spiking, cell lysates were collected at 0, 6 and 24 h to measure levels of Aβ, APP-C99 (Figure 5). Tetracycline spiking induced a marked reduction in both Aβ (Figure 5A, B) and APP-C99 (Figure 5A, C) ranging from 40–60% at 24 h. Minor differences in the rate and levels of clearance of Aβ and APP-C99 was observed (Figure 5). IU1 treatment showed a further decrease in APP-C99/Aβ levels at 24 h, although this effect was not significant compared to tetracycline spiking alone (Figure 5). Collectively, these results fit with previous findings71,75 that show the ability of IU1 to clear aggregate proteins implicated in neurodegenerative diseases, such as tau and prion. We next investigated whether this clearance ability of IU1 is dependent on enhancement of proteasomal activity.
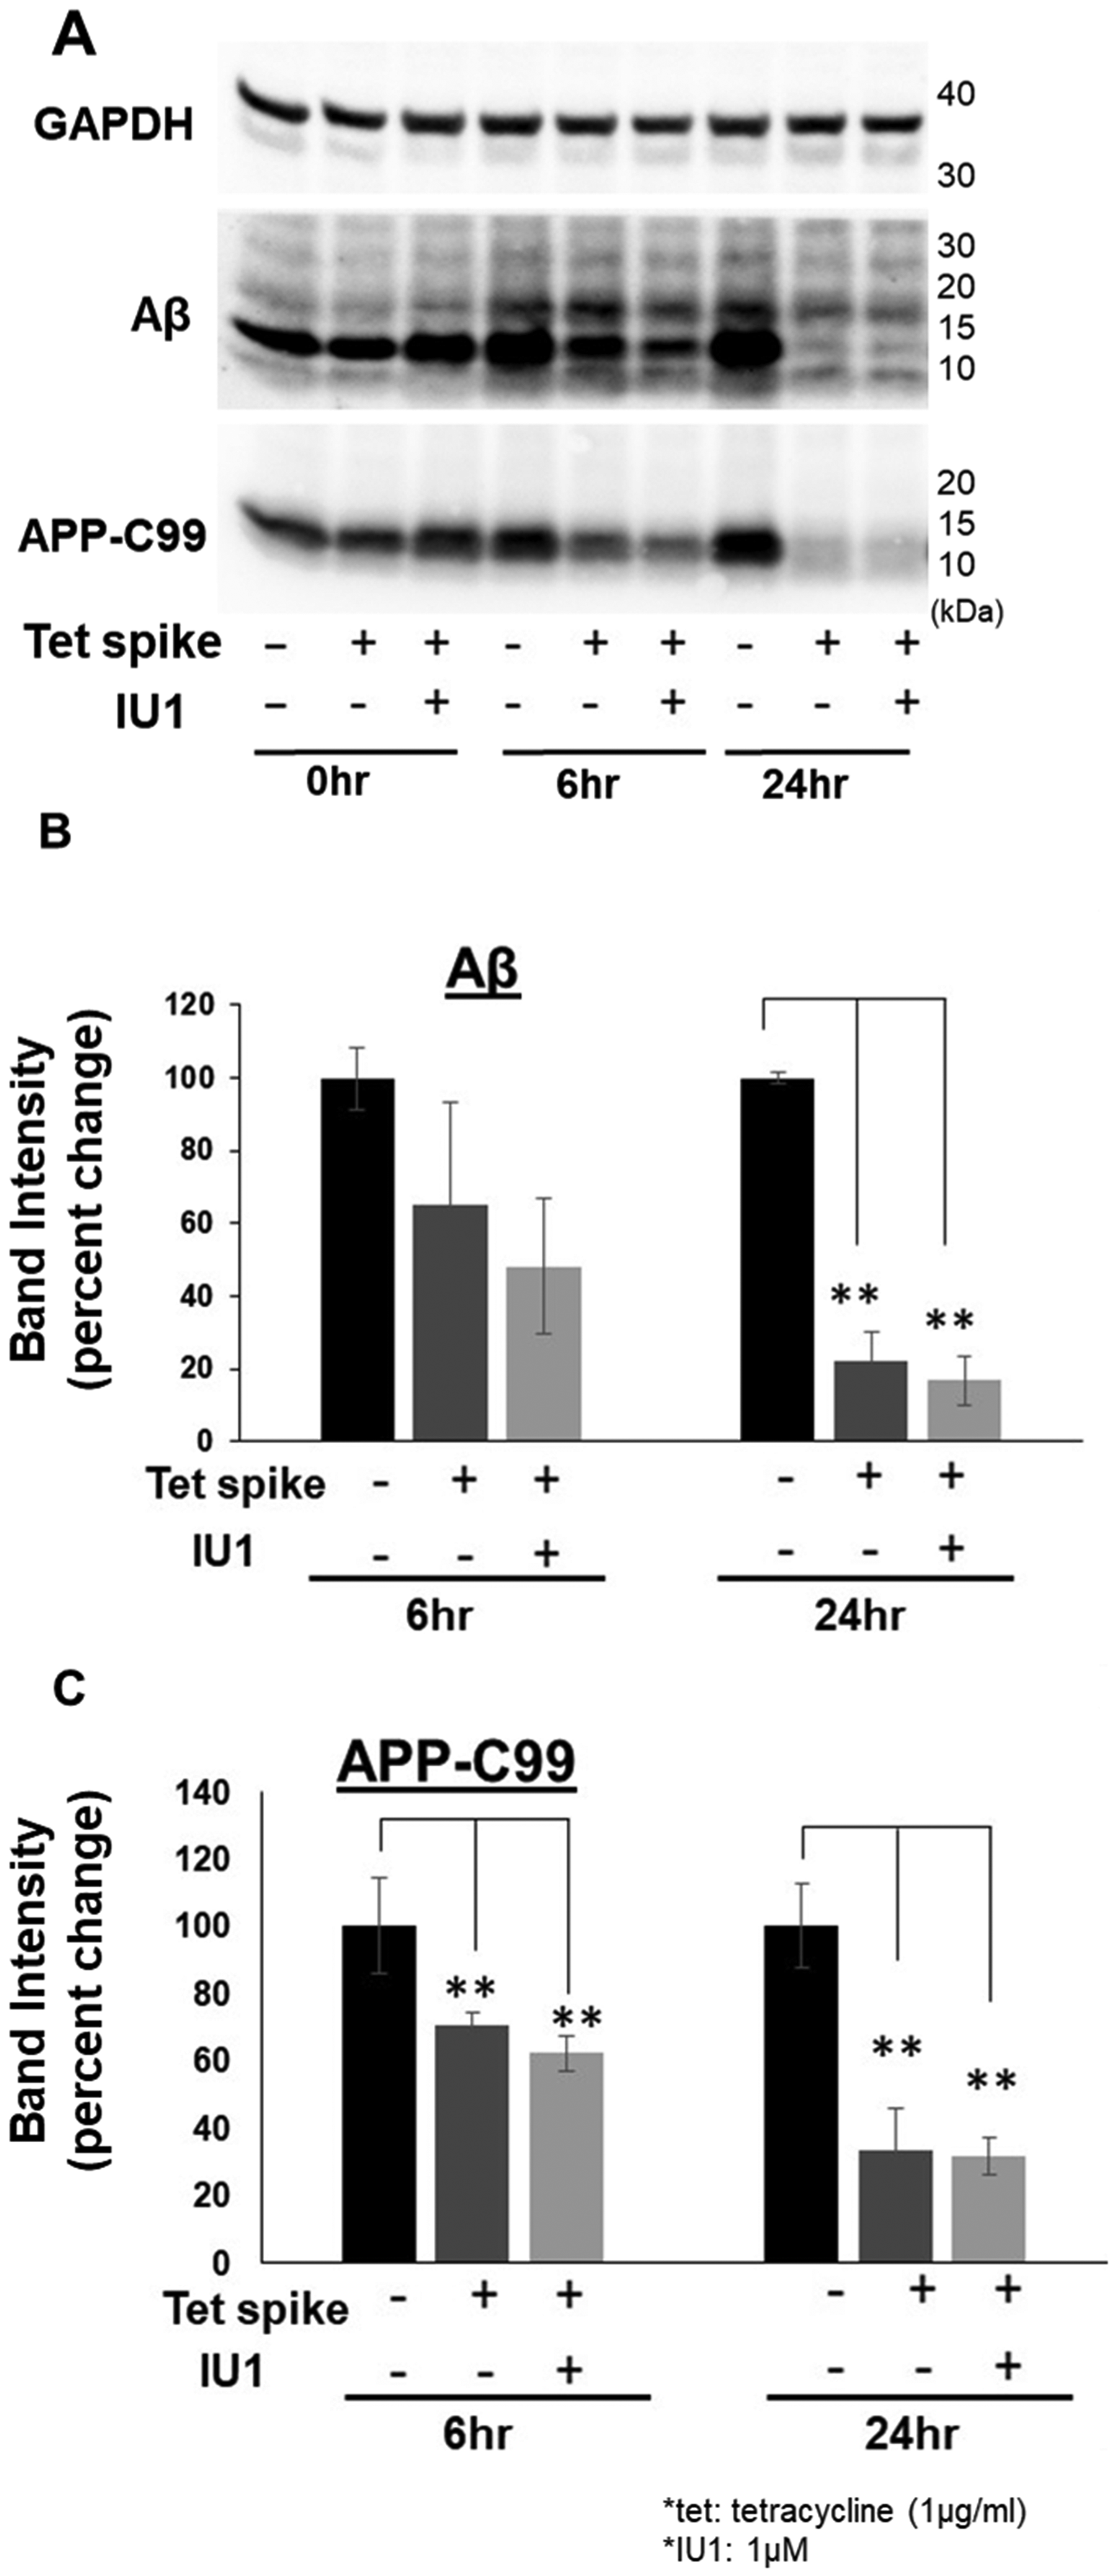
IU1 promotes clearance of Aβ and APP-C99. The Tet spiking assay 20 was utilized to investigate whether IU1 promotes APP-C99 and Aβ clearance. To assess clearance, cells were grown without tetracycline for 2 days to activate APP-C99/Aβ production, followed by spiking with tetracycline +/- IU1 (1 µM) to block C99/Aβ production. After spiking, cell lysates were collected at 0 h, 6 h, and 24 h to measure levels of Aβ (B) and APP-C99 (C). A representative image of the western blot is shown here (A). Cells spiked with tetracycline showed a marked reduction in APP-C99 and Aβ. IU1 treatment also showed a marked decrease in APP-C99 and Aβ (**p < 0.001, n = 4). Arrows denote the LC3 co-localization with p62.
MG132 impairs IU1 mediated Aβ and APP-C99 clearance and protection against cell death
IU1 was originally discovered as a proteasome activator. 70 To investigate whether IU1 promotes clearance via activation of the proteasome, we assessed APP-C99/Aβ accumulation, clearance and toxicity in cells treated with IU1 in combination with proteasome inhibitor MG132 (Figure 6). As shown before, IU1 treatment reduced levels of Aβ and APP-C99 by 30–40% (Figure 6A-C). IU1 treatment in combination with MG132 (50 nM) showed a ∼300% increase in the levels of APP-C99 and Aβ as compared to untreated at 24 h incubation (Figure 6A-C). Treatment with MG132 also increased levels of Aβ oligomer and APP-C99 by ∼300%. Consistent with the increased accumulation of Aβ and APP-C99, the ubiquitin-binding cargo protein, p62, was elevated ∼200% with MG132 treatment at 24 h (Figure 6A, D). Proteasome activity was measured in IU1 and MG132 treated cells after 24 h treatment (Figure 6E). Proteasome activity was completely abolished in APP-C99/Aβ expressing cells, whilst IU1 treatment restored the activity to the levels observed in untreated control cells (+Tet). Corresponding to the increased levels of APP-C99/Aβ and p62 with MG132, cells treated with IU1 in combination with MG132 showed a 50% decrease in proteasome activity compared to IU1 only treatment (Figure 6E). This showed that MG132 abrogated IU1 mediated proteasome activation and increased accumulation of APP-C99 and Aβ. We further assessed if MG132 impaired IU1 mediated APP-C99/Aβ clearance using the Tet spiking assay (Supplemental Figure 2). As expected, the tetracycline spike, whether individually or in the presence of IU1, induced a marked reduction in both Aβ and APP-C99 ranging from 40–60% at 24 h (Supplemental Figure 2A-C). MG132 treatment, alone and in combination with IU1, significantly increased APP-C99/Aβ levels similar to control cells (no Tet spike), particularly at 24 h (Supplemental Figure 2A-C), indicating a marked inhibition of APP-C99/Aβ clearance. Overall, these findings demonstrated that the proteasome is a central pathway for IU1 mediated clearance of APP-C99 and Aβ.

Proteasome inhibitor MG132 promotes APP-C99/Aβ accumulation and cell death. To assess whether IU1 reduces Aβ and APP-C99 accumulation via the proteasome pathway, MC65 cells grown in the absence of tetracycline and treated with IU1 (1 µM) individually and in combination with proteasome inhibitor MG132 (50 nM). After treatment, cell lysates were collected at 6 h and 24 h to measure levels of levels of APP-C99 (B), Aβ (C), and p62 (D) using western immunoblotting. A representative image of the western blot is shown here (A). IU1 treatment reduced APP-C99 and levels of Aβ but showed no effect on p62. Cells treated with MG132 individually and in combination with IU1 showed increased levels of APP-C99, Aβ and p62 at 6 h and 24 h (#p < 0.005 and **p < 0.001. n = 4) as compared to untreated control. Proteasome activity in MC65 cells treated with IU1 and in combination with MG132 (E). Proteasome activity was almost completely abolished in cells producing APP-C99/Aβ as compared to control. IU1 treatment increased proteasome activity. Cells treated with IU1 in combination with MG132 did not show any significant increase in proteasome activity as compared to untreated APP-C99/Aβ producing cells (**p < 0.001, n = 4). To assess whether MG132 alters APP-C99/Aβ toxicity and protective effect of IU1, cells were treated with IU1 (1 µM) only and in combination with increasing dose of MG132 (15, 30 and 50 nM) for 3 days followed by evaluation of cell death using MTS assay (F). APP-C99/Aβ expressing cells showed a 60% decline in viability compared to control. IU1 treatment improved cell survival to 80% (#,**p < 0.001, n = 4). At higher concentration (50 nM) MG132 co-treatment with IU1 caused a decline in viability (#p < 0.005, n = 4), the effect that IU1 treatment (40% increase) had was considerably brought down, nearer to the same level as cells expressing APP-C99/Aβ (-Tet) cells (F). APP-C99/Aβ expressing cells were treated increasing dose of MG132 (15, 30 and 50 nM) for 3 days followed by evaluation of cell death using MTS assay (G). APP-C99/Aβ expressing cells showed a 60% decline in viability compared to control and at higher concentration of MG132 treatment (50 nM) cell death was observed (#p < 0.005, n = 4). MG132 impaired the clearance of APP-C99 and Aβ, it also showed to alter cell viability at higher concentration.
Next, we evaluated whether proteasome activity is associated with APP-C99/Aβ mediated cell death and whether its activation is the source of the neuroprotective activities of IU1 (Figure 6). First, we assessed if MG132 co-treatment with IU1 can alter the cell viability and protection conferred by IU1 (Figure 6F). As shown before, IU1 treatment showed a 40% increase in cell viability in APP-C99/Aβ expressing cells (-Tet). Co-treatment of IU1 with MG132 (15 and 30 nM) did not alter the viability, as compared to APP-C99/Aβ producing cells (-Tet) treated with IU1 only. However, co-treatment of IU1 with a higher concentration of MG132 (50 nM) showed a ∼40% decline in viability as compared to cells treated with IU1 only (Figure 6F). This showed that MG132 significantly reversed the ability of IU1 to alleviate cell death in APP-C99/Aβ producing cells. Next, we measured cell viability of APP-C99/Aβ producing cells treated with an increasing dose of MG132 only (15, 30, and 50 nM, Figure 6G). At lower concentrations of MG132 (15 and 30 nM), the cell viability was not altered as compared to untreated APP-C99/Aβ producing cells (-Tet). At a higher concentration of MG132 (50 nM), the cell death of APP-C99/Aβ producing cells (-Tet) increased by ∼20% as compared to untreated. This showed that MG132 was exacerbating APP-C99/Aβ mediated cell death. Overall, the data indicated that the proteosome activity is central to APP-C99/Aβ clearance and consequently, its toxicity in cells. Furthermore, this showed that the neuroprotective effects of IU1 in the AD cell model is dependent on proteasome activation. In addition to this, IU1 has been shown to modulate the autophagy pathway. 78 Also, our initial studies suggest that APP-C99/Aβ accumulation and cell death is closely associated with autophagy dysfunction (Figures 1, 3, and 4). Therefore, we next evaluated if autophagy-lysosomal inhibitors altered IU1 neuroprotective activity in APP-C99/Aβ cell model.
Effects of IU1, BafA, and chloroquine on Aβ and APP-C99 clearance and cell death
Besides being a proteasome activator, IU1 has also been shown to modulate autophagy.74,78,79 IU1 was reported to regulate autophagy via suppression of USP14 mediated deubiquitination of Beclin1. 78 A more recent study reported that inactivation of USP14 results in downregulation of autophagic flux. 74 Our studies suggest that IU1 can alleviate autophagy dysfunction in the APP-C99/Aβ producing cells (Figures 3 and 4). To further evaluate the role of autophagy on IU1 mediated APP-C99/Aβ clearance and survival, we assessed cells treated with IU1 individually and in combination with BafA, a specific vacuolar H + ATPase (V-ATPase) inhibitor (Figure 7), which is regularly used lysosomal inhibitor to study autophagy flux. 80

Autophagy inhibitor BafA reduces Aβ and APP-C99 levels and cell death. To assess whether IU1 reduces Aβ and APP-C99 accumulation via autophagy, MC65 cells grown in the absence of tetracycline and treated with IU1 (1 µM) individually and in combination with autophagy inhibitor BafA (100 nM). After treatment, cell lysates were collected at 6 h and 24 h to measure levels of levels of APP-C99 (B), Aβ (C), LC3I (E), and LC3II (D) using western immunoblotting. A representative image of the western blot is shown here (A). IU1 treatment reduced APP-C99, Aβ, LC3I, and LC3II. Cells treated with BafA individually and in combination with IU1 showed increased LC3II but decreased APP-C99 and Aβ at 6 h and 24 h, as compared to untreated control (*p < 0.005 and **p < 0.001, n = 4). To assess whether BafA alters APP-C99/Aβ toxicity and protective effect of IU1, cells were treated with IU1 (1 µM) only and in combination with increasing dose of BafA (5, 10, and 20 nM) for 3 days followed by evaluation of cell death using MTS assay (F). APP-C99/Aβ expressing cells showed a 60% decline in viability compared to control. IU1 treatment improved cell survival to 80% (**p < 0.001, n = 4). No change in viability was seen in cells treated with IU1 and BafA, as compared to IU1 only. APP-C99/Aβ expressing cells were treated increasing dose of BafA (5, 10, and 20 nM) for 3 days followed by evaluation of cell death using MTS assay (F). APP-C99/Aβ expressing cells showed an 80% decline in viability compared to control and BafA treatment improved cell viability by 20% at 10 and 20 nM concentrations tested.
Initially, we measured the levels of APP-C99, Aβ, LC3I and LC3II in cells treated with IU1 and BafA, both individually and in combination (Figure 7). As shown before, IU1 treatment reduced levels of Aβ and APP-C99 by 30–40% (Figure 7A-C). Cells treated with BafA alone or in combination with IU1 showed increased LC3II accumulation at 6 h. It was also elevated at 24 h treatment but markedly reduced compared to 6 h (Figure 7D). Notably, LC3I was unchanged at 6 h and 24 h of BafA treatment (Figure 7E). BafA, both alone and in combination with IU1, decreased Aβ accumulation by 30–40% (Figure 7C). IU1 alone and in combination with BafA significantly improved viability in APP-C99/Aβ-expressing cells (Figure 7F). There is evidence that autophagy is involved in the proteolysis of APP and Aβ production, 81 suggesting that BafA may alter autophagy mediated Aβ production from APP-C99. So, we used the Tet spiking assay to validate that BafA promotes APP-C99 and Aβ clearance (Supplemental Figure 3). BafA treatment showed a marked reduction ranging from 50–80% in both APP-C99 and Aβ 24 h post treatment (Supplemental Figure 3). To further support this finding, we assessed APP-C99 and Aβ clearance using chloroquine, an antimalarial drug known to inhibit autophagy flux by impairing autophagosome lysosome fusion. Remarkably, chloroquine also showed ∼70–75% reduction in Aβ accumulation (Supplemental Figure 4). These findings are in agreement with the Pivtoraiko et al. report, which showed that BafA attenuates chloroquine-induced accumulation of detergent-insoluble α-synuclein. 82
We evaluated Aβ protein levels in both cell lysates and conditioned media at 6 h, 24 h, and 48 h following treatment with IU1 (1 µM) or BafA (100 nM) (Supplemental Figure 7A). Hsp40 and Hsp90 were included as loading controls for both cell lysates and conditioned media (Supplemental Figure 7A, B). As anticipated, analysis of cell lysates showed that both IU1 and BafA reduced Aβ levels compared to untreated Aβ-producing cells (-Tet) (Supplemental Figure 7A). Notably, conditioned media analysis revealed detectable extracellular Hsp40 and Hsp90 but no measurable Aβ in any treatment group (Supplemental Figure 7B), supporting the conclusion that Aβ is predominantly generated and retained intracellularly, with minimal to undetectable extracellular release. Collectively, our findings demonstrate that IU1 and BafA mediated Aβ clearance is confined to intracellular pathways and is not linked to its secretion.
Autophagy inhibitors BafA and chloroquine enhance proteasome activity and promotes cell survival in APP-C99/Aβ cell model
There is accumulating evidence in the literature about interactions and crosstalk between UPS and autophagy. The UPS and autophagy are interconnected, and inhibition of one system has been shown to affect the other. 83 Based on our data, it is conceivable that proteasome activation plays a central role in APP-C99/Aβ clearance and cell survival in this AD cell model (Figure 6). Interestingly, autophagy inhibitors BafA and chloroquine, also showed a similar effect in reducing APP-C99/Aβ accumulation (Figure 7 and Supplemental Figure 4). Therefore, we next assessed whether autophagy inhibitors BafA or chloroquine altered proteasome activity and cell survival of the APP-C99/Aβ cell model (Figure 8). The APP-C99/Aβ producing cells were treated with BafA (100 nM) or chloroquine (100 nM) followed by assessment of cell viability and proteasome activity. Both BafA and chloroquine treatments showed ∼30% increase in proteasomal activity as compared to -Tet untreated cells (Figure 8A). In addition, BafA and chloroquine treated cells showed an increase in viability by respectively as compared to -Tet untreated cells (Figure 8B).
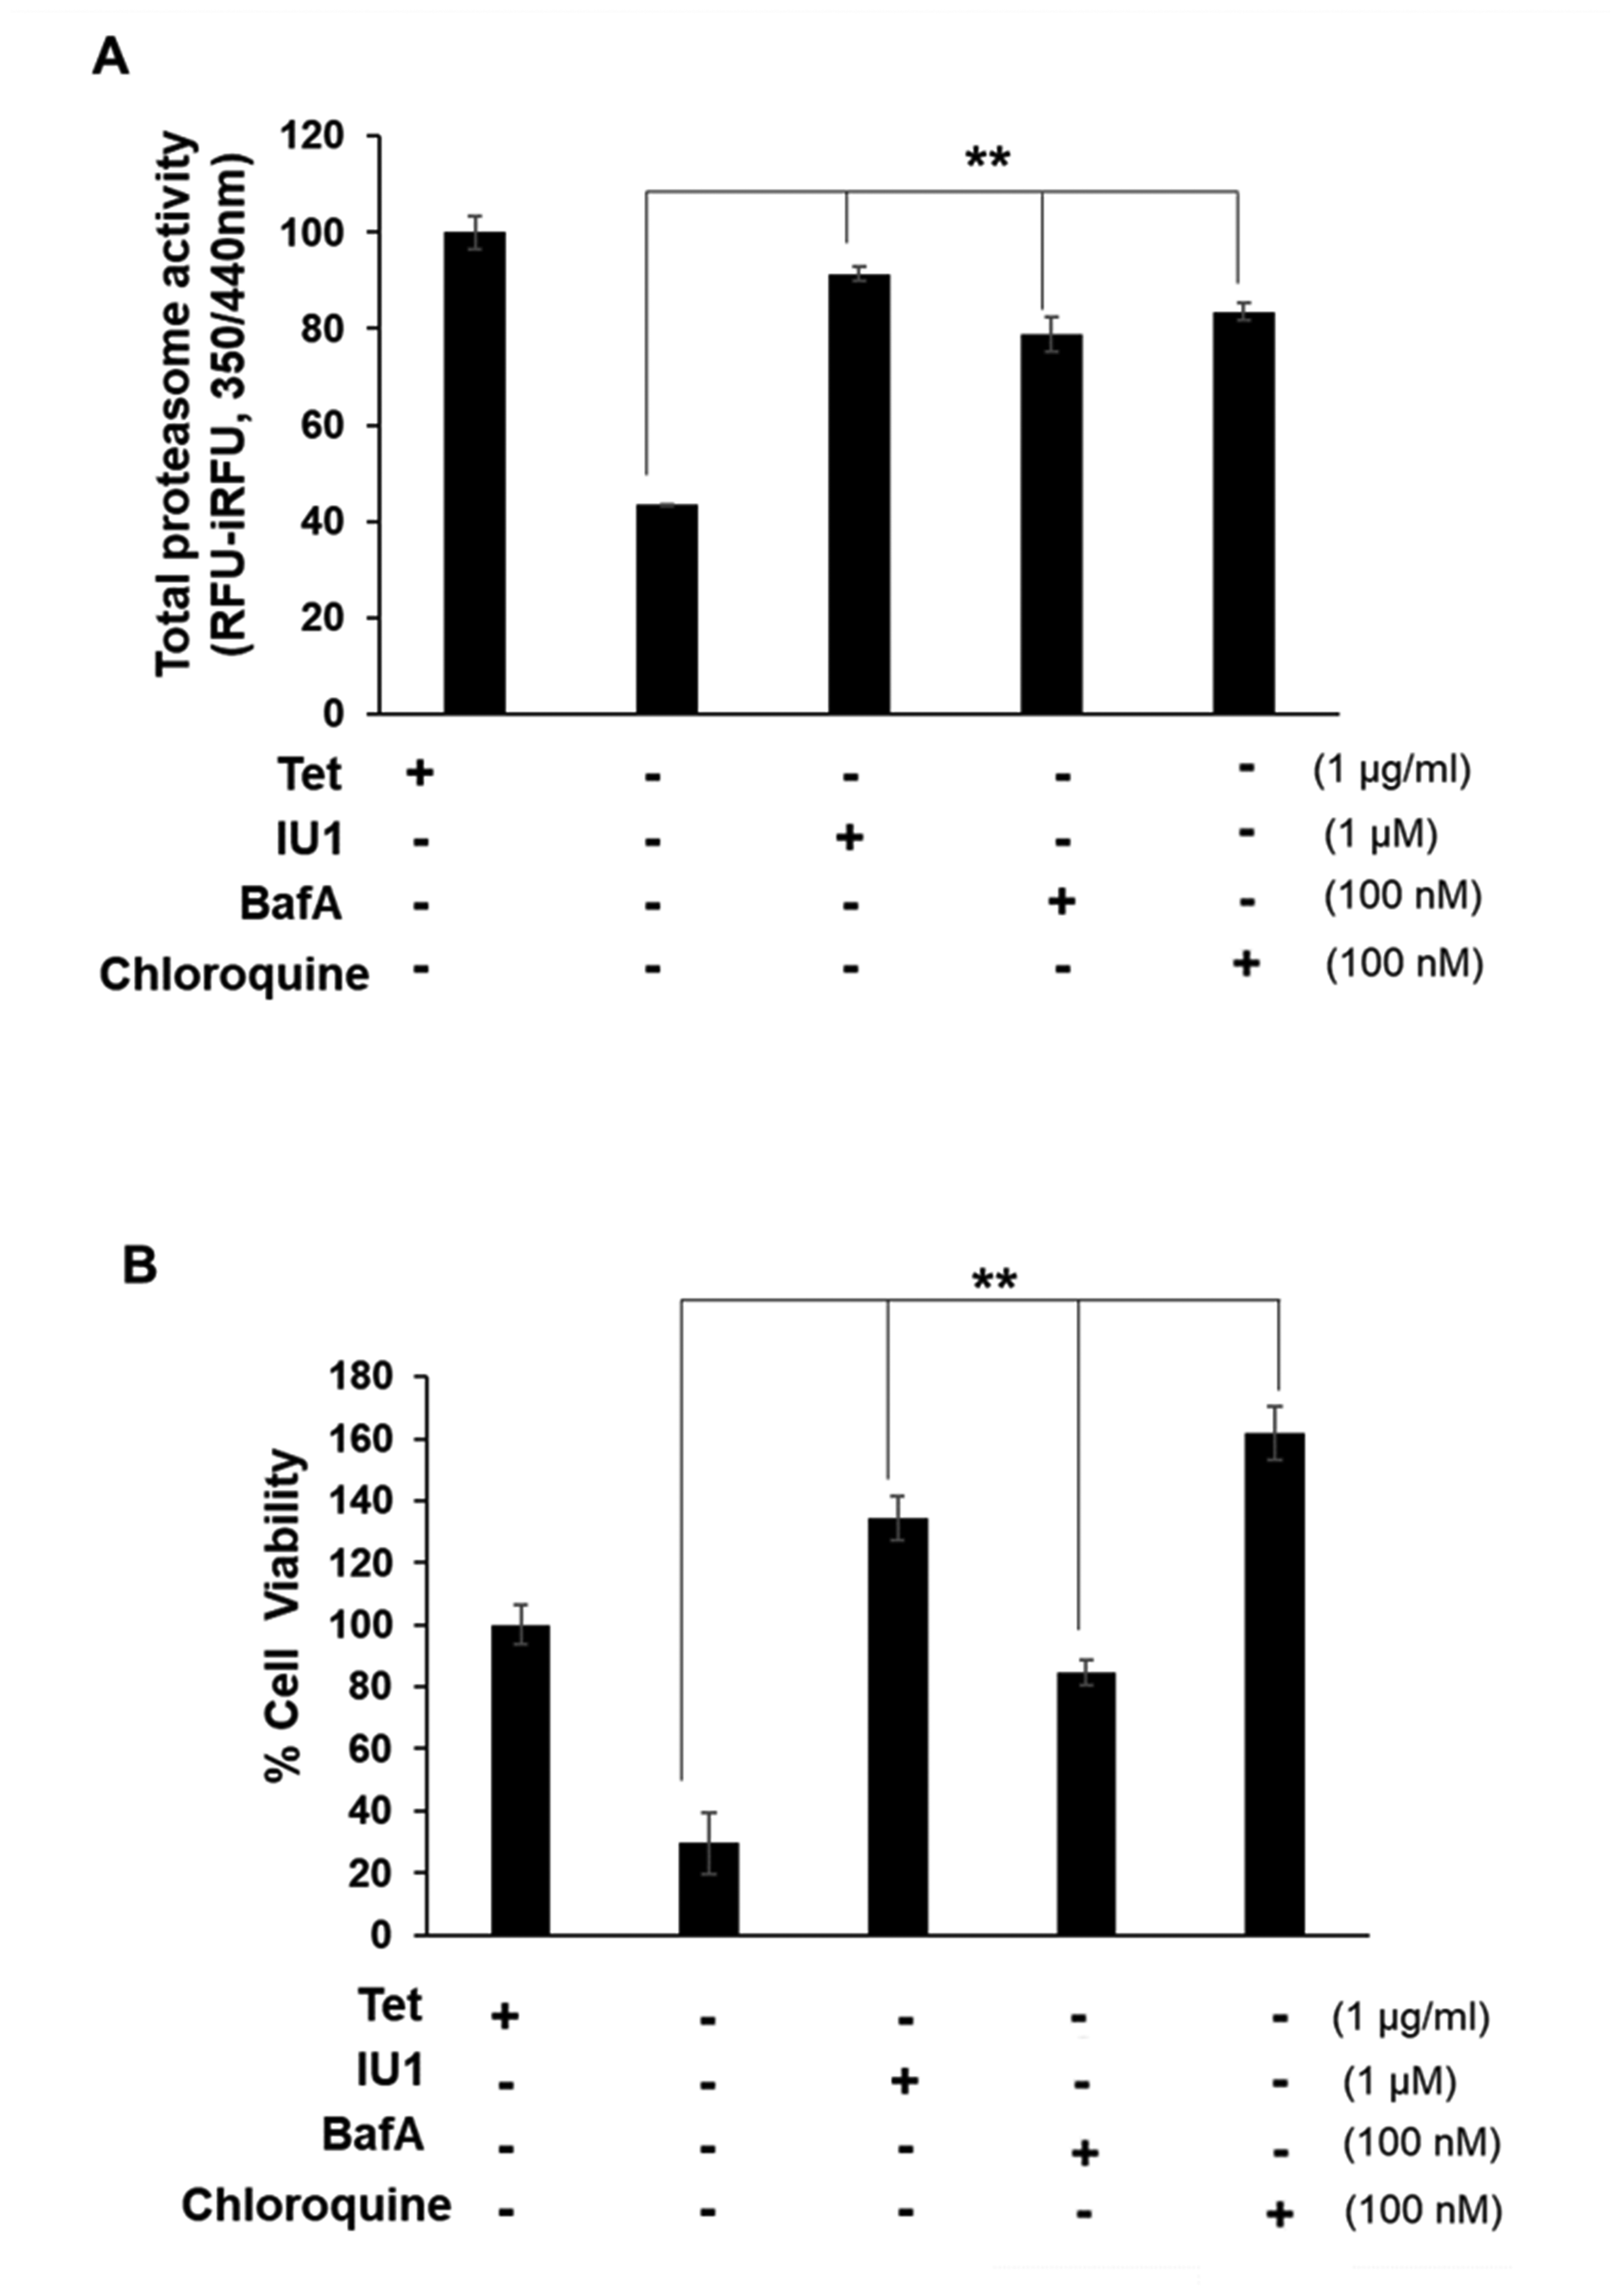
Autophagy inhibitor BafA and chloroquine increases proteasome activity and reduces cell toxicity. To assess whether autophagy inhibitors alter proteasome activity and APP-C99/Aβ mediated cell death, MC65 cells were treated with BafA (100 nM) and chloroquine (100 nM) followed by fluorescent AMC assay to quantify proteasome activity (A) and cell viability analysis (B). BafA and chloroquine treated cells showed ∼30% (**p < 0.001, n = 4) increase in proteasomal activity as compared to untreated (-Tet) (A). The cells were also analyzed for viability using the MTS assay. BafA and chloroquine treatment increased the cell viability by ∼55% and ∼130% (**p < 0.001, n = 4) respectively as compared to untreated (-Tet) (B) which correlated to the proteasome data (A). These results further support the central role of proteasome activation in APP-C99/Aβ clearance and cell survival.
Effects of autophagy activator rapamycin on Aβ and APP-C99 clearance and cell death
Our findings in Figure 2 showed that mTOR inhibitors, rapamycin, everolimus and temsirolimus promoted APP-C99/Aβ accumulation and exacerbated cell death. To further evaluate the impact of mTOR inhibitors on APP-C99/Aβ producing cells, we treated MC65 cells producing APP-C99/Aβ (-Tet) with rapamycin at increasing concentrations (10, 25, and 50 nM) (Supplemental Figure 5A). Cell viability assay revealed a dose-dependent reduction in survival, with all tested concentrations exhibiting greater toxicity than that observed in APP-C99/Aβ-producing cells (Supplemental Figure 5A). Based on these findings, the lowest concentration tested (10 nM) was selected for subsequent experiments assessing Aβ clearance.
When APP-C99/Aβ-producing cells were treated with 10 nM rapamycin, a marked increase in Aβ levels was observed compared to the control cells (+Tet) (Supplemental Figure 5B). Notably, rapamycin-treated cells also exhibited significantly higher Aβ accumulation in APP-C99/Aβ-producing cells (-Tet) (Supplemental Figure 5B). These results indicate that, under conditions of APP-C99/Aβ-induced proteostasis dysfunction, mTOR inhibitor rapamycin exacerbates both Aβ accumulation and associated cytotoxicity.
IU1 and autophagy inhibitors BafA, and chloroquine attenuate Aβ mediated neurodegeneration and lysosomal pathology in AD worm
For in vivo validation of our findings in the APP-C99/Aβ producing cell model, we used a C. elegans roundworm model of Aβ mediated neurodegeneration. Because glutamatergic neurons are highly susceptible to Aβ, we used a C. elegans model expressing Aβ with glutamatergic neuron-specific eat-4 promoter. C. elegans has five distinct glutamatergic neurons in its tail which allows accurate assessment of neurodegeneration. 51 We first evaluated if treatment with IU1, BafA or chloroquine alleviated loss of the glutamatergic tail neurons in the C. elegans model. Thapsigargin, an inhibitor of endoplasmic reticulum (ER) Ca2 + ATPase and previously reported to attenuate Aβ mediated neurodegeneration was used as a positive control. Animals were scored for neurodegeneration at day 7 post-hatching based on green fluorescent protein (GFP) fluorescence in the glutamatergic tail neurons. An animal was scored as normal if all five tail neurons were present. At day 7, only ∼33% of Aβ expressing worm (UA198) had all five normal glutamatergic neurons as compared to ∼85% in animals expressing GFP alone wild type (DA1240, WT), (Figure 9A, B). Aβ expressing animals treated with IU1, BafA, chloroquine or thapsigargin showed marked attenuation of neurodegeneration by 40–50% compared with vehicle control (Figure 9A, B).
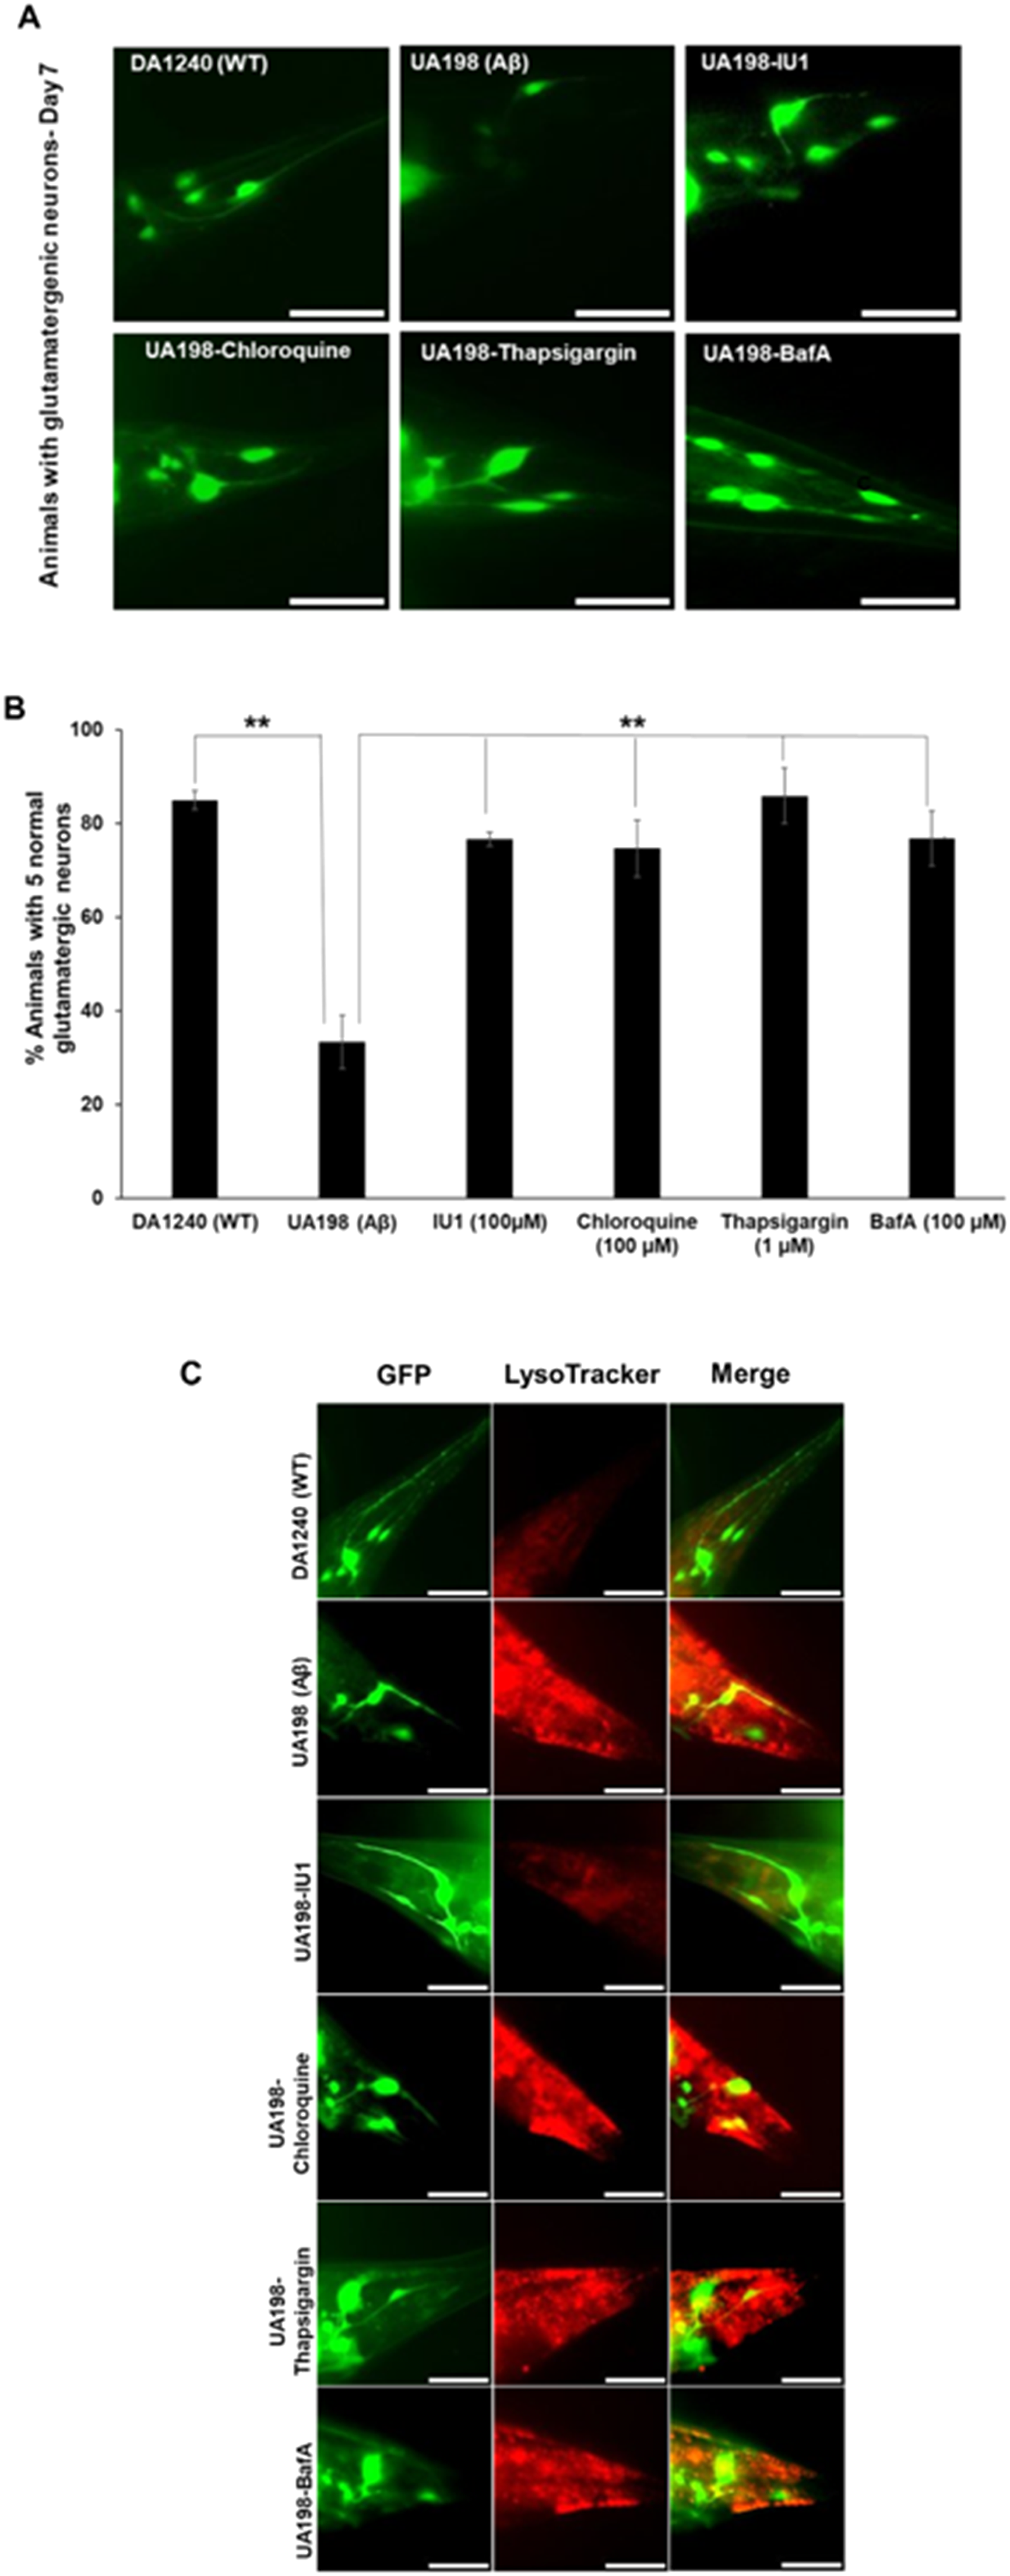
Effects of IU1 and autophagic inhibitors on Aβ toxicity and lysosomal impairment in C. elegans. The neuroprotective benefits of IU1, chloroquine, and thapsigargin were tested in Aβ-expressing C. elegans. Neurodegeneration was studied in WT (DA1240) worm, Aβ-expressing C. elegans (UA198) and treated Aβ-expressing C. elegans with IU1 (100 µM), chloroquine (100 µM), BafA (100 µM) and thapsigargin (1 µM). Neurodegeneration assay using immunofluorescence imaging. Immunofluorescence data showed WT worm DA1240, Aβ treated worms with IU1, chloroquine and thapsigargin were able to prevent degeneration of its 5 tails neurons. Aβ worm UA198 only could maintain ∼2 neurons intact after 7 days (A). Scale bar: 10 μm. Quantification of immunofluorescence data showed, percentage of worms with 5 normal glutamatergenic neurons on day 7, DA1240 with 85% (**p < 0.001, n = 60), IU1 with 77% (**p < 0.001, n = 60), BafA with 77% (**p < 0.001, n = 60), chloroquine with 75% (**p < 0.001, n = 60), and thapsigargin with 86% (**p < 0.001, n = 60) compared to UA198 with 33% (n = 60) (B). Overall, the data supports the pharmacological treatments of the Aβ producing worm UA198 clearly improved the neuroprotection of the worms against Aβ induced toxicity. LysoTracker staining was used to evaluate lysosomal function in Aβ-expressing C. elegans. WT worm DA1240, Aβ treated worms with IU1 (100 µM), BafA (100 µM), chloroquine (100 µM) and thapsigargin (1 µM) showed neuroprotection of 5 tail neurons by all groups (C). IU1 was able to maintain a baseline LysoTracker fluorescence along with the WT control (C). Scale bar: 10 µm.
LysoTracker staining was used to assess lysosomal activity and neuronal health in C. elegans expressing Aβ. Similar to AD cell model (Figure 4), the Aβ-expressing strain UA198 worm AD model exhibited markedly increased LysoTracker fluorescence compared to the WT strain DA1240, indicating elevated lysosomal activity (Figure 9C). This heightened/-/7 staining in UA198 worms was accompanied by significant neurodegeneration, with only 2 to 3 intact tail neurons observed. In contrast, UA198 worms treated with IU1 maintained all five intact tail neurons and restored back to wild type control (Figure 9C). Consistent with our findings in the AD cell model, treatment with autophagy inhibitors chloroquine and BafA, effectively preserved all five tail neurons in UA198 worms (Figure 9C). Next, Aβ levels in C. elegans were assessed using Amytracker™, which selectively binds β-sheet-rich Aβ aggregates. Consistent with our cell-based findings, Untreated Aβ producing worms exhibited markedly higher Amytracker fluorescence compared to IU1- and chloroquine-treated groups, indicating reduced Aβ burden with treatment (Supplemental Figure 9).
IU1, BafA, and chloroquine reduce behavioral impairments in AD worms
Glutamatergic tail neurons in C. elegans extends from the tail to the mid-body and control the animal's response to posterior gentle touch. 84 In worms expressing Aβ in glutamatergic neurons, this posterior gentle touch response has been reported to be defective. 51 C. elegans has also been shown to respond to a wide variety of chemical cues. 85 Notably, this model has been shown to develop avoidance behaviors in response to repellents. 85 The glycerol avoidance drop test is a commonly used assay to measure sensory behaviors. It tests the nematode's capacity to feel and avoid glycerol, a viscous fluid that causes an unpleasant reaction. As a functional readout for Aβ mediated neuronal dysfunction, we used mechanosensory touch response and avoidance assays using glycerol to evaluate the effect of IU1, BafA, chloroquine, and thapsigargin.
For the mechanosensory touch response or mechanosensation assay, the worms were stroked on the head and then on the tail, to assess response. If the worm started moving forward or stopped going backwards, it was considered a favorable reaction to mild touch sensitivity. Similar to the neurodegeneration assay, animals were scored for the touch response at day 7 post-hatching. The WT worm showed an average reaction rate of 92%, whereas only 75% of the Aβ worm exhibited a response to the touch (Figure 10A). Aβ worms showed a modest but significant defect in touch response similar to previous reports. 51 IU1, chloroquine, or thapsigargin exhibited a significant improvement of ∼10% in touch response (Figure 10A). Unlike the mechanosensation assay, the Aβ worms displayed a marked defect in avoidance behavior.
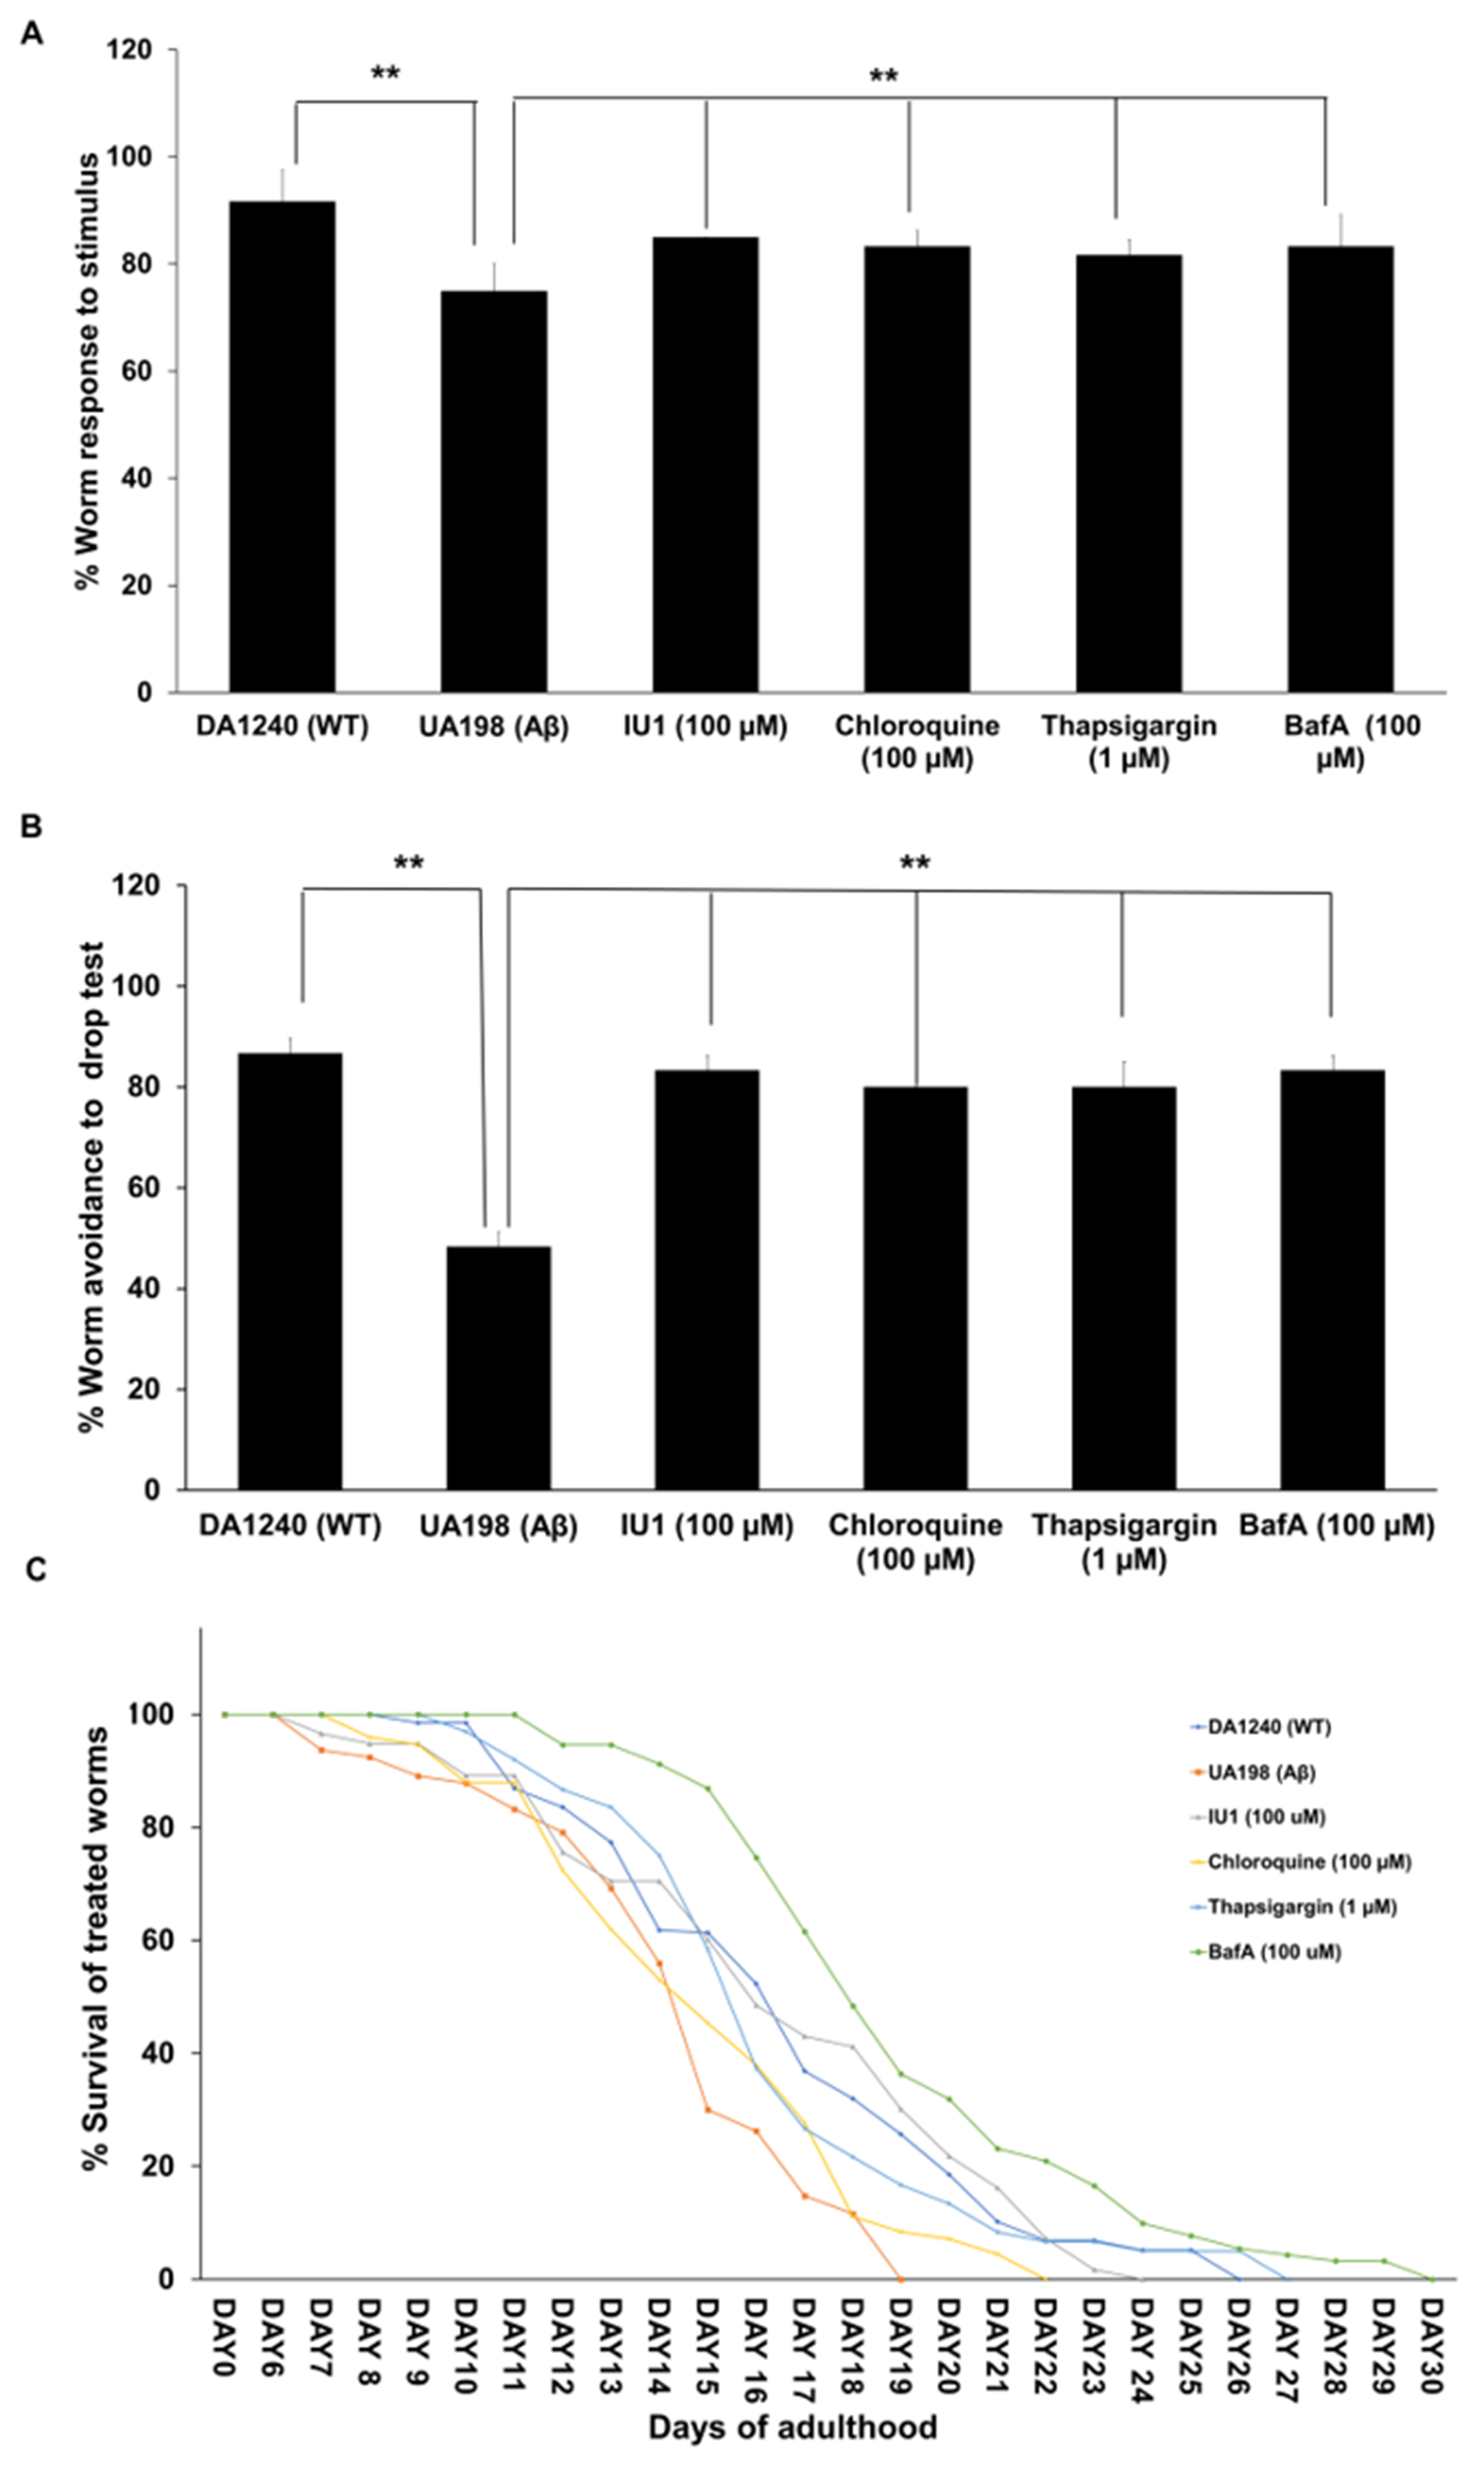
Improved lifespan and behavioral responses on treatments with IU1, BafA and chloroquine on Aβ-expressing C. elegans. The neuroprotective benefits of IU1, BafA, chloroquine, and thapsigargin were tested in Aβ-expressing C. elegans. Mechanosensation, drop test and lifespan was analysed in WT (DA1240) worm, Aβ-expressing C. elegans (UA198) and treated Aβ-expressing C. elegans with IU1 (100 µM), BafA (100 µM), chloroquine (100 µM), and thapsigargin (1 µM). Mechanosensation assay showed the WT control worm DA1240 strain with the greatest mechanosensation reactions, with an average reaction rate of 92% (**p < 0.001, n = 60), whereas the UA198 strain (Aβ control) displayed a reduced response rate of 75% (n = 60) (A). Worms expressing Aβ and administered pharmacological treatments with IU1, BafA, chloroquine, or thapsigargin exhibited substantial alleviation of the mechanosensory impairment, with response rates of 85% (**p < 0.001, n = 60), 83% (**p < 0.001, n = 60), 83% (**p < 0.001, n = 60), and 82% (**p < 0.001, n = 60), respectively in comparison with UA198 (A). Glycerol avoidance drop test produced an average reaction rate in control worms DA1240 of 87% (**p < 0.001, n = 60), IU1 of 83% (**p < 0.001, n = 60), BafA of 83% (**p < 0.001, n = 60), chloroquine of 80% (**p < 0.001, n = 60), and thapsigargin of 80% (**p < 0.001, n = 60) in comparison to UA198 strain with a much less response rate of 48% (n = 60), indicating considerable sensory loss (B). Lifespan studies on C. elegans treated with IU1, BafA, chloroquine and thapsigargin showed a 4, 11, 3 and 8 days increased lifespan respectively, longevity improvement over untreated control worms UA198 therefore highlighting IU1, BafA, chloroquine and thapsigargin neuroprotective ability (C). The results indicate IU1's involvement in reducing Aβ toxicity in glutamatergic neurons. Also, the 3 autophagy inhibitors suggest a complicated relationship between ER stress, lysosomal function and autophagy in modifying Aβ toxicity (A-C). The WT worm DA1240 showed an increase in lifespan of about six-days (C). Overall, the data supports the pharmacological treatments of the Aβ producing worm UA198 clearly improved the neuroprotection and behavioral responses of the worm against Aβ induced toxicity.
WT worms showed high sensitivity to glycerol where 87% of animals exhibited a strong repulsion when exposed to it (Figure 10B). In comparison, only 48% of Aβ worms showed a response to glycerol, indicating the profound detrimental effect of Aβ on the chemosensory processes (Figure 10B). Consistent with the findings from neurodegeneration and mechanosensation assays, IU1, BafA and chloroquine improved glycerol avoidance in the Aβ worm by 35–40% which was almost equivalent to the response observed in WT worms (Figure 10B).
IU1, BafA, and chloroquine enhance survival in AD worms
C. elegans is a powerful in vivo platform for exploring age related neurodegeneration and survival of the whole organism. In addition to behavioral deficiencies, Aβ mediated glutamatergic neuronal dysfunction has been reported to affect the animal survival with aging. Compared to WT, animals expressing Aβ have significantly reduced survival rate, suggesting a relationship between glutamatergic neurodegeneration and aging in the C. elegans model. Extending our findings from the neurodegeneration and behavioral assays, we examined if IU1, BafA and chloroquine improved survival of the Aβ worm. Survival of Aβ worms was reduced by ∼7 days (100% death by day 19) as compared to WT worms (100% death by day 26) (Figure 10C). Aβ worms treated with IU1 or chloroquine showed a modest but significant improvement in survival by ∼3 days (Figure 10C). Positive control thapsigargin enhanced survival of Aβ worms by ∼8 days (Figure 10C). Notably, BafA treatment resulted in the greatest lifespan extension, improving survival by ∼11 days (Figure 10C). Overall, these results above align with the cell-based studies and provide proof of concept to the neuroprotective effects of IU1 and autophagy inhibitors BafA and chloroquine in AD. Our findings show evidence to suggest that downregulating autophagy can have significant neuroprotective and behavioral benefits in AD.
Inhibition of the proteasome with MG132 eliminates the neuroprotective benefits conferred by IU1 and chloroquine in the C. elegans AD model
To determine whether the neuroprotective effects of IU1 and chloroquine depend on proteasomal activity, we incorporated MG132, a well-established proteasome inhibitor, into our experimental. MG132 treatment effectively blocked proteasomal function, worms when co-treated with MG132, the neuroprotective effects of IU1 reduced from 76% to 59% and chloroquine from 72 to 46% (Figure 11A). MG132 also prevented the behavioral benefits attained by both drop test and mechanosensation assay. In mechanosensation assay the protective effect dropped from 86% to 36% for IU1 and 80% to 50% for chloroquine (Figure 11B). The drop test protective effect of IU1 dropped from 82%to 63% and chloroquine by 78% to 60% (Figure 11C), demonstrating that both compounds require an intact proteasome to exert their beneficial actions. This confirms that proteasomal pathways play a critical mechanistic role in mediating Aβ clearance and neuroprotection in our C. elegans model, consistent with observations from the MC65 cell model.
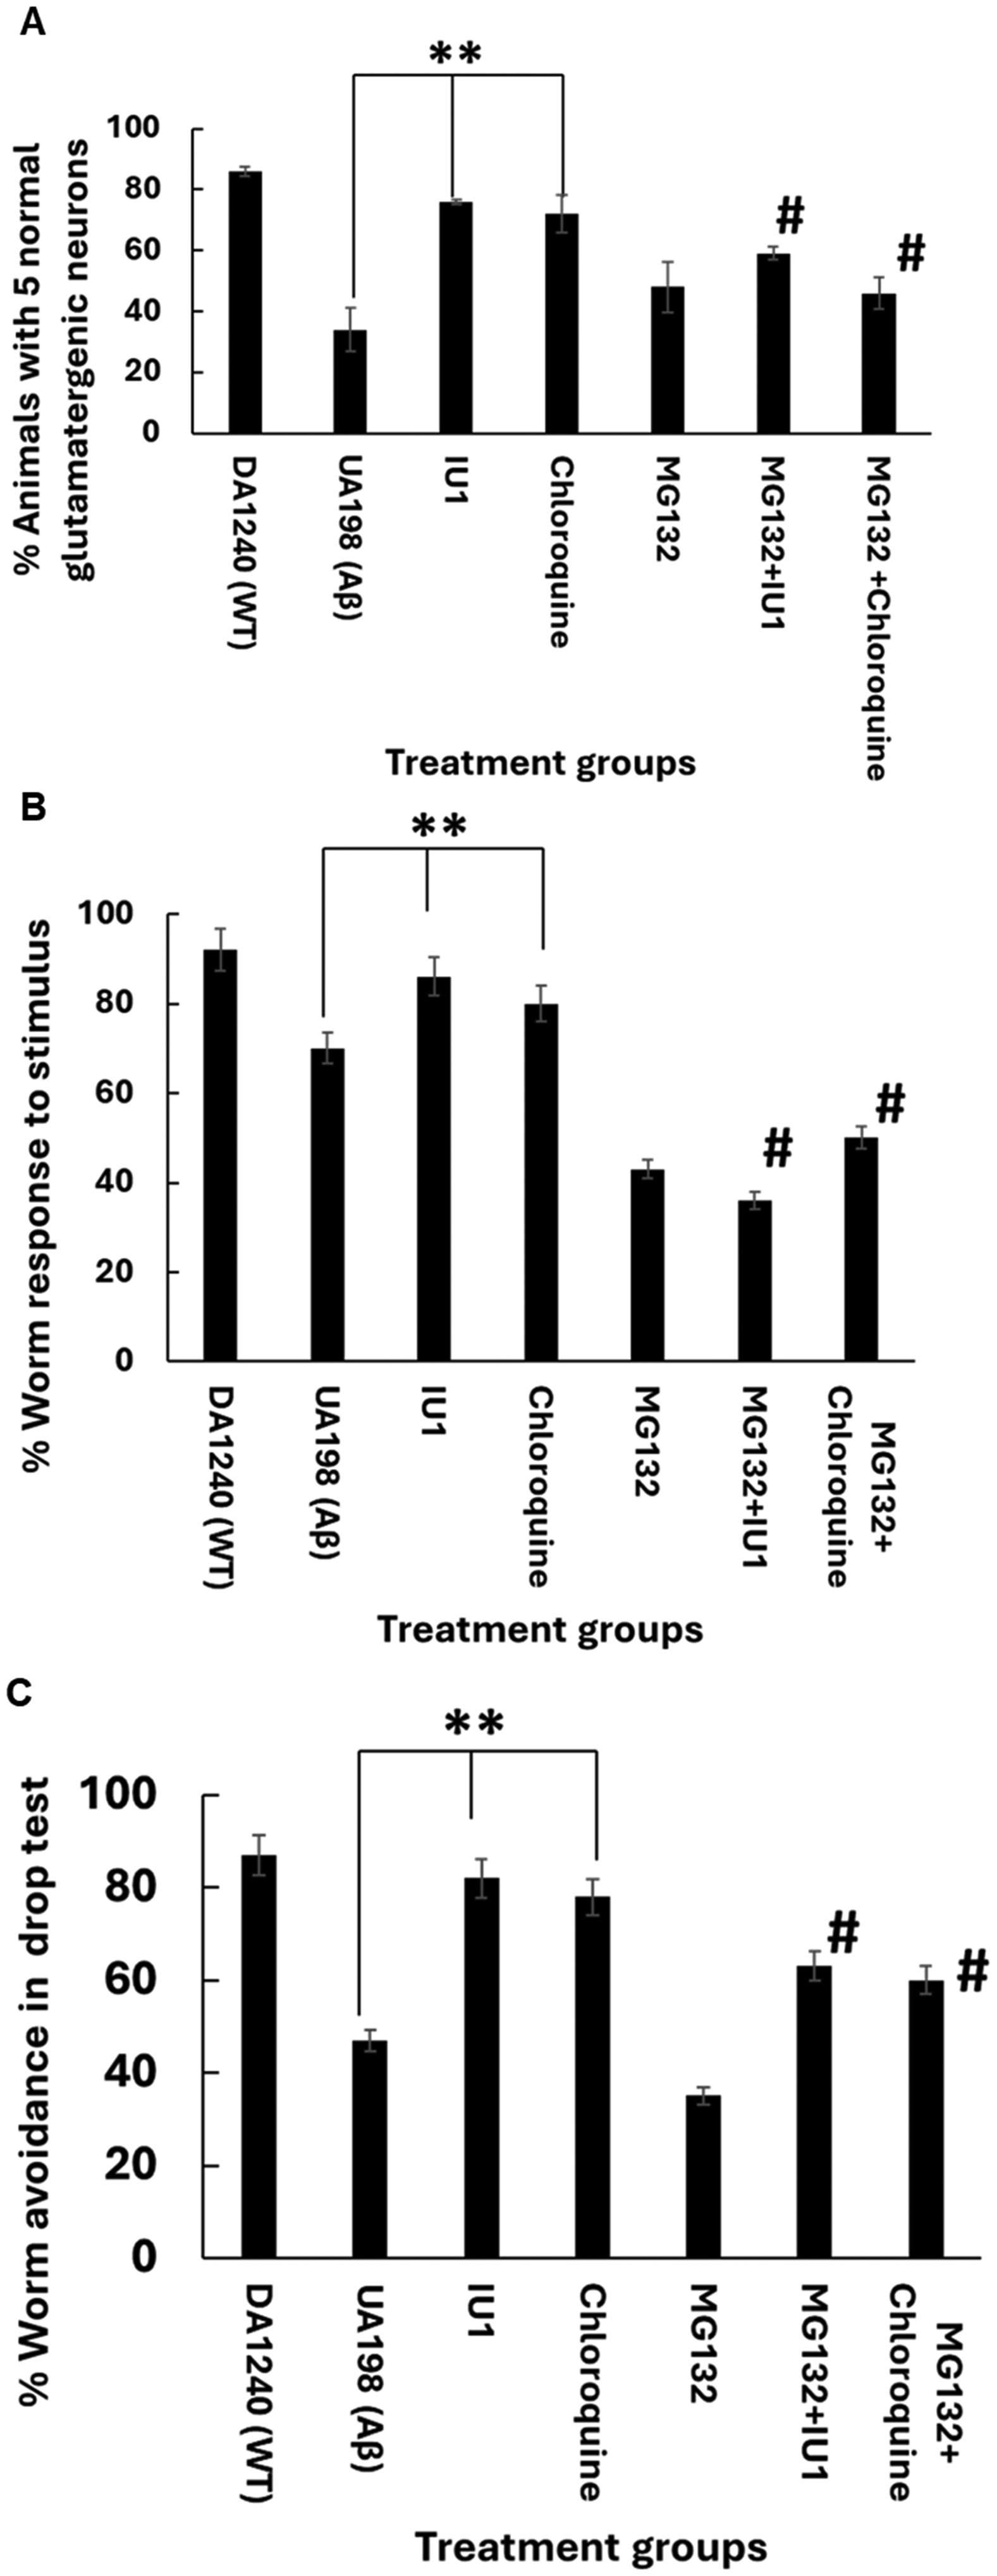
Proteasome inhibition abolishes IU1- and chloroquine-mediated neuroprotection in the C. elegans AD model. (A) Co-treatment with the proteasome inhibitor MG132 significantly attenuated the neuroprotective effects of IU1 and chloroquine in Aβ-expressing worms. Survival/neuronal protection was reduced from 76% to 59% for IU1 and from 72% to 46% for chloroquine in the presence of MG132. (B-C) MG132 also abolished behavioral improvements conferred by IU1 and chloroquine, as assessed by the drop test and mechanosensation assays. In the drop test, protection decreased from 82% to 63% for IU1 and from 78% to 60% for chloroquine. In the mechanosensation assay, protection was reduced from 86% to 36% for IU1 and from 80% to 50% for chloroquine. (**p < 0.001, #p < 0.0001, n = 60).
Discussion
This study has identified IU1, a USP14 inhibitor, as a potent small molecule that reduces Aβ toxicity by restoring proteasomal and lysosomal function in APP-C99/Aβ-expressing MC65 cells with impaired proteostasis. IU1's neuroprotective effects were further validated in a C. elegans worm model of Aβ-induced neurodegeneration, highlighting its potential as a therapeutic candidate for AD. Remarkably, autophagy activators including mTOR inhibitors exacerbated APP-C99/Aβ accumulation and cell death, whereas autophagy-lysosomal inhibitors such as Bafilomycin A and chloroquine reduced protein accumulation and improved cell survival.
Autophagy is generally considered a pro-survival mechanism and activation of this pathway is neuroprotective. 86 However, studies have also shown that excessive activation of autophagy can be associated with promotion of cell death 87 and neuronal excitotoxicity.88–90 Evidence till date shows that autophagy activation via mTOR inhibition shows benefits only if intervention is commenced before or early in the appearance of AD pathological hallmarks.91,92 Some studies have even shown evidence for the benefits of autophagy inhibitors in AD. For example, Galantamine, an anti-cholinesterase inhibitor and approved treatment for AD, demonstrates neuroprotective effects by inhibiting Aβ-induced cytostatic autophagy. The authors suggested that the antioxidant effects of this compound reduced autophagy activation. 93 BafA significantly attenuated cerebellar granule neuron death resulting from agents that disrupt lysosome function.94,95 Low-dose BafA significantly attenuated SH-SY5Y cell death mediated by chloroquine, hydroxychloroquine, amodiaquine and staurosporine, which may be due to the reduction in accumulation of toxic aggregates. Furthermore, our findings using in vivo model C. elegans support the in vitro studies, demonstrating that chloroquine and BafA, confer neuroprotection against Aβ mediated toxicity. 8 In addition, BafA dose-dependently attenuated dopaminergic neuron death in C. elegans resulting from in vivo over-expression of human wildtype α-synuclein. 82 It also decreased the levels of α-synuclein oligomers, by restoring autophagic flux and promoting lysosomal degradation. 82 Autophagy inhibitor BafA has also been reported to block ferroptosis, a type of apoptotic cell death 96 and alleviate hypoxic/ischemic brain injury in mice.97–99
When compared to autophagy, activating the proteasome to remove damaged and aggregated proteins has received little attention. Most proteasome substrates are targeted for degradation by the covalent attachment of ubiquitin moieties (Ub), which are recognized by the proteasome depending on the type of ubiquitin code. 70 The length of ubiquitin chains is modulated by deubiquitinating enzymes (DUBs), which act to cleave Ub from substrates and control the levels of ubiquitinated proteins. DUBs are a large group of proteases, most of which are part of the USP/UBP superfamily including the Ub-specific protease 14 (USP14). USP14 is a unique DUB as compared to the others in the family and acts to trim lysine 48-linked polyubiquitin chains and negatively regulate proteasome activity. 70 Several deubiquitinating enzymes (DUBs) have been identified as inhibitors of Aβ or tau degradation by removing ubiquitin tags.72,100 An inhibitor of human USP14 is IU1, a small-molecule allosteric inhibitor which selectively abrogates the catalytic activity of USP14, while not affecting its non-catalytic regulatory function. 70 IU1 has been demonstrated to be capable of reducing neurotoxic protein aggregation including tau, TDP-43, ATXN3, and glial fibrillary acidic protein.70,72,76 Supporting the in vitro findings, our in vivo C. elegans studies on IU1 treatment reduced Aβ mediated neurodegeneration and improved behavior deficits and lifespan. Although IU1 has been shown to reduce neurotoxic protein accumulation, 101 Amgen and AstraZeneca have published negative in vitro data on IU1 in neurodegenerative models.75,102,103 One of the main contributing factors underlying this conflicting data maybe due to IU1 binding affinity with USP14 and its potential off-target effects, such as inhibiting mitochondrial complex 1. Therefore, exploration of improved IU1 analogs and USP14 inhibitors and other ubiquitin binding sites is necessary for effectively blocking USP14 catalytic activity and explore their efficacy in higher in vivo models
Conclusions
Our findings here provide the first in vitro and in vivo evidence of the neuroprotective effects of IU1 against APP-C99/Aβ pathogenesis in AD. In summary, this study proposes that IU1 and USP14 inhibitors have significant therapeutic value for the treatment of AD and other conditions with dysfunctional proteostasis. USP14 is also one of the best-characterized DUBs, where multiple high-resolution crystal structures are known. 104 These characteristics have important implications for developing improved IU1 analogues and for the exploration of other potential sites for USP14 inhibition as therapeutic targets against neurodegeneration.
Supplemental Material
sj-docx-1-alz-10.1177_13872877261422775 - Supplemental material for USP14 inhibitor IU1 alleviates amyloid-β mediated toxicity in Alzheimer's disease cell and worm models
Supplemental material, sj-docx-1-alz-10.1177_13872877261422775 for USP14 inhibitor IU1 alleviates amyloid-β mediated toxicity in Alzheimer's disease cell and worm models by Ajish Ariyath, Eugene Hone, W. M. A. D. Binosha Fernando, Steve Pedrini, Ralph Martins and Prashant Bharadwaj in Journal of Alzheimer's Disease
Footnotes
Acknowledgements
We acknowledge the support of NH and MRC-ARC dementia research development fellowship to PB (APP1107109). We are grateful to Laura A. Berkowitz, Ph.D, Lab manager from Caldwell Laboratory, University of Alabama for providing the C. elegans DA1240 and UA198 strain used in this study.

Ethical considerations
All the research conducted in this study is covered under ECU Human Research Ethics Committee (HEC) approval and Project Number 14820. The study was performed in accordance with the National Statement on Ethical Conduct in Human Research, Australia (2018 updated).
Consent to participate
Not applicable.
Consent for publication
Not applicable.
Author contribution(s)
Funding
The authors disclosed receipt of the following financial support for the research, authorship, and/or publication of this article: PB received funding from NH and MRC-ARC dementia research development fellowship (APP1107109) for this study.
Declaration of conflicting interests
The authors declared no potential conflicts of interest with respect to the research, authorship, and/or publication of this article.
Data availability statement
All data generated or analyzed during this study are included in this published article and its supplemental material.
Supplemental material
Supplemental material for this article is available online.
References
Supplementary Material
Please find the following supplemental material available below.
For Open Access articles published under a Creative Commons License, all supplemental material carries the same license as the article it is associated with.
For non-Open Access articles published, all supplemental material carries a non-exclusive license, and permission requests for re-use of supplemental material or any part of supplemental material shall be sent directly to the copyright owner as specified in the copyright notice associated with the article.
