



Abstract
Background
Dementia prevalence is increasing in Australia. It is unknown whether there are hotspots for dementia in metropolitan or non-metropolitan areas. This knowledge is important for healthcare planning.
Objective
This paper will examine where hotspots for self-reported dementia in Australia are, and whether they are adequately serviced by multidisciplinary memory clinics.
Methods
We used self-reported dementia data from the 2021 Australian Census at the local government area (LGA) level. LGAs represent public administrative regions within Australian states and territories. Standardized prevalence ratios (SPR) were calculated for each LGA by dividing the number of self-reported cases by the expected number of cases. Spatial relationships were investigated with Bayesian spatial regression using integrated nested Laplace approximations. Memory clinics were located using Australian Dementia Network and government websites.
Results
Self-reported dementia prevalence was lower in metropolitan areas (72.3 per 10,000) compared to non-metropolitan areas (79.9 per 10,000). There are 108 multidisciplinary memory clinics in Australia, 83 of which are metropolitan. Hotspots for self-reported dementia occurred in non-metropolitan east coast of New South Wales (SPR: 2.13), southeast Queensland (SPR: 1.72), and northwest of greater city Adelaide (SPR: 2.55). LGAs in major cities had lower SPRs (Melbourne: 0.40; Sydney: 0.45), apart from Western Adelaide (SPR: 1.88).
Conclusions
Hotspots for self-reported dementia were mainly in non-metropolitan Australia, whereas memory clinic services were mostly in metropolitan areas, raising issues of equity and access to services.
Keywords
Introduction
Dementia has significant socioeconomic impacts for patients, family, and health care services. In 2023, 411,100 Australians are estimated to have dementia. 1 Due to an aging population, the number of people living with dementia is increasing. 1 By 2050, 928,000 Australians are predicted to have dementia and the costs of dementia in Australia are estimated to be $33.6 billion AUD. 2
Diagnosis, management, and treatment of dementia is often performed in memory clinics, which are specialized multidisciplinary services for patients with cognitive impairment. Memory clinics have also been identified as possible sites for specialists to implement interventions for at risk individuals to prevent dementia, including identification of patients for access to new therapies.3,4 Delays in diagnosis of dementia can lead to poorer health outcomes. 5 A survey of 60 dementia clinics in Australia found an overwhelming picture of long waiting times and low post-diagnostic support. 6 As such, it is not clear if the current number and locations of memory clinics meet the needs for all Australians, particularly those living in rural areas or areas of low socioeconomic index.
There is little knowledge about the relation of existent memory clinic services to the location of dementia hotspots in Australia. In this study, we leverage the open data provided by Public Health Information Development Unit (PHIDU) to investigate regional differences across Australia for prevalence of self-reported dementia, find hotspots, and map the distribution of known memory clinic services in relation to these hotspots. Knowledge of prevalence will help with broadly estimating service and resource requirements whereas the hotspot analysis determines if there are reasons for the higher-than-expected number of cases so that services can be better targeted.
Methods
Setting
Australia has a population of over 25 million people. 7 It is comprised of three states on the East coast (New South Wales, Victoria, and Queensland), one in the West (Western Australia), two in the South (South Australia and the island state of Tasmania), and two territories (Australian Capital Territory and the Northern Territory).
Regions in Australia can be grouped into seven categories using the Modified Monash Model, with each category representing a different degree of remoteness or rurality. 8 Very Remote Communities is the largest by size, and is spread over northern, western and central Australia. On the other hand, the Metropolitan Areas category consists of major cities mainly located along the southern and eastern coasts of the mainland, while regional centers are areas that are within 20 kilometers of a town containing at least 50 thousand people. Whether a city is a metropolitan area or a regional center is dependent on the area's accessibility to goods and services. For example, Darwin and Hobart, the capital cities of the Northern Territory and State of Tasmania, respectively, are considered to be regional centers rather than metropolitan areas by the Modified Monash Model 8 . This is because these cities are geographically isolated from other large population centres. 8
The states and territories are further divided into 547 Local Government Areas (LGA), each representing a public administration region within an Australian state and territory. 7 Multiple LGAs may belong to the same local health network. For example, the South East Public Health Unit in Victoria covers 11 LGAs. 9 Our study used areal unit data, where the data for each LGA represents an aggregate count over a bounded region, rather than individual patient data.
Data sources
In this study, we sourced the number of people with self-reported dementia in each LGA from PHIDU, which was derived from the 2021 Australian Census. 10 Since a dataset showing the prevalence of dementia in each Modified Monash Model category is not publicly available, we also collected self-reported dementia data at the statistical areas 1 (SA1) level, from the Australian Bureau of Statistics (ABS). 7 These are the smallest regions with data publicly available, and each have a population of around 200 to 800 people. For privacy reasons, SA1 s with less than 3 people with self-reported dementia were suppressed in the ABS dataset. 7 The number of people with self-reported dementia in suppressed SA1 s was calculated by subtracting the number of people with self-reported dementia in non-suppressed SA1 s from the total number of self-reported dementia in Australia, as per the 2021 Australian Census. We then allocated these individuals to suppressed regions using a constrained randomization method such that these suppressed SA1 could take values of 0, 1, or 2. This method was used until the total number of people with self-reported dementia in each SA1 was the same as the total number of self-reported dementia in the 2021 Census data. 11 We then combined each SA1 to find the prevalence of self-reported dementia in each Modified Monash Model category.7,8
The locations of memory clinics were from the Australian Dementia Network, along with state and territory government health websites.12–15 These clinics were then plotted and classified by location based on the Modified Monash Model. 8 In this paper, we considered a memory clinic to be metropolitan if the clinic address was located in a metropolitan area. Other clinics in regional and remote areas were considered non-metropolitan.
We sourced age and sex data, and self-reported health measurements (diabetes, heart disease, kidney disease, lung disease, mental health and stroke) from PHIDU. 10 The PHIDU data also contains information about the number of general practitioners in each LGA. Income data from 2021 for each LGA was sourced from the ABS. 7 Shapefiles, which show the boundaries of each LGA, were also obtained from the ABS. 7 Residential aged care services data was obtained from the Australian Institute of Health and Welfare. 16
Statistical analysis
Because LGAs vary in population size, a high number of self-reported cases may reflect a larger population, as opposed to other variables. To investigate whether an LGA has a higher number of raw cases than expected for its population, we calculated standardized prevalence ratios for self-reported dementia (SPR). 17 Firstly, the expected number of cases for an LGA was determined by multiplying the self-reported dementia prevalence across Australia by the LGA's population. The raw number of people with self-reported dementia in that LGA was then divided by the expected number of cases to yield the SPR. In this paper, we defined a hotspot to have an SPR ≥ 1.5, as there is no formal definition.
In spatial data, it cannot be assumed that observations are independent of one another, since neighboring regions may influence each another. 17 To investigate the presence of spatial autocorrelation over the entire data, we calculated the Global Moran's I. 18 A non-zero Global Moran's I value indicates that the SPRs are not randomly dispersed across Australia. For example, a positive Global Moran's I suggests that clustering is present in the data. Meanwhile, a negative value indicates that the SPR for each LGA is dissimilar to its neighbors. In this situation, LGAs that have a high SPR are surrounded by LGAs with a low SPR.
To account for spatial relationships between LGAs, we used models that had a spatial component in our analysis, where regions are weighted such that neighboring regions have a greater influence compared to regions further away. 17 We defined LGAs as neighbors of one another by using a Queen's movement in chess, where two LGAs that share any border were neighbours. 19 Our study used Integrated Nested Laplace Approximation (INLA) for spatial regression as it is faster than other Bayesian methods such as WinBUGS. 20 In this study we explored several spatial models as each model has its own strengths and weaknesses. The best model was one with the lowest Deviance Information Criterion (DIC) and Watanabe-Akaike Information Criteria (WAIC) values. 21
The simplest model used was the Fixed Effects Model, where the covariates are the only parameters estimating the SPR. Next, the Random Effects Model, includes an additional component to account for noise in the data. The third model is the Besag Model, which considers the effect of neighbors when estimating the SPR in an LGA. 17 The Besag, York, and Mollié (BYM) Model, extends the former model by considering both noise and the effect of neighbors on the SPR. 17 The Leroux Model is an alternative model that shows whether the SPR in different LGAs is mainly due to effect of their neighbors, or due to random noise. 22 The final model is the Spatial Lag Model, which uses the outcomes of neighbors directly as a parameter to account for the influence of neighboring LGAs. 23
Feature selection
To select which variables (age, sex, health measurements, general practitioners, medical specialists, and income) were used in the final models, we used genetic algorithms. 24 Genetic algorithms are a machine learning method based on ideas from natural selection and survival of the fittest. The algorithm generates new models by randomly adding or removing variables from the original models. The new models are then measured for how well they predict the SPRs of LGAs. Models with a poorer performance are removed, while those that perform better than the original models are kept. Over time, as new generations of models are created, they become better at predicting SPRs until an optimal model is produced. In this paper, the root mean square error (RMSE) was used to measure the fitness of each model.
Sensitivity analysis: areal unit problem
LGAs represent divisions of public administration and can vary in population size. For example, while some LGAs such as Brisbane have over a million people, others, such as the Shire of Peppermint Grove in Western Australia only have 1600 people. 10 This can be a potential problem when trying to identify hotspots since the SPR is dependent on the number of cases and the population within the LGA. Having a few more cases than expected in a smaller LGA will have a larger influence over the SPR compared to a larger LGA. As such some smaller LGAs with a high SPR may not represent regions of self-reported dementia hotspots. 25 In addition, the modifiable areal unit problem states that since the boundary of each LGA is arbitrary, shifting the LGA boundaries may result in the SPR changing. 25 To account for these issues, we merged neighboring LGAs that had a population below a predetermined threshold (10,000, 25,000, 50,000, 100,000) as a sensitivity analysis. As a result, the newly created regions have much larger populations, minimizing the effect of this problem. 26
Another issue is that the prevalence of dementia increases with the age of the population. 27 Thus, a high dementia prevalence in a region may reflect an older population, as opposed to other variables. To address this, our study also performed a separate age standardized analysis to investigate if there were hotspots in Australia where other variables may be influencing a high self-reported dementia prevalence. This was done by dividing the number of cases per person over the age of 65 years in each region by the average number of people with self-reported dementia per person aged 65 and above across Australia. To address the modifiable areal unit problem, neighboring LGAs were merged such that each region had a population of at least 100,000. 25
In addition, cases may be concentrated in residential aged care facilities (long-term care facilities, nursing homes). As a result, LGAs with more residential aged care facilities may have a higher-than-expected number of people with self-reported dementia. For this reason, we performed a separate analysis where the SPR for each LGA was standardized based on how many residential places each LGA had in their aged care facilities.
The R programming language (version 4.2.1) was used for the analysis.
Results
Self-reported dementia prevalence by rurality
The prevalence of self-reported dementia was higher in non-metropolitan areas (79.9 per 10,000 people) compared to metropolitan areas (72.3 per 10,000 people) (Table 1). This difference was found to be statistically significant (p-value < 0.01) when using a two-proportions Z-test. When looking at each Modified Monash Model category individually, metropolitan areas had a similar prevalence of self-reported dementia to regional centers (73.3 per 10,000 people). However, both categories had a lower prevalence compared to large rural towns (92.7 per 10,000 people) and medium rural towns (95.5 per 10,000 people). The number of people with self-reported dementia per residential places at aged care services was higher in metropolitan areas (0.851) compared to non-metropolitan areas (0.840). This difference was found to be statistically significant (p-value < 0.01).
Memory clinics and prevalence of self-reported dementia by remoteness.
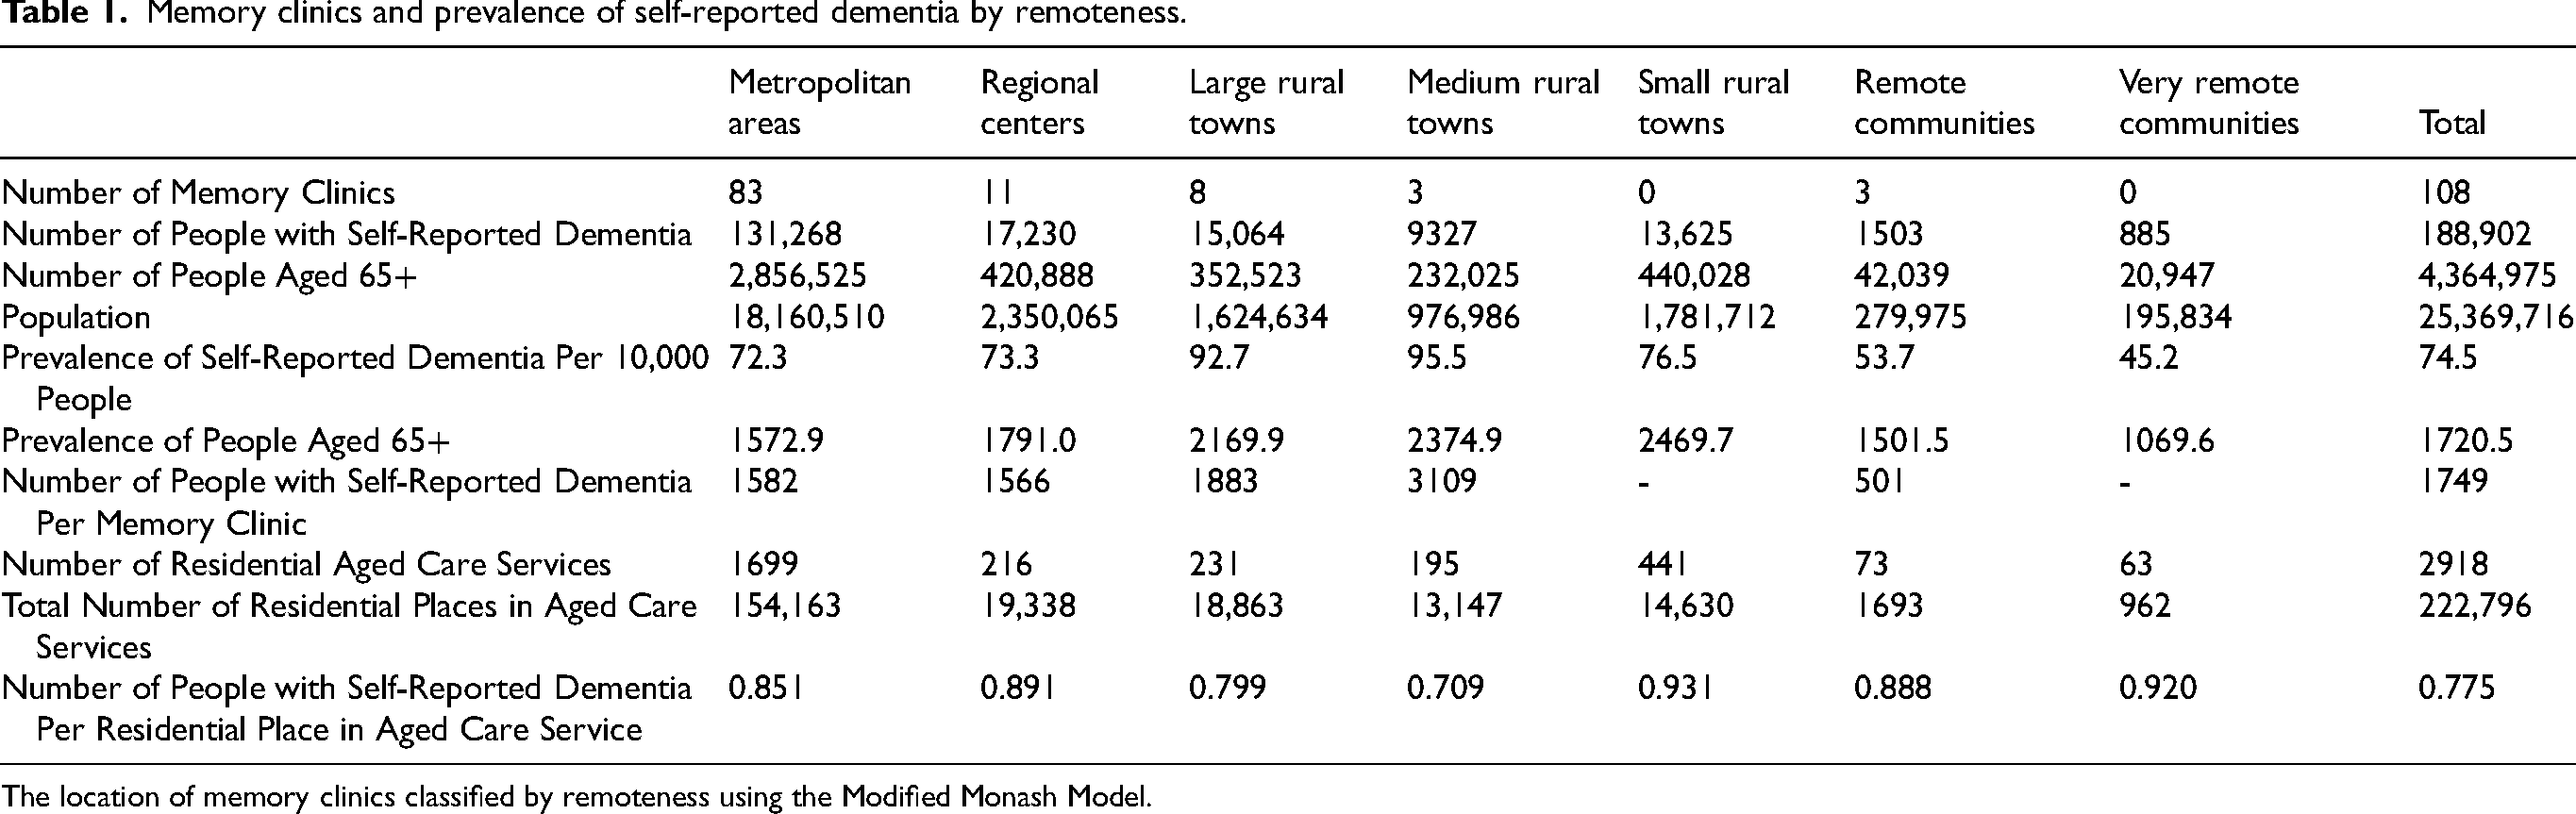
The location of memory clinics classified by remoteness using the Modified Monash Model.
Standardized prevalence ratios (hotspot analysis)
There were 67 LGAs that were hotspots for self-reported cases. These included LGAs located in non-metropolitan areas such as the east coast of New South Wales (Mid-Coast: 2.13; Nambucca Valley 1.83), South-East regions of Queensland (Fraser Coast: 1.58; North Burnett 1.72), and the rural area northwest of Adelaide (Barunga West: 2.55; Port Pirie 1.87) (Figure 1). LGAs within metropolitan Adelaide were also noted to have more cases than expected (Holdfast Bay 1.88; West Torrens 1.72). In comparison, the Northern remote regions of Western Australia and Northern Territory, as well as the outer suburbs of Melbourne, Sydney, and Brisbane had a lower number of people with self-reported dementia than expected. When grouping LGAs to a minimum threshold population of 100,000 people during the sensitivity analysis to minimalize the effect of smaller populations on the SPR, these hotspots remained (Figure 2). When standardizing for age, the metropolitan Adelaide hotspot still had a higher-than-expected number of people with self-reported dementia, while the hotspots in regional Australia disappeared (Figure 3). Other areas with a higher-than-expected number of people with self-reported dementia when adjusting for age included metropolitan areas such as the inner suburbs of Sydney (Inner West: 1.31), Melbourne (Moreland: 1.42), and Newcastle (Newcastle: 1.40).
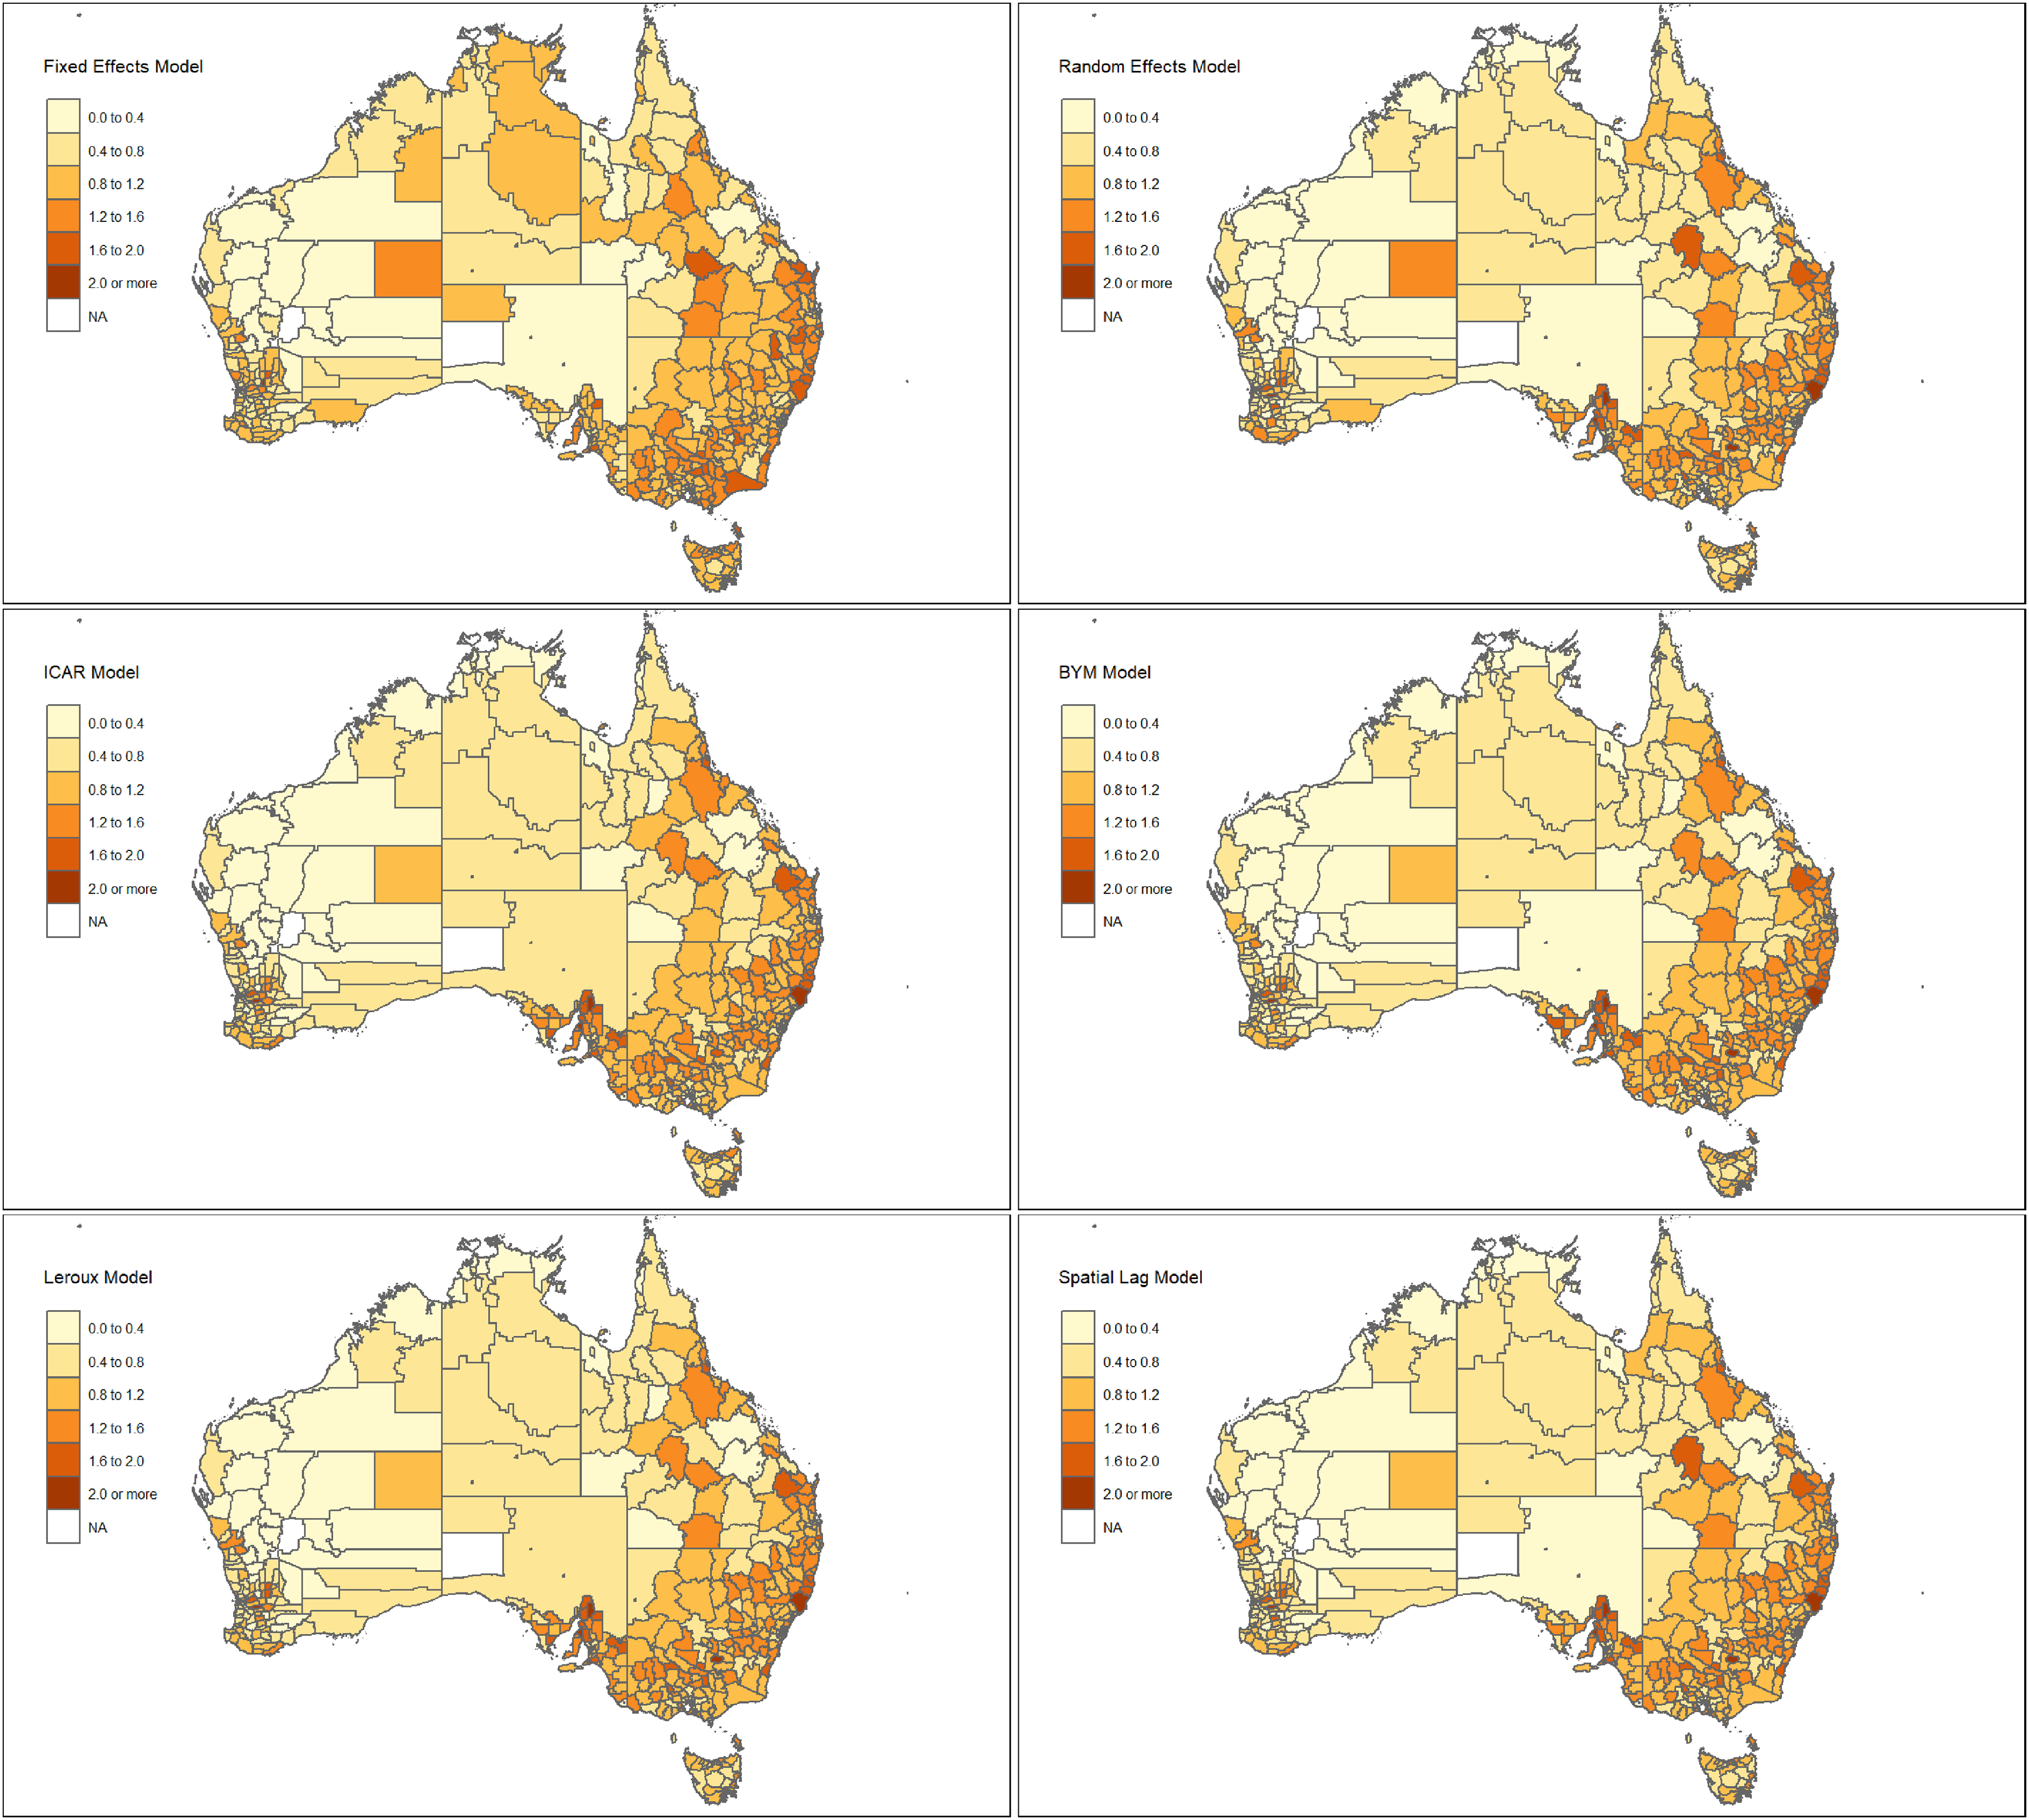
Spatial regression models of standardized prevalence ratios for self-reported dementia. Choropleth maps showing spatial regression models for the standard prevalence ratio of self-reported dementia in each local government area across Australia in 2021, where yellow represents local government areas with lower prevalence of self-reported dementia than expected while red indicates higher prevalence than expected. (Color figure available online).
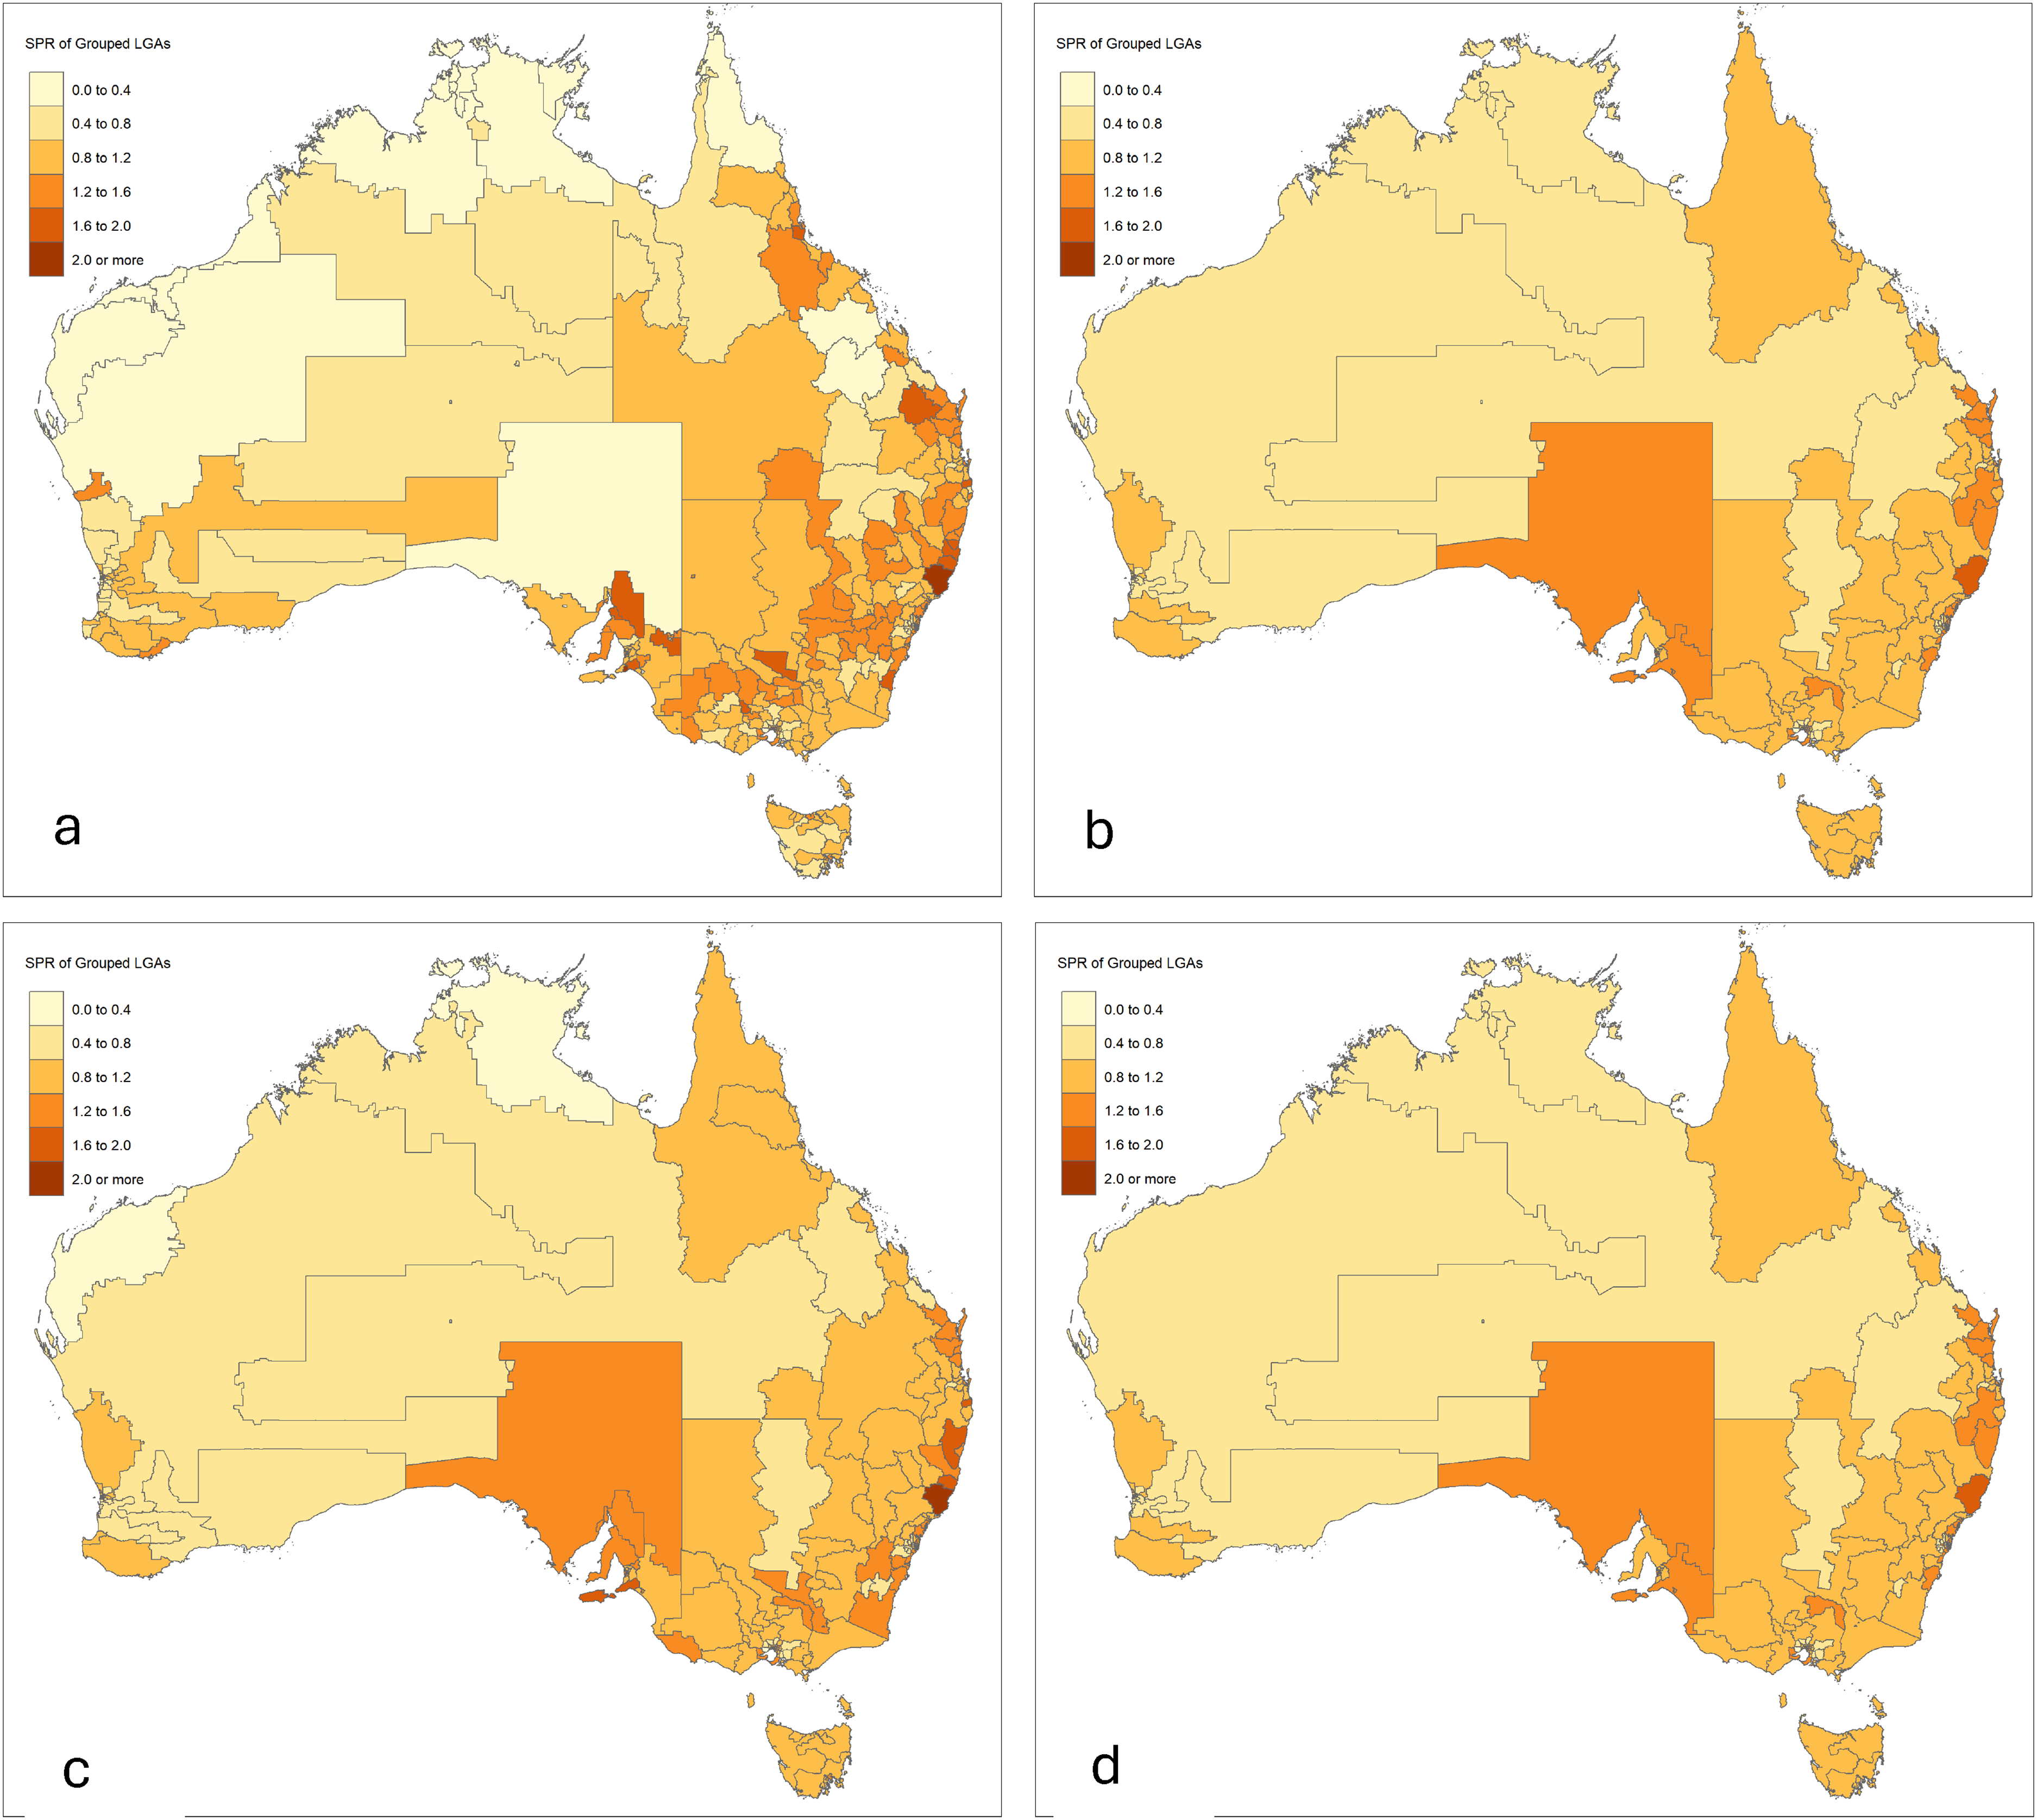
Grouped regions sensitivity analysis. Choropleth maps showing the standard prevalence ratios of self-reported dementia for each region. Each region is a group of neighboring local government areas (LGA) clustered together such that the minimum combined population of each LGA is at least (a) 10,000, (b) 25,000, (c) 50,000, (d) 100,000. Yellow represents regions with lower prevalence of self-reported dementia than expected while red indicates higher prevalence than expected. (Color figure available online).
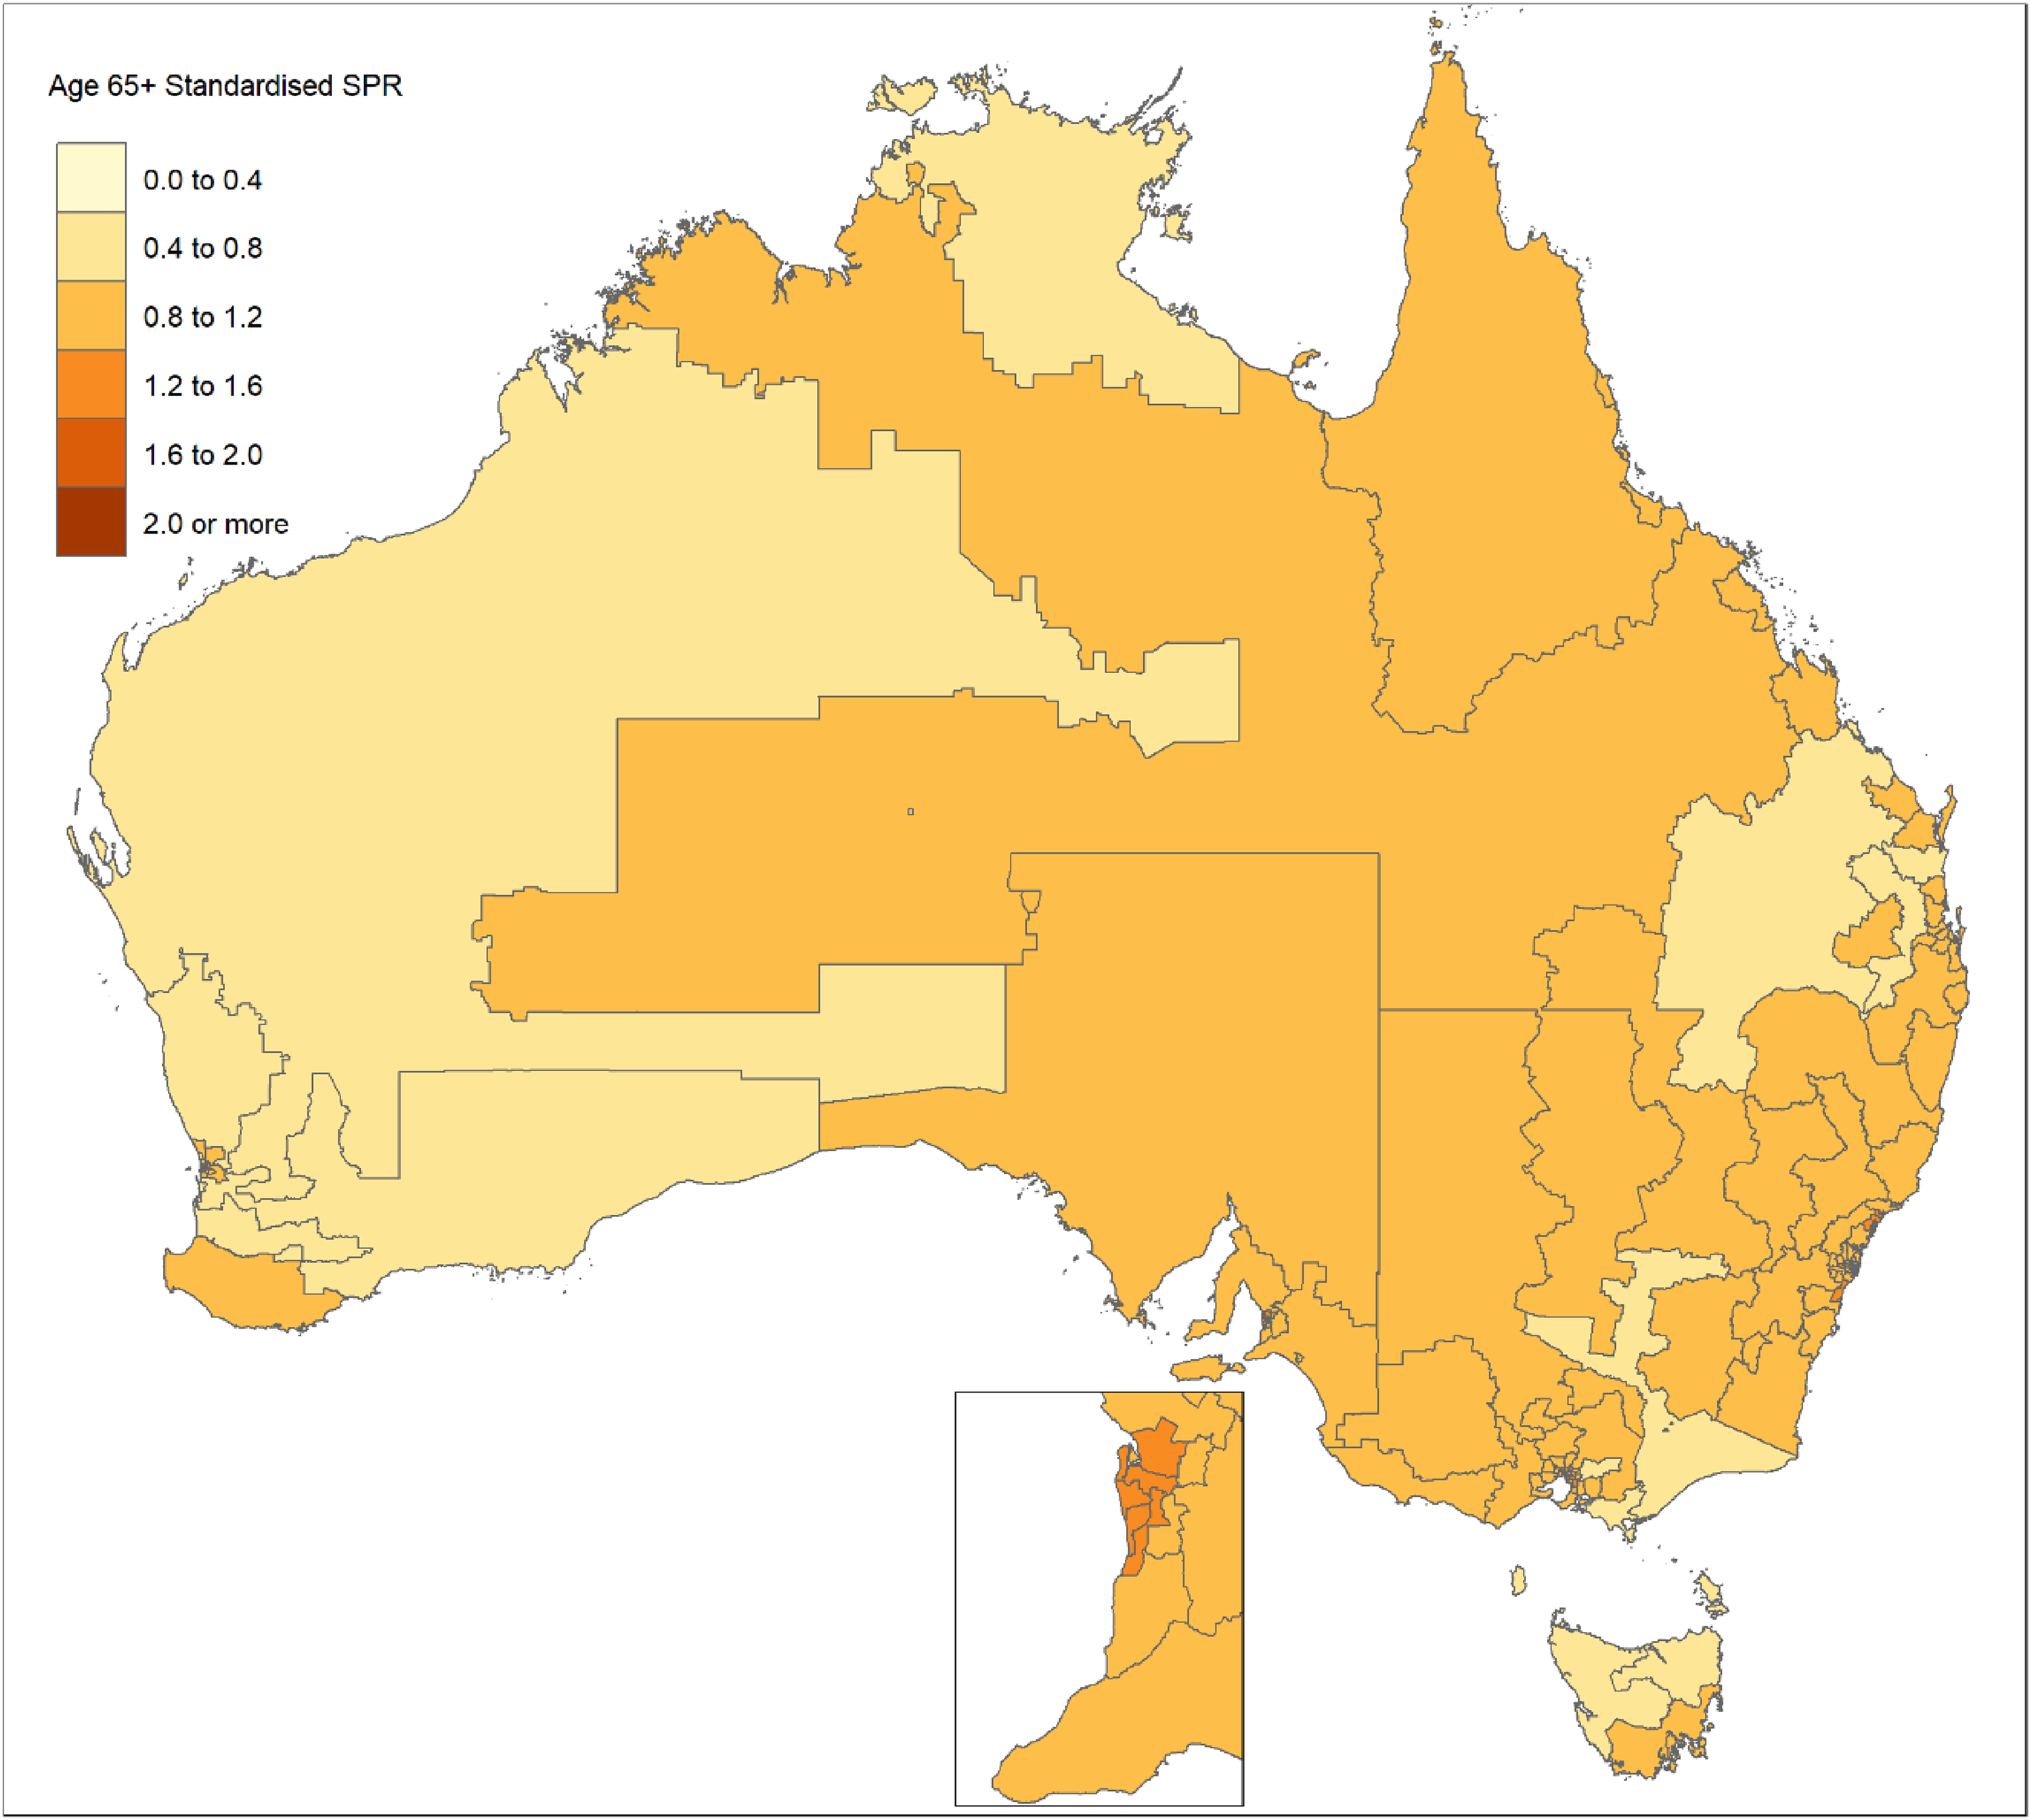
Age sensitivity analysis. Choropleth maps showing the age standardized prevalence ratios of dementia for each region, where the number of people with self-reported dementia per person aged 65 years and above in each region is divided by the average number of people with self-reported dementia per person aged 65 years and above in Australia. Each region is a group of neighboring local government areas (LGA) clustered together such that the minimum combined population of each LGA is at least 100,000. The map has been zoomed in for metropolitan Adelaide and surrounding regions. Yellow represents regions with lower prevalence of self-reported dementia than expected while red indicates higher prevalence than expected. (Color figure available online).
Spatial regression
The Global Moran's I was 0.29 (p-value < 0.01), suggesting the presence of clustering in the data. Since spatial relationships existed between LGAs, we progressed to performing spatial regression. The genetic algorithms resulted in seven variables chosen for modelling. These were sex, diabetes, heart disease, kidney disease, mental health, stroke, and percentage of medical specialists in the population (RMSE = 0.352). 540 LGAs were used in the spatial regression analysis. LGAs without self-reported dementia data or had missing data for the chosen variables were excluded from the analysis.
When evaluating each spatial model sequentially, we found that the best spatial model, which had the lowest DIC and WAIC, was the Spatial Lag Model (DIC – 4405.14, WAIC – 4370.16) (Table 2). Sex, stroke, and heart disease were found to be statistically significant covariates since the 95% interval of the posterior marginal for each of the three covariates did not overlap with zero (Table 3).
Spatial regression results.

Results of the spatial analysis of standard prevalence ratios of self-reported dementia across Australia. The Deviance Information Criterion (DIC) and Watanabe-Akaike Information Criteria (WAIC) measure the fitness of the models, with the lower value, the better the model. The 7 variables chosen for the models were selected from genetic algorithms. These were sex, percentage of specialists, diabetes, heart disease, kidney disease, mental health, and stroke. The best model is indicated with an asterisk.
Spatial lag model with covariates.
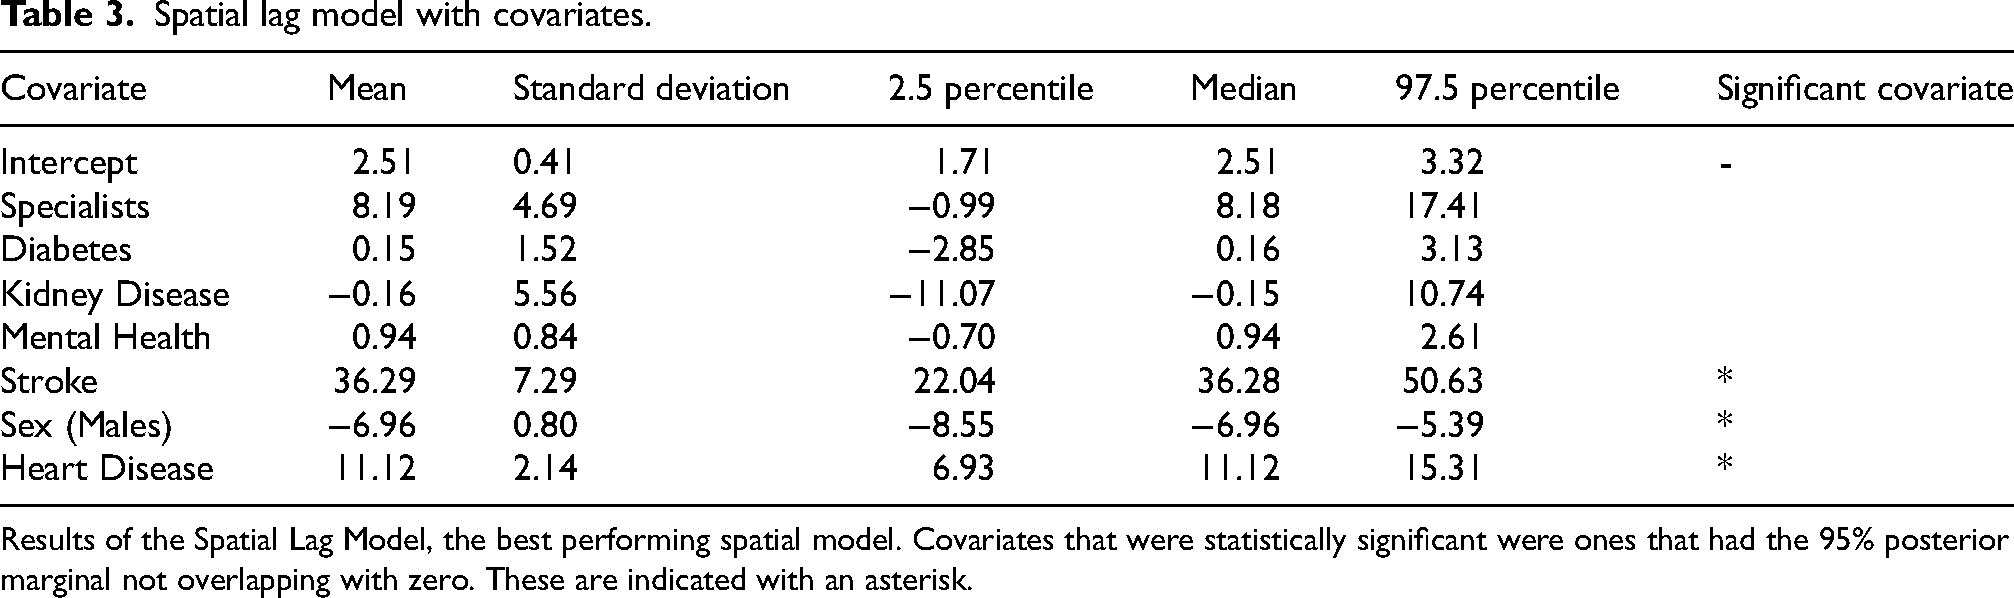
Results of the Spatial Lag Model, the best performing spatial model. Covariates that were statistically significant were ones that had the 95% posterior marginal not overlapping with zero. These are indicated with an asterisk.
The spatial dependence parameter in the Spatial Lag Model was 0.627, indicating clustering of LGAs with higher SPRs for self-reported dementia and the presence of hotspots. The Spatial Lag Model found hotspots in the east coast of New South Wales (Mid-Coast: 2.13; Nambucca Valley 1.83), South-East regions of Queensland (Fraser Coast: 1.59; North Burnett 1.67) and the rural area northwest of Adelaide (Barunga West: 2.38; Port Pirie 1.85), and metropolitan Adelaide (Holdfast Bay 1.87; West Torrens 1.72) (Figure 1).
Memory clinics
108 memory clinics were found in this study, consisting of 74 public clinics, and 34 clinics offering only private services. Of these, 38 were in Victoria, 33 in New South Wales, 16 in Queensland, 7 in Western Australia, 6 in Northern Territory, 5 in South Australia, 2 in Tasmania, and 1 in the Australian Capital Territory (Figure 4). Most memory clinics were found to be in metropolitan areas, with 83 located in metropolitan areas, while 11 were in regional centers, 8 were in large rural towns, 3 were in medium rural towns, 0 were in small rural towns, 3 were in remote communities, and 0 were in very remote communities (Table 1). Private memory clinics were mainly located in metropolitan areas, with only 2 being non-metropolitan (Figure 4).
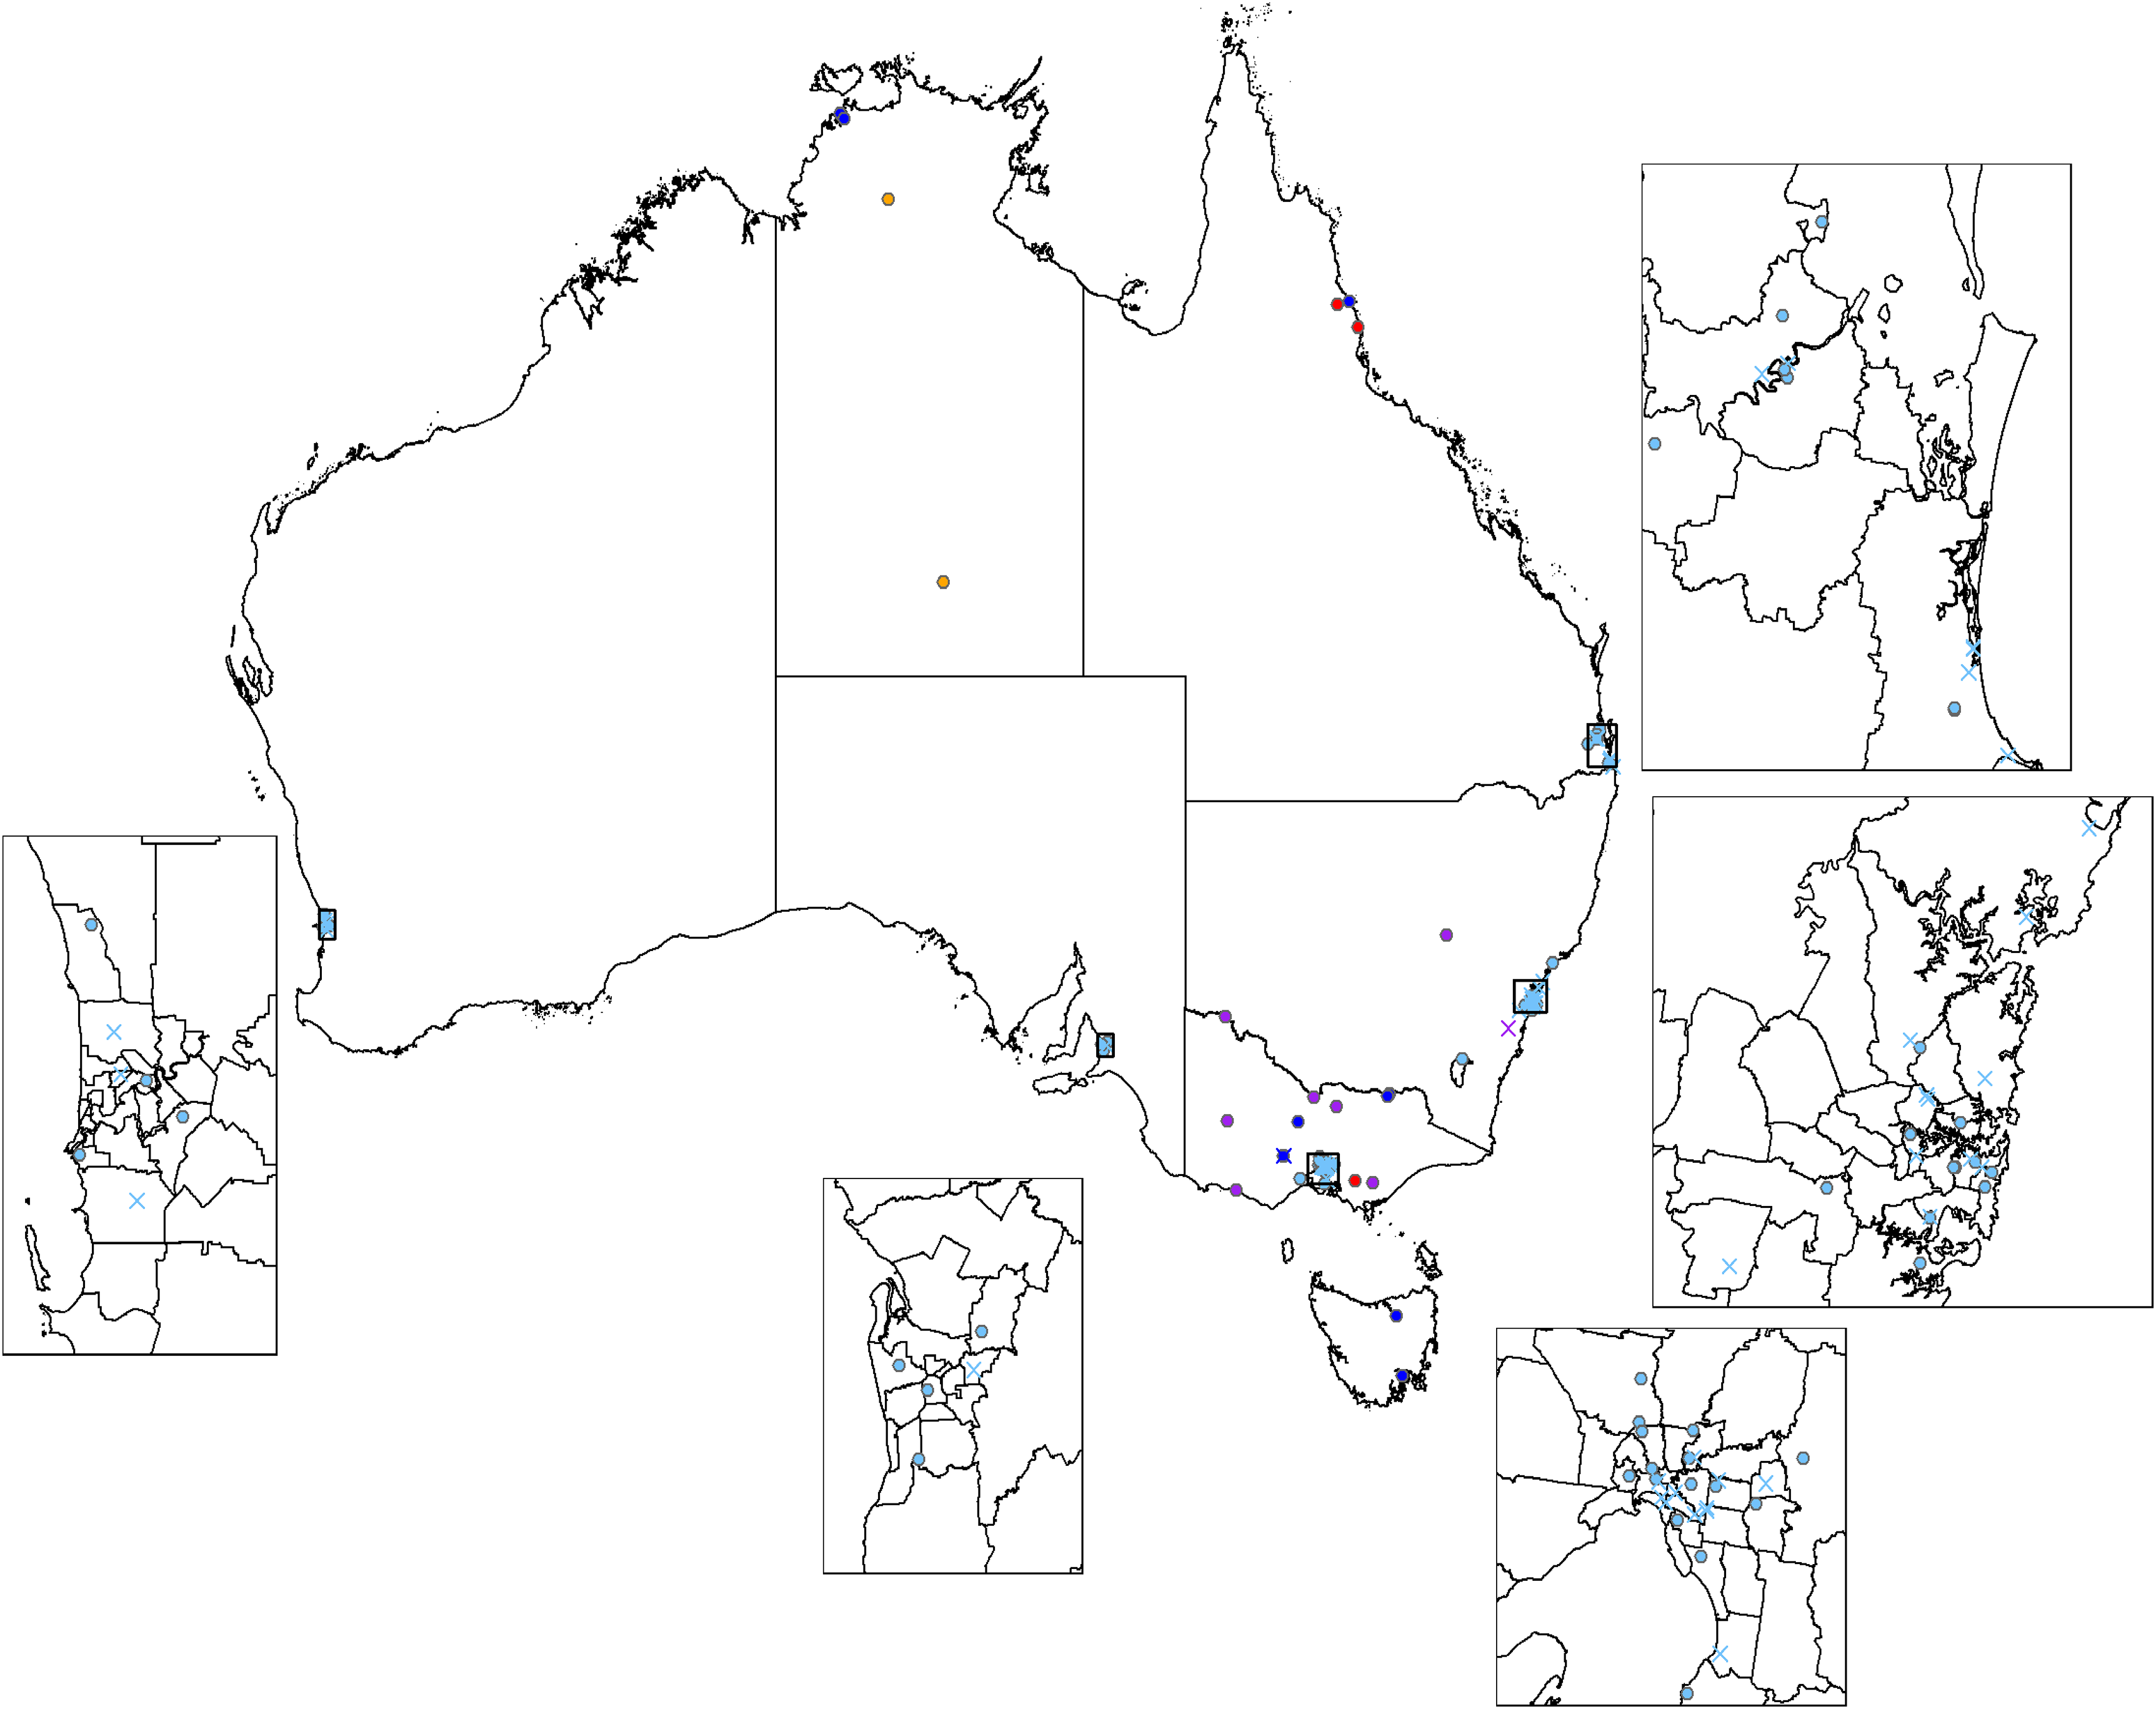
Memory clinic locations in Australia. Map showing the locations of memory clinics across Australia. Memory clinics have been colored according to how remote the location is, as per the Modified Monash Model. Light Blue—Metropolitan areas; Dark Blue—Regional Centers; Purple—Large Rural Towns; Red—Medium Rural Towns; Orange—Remote Communities. Dots represent public memory clinics, while crosses are private memory clinics. Major cities have been enlarged to view metropolitan memory clinics. (Color figure available online).
The number of people with self-reported dementia per memory clinic was lower in metropolitan areas (1582 cases per clinic) compared to non-metropolitan areas (2305 cases per clinic) (Table 1). Northern Territory was the only state or territory that was found to have memory clinics in remote communities, with memory clinics in the other states and territories located in either metropolitan areas, regional centers or rural towns (Figure 4).
There were no memory clinics found in some LGAs that were identified as hotspots in our analysis. These included Mid-Coast and Nambucca Valley in New South Wales, Fraser Coast and North Burnett in Queensland, and Barunga West and Port Pirie in South Australia.
Discussion
The key findings from our study are that the prevalence of self-reported dementia were higher than expected in non-metropolitan areas such as the Central Coast of New South Wales, South-East coast of Queensland, and the rural region northwest of Adelaide, as well as metropolitan Adelaide. Most of the memory clinics were concentrated in metropolitan areas while less were found in non-metropolitan areas. In addition, some hotspots for self-reported dementia did not have a memory clinic nearby, suggesting inadequate access in some areas with a higher need for dementia services.
Our finding that the prevalence of self-reported dementia was higher in non-metropolitan areas compared to metropolitan areas is consistent with studies in other countries, such as Portugal, China, and the US.28–30 On the other hand, a study in Kentucky and West Virginia in the Southeastern region of the US, reported that urban areas had a higher dementia prevalence. 31 However, it was suggested that there may be a greater degree of underdiagnosis of dementia in rural areas, hence a lower prevalence of dementia in rural areas than expected. 31
In Australia, a previous study reported that urban areas had higher prevalence of dementia. 32 In that study, investigators used data from the Survey of Disability, Ageing, and Carers (SDAC) based on a sample of 6000 people with dementia. 32 In comparison, the data in our study comprised nearly 190,000 people with dementia (Table 1) providing greater confidence in metropolitan non-metropolitan differences. Additionally, investigators in that study used logistic regression rather than spatial regression and hence were unable to account for the spatial relationships that may exist between neighboring regions. Another Australian study reported an increased risk of developing dementia in urban areas compared to rural areas over an 11-year period in New South Wales. 33 However, this referred to the incidence of dementia across Australia, as opposed to dementia prevalence. 33
We found that when comparing Modified Monash Model categories, metropolitan areas and regional centers had a similar prevalence of self-reported dementia. However, this could reflect what the Modified Monash Model classifies as metropolitan. For example, two capital cities, Darwin and Hobart, are not considered to be metropolitan areas by the Modified Monash Model. 8 When investigating cities in regional centers individually, we found that some of the most populated cities had a lower prevalence of dementia compared to other LGAs with a smaller population. These included Cairns, Townsville, Darwin and some LGAs in Hobart. This suggests that if these cities were considered metropolitan, then a greater difference in prevalence would be seen between the two categories.
Our spatial regression analysis showed that LGAs with a greater proportion of women, and higher prevalence of heart disease and stroke, were hotspots for self-reported dementia. Previous meta-analyses have also found that these covariates increase the prevalence of dementia.27,34,35
In further sensitivity analysis, when combining LGAs to a minimum population threshold of 100,000 people, we found that the hotspots in non-metropolitan areas remained (Figure 2), potentially explained by an older population living in in these areas (Table 1). When standardizing for age, metropolitan Adelaide still had a higher-than-expected number of people with self-reported dementia, while hotspots in regional Australia disappeared (Figure 3), suggesting that factors other than age, such as socioeconomic variables, may influence prevalence in this metropolitan area. This finding remained when standardizing other age categories as well (55 years old and above, and 75 years old and above) (Supplemental Figure 1). Australian memory clinics generally service older populations, with the average age of patients around 75 years in Australian memory clinics. 36 As such, clinics that specifically target individuals with young onset dementia may be beneficial in metropolitan Adelaide. In other sensitivity analysis there was no clear relationship between distribution of residential aged care facilities and self-reported dementia hotspots (Supplemental Figure 2).
We found inequitable distribution in the number of recorded memory clinics across Australia, with most in metropolitan areas (Figure 4). This is important given the large distances between metropolitan and non-metropolitan areas in Australia. Other studies found that non-metropolitan regions in other countries such as Canada, China, New Zealand, and the Philippines also had less access to dementia services compared to their metropolitan counterparts.37,38
In addition, we found that there were hotspots in non-metropolitan areas that lack memory clinics, for example, the east coast of New South Wales and Queensland, and the rural area northwest of Adelaide. Meanwhile areas that had low SPRs, such as the outer suburbs of major cities were near memory clinics, reflecting unequal geographic access to specialized services for dementia.
While remote communities had less people with self-reported dementia per memory clinic compared to metropolitan areas, it was noted that all the recorded memory clinics in remote communities were found in Northern Territory, with none recorded in the other states and territories (Figure 4). Traditionally Australian memory clinics are provided by local health providers and therefore have catchment areas that are restricted to a local health district. 12 As such, individuals in regional or remote Australia with dementia struggle to access to diagnostic, management, and treatment services.
We found that most non-metropolitan memory clinics were public, with only 2 being private (Figure 4). This is important for future healthcare planning, since if a region was serviced only by a private memory clinic, some people living in that area may be unable to access these services if they do not have private healthcare insurance or cannot afford these services.
Limitations
In this study, we used data from PHIDU, which contained self-reported data from the 2021 Australian census. This survey asked people across Australia whether they had any chronic health conditions, such as dementia, diabetes, or heart disease. Since such data are self- reported, investigators have raised the possibility that using the Census data to estimate the prevalence of dementia in Australia can result in lower estimates. Another method to estimate the prevalence of dementia in Australia is to use routinely data from the Australian Institute for Health and Welfare (AIHW). While it would be of value to consider validation of our findings with such data, but even they have substantial limitations to coverage and sources. For example, the AIHW data uses the 2015 Alzheimer's Disease International (ADI) report to estimate dementia prevalence for ages 60 and above, and a 2014 Australian study to estimate dementia prevalence for ages 60 and under. 1 However, our aim was not to provide precise estimates of dementia prevalence, but to broadly explore distribution and hotspots of the condition across regions and correlate with the presence of specialist memory clinics.
Although we searched widely for memory clinics using multiple sources, our capture of all available services for dementia diagnosis and care may not be complete. For example, such services are also provided by private specialists and in other kinds of public single discipline specialist clinics as well (Geriatric Medicine, Neurology, Aged Psychiatry). Currently, only a small percentage of patients in Australia are being diagnosed in a memory clinic. 39 As such, people living in regions without memory clinics, especially in non-metropolitan ones, may still be able to access services for dementia. However, memory clinics are considered to be the gold standard for providing a comprehensive assessment for dementia and may also provide genetic testing, rehabilitation and access for new therapies. 3 As a result, patients living in these regions without memory clinics may still have less access to dementia services overall.
Furthermore, we used data from the 2021 Australian census, which was the first census which asked whether people had chronic health conditions such as dementia. 7 A limitation of the census is that it only provides an estimate of prevalence, and the data do not permit a longitudinal analysis of people without dementia at baseline to compute incidence. Also, because the census data indicates the prevalence of self-reported dementia across different LGAs and not the change in prevalence over time, some LGAs with a low prevalence of self-reported dementia may also have a rapid increase in cases over time. These regions should also be identified, along with current hotspots, for future health service planning. When future editions of the census become available, a future study could involve a spatiotemporal analysis to investigate where these LGAs occur.
We used areal data at the LGA level in this study, meaning that we investigated the aggregate count of self-reported dementia in each LGA, rather than at the individual patient level. As a result, the data do not specify the age, sex, or health conditions of each person.
Finally, the Tiwi Islands LGA comprises a set of islands 80 kilometers north of the city Darwin, Northern Territory. This LGA does not share any border with any other LGA and has no self-reported cases. Since spatial models require regions to be contiguous with one another, we found that spatial models could not predict the SPRs of the LGAs. 40 As such, we excluded the Tiwi Islands LGA to produce more accurate models.
Conclusion
This study showed that non-metropolitan areas in Australia had a higher prevalence of self-reported dementia in proportion to population, but lower number of memory clinics compared to metropolitan areas in Australia. When plotting the distribution of memory clinics and self-reported dementia prevalence, we found that there are hotspots for self-reported dementia prevalence in Australia without a memory clinic. These data highlight important issues of equity and access to critical services for an increasing public health issue and will be helpful in planning future specialized services for dementia across Australia.
Supplemental Material
sj-docx-1-alz-10.1177_13872877261444254 - Supplemental material for Mapping hotspots of self-reported dementia and memory clinics across Australia
Supplemental material, sj-docx-1-alz-10.1177_13872877261444254 for Mapping hotspots of self-reported dementia and memory clinics across Australia by Albert L. G. Phan, Richard Beare, Henry Ma, Velandai Srikanth and Thanh G. Phan in Journal of Alzheimer's Disease
Footnotes
Acknowledgements
The authors have no acknowledgments to report.

Ethical considerations
Not applicable.
Consent to participate
Not applicable.
Author contribution(s)
Funding
The authors received no financial support for the research, authorship, and/or publication of this article.
Declaration of conflicting interests
The authors declared no potential conflicts of interest with respect to the research, authorship, and/or publication of this article.
Data availability statement
Data from the Australian Bureau of Statistics, the Public Health Information Development Unit and the Australian Dementia Network is publicly available.
Supplemental material
Supplemental material for this article is available online.
References
Supplementary Material
Please find the following supplemental material available below.
For Open Access articles published under a Creative Commons License, all supplemental material carries the same license as the article it is associated with.
For non-Open Access articles published, all supplemental material carries a non-exclusive license, and permission requests for re-use of supplemental material or any part of supplemental material shall be sent directly to the copyright owner as specified in the copyright notice associated with the article.
