
Abstract
Background
Alzheimer's disease (AD) is characterized by decreased cerebral blood flow (CBF) and abnormal iron deposition, whereas their relationship remains unclear.
Objective
To investigate the spatial pattern of CBF-iron deposition coupling across the AD spectrum and its associations with cognition, plasma biomarkers, and inflammation.
Methods
34 AD dementia, 86 mild cognitive impairment (MCI), and 26 cognitively normal (CN) were enrolled. Voxel-wise CBF-susceptibility coupling was calculated using three-dimensional pseudocontinuous arterial spin labeling and quantitative susceptibility mapping (QSM). Whole-brain region-based analyses of CBF, QSM, and CBF-susceptibility coupling were subsequently performed. Correlation and mediation analyses were conducted to evaluate the relationships of CBF-susceptibility coupling with plasma biomarkers, inflammatory factors, and cognitive function.
Results
CBF was significantly reduced in the AD dementia group and MCI group. No significant group differences were observed in QSM susceptibility. The AD dementia group showed significantly lower CBF-susceptibility coupling in multiple brain regions than CN and MCI groups, which was positively correlated with Mini-Mental State Examination (MMSE), Animal Fluency Test scores, and the plasma amyloid-β 42/40 (Aβ42/Aβ40) ratio. In the MCI group, coupling values were negatively correlated with IL-2 levels. CBF-susceptibility coupling in the bilateral supplementary motor areas of AD patients partially mediated the association between Aβ42/Aβ40 ratio and MMSE.
Conclusions
CBF-susceptibility coupling is significantly decreased in AD dementia and appears more sensitive than single-modality measures, and is associated with cognitive decline, amyloid pathology, and inflammation. These findings suggest that disrupted CBF-iron metabolism coupling may be a pathogenic mechanism underlying cognitive impairment in AD, possibly driven by early neuroinflammation.
Introduction
Alzheimer's disease (AD) represents the predominant cause of dementia in older adults. Its core clinical presentation involves a progressive decline in memory functions and other cognitive domains. 1 Traditionally, the pathological hallmarks of AD have been attributed to cerebral amyloid-β (Aβ) deposition and hyperphosphorylated tau protein.2,3 However, a growing body of research now suggests that vascular dysregulation and metabolic vulnerability are fundamental to the pathological inception and subsequent course of AD. 4 Cerebral hypoperfusion has been consistently observed across the AD continuum and is increasingly recognized as an early contributor to cognitive decline.5,6
Iron is essential for normal brain function, particularly for mitochondrial respiration and oxidative metabolism. 7 Quantitative susceptibility mapping (QSM) provides a noninvasive magnetic resonance imaging (MRI) measure that reflects iron-enriched magnetic susceptibility, although it is not specific to iron metabolism alone and may be influenced by myelin content and deoxygenated hemoglobin. Nevertheless, abnormal susceptibility patterns have been repeatedly reported in AD-vulnerable regions,8,9 suggesting disrupted iron homeostasis in the disease.
Importantly, cerebral blood flow (CBF) and iron-related susceptibility are physiologically coordinated. Adequate perfusion supports iron delivery, redistribution, and clearance, while iron availability is critical for meeting metabolic demand. Under pathological conditions, disruption of this coordination may indicate failure of vascular-metabolic integration rather than isolated abnormalities in perfusion or iron accumulation. 10 However, this coupling mechanism has not been systematically investigated in AD.
Plasma biomarkers partially reflect the core pathological changes and disease activity for AD, playing a crucial role in its auxiliary diagnosis and disease monitoring. The ratio of Aβ42 to Aβ40 (Aβ42/Aβ40) and the concentration of phosphorylated tau (p-tau) protein represent the most characteristic AD-related pathological markers.11,12 A recent combined cross-sectional and longitudinal study reported extensive associations between plasma Aβ42 and glial activation markers (GFAP) levels with regional CBF. 13 Furthermore, several studies have confirmed that plasma biomarkers are significantly correlated with cognitive decline and cortical gray matter atrophy.14,15 Integrating plasma biomarkers with multimodal MRI techniques has emerged as an effective strategy for elucidating the pathophysiological mechanisms of AD.
Based on previous research findings, we hypothesize that abnormalities in the coupling between CBF and iron metabolism accompany the course of AD. This study will combine QSM and three-dimensional pseudo-continuous arterial spin labeling (3D-pCASL) to calculate CBF-susceptibility coupling coefficients to characterize the degree of CBF-iron metabolism coupling and explore its pathophysiological mechanisms in AD-related cognitive impairment. We therefore aimed to (1) clarify the abnormal characteristics of CBF and QSM single-modality indicators and the alteration features of CBF-susceptibility coupling across the AD spectrum, and (2) determine the associations between CBF-susceptibility coupling and cognition, amyloid burden, and neuroinflammatory activity.
Methods
Participants
In this community-based cross-sectional investigation, 166 participants with an age range spanning 55–90 years were enrolled. Each participant completed blood sampling, neuropsychological testing, and MRI. Twenty individuals were excluded for the following reasons: incomplete neuropsychological assessments, head-motion artifacts, or missing blood samples. The final analytical cohort, therefore, consisted of 146 eligible participants. The diagnoses of mild cognitive impairment (MCI) and AD were made independently by two neurologists in accordance with internationally recognized standards. The diagnostic process was conducted using a double-blind design to ensure accuracy and standardization. AD dementia was diagnosed based on the National Institute of Neurological and Communicative Disorders and Stroke-the AD and Related Disorders Association (NINCDS-ADRDA) criteria. 16 At the same time, a diagnosis of MCI was assigned in accordance with the 1999 Petersen criteria. 17 Cognitively normal (CN) participants failed to meet criteria for objective cognitive impairment across the full neuropsychological battery.
Prior to enrollment, written informed consent was obtained from all participants after a complete verbal and written description of the study. Key demographic and genetic information was documented, comprising sex, years of education, age, and apolipoprotein E (APOE) genotype.
Neuropsychological testing and biochemical assessment
A standardized battery of neuropsychological assessments was administered to all enrolled participants to comprehensively evaluate their cognitive performance across multiple domains. Global cognitive performance was evaluated using two established screening tools: the Mini-Mental State Examination (MMSE) and the Montreal Cognitive Assessment-Basic (MoCA-B).18,19 The Functional Activities Questionnaire (FAQ) assessed daily living and social capabilities. Episodic memory, measured by the Auditory Verbal Learning Test-Huashan version (AVLT-H). 20 The Shape Trailing Test (STT) assessed executive function. The Animal Fluency Test (AFT) evaluated language ability. The concentrations of AD-related plasma biomarkers were quantitatively analyzed using Single Molecule Array (Simoa™) technology. The measured parameters included Aβ42, Aβ40, phosphorylated tau at residue 217 (p-tau217), and neurofilament light chain (NfL). Additionally, a panel of circulating inflammatory factors, comprising interleukin (IL)-2, IL-4, IL-6, IL-10, and IL-17A, as well as tumor necrosis factor-α (TNF-α), were quantified as part of the biomarker analysis.
Image acquisition
Structural and functional brain scans were acquired for each participant on a 3.0 Tesla MAGNETOM Prisma MRI scanner, which was fitted with a dedicated 64-channel coil for head and neck imaging. The imaging protocol comprised three core sequences.
3D-pCASL acquisition are listed below: repetition time (TR) = 4600 ms, echo time (TE) = 18.16 ms, 3 excitations, 64 × 64 matrix, 3 mm slice thickness, 180° flip angle (FA), post-labeling delay = 2025 ms, and a 224 mm × 224 mm field of view (FOV).
High-resolution anatomical images were obtained via a magnetization-prepared rapid gradient-echo (MP-RAGE) sequence (TR/TE = 2300/2.26 ms, FA = 8°, 256 × 256 matrix, 1 mm slice thickness, FOV = 256 × 256 mm).
QSM data were acquired using an integrated multi-parametric protocol (MultiMap, Siemens Healthineers). The protocol sequentially executed two multi-echo gradient echo (ME-GRE) scans with a systematic echo time shift to facilitate optimized B0 field mapping: MultiMap_scan1 (TR = 25.0 ms, TE = 7.50, 17.50 ms) and MultiMap_scan2 (TR = 25.0 ms, TE = 8.75, 18.75 ms). Common geometric parameters were: slice thickness = 2 mm, FOV = 256 × 256 mm, matrix = 256 × 256, FA = 6°.
QSM and CBF image reconstruction and preprocessing
QSM data were generated through post-processing of the 3D-GRE imaging data using the STISuite toolbox in MATLAB R2022b (MathWorks, Natick, MA, USA). Phase images were deconvoluted using a Laplacian-based algorithm 21 ; the amplitude map of the first echo underwent brain masking and generated a binary brain mask; By combining a brain mask with a complex harmonic artifact removal algorithm, the contribution of the background field was eliminated from the phase images. 22 Finally, an algorithm specifically designed for stripe artifact removal was employed to reconstruct the susceptibility map. Statistical Parametric Mapping software-SPM12 was used to standardize individual T1 maps into the Montreal Neurological Institute (MNI) defined universal anatomical reference space. Subsequently, the first-echo intensity images were registered to their corresponding T1-weighted anatomical scans via rigid registration. Finally, the QSM images were transformed into MNI space using the aforementioned combined transformation.
Motion correction was applied to ASL images using rigid-body registration to reduce the influence of head motion. ASL difference images are obtained by subtracting the labeled image from the control image. Following this, the three resulting ASL difference maps were averaged, and the mean difference image was calibrated using the proton density-weighted reference scan to produce a quantitative CBF map. SPM12 rigidly aligned the CBF maps to the corresponding T1 structural images in individual space. These were then normalized to MNI space to obtain each subject's CBF map. Extracranial tissue was removed, and the maps were subsequently standardized relative to the whole-brain average CBF value of gray matter. In the final preprocessing stage, the images were smoothed with an isotropic Gaussian filter set to 8 mm at half-maximum.
Evaluation of CBF-susceptibility coupling
CBF-susceptibility coupling can be achieved by calculating the cross-voxel correlation coefficients between CBF and QSM for each brain region, with similar coupling methods described in detail in previous studies.10,23 To characterize regional coordination between cerebral perfusion and iron-related susceptibility, we implemented a region-of-interest-based voxel-wise coupling method using a custom MATLAB R2022b script. The cerebral cortex was segmented into ninety distinct regions based on the Automated Anatomical Labeling (AAL) template. The degree of CBF-susceptibility coupling was characterized by calculating cross-voxel correlation coefficients between each brain region.
This approach differs conceptually from single-modality analyses, which quantify perfusion or susceptibility in isolation, and from multivariate fusion techniques that emphasize shared variance across modalities at the whole-brain level. Instead, the coupling metric captures regional microvascular–metabolic coordination, reflecting how local perfusion adapts to iron-related tissue properties within anatomically constrained regions. This method is particularly suited to detecting coordination failure that may not be apparent from mean perfusion or susceptibility measures alone.
Statistical analysis
Data analysis was performed with IBM SPSS Statistics software (Version 19.0, Armonk, NY). For continuous and categorical data, intergroup differences were assessed via analysis of variance (ANOVA) and the chi-square test, correspondingly.
To examine differences in CBF-susceptibility coupling across the three diagnostic groups, an analysis of covariance (ANCOVA) was employed; post-hoc pairwise comparisons were corrected using the Bonferroni method for the primary region-based between-group comparisons to ensure stringent control of false positives. The associations between CBF-susceptibility coupling values and cognitive scores, plasma biomarkers, and inflammatory factors were evaluated through partial correlation analyses. Furthermore, a mediation model was established to investigate whether CBF-susceptibility coupling contributes to the link between plasma biomarker levels and cognitive performance. The statistical significance thresholds for both association analyses were adjusted using a false discovery rate (FDR) correction to control the family-wise error rate because these analyses were more exploratory in nature and involved a larger number of association tests. To account for confounding, we controlled for the same set of variables (age, sex, education level, and APOE4 status) across all statistical analyses.
Results
Demographic and clinical characteristics of participants
The final cohort comprised 26 CN controls, 86 MCI cases, and 34 individuals meeting criteria for AD dementia. Key participant characteristics stratified by diagnostic group are summarized in Table 1. No significant differences were observed in terms of sex (p = 0.277), APOE4 status (p = 0.06), Aβ40 (p = 0.761), Aβ42 (p = 0.372), or inflammatory markers (p = 0.119–0.711). As expected, AD dementia group exhibited the most severe cognitive impairment, followed by the MCI and CN groups. From the CN to AD dementia, the Aβ42/Aβ40 ratio progressively decreased (p < 0.001), whereas NfL, GFAP, and p-tau217 increased progressively across groups (p < 0.001).
Demographic and clinical characteristics of participants.
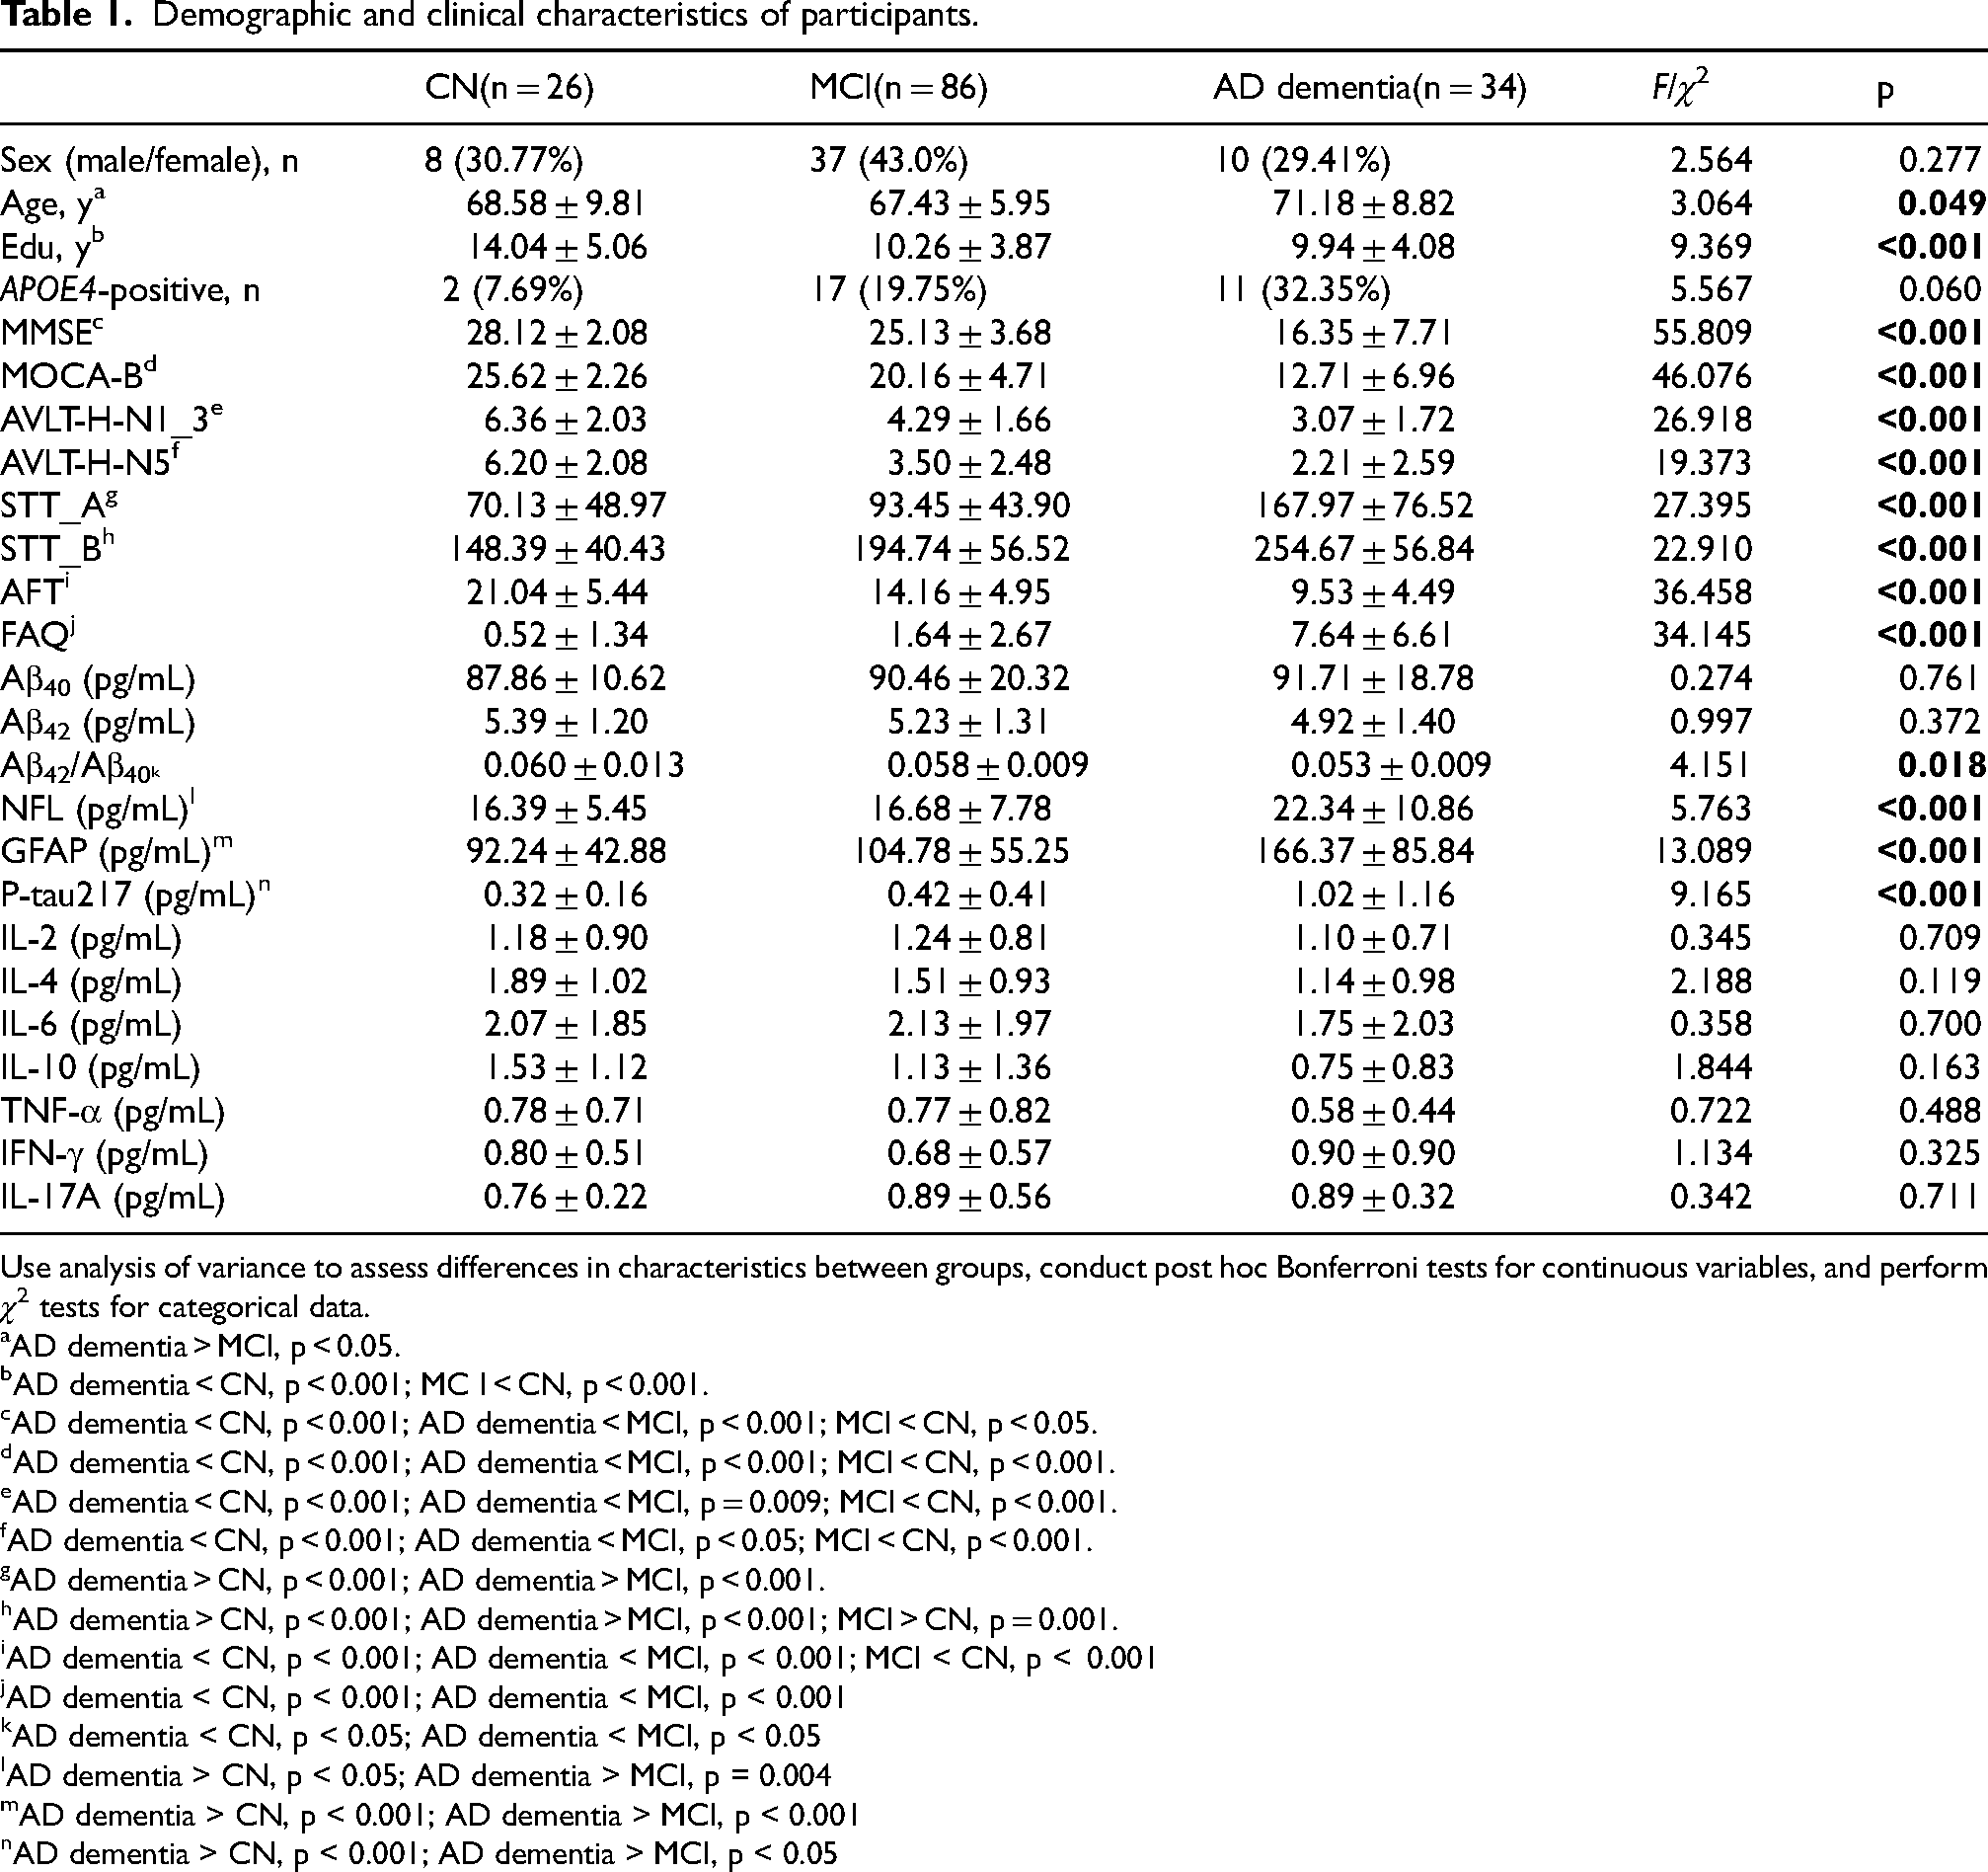
Use analysis of variance to assess differences in characteristics between groups, conduct post hoc Bonferroni tests for continuous variables, and perform χ2 tests for categorical data.
AD dementia > MCI, p < 0.05.
AD dementia < CN, p < 0.001; MC I < CN, p < 0.001.
AD dementia < CN, p < 0.001; AD dementia < MCI, p < 0.001; MCI < CN, p < 0.05.
AD dementia < CN, p < 0.001; AD dementia < MCI, p < 0.001; MCI < CN, p < 0.001.
AD dementia < CN, p < 0.001; AD dementia < MCI, p = 0.009; MCI < CN, p < 0.001.
AD dementia < CN, p < 0.001; AD dementia < MCI, p < 0.05; MCI < CN, p < 0.001.
AD dementia > CN, p < 0.001; AD dementia > MCI, p < 0.001.
AD dementia > CN, p < 0.001; AD dementia > MCI, p < 0.001; MCI > CN, p = 0.001.
AD dementia < CN, p < 0.001; AD dementia < MCI, p < 0.001; MCI < CN, p < 0.001
AD dementia < CN, p < 0.001; AD dementia < MCI, p < 0.001
AD dementia < CN, p < 0.05; AD dementia < MCI, p < 0.05
AD dementia > CN, p < 0.05; AD dementia > MCI, p = 0.004
AD dementia > CN, p < 0.001; AD dementia > MCI, p < 0.001
AD dementia > CN, p < 0.001; AD dementia > MCI, p < 0.05
Region-based whole-brain analysis of QSM
Region-based whole-brain analysis of QSM showed that compared with the MCI group, the AD dementia group had significantly higher susceptibility values in the left superior frontal gyrus and left medial superior frontal gyrus (p_uncorrected < 0.05), and lower susceptibility values in the orbital part of the right middle frontal gyrus, the opercular part of the left inferior frontal gyrus, the left lingual gyrus, and the left supramarginal gyrus (p_uncorrected < 0.05). Compared with the CN group, the AD dementia group exhibited lower susceptibility values in the orbital part of the right middle frontal gyrus, left supramarginal gyrus, right caudate nucleus, right globus pallidus, right temporal pole (superior temporal gyrus), and right temporal pole (middle temporal gyrus) (p_uncorrected < 0.05), as well as higher susceptibility values in the right amygdala (p_uncorrected < 0.05). Compared with the CN group, the MCI group showed lower susceptibility values in the right globus pallidus (p_uncorrected < 0.05). These results are detailed in Table 2.
Intergroup differences in brain regions exhibiting susceptibility among the CN, MCI, and AD dementia groups.
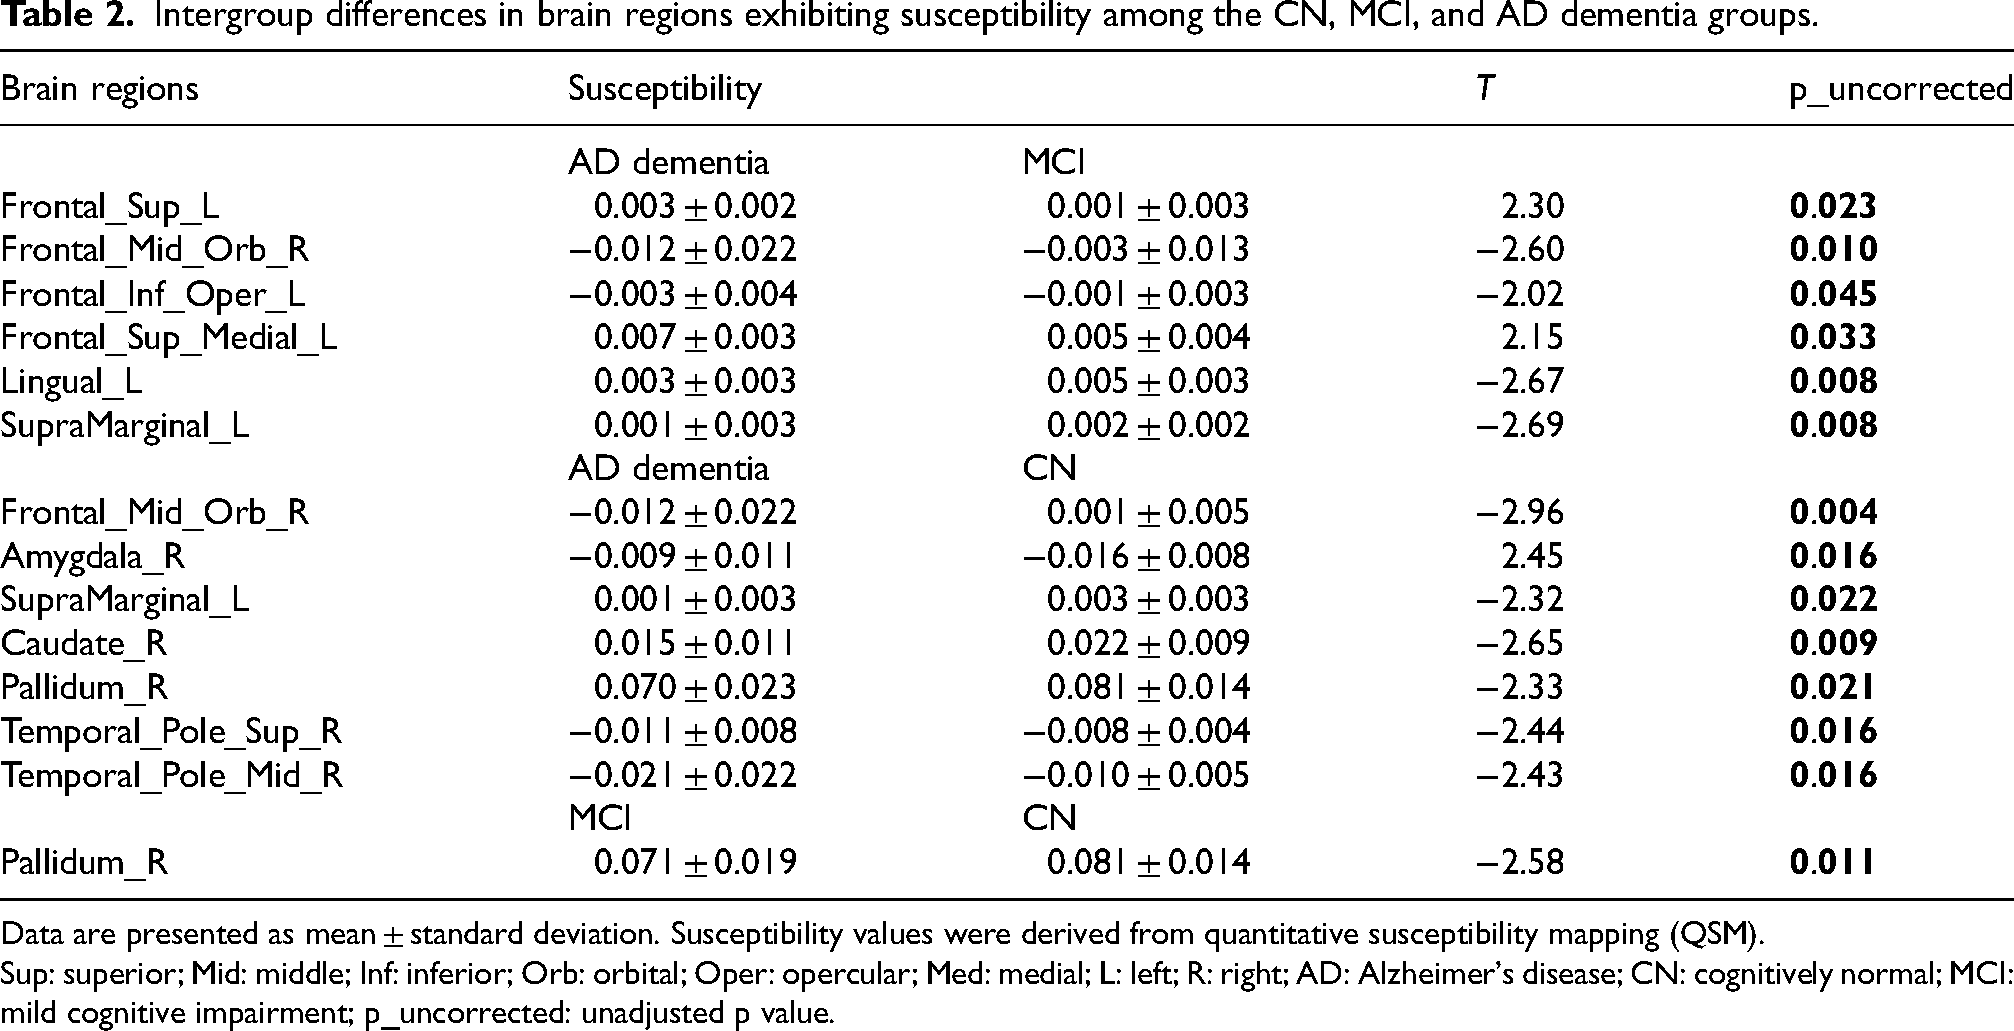
Data are presented as mean ± standard deviation. Susceptibility values were derived from quantitative susceptibility mapping (QSM).
Sup: superior; Mid: middle; Inf: inferior; Orb: orbital; Oper: opercular; Med: medial; L: left; R: right; AD: Alzheimer's disease; CN: cognitively normal; MCI: mild cognitive impairment; p_uncorrected: unadjusted p value.
Region-based whole-brain analysis of CBF
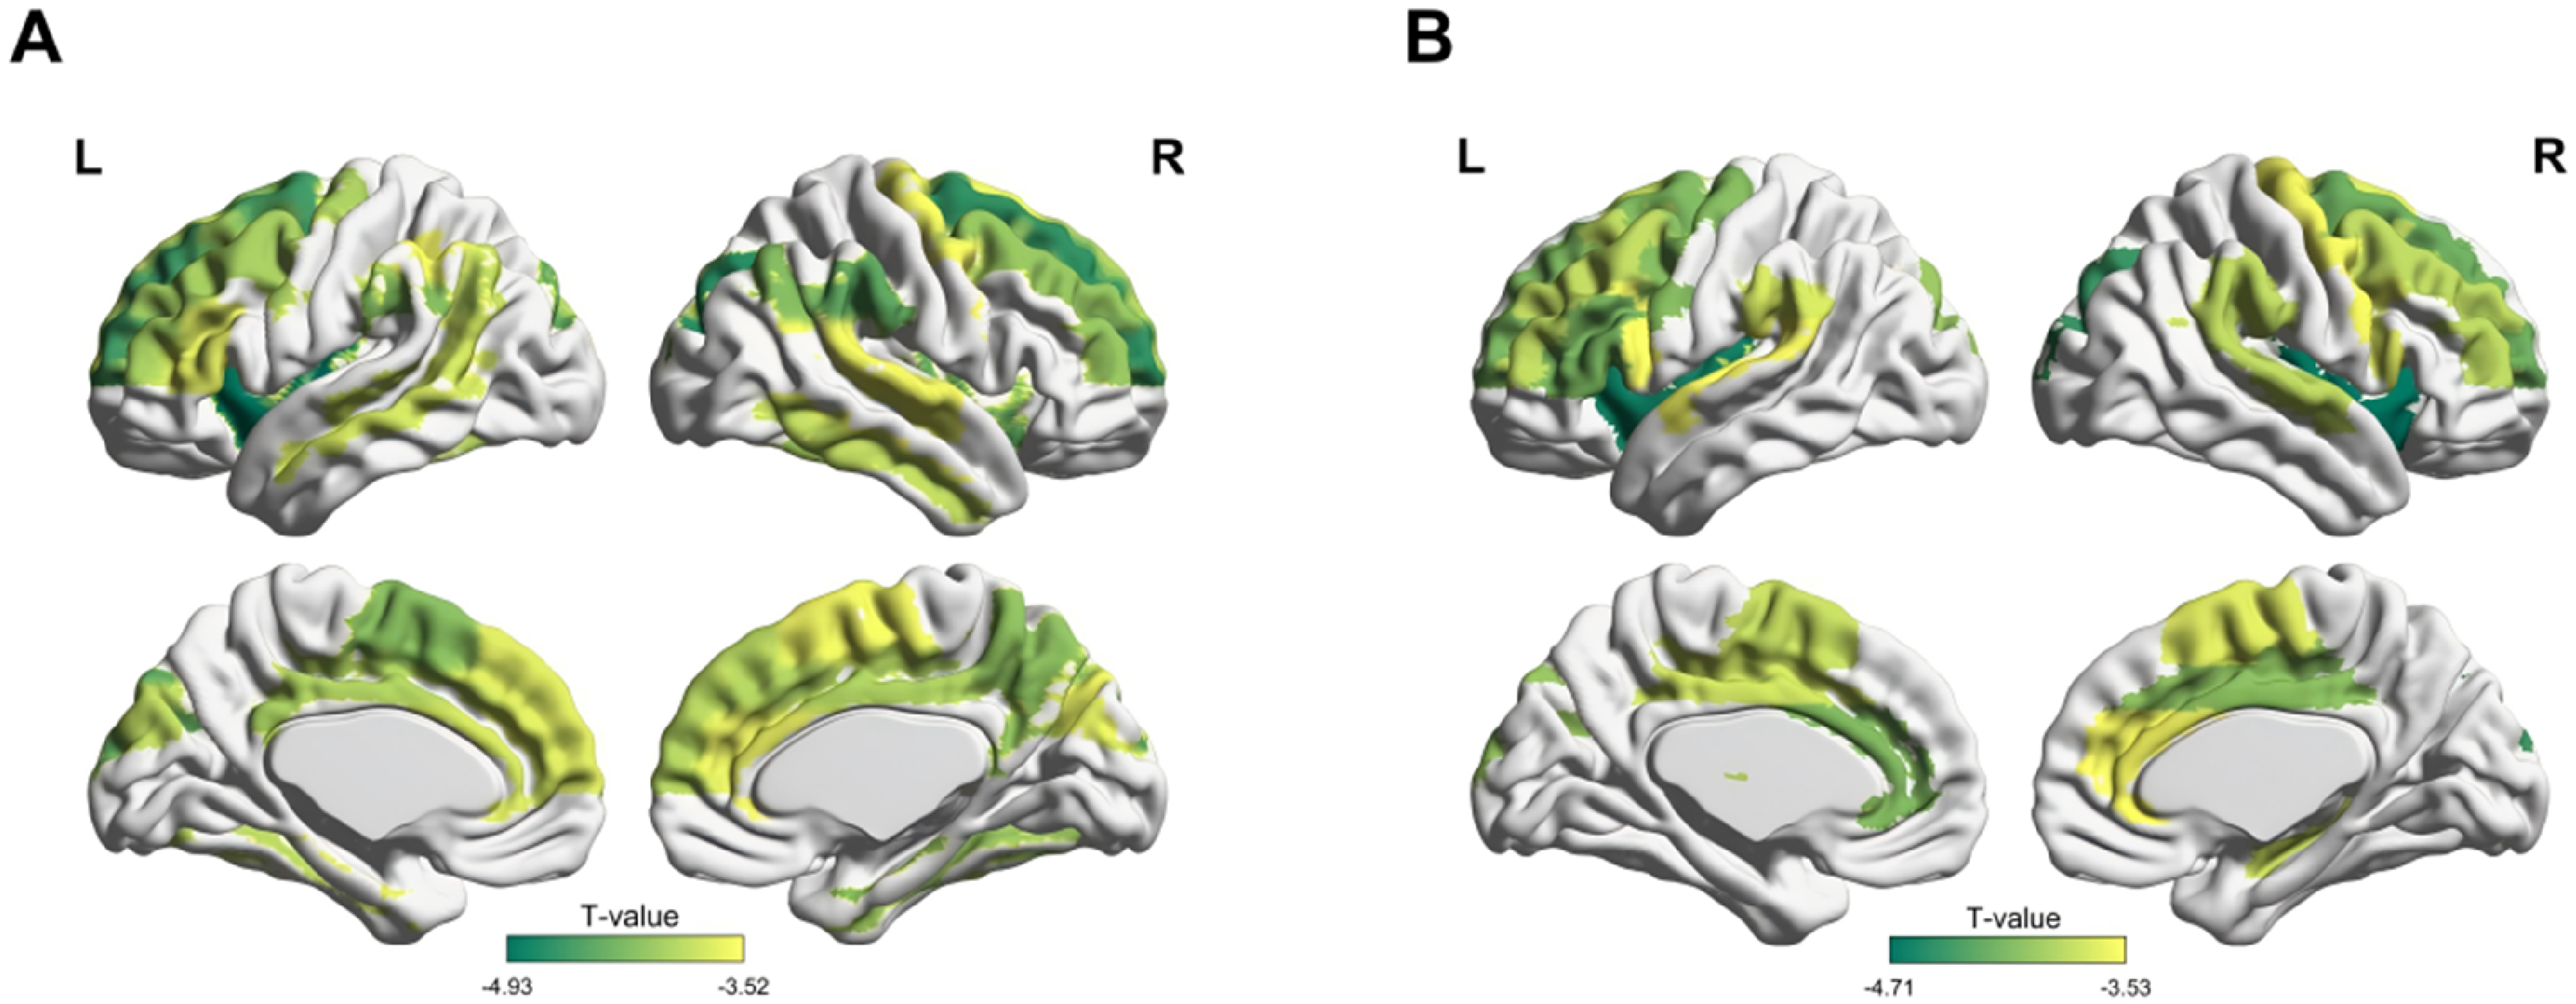
Compared with the CN group, the AD dementia group showed significantly decreased CBF values in the left precentral gyrus, bilateral superior frontal gyrus, bilateral orbital part of superior frontal gyrus, bilateral middle frontal gyrus, bilateral orbital part of middle frontal gyrus, bilateral opercular part of inferior frontal gyrus, bilateral triangular part of inferior frontal gyrus, left orbital part of inferior frontal gyrus, left paracentral lobule, right supplementary motor area, bilateral olfactory brain, left medial superior frontal gyrus, bilateral orbital part of medial superior frontal gyrus, left insula, bilateral anterior cingulate gyrus, right middle cingulate gyrus, bilateral hippocampus, right amygdala, bilateral superior occipital gyrus, bilateral middle occipital gyrus, left inferior occipital gyrus, right fusiform gyrus, left postcentral gyrus, bilateral superior parietal lobule, bilateral inferior parietal lobule, bilateral supramarginal gyrus, bilateral angular gyrus, bilateral precuneus, bilateral transverse temporal gyrus, bilateral superior temporal gyrus, bilateral temporal pole (superior temporal gyrus), bilateral middle temporal gyrus, bilateral temporal pole (middle temporal gyrus), and bilateral inferior temporal gyrus (p_Bonferroni < 0.05). These results are detailed in Table 3 and illustrated in Figure 1A.
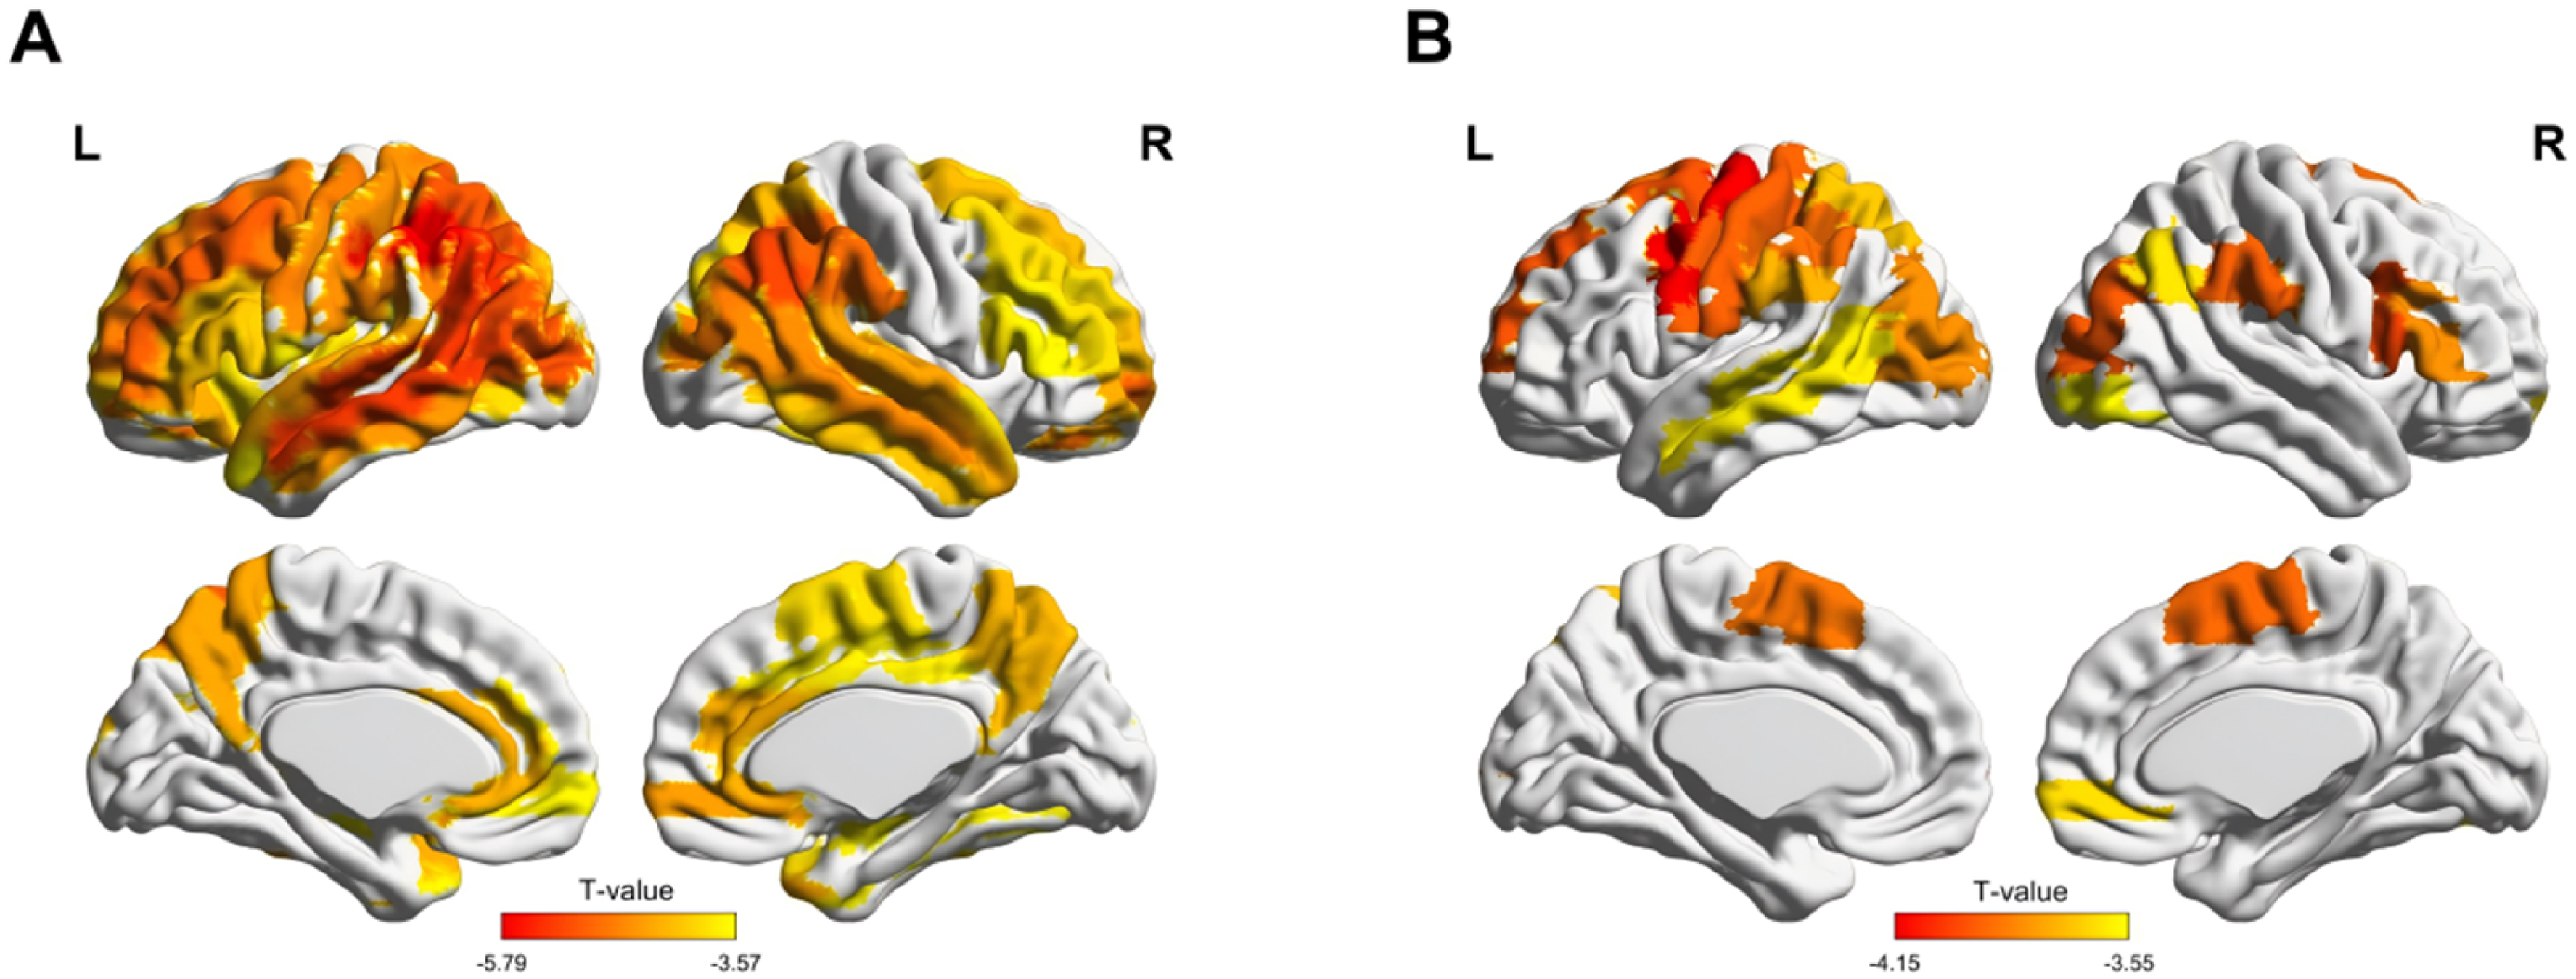
Brain regions showing significant differences in CBF between three groups. (A) AD dementia versus CN group; (B) MCI versus CN group.
Intergroup differences in brain regions exhibiting CBF between the AD dementia group and the CN group.
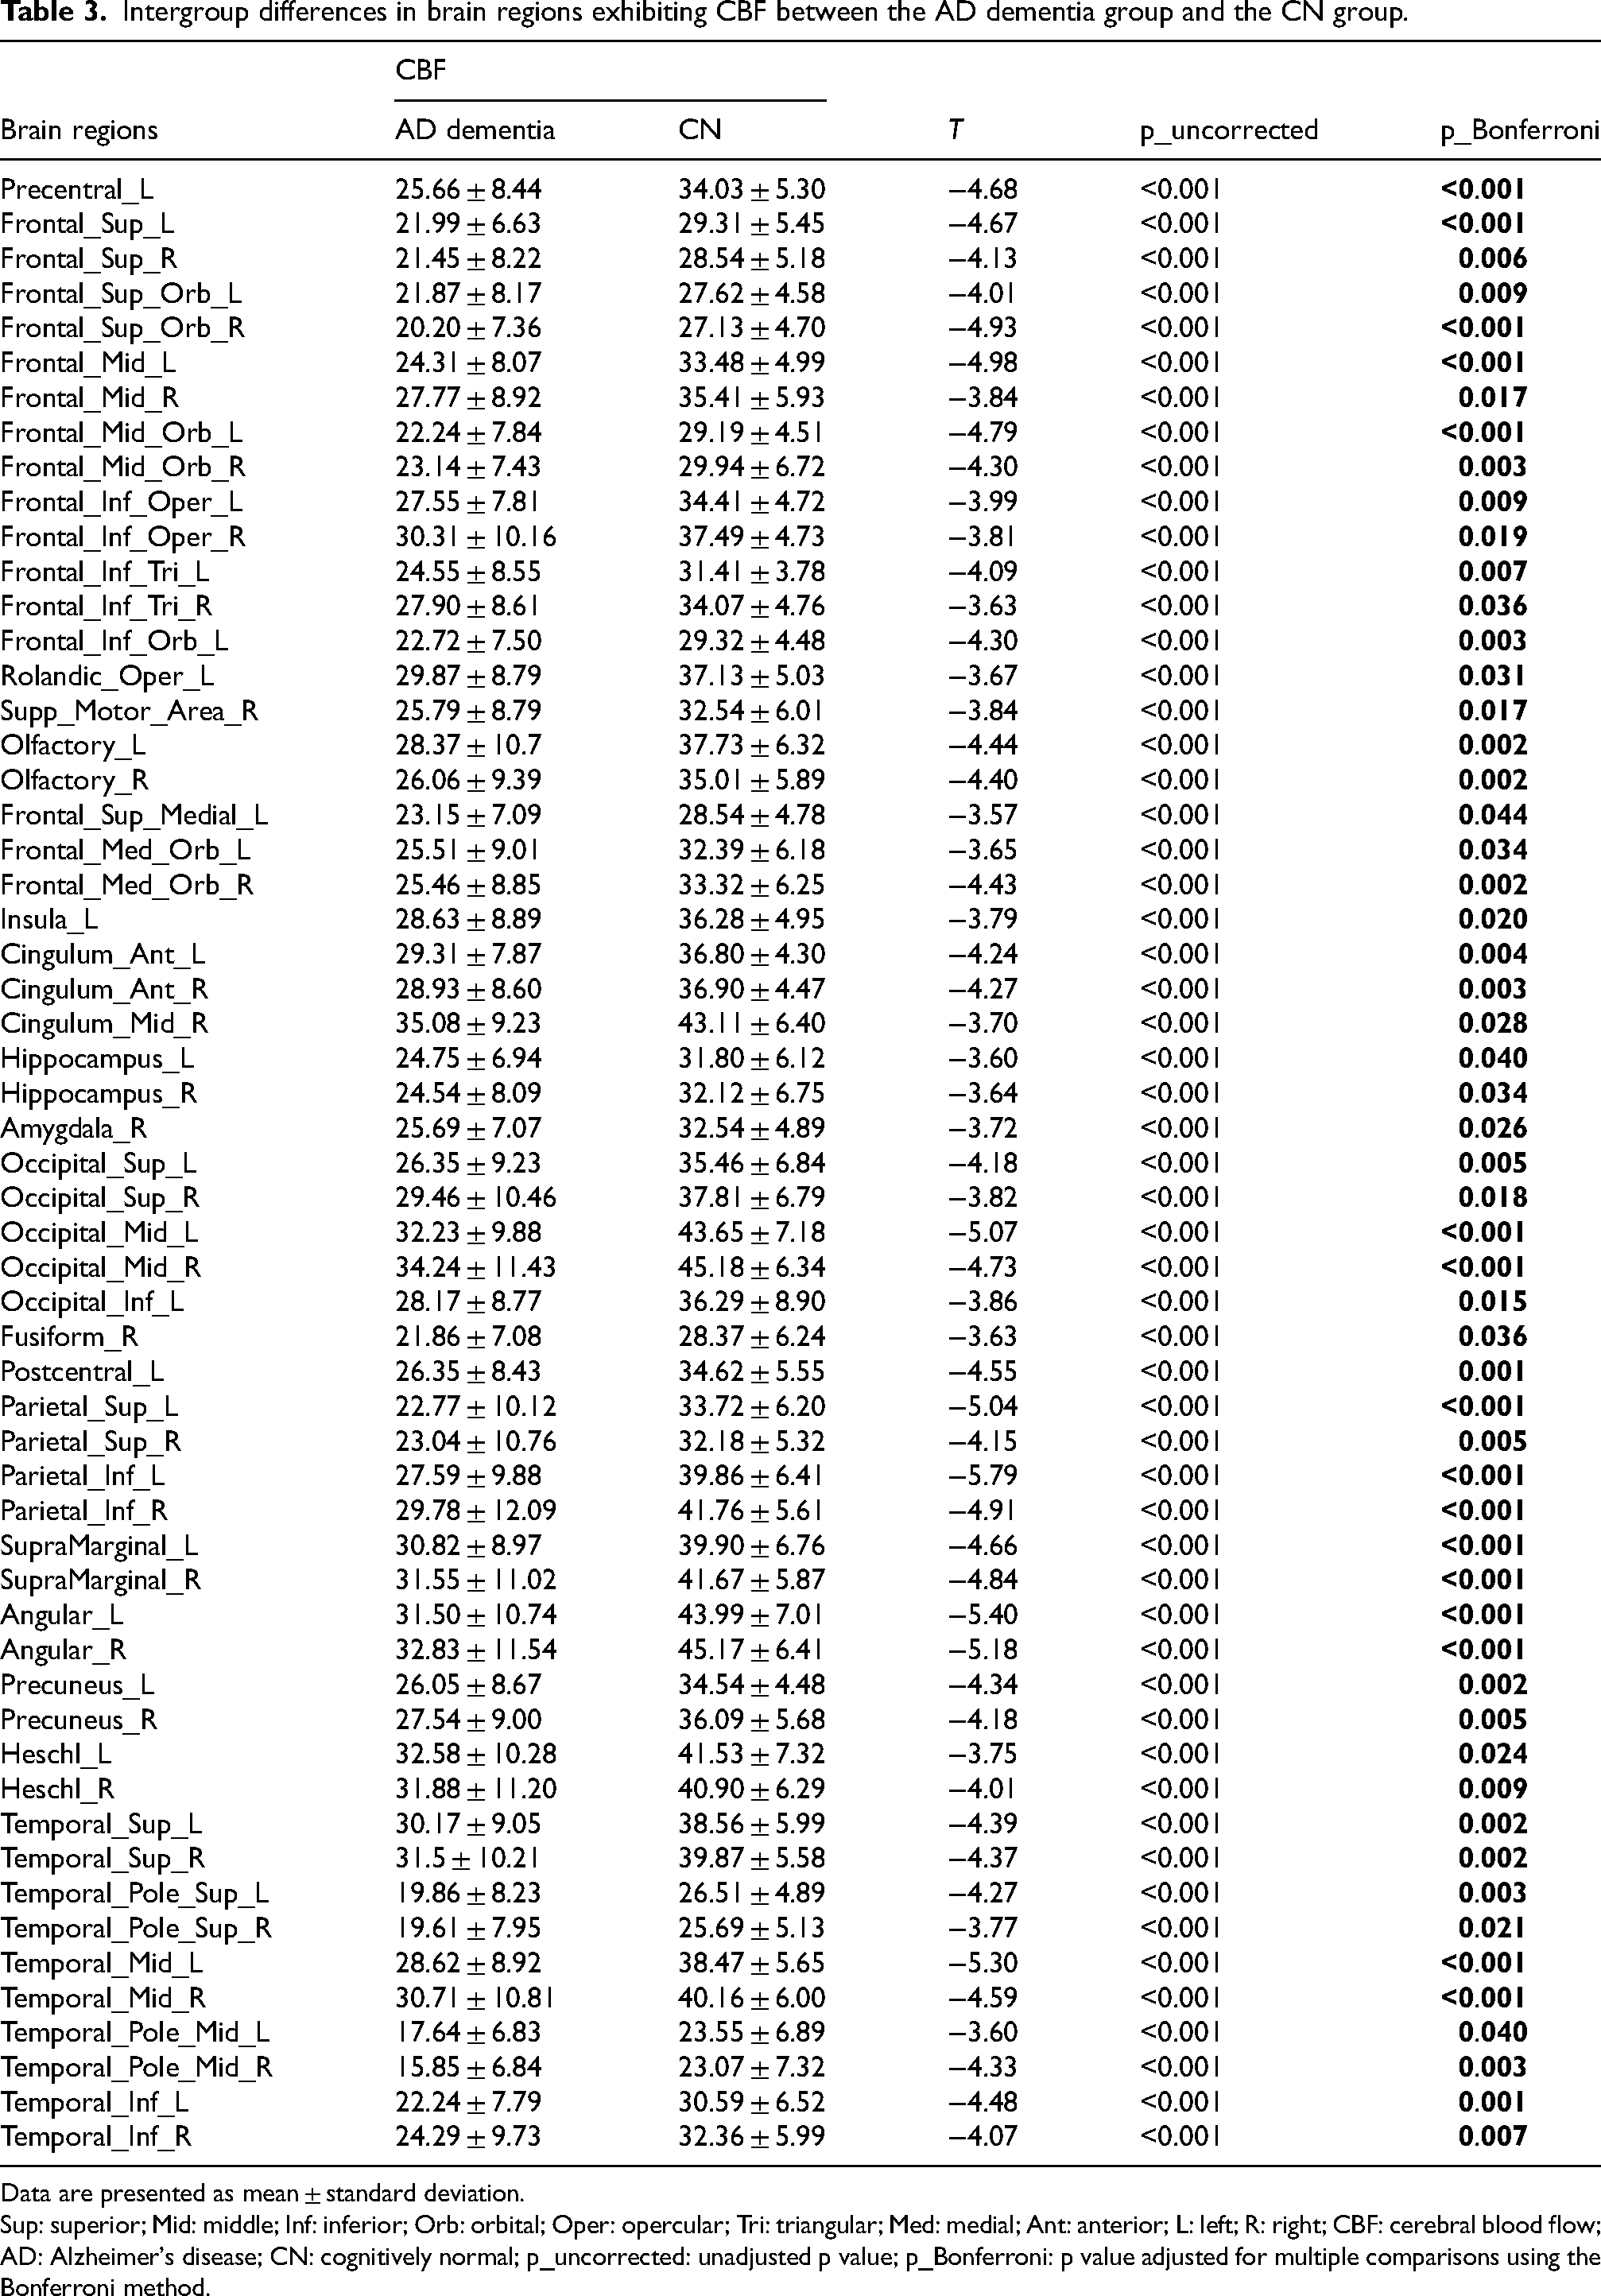
Data are presented as mean ± standard deviation.
Sup: superior; Mid: middle; Inf: inferior; Orb: orbital; Oper: opercular; Tri: triangular; Med: medial; Ant: anterior; L: left; R: right; CBF: cerebral blood flow; AD: Alzheimer's disease; CN: cognitively normal; p_uncorrected: unadjusted p value; p_Bonferroni: p value adjusted for multiple comparisons using the Bonferroni method.
Compared with the CN group, the MCI group exhibited significantly decreased CBF values in the left precentral gyrus, left superior frontal gyrus, left middle frontal gyrus, right opercular part of inferior frontal gyrus, right triangular part of inferior frontal gyrus, bilateral supplementary motor area, right orbital part of middle frontal gyrus, bilateral middle occipital gyrus, right inferior occipital gyrus, bilateral postcentral gyrus, left superior parietal lobule, left inferior parietal lobule, bilateral supramarginal gyrus, right angular gyrus, and left middle temporal gyrus (p_Bonferroni < 0.05). These results are detailed in Table 4 and illustrated in Figure 1B.
Intergroup differences in brain regions exhibiting CBF between the MCI group and the CN group.
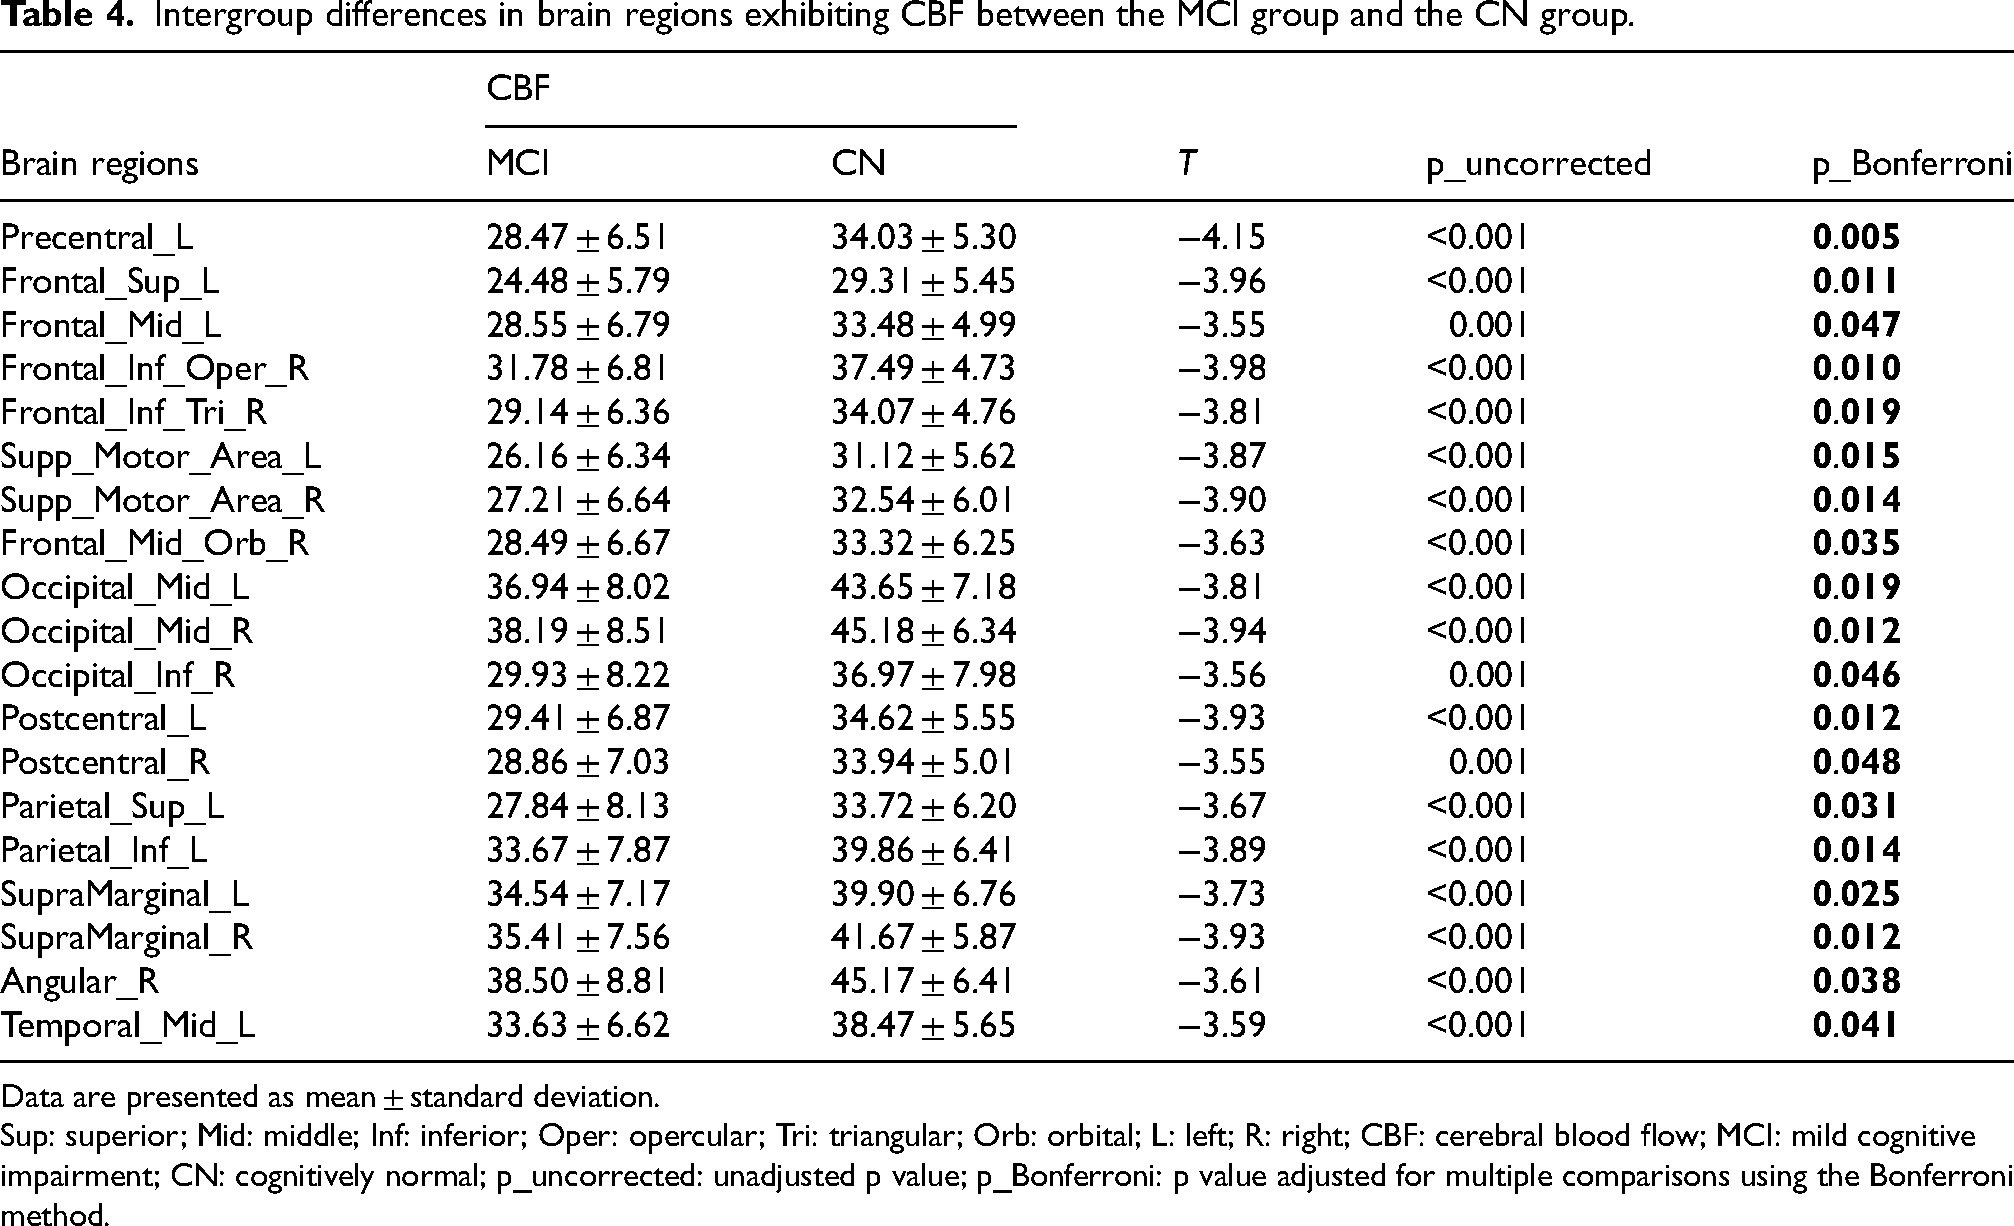
Data are presented as mean ± standard deviation.
Sup: superior; Mid: middle; Inf: inferior; Oper: opercular; Tri: triangular; Orb: orbital; L: left; R: right; CBF: cerebral blood flow; MCI: mild cognitive impairment; CN: cognitively normal; p_uncorrected: unadjusted p value; p_Bonferroni: p value adjusted for multiple comparisons using the Bonferroni method.
Region-based whole-brain analysis of CBF-susceptibility coupling
When compared with CN controls, participants with AD dementia exhibited substantially reduced coupling values in numerous cortical and subcortical regions. Anatomically, these regions spanned the precentral, superior frontal, and middle frontal gyri on both sides; the triangular portion of the left inferior frontal gyrus; bilateral supplementary motor and medial superior frontal cortices; the left inferior parietal lobule; bilateral supramarginal and angular gyri; the right precuneus; the superior, middle, and inferior temporal gyri (with the latter two represented predominantly on the right); bilateral fusiform and parahippocampal gyri; bilateral cuneus; bilateral supramarginal gyri; the anterior, middle (bilaterally), and left posterior cingulate cortices; bilateral insulae; and the right caudate nucleus (p_Bonferroni < 0.05). These results are detailed in Table 5 and illustrated in Figure 2A.
Brain regions showing significant differences in CBF-susceptibility coupling between three groups. (A) AD dementia versus CN group; (B) AD dementia versus MCI group.
Intergroup differences in brain regions exhibiting CBF-susceptibility coupling between the AD dementia group and the CN group.
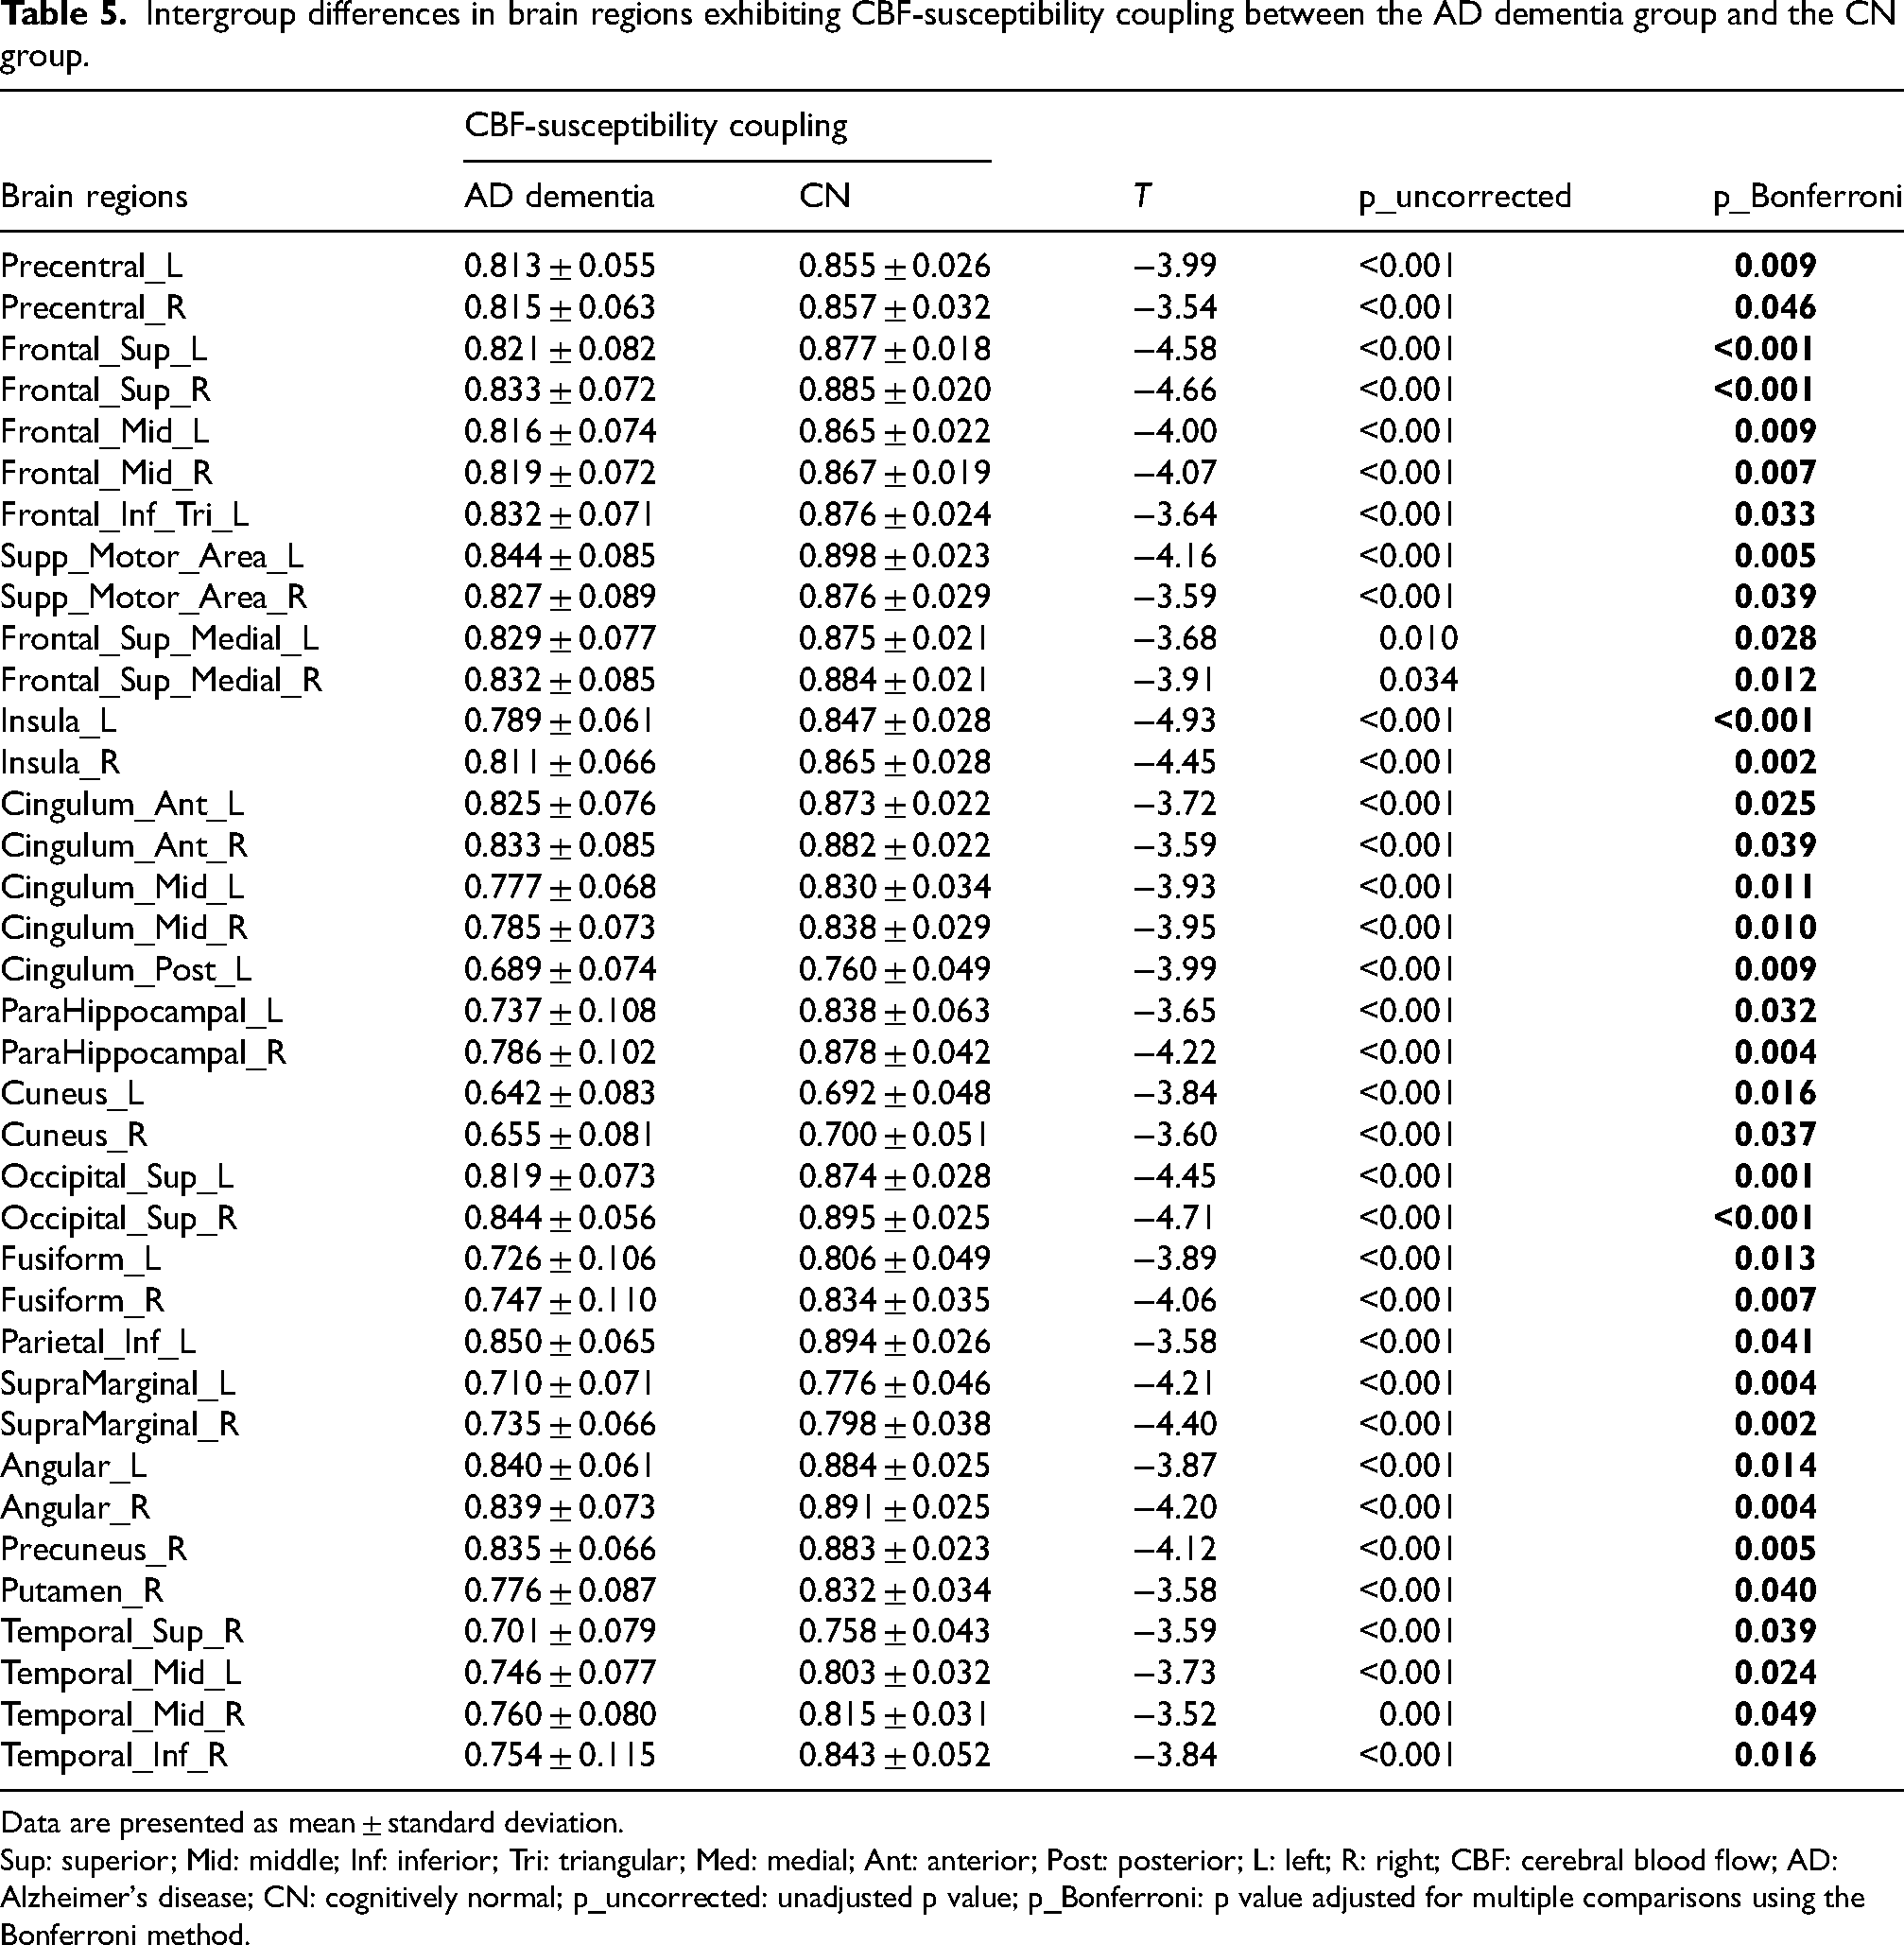
Data are presented as mean ± standard deviation.
Sup: superior; Mid: middle; Inf: inferior; Tri: triangular; Med: medial; Ant: anterior; Post: posterior; L: left; R: right; CBF: cerebral blood flow; AD: Alzheimer's disease; CN: cognitively normal; p_uncorrected: unadjusted p value; p_Bonferroni: p value adjusted for multiple comparisons using the Bonferroni method.
In comparison to the MCI cohort, patients with AD dementia showed statistically significant reductions in CBF-susceptibility coupling within several cerebral regions. The affected regions were distributed as follows: bilateral precentral gyri and frontal gyri (superior, middle, and inferior, the latter encompassing the insular cap); the triangular part of the left inferior frontal gyrus; supplementary motor and supramarginal regions on both sides; the angular gyrus on the right; the left transverse temporal gyrus; superior temporal and parietal gyri bilaterally; bilateral insular cortex; anterior and middle cingulate cortices (bilaterally); the right hippocampus; bilateral caudate nuclei; the right putamen; and the left thalamus (p_Bonferroni < 0.05). These results are detailed in Table 6 and illustrated in Figure 2B.
Intergroup differences in brain regions exhibiting CBF-susceptibility coupling between the AD dementia group and the MCI group.
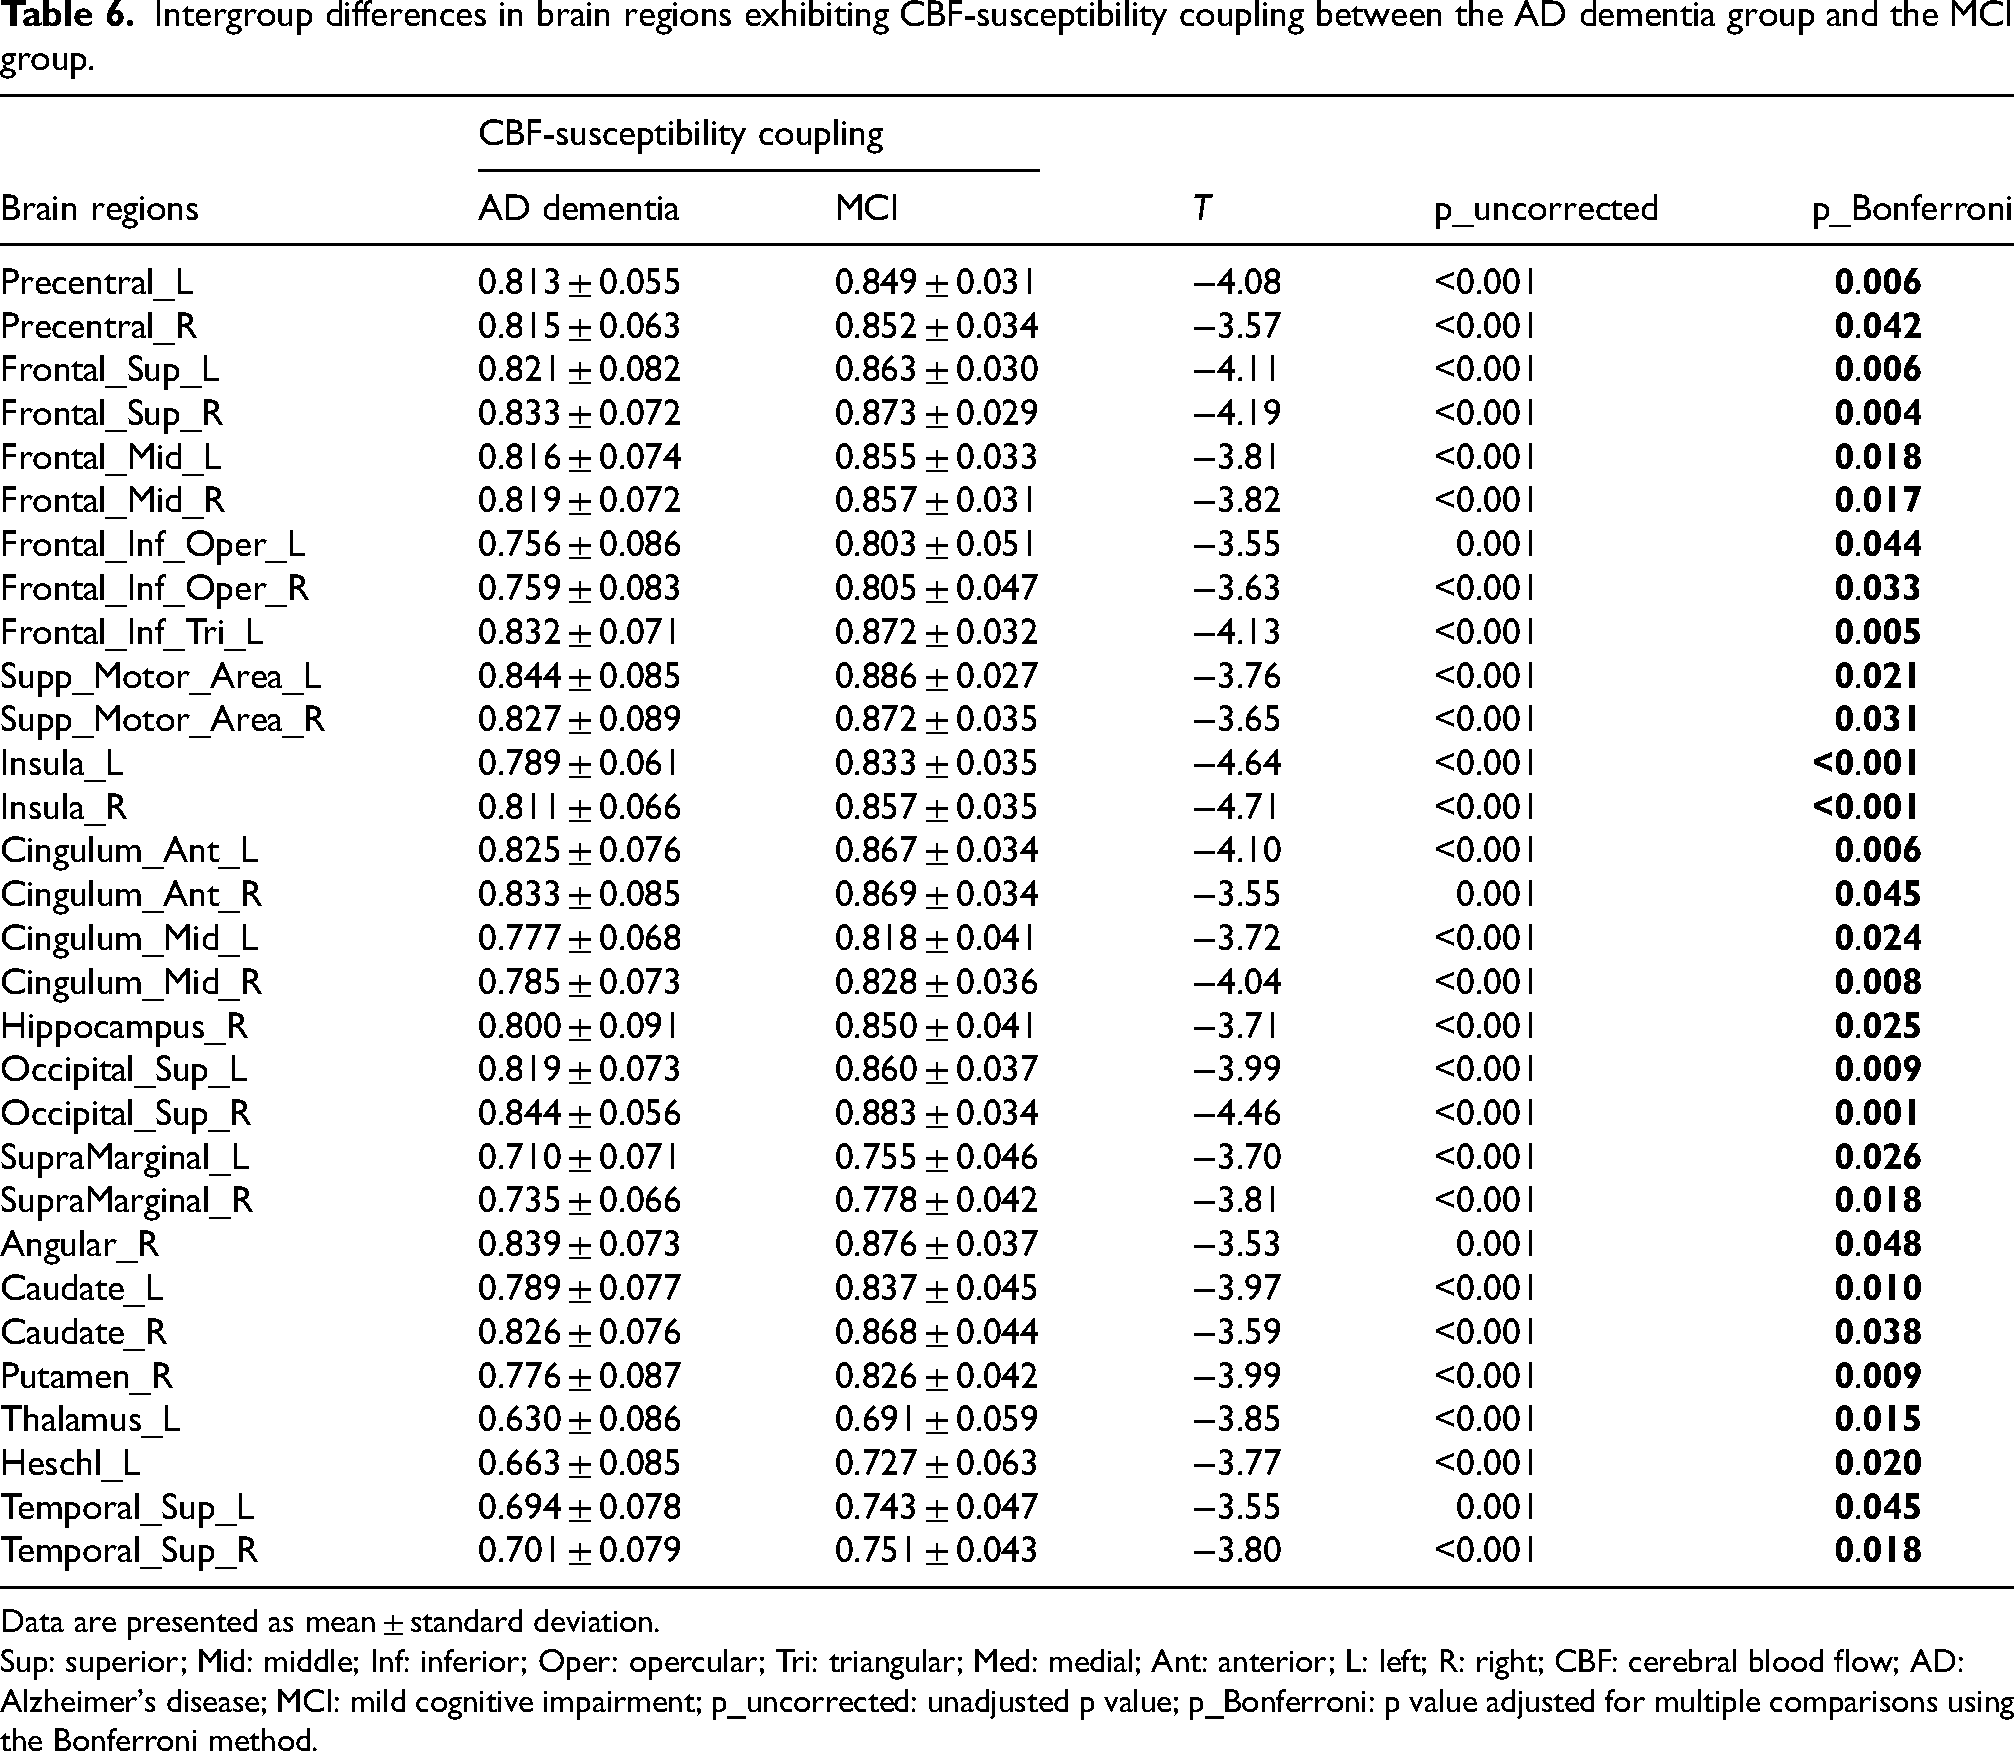
Data are presented as mean ± standard deviation.
Sup: superior; Mid: middle; Inf: inferior; Oper: opercular; Tri: triangular; Med: medial; Ant: anterior; L: left; R: right; CBF: cerebral blood flow; AD: Alzheimer's disease; MCI: mild cognitive impairment; p_uncorrected: unadjusted p value; p_Bonferroni: p value adjusted for multiple comparisons using the Bonferroni method.
Association between CBF-susceptibility coupling and cognitive function, plasma biomarkers, and inflammatory factors in AD dementia and MCI groups
To investigate the associations of CBF-susceptibility coupling and cognitive function, plasma biomarkers, and inflammatory factors, this study performed partial correlation analysis on significantly different brain regions in the AD dementia group and MCI group.
In patients with AD dementia, significant positive correlations were observed between CBF-susceptibility coupling values and scores from both the MMSE and AFT across a widely distributed and largely overlapping set of brain regions. This convergent network primarily involved frontal (including precentral, superior, middle, and inferior gyri), parietal (superior and inferior lobules, supramarginal and angular gyri), temporal (superior, middle, and inferior gyri, fusiform, and parahippocampal gyri), limbic (anterior, middle, and posterior cingulate cortices, insula), and subcortical (caudate, putamen, thalamus) structures (r = 0.38–0.63, p_FDR = 0.047–0.009). The Aβ42/Aβ40 ratio was significantly and positively correlated with CBF-susceptibility coupling values in the left supplementary motor area (r = 0.63, p_FDR = 0.005) and right supplementary motor area (r = 0.65, p_FDR = 0.004). After FDR correction, CBF-susceptibility coupling showed no association with inflammatory factors. All correlation results are visually summarized in Figure 3A.
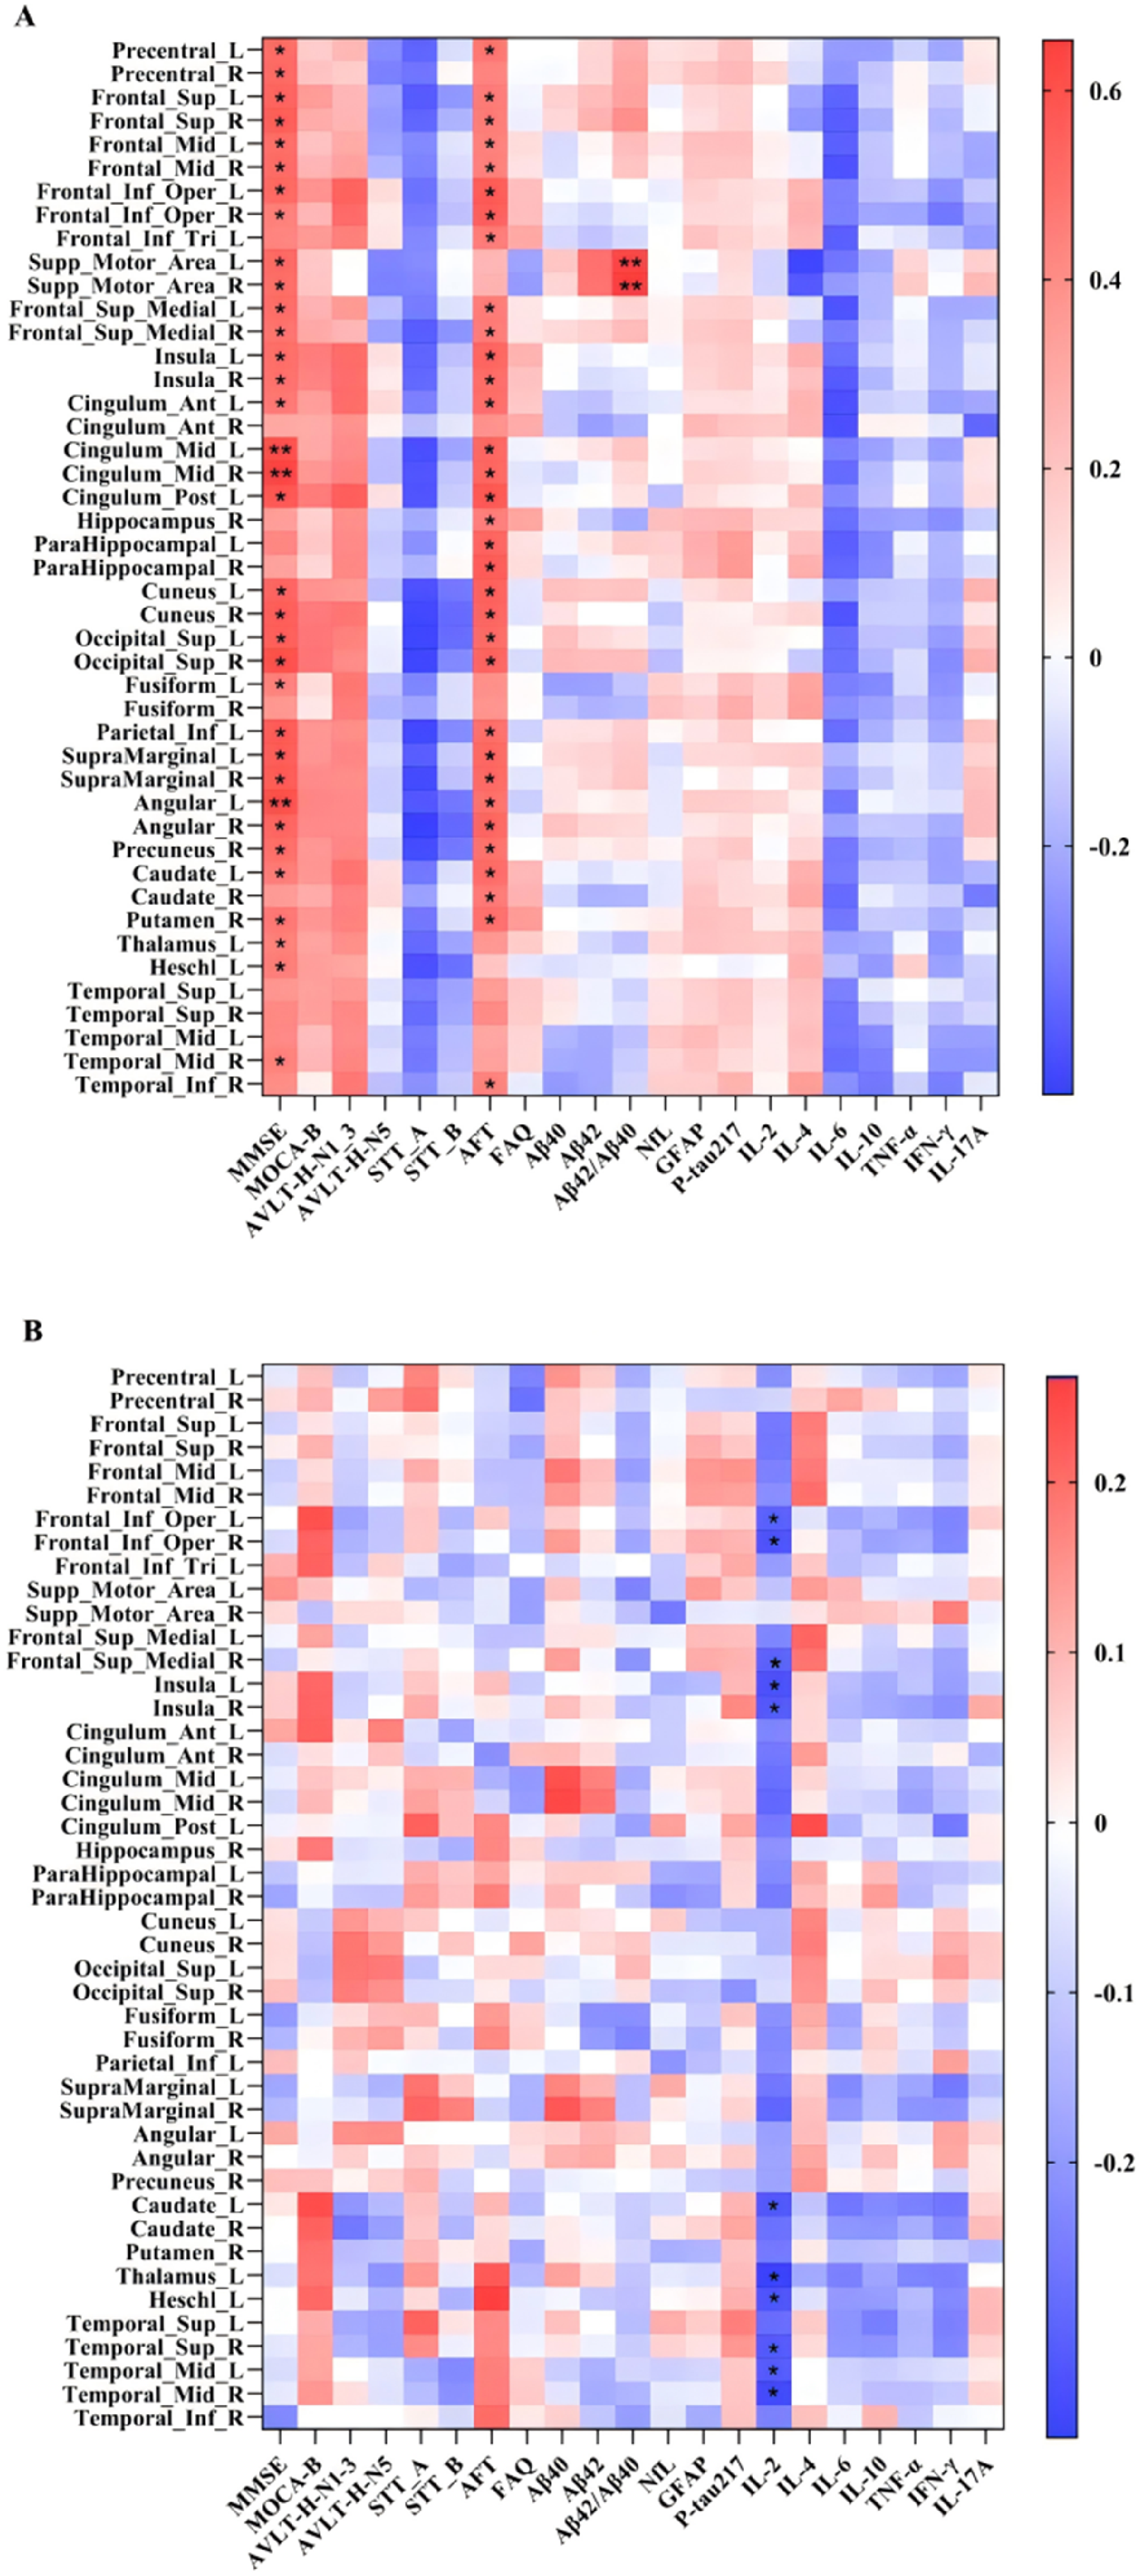
Correlations between CBF-susceptibility coupling and cognitive scores, plasma biomarkers, and inflammatory factors in the AD dementia group (A) and MCI group (B). Adjusted for age, sex, education level, and APOE4 status. FDR was used for multiple comparison correction. Color gradients indicate correlation coefficients. *p < 0.05, **p < 0.01.
In the MCI group, IL-2 levels showed significant negative correlations with coupling in the bilateral inferior frontal insular cortex, right medial superior frontal gyrus, bilateral insula, left caudate nucleus, left thalamus, left transverse temporal gyrus, right superior temporal gyrus, and left middle temporal gyrus (r = -0.36 to −0.28, p_FDR = 0.038–0.048). After FDR correction, CBF-susceptibility coupling showed no association with plasma biomarkers or cognitive function scores (Figure 3B).
Mediation analysis
This study performed a mediation analysis focused on the bilateral supplementary motor areas to investigate whether CBF-susceptibility coupling mediates the link between the Aβ42/Aβ40 ratio and global cognition (measured by the MMSE) in a pooled cohort of AD dementia and MCI participants. Statistically significant indirect effects were observed for both hemispheres, supporting a mediation effect of coupling on the association linking the amyloid biomarker to cognitive outcomes (left: indirect effect = 1.443, 95% confidence interval (CI) [0.55, 3.00]; right: indirect effect = 1.080, 95% CI [0.24, 2.32]) (Figure 4).
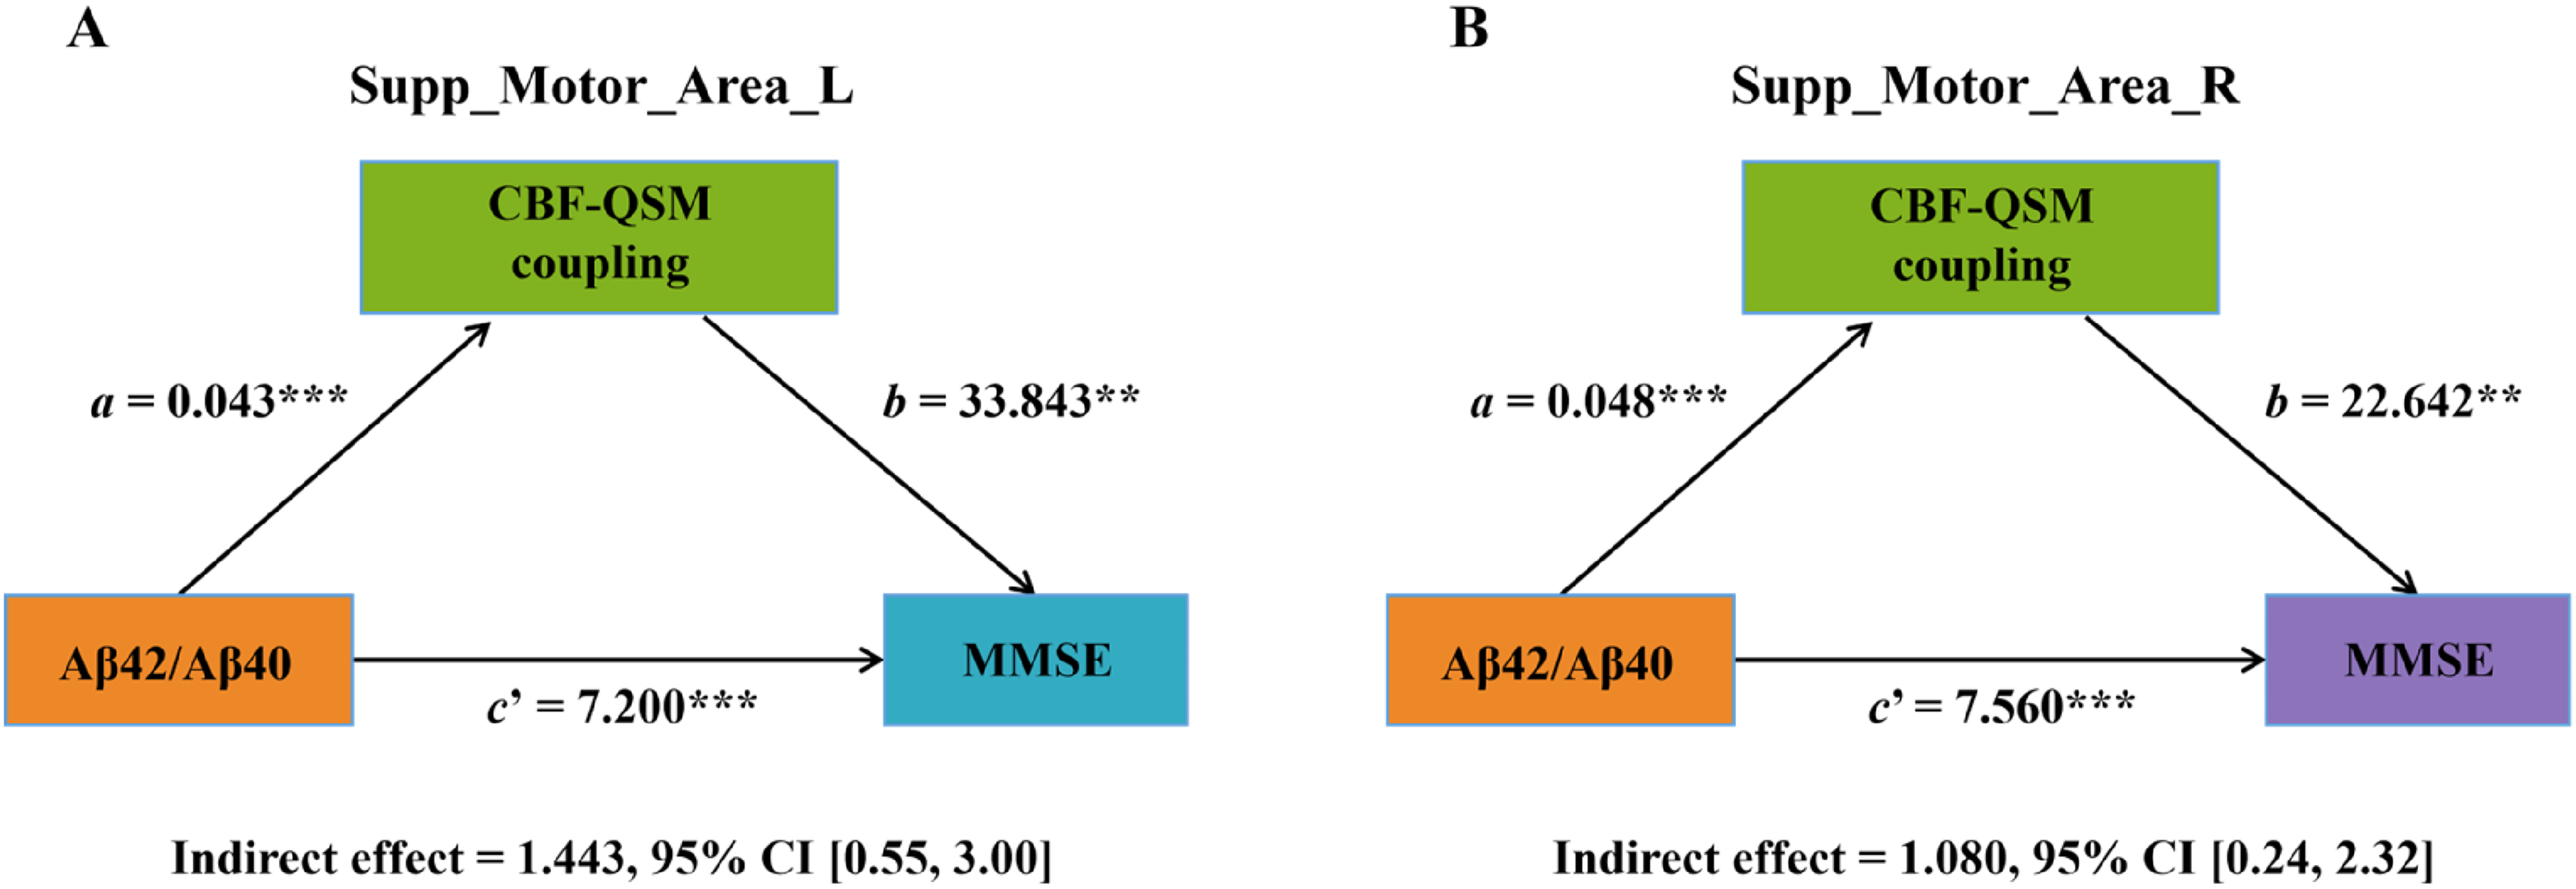
Relationship between the Aβ42/Aβ40 ratio and MMSE score mediated by CBF-susceptibility coupling in bilateral supplementary motor areas. a = path coefficient from Aβ42/Aβ40 ratio to CBF-QSM coupling; b = path coefficient from CBF-QSM coupling to MMSE score; c’ = direct effect after controlling for mediating variables. (A) Left supplementary motor area: a = 0.043, p < 0.001; b = 33.843, p < 0.001; c’ = 7.200, p < 0.001; indirect effect = 1.443, 95% CI [0.55, 3.00]. (B) Right supplementary motor area: a = 0.048, p < 0.001; b = 22.642, p = 0.005; c’ = 7.560, p < 0.001; indirect effect = 1.080, 95% CI [0.24, 2.32]. All mediating effects were calculated using 5000 bootstraps, and the indirect effect is statistically significant if the 95% CI does not include zero. ***p < 0.001, **p < 0.01. Supp_Motor_Area: supplementary motor area; L: left; R: right.
Discussion
This study represents the first systematic investigation of changes in CBF-susceptibility coupling across the AD spectrum. We found that compared with CN controls, both the AD dementia and MCI groups exhibited significant CBF reduction that extensively involved multiple cortical and subcortical brain regions, with the AD dementia group showing more widespread CBF reduction; in contrast, intergroup differences in susceptibility were relatively weak and inconsistent. In terms of coupling, the AD dementia group had significantly lower CBF-susceptibility coupling values than the MCI and CN groups in multiple cortical and subcortical regions including the right hippocampus and bilateral supplementary motor areas, and the coupling values in most of these differentially affected brain regions were significantly and positively correlated with MMSE scores, AFT scores and plasma Aβ42/Aβ40 ratio. In the combined cohort of AD dementia and MCI patients, CBF-susceptibility coupling in the bilateral supplementary motor areas partially mediated the association between the Aβ42/Aβ40 ratio and MMSE scores. In the MCI group, CBF-susceptibility coupling values in multiple brain regions such as the left caudate nucleus and left middle temporal gyrus were significantly and negatively correlated with IL-2 levels. These findings elucidate the neural mechanisms underlying cognitive decline in AD from the novel perspective of CBF-iron metabolism coupling, thereby providing new insights into its pathophysiological processes.
Previous studies have confirmed widespread reductions in CBF in AD,24–26 as well as iron deposition in regions such as the hippocampus and putamen. 27 AD early stages can witness cerebral hypoperfusion in regions like the hippocampus, with further perfusion reduction in the advanced stages. This is consistent with our findings that the AD dementia group showed more extensive CBF reduction than the MCI group. 28 Iron is an essential element for sustaining normal neurological functions within the brain. 29 Imbalances in iron metabolism can lead to iron ion deposition within the body, subsequently inducing oxidative stress reactions that damage cells. In AD, oxidative stress induced by cerebral iron deposition exacerbates Aβ accumulation and tau hyperphosphorylation, thereby damaging neurons and causing cognitive decline. 30 Iron is the main source of paramagnetic susceptibility, and QSM signals are highly sensitive to changes in iron content ; thus, susceptibility values can largely reflect iron content, but they are also affected by other diamagnetic substances such as myelin, Aβ and tau proteins. 31 Multiple QSM-based studies have reported increased susceptibility values (mainly reflecting iron deposition) in cortical and subcortical brain regions of AD patients, particularly in basal ganglia regions such as the putamen, and such increases are associated with cognitive decline27,32; however, other studies have reported inconsistent results, namely increased, decreased or non-significant susceptibility values in cerebral cortical regions. 31 In the present study, intergroup differences in susceptibility were relatively weak and inconsistently distributed, which is consistent with previous reports on the heterogeneity of iron deposition in AD and may be attributed to the complex characteristics of QSM signals and the technical limitations of QSM. Studies have shown that techniques such as high-resolution QSM and multi-echo susceptibility-weighted imaging can improve the sensitivity and accuracy of detecting iron deposition in small brain regions, 33 which may enhance the precision of iron quantification and thereby improve the reliability of perfusion–iron coupling assessment in AD.
The subtle and regionally restricted susceptibility alterations in MCI indicate that single-modality QSM has limited utility for early AD detection, whereas CBF changes are more robust and consistent across the entire disease spectrum. CBF-susceptibility coupling exhibited more robust and widespread intergroup differences than either single modality alone, highlighting its sensitivity to CBF-iron metabolism dysfunction. The regions with reduced coupling in the AD dementia group (e.g., bilateral supplementary motor areas, right hippocampus, right putamen) largely overlapped with the hypoperfused regions in both the AD dementia and MCI groups, as well as the right amygdala (where susceptibility was elevated in AD dementia). This overlap suggests that coupling disruption arises from the interplay of hypoperfusion and iron dyshomeostasis, rather than either factor in isolation.
Disruptions in cerebral iron regulation may thus establish a pathophysiological substrate for cerebrovascular disorders, and conversely, vascular alterations can further exacerbate iron dyshomeostasis. Diminished CBF-susceptibility coupling potentially reflects a decoupling between vascular function and iron metabolism. As a key cofactor for mitochondrial enzymes, iron sustains high levels of cerebral energy metabolism. Adequate CBF ensures iron delivery across the blood-brain barrier via transferrin receptors, while iron availability modulates vascular function by regulating nitric oxide synthase activity and blood-brain barrier integrity. 29 Under physiological conditions, increased metabolic demand (and concomitant elevated iron utilization) triggers vasodilation and increased CBF to replenish supplies, and sufficient CBF optimizes iron distribution. 10 In AD, this coordinated state is disrupted: widespread hypoperfusion reduces iron delivery, leading to insufficient iron for metabolic processes in some regions and compensatory iron accumulation in others (e.g., the amygdala). At the same time, iron dyshomeostasis induces oxidative stress, which damages vascular endothelium and further reduces CBF. The resulting decoupling of CBF and susceptibility reflects this failure of coordination, exacerbating neuronal dysfunction. The AD dementia group exhibited significantly reduced CBF-susceptibility coupling compared with both the CN and MCI groups, and this reduction associated with cognitive decline. These findings validate our hypothesis that impaired coupling between cerebral perfusion and iron metabolism may underlie cognitive deficits in AD dementia, suggesting that CBF-susceptibility coupling could serve as a promising neuroimaging biomarker for this disorder.
This study also preliminarily explored the complex associations between CBF-susceptibility coupling and plasma biomarkers and inflammatory factors. The plasma Aβ42/Aβ40 ratio is a well-established plasma biomarker for AD that predicts the severity of cognitive decline. We found that CBF-susceptibility coupling in the bilateral supplementary motor areas of AD dementia patients positively correlated with plasma Aβ42/Aβ40 ratio and partially mediated the association between Aβ42/Aβ40 ratio and MMSE scores. This suggests that Aβ pathology may indirectly impair cognition by disrupting CBF-susceptibility coupling in the supplementary motor areas. The supplementary motor area plays a central role in behavioral planning and motor execution. 34 Early motor decline may be associated with the accumulation of AD pathology, 35 such as Aβ plaques. We hypothesize that disrupted CBF-susceptibility coupling in the supplementary motor area likely serves as a critical bridge linking typical AD pathology to clinical motor decline.
Neuroinflammation is a major driver in AD, and multiple reports have reported elevated IL-6 and IL-2 levels in both the brain and periphery of AD patients, which are positively correlated with cognitive impairment and pathological severity.36,37 Proinflammatory factors such as IL-6, IL-2, and TNFα exert neurotoxic effects by activating microglia and astrocytes, thereby promoting AD progression. 38 In this study, CBF-susceptibility coupling values in specific regions such as the middle temporal gyrus and hippocampus showed negative correlations with IL-2 levels in the MCI group. This pattern supports a model in which neuroinflammatory activity precedes overt amyloid-dependent vascular–metabolic failure, potentially priming vulnerable regions for subsequent degeneration. Neuroinflammation may therefore serve as a key upstream driver of early CBF-iron metabolism decoupling. These findings further enrich our comprehensive understanding of the mechanisms underlying cognitive decline in AD.
As an integrative neuroimaging marker that captures failure of vascular–metabolic coordination, CBF-susceptibility coupling offers unique value for early AD detection and disease stratification. Unlike single-modality measures, it can detect subtle dysfunction before obvious changes in CBF or iron content occur, making it a promising tool for monitoring therapies targeting vascular function, iron homeostasis, or neuroinflammation.
Several limitations should be acknowledged. First, the cross-sectional design precludes causal inference. Second, QSM-derived susceptibility is an iron-enriched but non-specific marker that reflects composite magnetic sources beyond iron content (e.g., myelin or Aβ proteins). Future studies incorporating advanced susceptibility techniques such as high-resolution QSM may improve the ability of iron-specific detection. In addition, ASL-derived CBF is sensitive to arterial blood flow delay in AD. These methodological constraints may introduce bias into the estimation of CBF-susceptibility coupling and should therefore be interpreted with caution. Third, plasma biomarkers may not fully reflect central nervous system pathology, and future studies incorporating cerebrospinal fluid biomarkers would provide more direct validation. Finally, future longitudinal studies are warranted to delineate the temporal trajectory of coupling disruption and to evaluate its predictive value for conversion from MCI to AD.
Conclusions
This study systematically reveals for the first time the pattern of altered coupling between CBF and iron metabolism in AD patients. CBF-susceptibility coupling exhibited more robust and widespread intergroup differences than either single modality alone. AD dementia patients showed widespread reduction in CBF-susceptibility coupling in multiple cortical and subcortical regions including the bilateral supplementary motor areas, right hippocampus and right putamen, which was associated with cognitive decline and decreased plasma Aβ42/Aβ40 ratio. Meanwhile, CBF-susceptibility coupling in the bilateral supplementary motor areas partially mediates Aβ pathology and cognitive function, indicating that dysfunction in CBF-iron metabolism coupling may represent a potential mechanism underlying AD neuropathology. Furthermore, the reduced CBF-susceptibility coupling in specific brain regions (e.g., the middle temporal gyrus and hippocampus) of MCI patients were significantly correlated with elevated IL-2 levels, suggesting that neuroinflammation may serve as a key upstream driver of early CBF-iron metabolism decoupling. These findings should be interpreted with caution, as QSM-derived susceptibility reflects composite magnetic sources beyond iron, and ASL-derived CBF is susceptible to arterial transit delays in AD, which may introduce bias into the coupling estimation.
Footnotes
Acknowledgements
The authors would like to thank all the participants for their time and effort.
Ethical considerations
This study was approved by the Ethics Committee of Hainan General Hospital in accordance with the Declaration of Helsinki.
Consent to participate
Written informed consent was obtained from all participants.
Consent for publication
Not applicable
Author contribution(s)
Funding
The authors disclosed receipt of the following financial support for the research, authorship, and/or publication of this article: This work was supported in part by the Key Science and Technology Project of Hainan Province (grant number ZDYF2024SHFZ058, ZDYF2023SHFZ096), the National Natural Science Foundation of China (grant number 82271977, 82572211, 82160327), the Academic Enhancement Support Program of Hainan Medical University (grant number XSTS2026073),the Hainan Academician Innovation Platform Scientific Research Project (grant number YSPTZX202514), the Hainan Provincial Natural Science Foundation of China (grant number 825RC870), the Hainan Province Clinical Medical Center, and the Innovation Platform for Academicians of Hainan Province.
Declaration of conflicting interests
The authors declared no potential conflicts of interest with respect to the research, authorship, and/or publication of this article.
Data availability statement
The data that support the findings of this study are available on request from the corresponding author when the appropriate data sharing agreements are consented.