
Abstract
Background
Post-stroke cognitive impairment (PSCI) is a major vascular contributor to dementia, significantly impacting long-term recovery and quality of life. Developing accurate prediction models are essential for early identification and timely intervention in high-risk individuals.
Objective
To develop and validate a stacking-based multimodal machine learning model integrating clinical, demographic, and neuroimaging features for early PSCI prediction in acute ischemic stroke (AIS) patients.
Methods
In this retrospective cohort study, 1070 AIS patients admitted to Lianyungang First People's Hospital from January 2020 to August 2023 were included. Demographic, clinical, and neuroimaging data were collected, and cognitive function was assessed 3–6 months post-stroke. PSCI was defined as a z-score ≤ -2.0 in at least one of four cognitive domains. A stacking ensemble model was developed, combining six base algorithms: XGBoost, Gradient Boosting Decision Trees, CatBoost, Support Vector Machine, Logistic Regression, and LightGBM. The final prediction was generated by a meta-model trained on base model outputs.
Results
Of the 1070 patients (mean age 67.4 ± 9.3 years, 61.5% male), 37.2% developed PSCI. The stacking model achieved 98.13% accuracy, 0.9972 AUC, and 0.9744 F1-score in internal validation. External validation showed 81.00% accuracy, 0.9049 AUC, and 0.8780 recall. Key predictors of PSCI included infarct volume, cortical lesions, medial temporal lobe atrophy, and baseline NIHSS score.
Conclusions
This stacking-based multimodal machine learning model demonstrates robust predictive performance for PSCI risk in AIS patients, serving as a reliable tool for early detection that may inform personalized intervention strategies to prevent progression to post-stroke dementia.
Keywords
Introduction
It is well established that post-stroke cognitive impairment (PSCI) has become a key concern in the field of neurology due to its significant impact on patients’ quality of life, daily functioning, and social interactions. PSCI typically occurs within six months after a stroke and is characterized by deficits in attention, memory, language, and executive functions. 1 These cognitive impairments severely affect the patient's ability to live independently and can lead to long-term disability. Traditional cognitive assessment tools such as the Montreal Cognitive Assessment (MoCA) and the Mini-Mental State Examination (MMSE) are commonly used in clinical practice, but they have limitations in quantifying the multidimensional risk factors of PSCI and fail to meet the demands of early screening.2,3 Therefore, the development of a more precise tool for early identification and intervention of PSCI is essential for improving patient care after stroke.
Previous studies have identified major risk factors associated with PSCI, including hypertension, smoking, diabetes, and dyslipidemia. 4 These modifiable risk factors account for approximately 90% of the total risk for stroke, with hypertension being the most significant risk factor, closely linked to both ischemic stroke and hemorrhagic stroke. The growing importance of multi-omics approaches has contributed to discovering novel biomarkers and understanding the molecular mechanisms of PSCI. 5 These techniques include advanced neuroimaging methods such as magnetic resonance imaging (MRI), positron emission tomography (PET), and diffusion tensor imaging (DTI), as well as cerebrospinal fluid (CSF) analysis, genetic testing, and blood-based biomarkers. While PET and CSF analysis offer valuable insights into neurodegenerative pathology, their invasive nature, specialized technical requirements, and high cost restrict their accessibility. It is worth noting that the burden of stroke is particularly heavy in low- and middle-income countries, which account for 75% of global stroke-related deaths and 81% of stroke-related disability-adjusted life years. 6 Thus, techniques such as genetic testing remain impractical for routine clinical use due to financial constraints. In contrast, MRI offers a non-invasive and clinically feasible approach to assessing brain structure, providing key insights into PSCI-related changes while balancing diagnostic accuracy and resource availability, particularly in settings with access to MRI technology.5–8
PSCI exhibits diverse phenotypic presentations and can be influenced by demographic factors as well as comorbidities associated with stroke. A recent study by Hua et al. (2023) identified significant variations in cognitive trajectories—encompassing global cognition, memory, and visuospatial abilities—before and after stroke within a large cohort of 13,311 patients. 9 Notably, cognitive decline is most pronounced in the early post-stroke phase, and these changes may be influenced by educational background and other individual differences in cognitive capacity. 8
However, despite considerable progress in identifying risk factors and biomarkers for PSCI, several issues remain unresolved. A major limitation of previous studies is the reliance on traditional cognitive assessment tools, such as the MMSE and MoCA, which are insufficient for addressing the multifaceted nature of PSCI and its diverse clinical manifestations.2,3 Furthermore, although neuroimaging features, such as small vessel disease (SVD), have been shown to significantly contribute to PSCI prediction, most studies focus on single features and lack a comprehensive approach that integrates multi-modal imaging data and functional assessments.10,11 These gaps underscore the need for an integrated, easily implementable model capable of rapidly assessing the possibility of PSCI onset, particularly in resource-limited settings where advanced diagnostic tools may not be readily available.
In this study, we aim to address this gap by proposing an innovative stacking multi-modal machine learning model for the early prediction of PSCI. The model integrates the patient's demographic data, neuroimaging features, clinical variables including vascular risk factors and depression, and functional assessments of speech, vision, hearing, and swallowing. The model employs base classifiers such as LightGBM and XGBoost, 12 with a support vector machine (SVM) meta-model to enhance prediction accuracy. Through this multi-modal framework, we propose a novel approach to early detection of PSCI, which may provide more timely and accurate intervention for high-risk patients in clinical settings.
Methods
Study design and population
This retrospective cohort study included 1070 patients admitted to the Department of Neurology at Lianyungang First People's Hospital between January 2020 and August 2023 with a diagnosis of acute ischemic stroke (AIS). In addition to laboratory and imaging assessments, all patients with ischemic stroke included in the study underwent a standardized neuropsychological battery 3 to 6 months following stroke onset. The study was approved by the Medical Ethics Committee of The First People's Hospital of Lianyungang, and all study participants provided informed consent (KY-20240826002-01).
Patients were included based on the following criteria (Figure 1): (1) aged 50–90 years, (2) diagnosis of cerebral infarction consistent with the American Heart Association/American Stroke Association (AHA/ASA) guidelines for the early management of patients with AIS, confirmed by MRI showing acute infarction lesions and exclusion of other brain conditions that may lead to dementia, 13 (3) admitted within 7 days of symptom onset, (4) no history of mood disorders or psychiatric illnesses, (5) willingness to undergo cognitive assessment, (6) availability of informed consent, and (7) complete cranial MRI data. Patients were excluded if they had (1) a history of major psychiatric disorders (e.g., schizophrenia, bipolar disorder) or a severe, active mood disorder, (2) inability or refusal to provide informed consent, (3) premorbid cognitive decline, defined as a documented diagnosis of dementia or mild cognitive impairment, or any history of cognitive impairment treatment prior to the index stroke, as ascertained through medical records and caregiver interviews, (4) neurodegenerative diseases, hereditary cerebral small vessel disease, or other significant brain pathologies that could independently cause cognitive impairment, or (5) inability to complete neuropsychological testing due to hearing loss, poor cooperation, or severe neurological deficits, including aphasia. A total of 133 patients (11.1% of the enrolled cohort of 1203) were excluded due to incomplete neuroimaging data or loss to follow-up at the 3-to-6-month cognitive assessment. The final analysis was therefore conducted on 1070 patients with complete data.
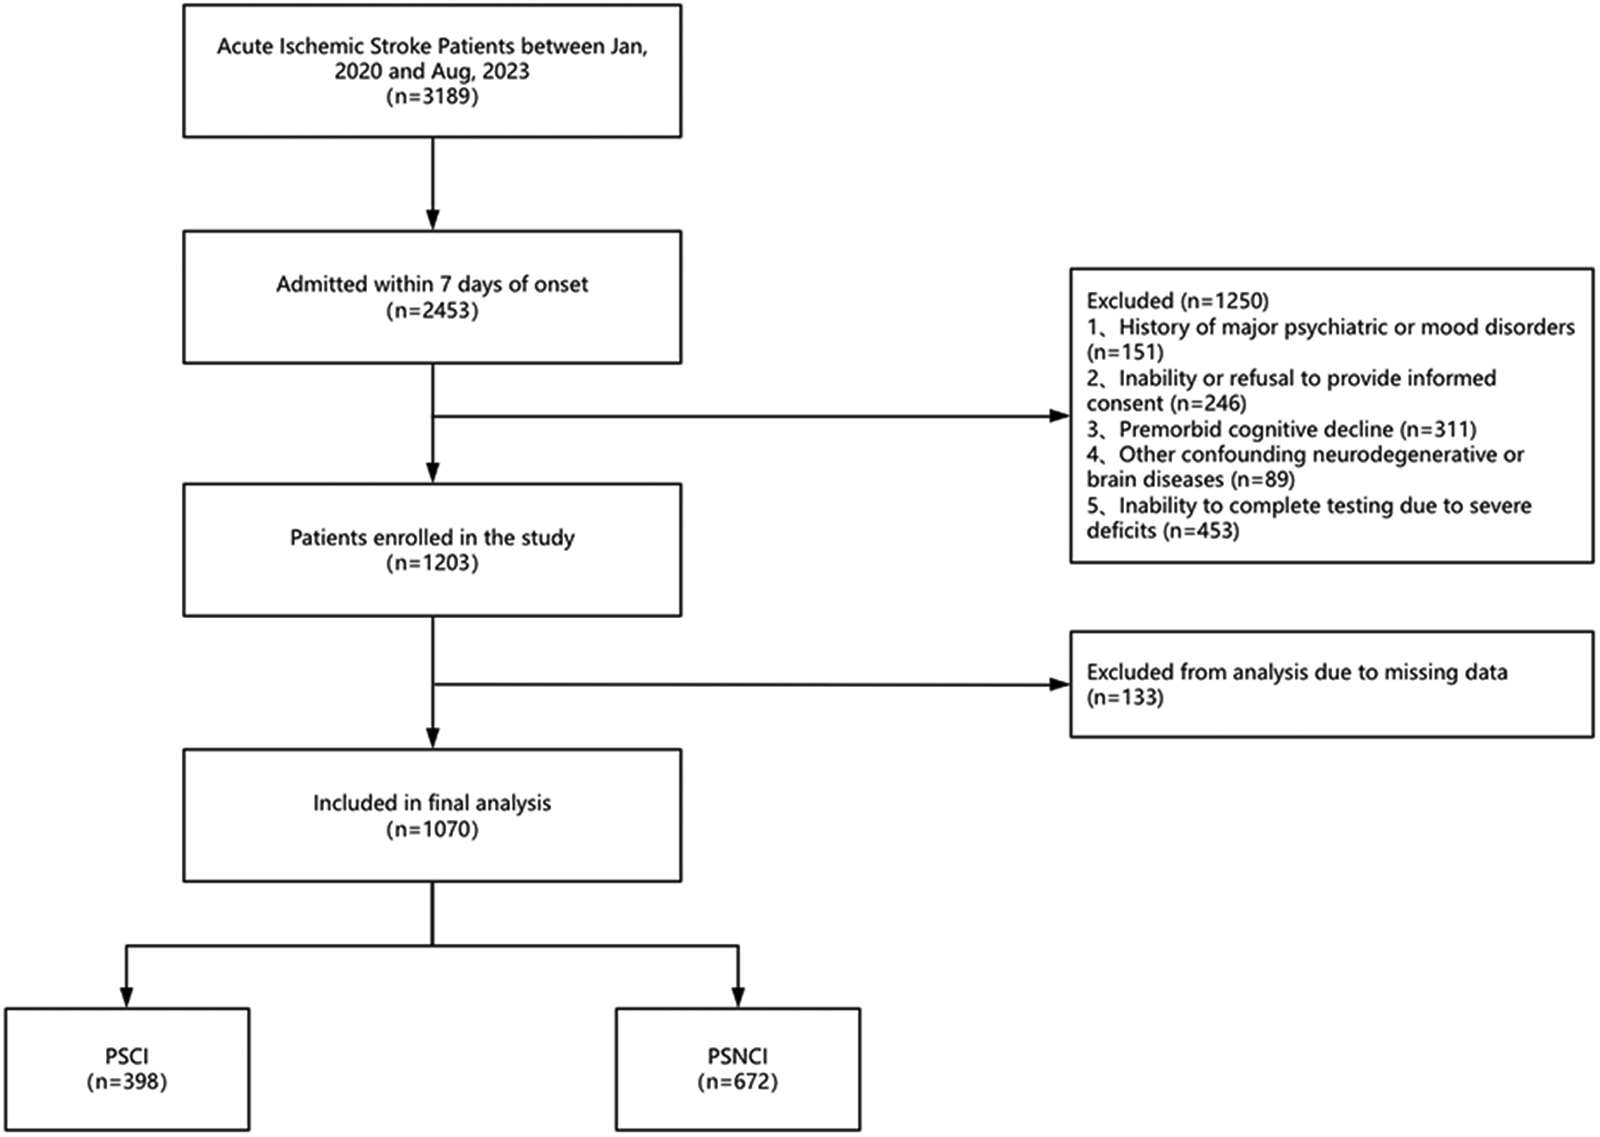
Inclusion and exclusion flow chart of the PSCI study.
Post-stroke cognitive impairment
Cognitive performance was assessed within 7 days post-stroke using the MoCA and MMSE to evaluate cognitive status during the acute phase. To mitigate potential practice effects arising from item overlap, the administration order of the two tests was counterbalanced across participants. For the assessment of PSCI, the cognitive function was assessed 3 to 6 months after stroke using a standardized neuropsychological battery evaluating five cognitive domains 14 : memory (story memory, word list learning), language (picture naming, verbal fluency), executive function (Stroop Color-Word Test, Trail Making Test Part B), attention, and visuospatial function (Clock Drawing Test, Rey-Osterrieth Complex Figure Test). For patients with mild aphasia, only non-verbal subtests were administered, and the total score was prorated accordingly. Raw scores from each test were adjusted for age, sex, and education to generate standardized z-scores. Domain-specific scores were calculated as the average z-score of all relevant tests within each cognitive domain. PSCI was defined as having a z-score ≤ −2 standard deviations in at least one cognitive domain (memory, language, executive function, attention, or visuospatial function).
Brain imaging
All participants underwent brain MRI within seven days of stroke onset using two 3.0-T whole-body MRI systems (GE Signa HDx or Philips Ingenia) with an 8-channel head coil. Imaging protocols included T1-weighted imaging (T1WI), T2-weighted imaging (T2WI), and fluid-attenuated inversion recovery (FLAIR) sequences, which provided high-resolution structural details for stroke evaluation. Imaging data included critical lesion characteristics, such as laterality, multifocality, and volume of infarction. Lesion locations were categorized as cortical, subcortical, or infratentorial regions. Additionally, cortical thickness and subcortical volumes were measured from baseline structural T1-weighted images using FreeSurfer 7.4.1 to obtain quantitative morphometric measures. Strategic lesion locations associated with cognitive function were identified, including the basal ganglia, thalamus, hippocampus, caudate nucleus, inferomedial temporal gyrus, and angular gyrus.10,15 Global brain metrics, such as total brain surface area and volume, and region-specific measures, including hippocampal and amygdala volumes, were extracted. The brain volume refers to the total brain parenchyma volume excluding the ventricular volume (such as the lateral ventricles and third ventricle), providing a more accurate measure of the brain's gray and white matter. 15 Cortical thickness was assessed in regions including the medial temporal lobe, cingulate gyrus, parahippocampal gyrus, and temporal gyri, along with additional areas such as the entorhinal cortex, inferior temporal gyrus, middle temporal gyrus, superior temporal gyrus, lateral orbitofrontal cortex, temporal pole, and transverse temporal gyri. Additionally, the volumes of the whole brain, along with the bilateral hippocampi and amygdalae, were measured. 15 Quality control was rigorously conducted by trained technicians, and any data with significant artifacts were excluded from analysis. Small vessel diseases were evaluated based on the presence of lobar or deep chronic microbleeds, white matter hyperintensities (WMH) according to the modified Fazekas scale, and lacunar infarcts. 16 For the purpose of our predictive model, this was converted into a binary variable. A patient was classified as having significant WMH if the Fazekas score was ≥ 2 in either region. Furthermore, the presence of mesial temporal lobe atrophy (MTLA) was assessed using the Scheltens scale. 17 The presence of significant MTLA was defined as a Scheltens scale score of ≥ 2. These imaging features were integrated into predictive modeling for PSCI.
Statistical analysis
Continuous variables were expressed as mean ± standard deviation (SD) or median with interquartile range (IQR), as appropriate, and categorical variables as frequencies and percentages. Comparisons between the PSCI and post-stroke no cognitive impairment (PSNCI) groups were conducted using t-tests or Mann-Whitney U tests for continuous variables and chi-square or Fisher's exact tests for categorical variables. Statistical significance was set at p < 0.001.
PSCI risk model
The pipeline consists of two components, namely the capture of essential features, and the construction of the novel PSCI risk model. Initially, a total of 69 features were considered for inclusion in the model (Supplemental Table 1). The dataset was split into training and test sets with a ratio of 8:2, ensuring consistent class proportions in both sets. In the first step, we designed a subgroup-based recursive feature elimination method to select key differential features.The 69 candidate features were first divided into four clinically meaningful subgroups: Cerebral atrophy score, Small cerebral vascular disease burden, Infarct score, and Other features. (1) Select vital base models: Here we utilized six various base models namely, XGBoost, 18 gradient boosting decision tree (GBDT), 19 CatBoost, 20 SVM, 21 logistic regression, 22 and LightGBM. 23 Mathematical details of these base models are provided in the Supplemental Material.
Then, a Bayesian optimization algorithm based on the Tree-structured Parzen Estimator Approach (TPE) was used to bring in data for 10-fold cross-validation to optimize and fine-tune the hyperparameters of the model. 24 A nested cross-validation approach was used for hyperparameter search. (2) For each subgroup independently,take this trained model into the recursive feature elimination (RFE) search process, and set the RFE parameter (n _ features _ to _ select = 1), i.e., eliminate only one feature at a time. In step one, the RFE process will remove the least important features from the current dataset each time, and then repeat the first step of the model training based on the input model's hyperparameters, in return for traversing all features. (3) Record the importance of each feature based on the ranking of RFE evaluators. For each subgroup, we retained the top-performing features based on the cross-validated AUC. Then, for each subgroup, the two models with the highest cross-validated AUC were selected as base learners, and the features retained by these base learners were combined. The final selection of 22 features was determined as the union of the features retained by the top-two models across all four subgroups (Supplemental Table 2).
In the second step, we perform a model fusion of these base models by designing a stacking ensemble, input the fused results into the meta-model, and finally output the results. Our model consists of two parts, the first part is the base model, and here we consider it from four perspectives: algorithmic diversity, feature diversity, sample diversity, and random diversity. In the feature selection stage described above, we used six base models (XGBoost, GBDT, CatBoost, SVM, Logistic Regression, and LightGBM). For stacking, we selected eight base learners (the top-two models from each of the four subgroups) as the first-level estimators. We fuse and select these 8 models in different numbers and types using Bayesian optimization and input the results into the meta-model. The final output of our meta-model is the stacking ensemble. The above process is packaged into a whole model for Bayesian optimization based on the TPE algorithm, in which the hyperparameters of the basic models are in a frozen state. The final PSCI risk model was the stacking ensemble with the best-performing meta-learner (SVM) after hyperparameter optimization. All analyses were performed with a fixed random seed (42) to ensure reproducibility.
External validation
To evaluate the stability and generalization ability of the model on external data, this study used data from 100 AIS patients admitted to our institution since August 2023 as an external validation set. The data were standardized to ensure consistency with the training set. The processed data were then input into the trained predictive model, and performance metrics such as AUC, accuracy, sensitivity, specificity, and F1 score were calculated to assess the model's performance on new data and validate its generalization ability and stability.
Results
Baseline characteristics
Of the 1070 individuals included in this study, 398 patients were diagnosed with PSCI and 672 were identified as PSNCI (Figure 1). The mean age of the cohort was 67.4 ± 9.3 years, and neuropsychological assessments were conducted approximately 4 months after stroke onset (Table 1). The median National Institutes of Health Stroke Scale (NIHSS) score was 2 (IQR 1–5). Baseline characteristics were compared between the two groups to ensure the validity of subsequent analyses (Tables 1 and 2).
Demographic and clinical characteristics of PSCI and PSNCI groups.
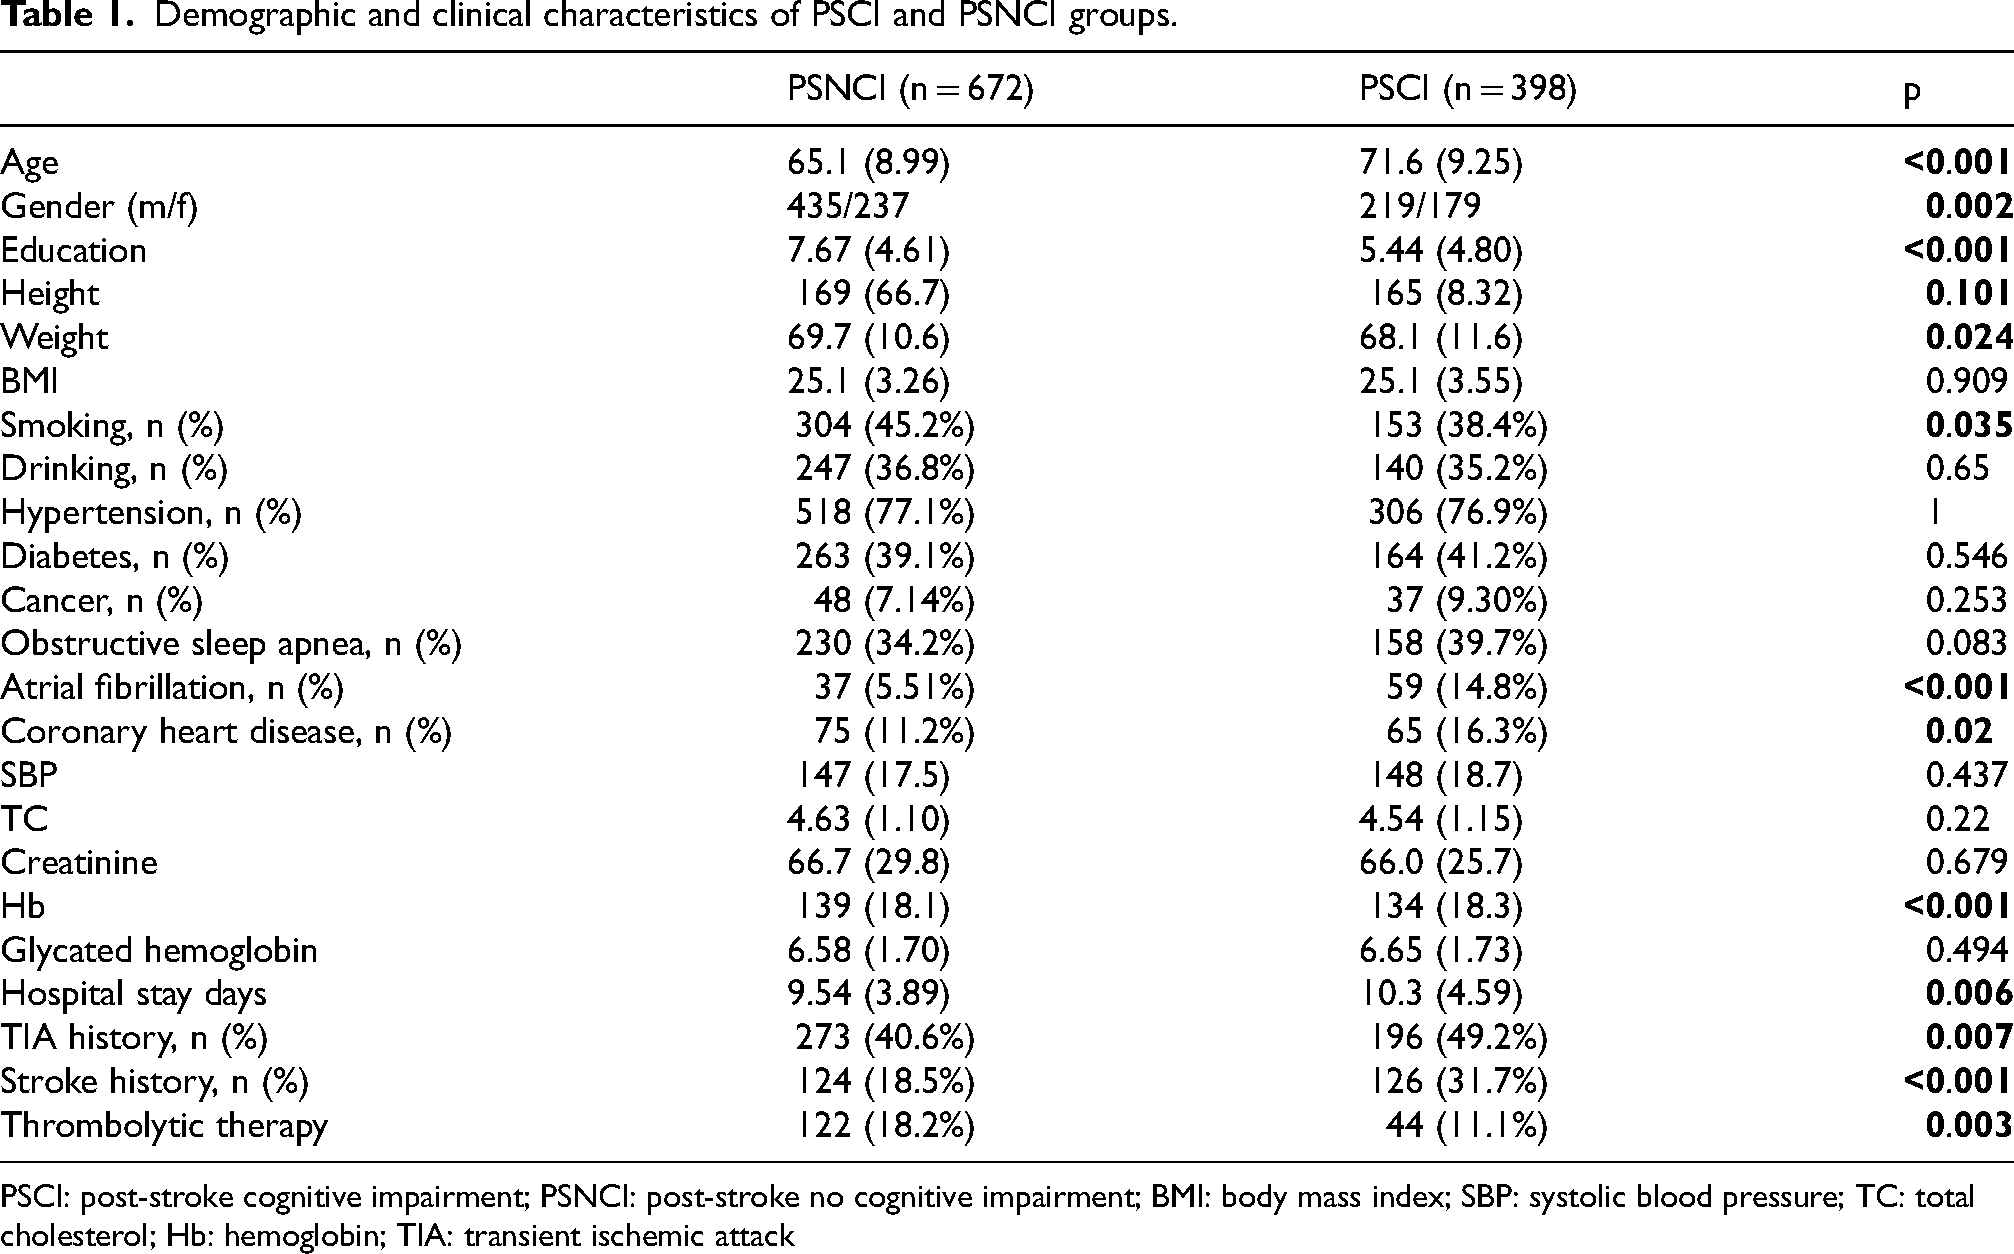
PSCI: post-stroke cognitive impairment; PSNCI: post-stroke no cognitive impairment; BMI: body mass index; SBP: systolic blood pressure; TC: total cholesterol; Hb: hemoglobin; TIA: transient ischemic attack
Neurological impairment after stroke in PSCI and PSNCI groups.
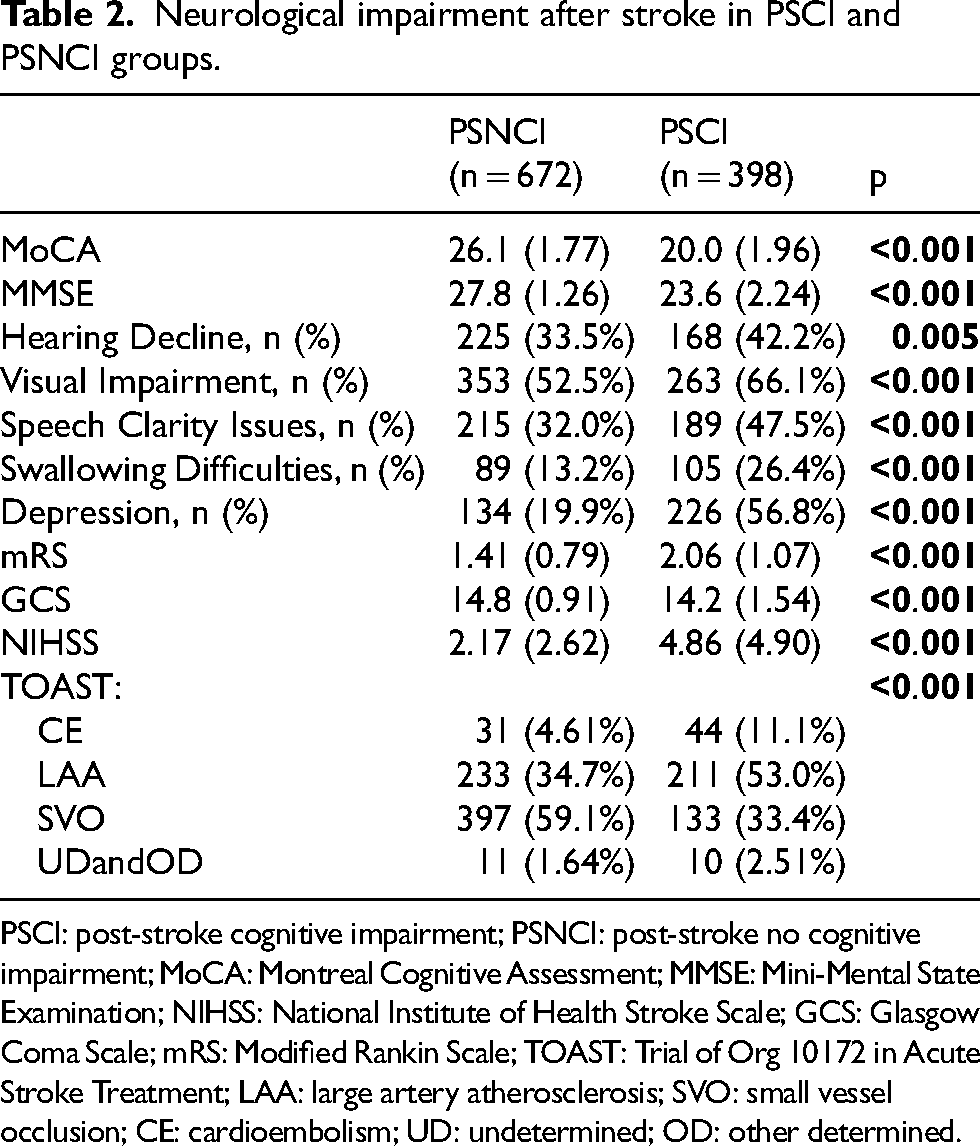
PSCI: post-stroke cognitive impairment; PSNCI: post-stroke no cognitive impairment; MoCA: Montreal Cognitive Assessment; MMSE: Mini-Mental State Examination; NIHSS: National Institute of Health Stroke Scale; GCS: Glasgow Coma Scale; mRS: Modified Rankin Scale; TOAST: Trial of Org 10172 in Acute Stroke Treatment; LAA: large artery atherosclerosis; SVO: small vessel occlusion; CE: cardioembolism; UD: undetermined; OD: other determined.
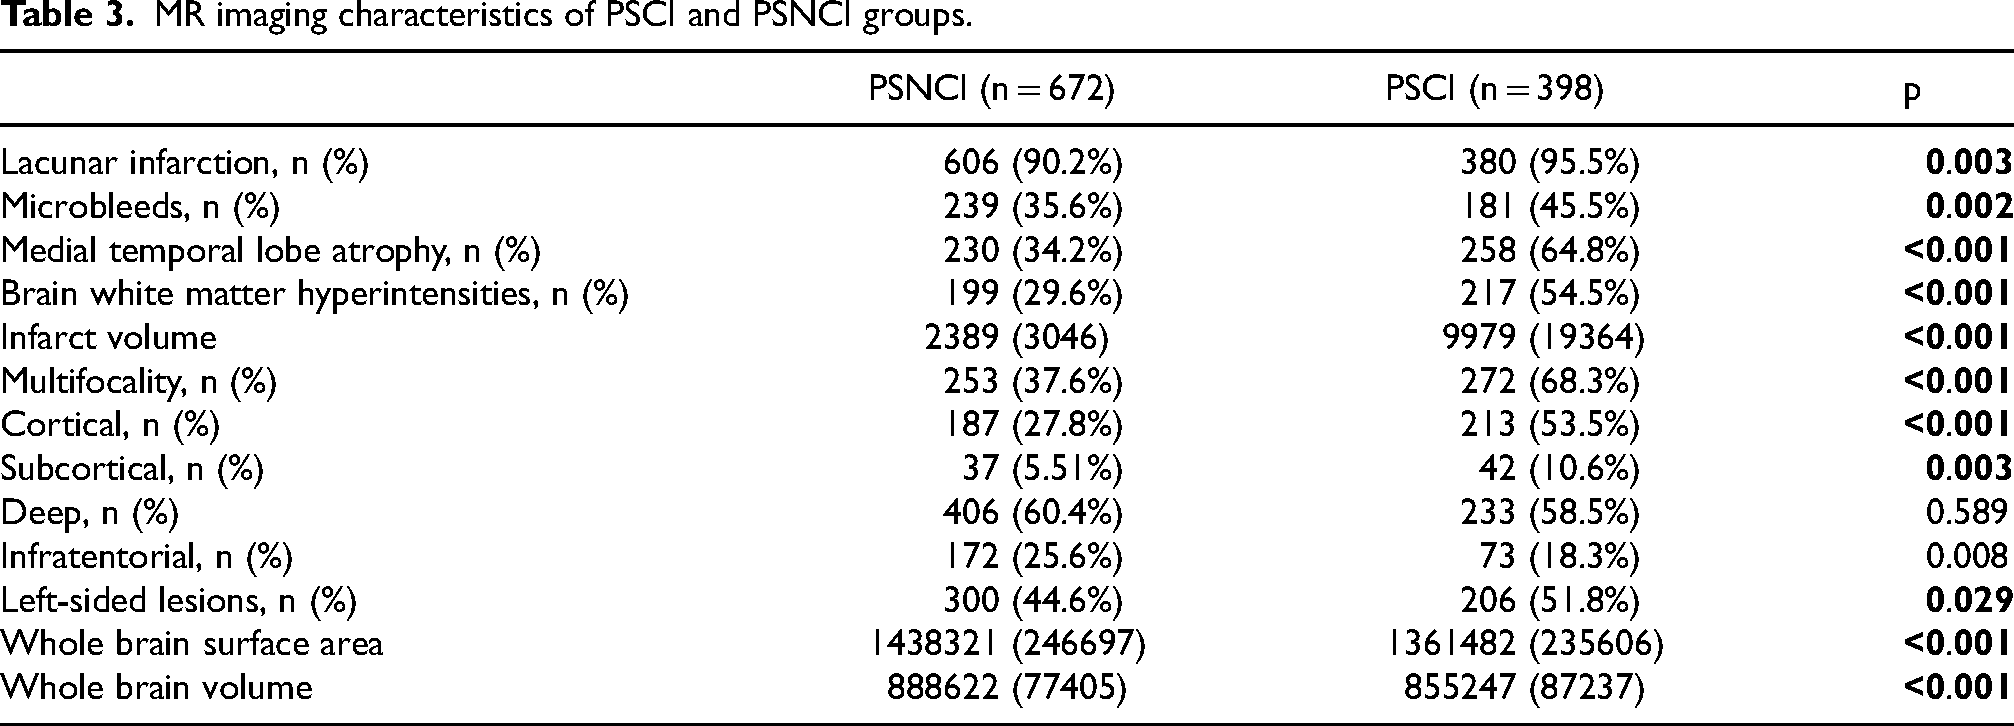
Neuroimaging findings showed that the PSCI group had significantly larger infarct volumes (Median: 2477.5 mm3, 95% CI: 2300.0 mm3 to 3036.0 mm3 versus Median: 1802.0 mm3, 95% CI: 1730.0 mm3 to 1893.0 mm3; p < 0.001), a higher prevalence of cortical or strategic lesions, and more severe MTLA (64.8% versus 34.2%; p < 0.001). Additionally, microbleeds (45.5% versus 35.6%; p = 0.002) and WMH (54.5% versus 29.6%; p < 0.001) were more common in the PSCI group (Table 3).
MR imaging characteristics of PSCI and PSNCI groups.
These findings highlight the significant differences in demographic, clinical, and neuroimaging characteristics between the PSCI and PSNCI groups, providing a comprehensive understanding of the factors associated with post-stroke cognitive impairment.
Essential features
Our screening process identified 22 key features with significant discriminative power for predicting PSCI risk. A complete description of all 22 selected features, including their categories and units of measurement, is provided in Supplemental Table 2. These features encompass various categories, including brain atrophy, small vessel disease burden, infarct scores, and other relevant features. These features were used in subsequent modeling and evaluation of model prediction performance.
Prediction models
To validate the performance of the prediction models, we randomly stratified 20% of the overall dataset (80 PSCI, 134 PSNCI) as an independent test set, while the remaining samples were used for model training. We compared the predictive performance of six machine learning models (XGBoost, GBDT, CatBoost, SVM, Logistic Regression, and LightGBM) with the PSCI risk model on the test set. The evaluation metrics, including accuracy, AUC, F1-score, precision, and recall, are presented for the seven models (Table 4).
Comparison of machine learning model performance for the prediction of PSCI.

The results indicate that the fusion strategy of combining multiple models provides superior performance compared to individual models (Figure 2). Figure 2 demonstrates that the stacking ensemble model consistently outperforms all six base learners across all five metrics, with the most notable advantages in F1-score and precision.
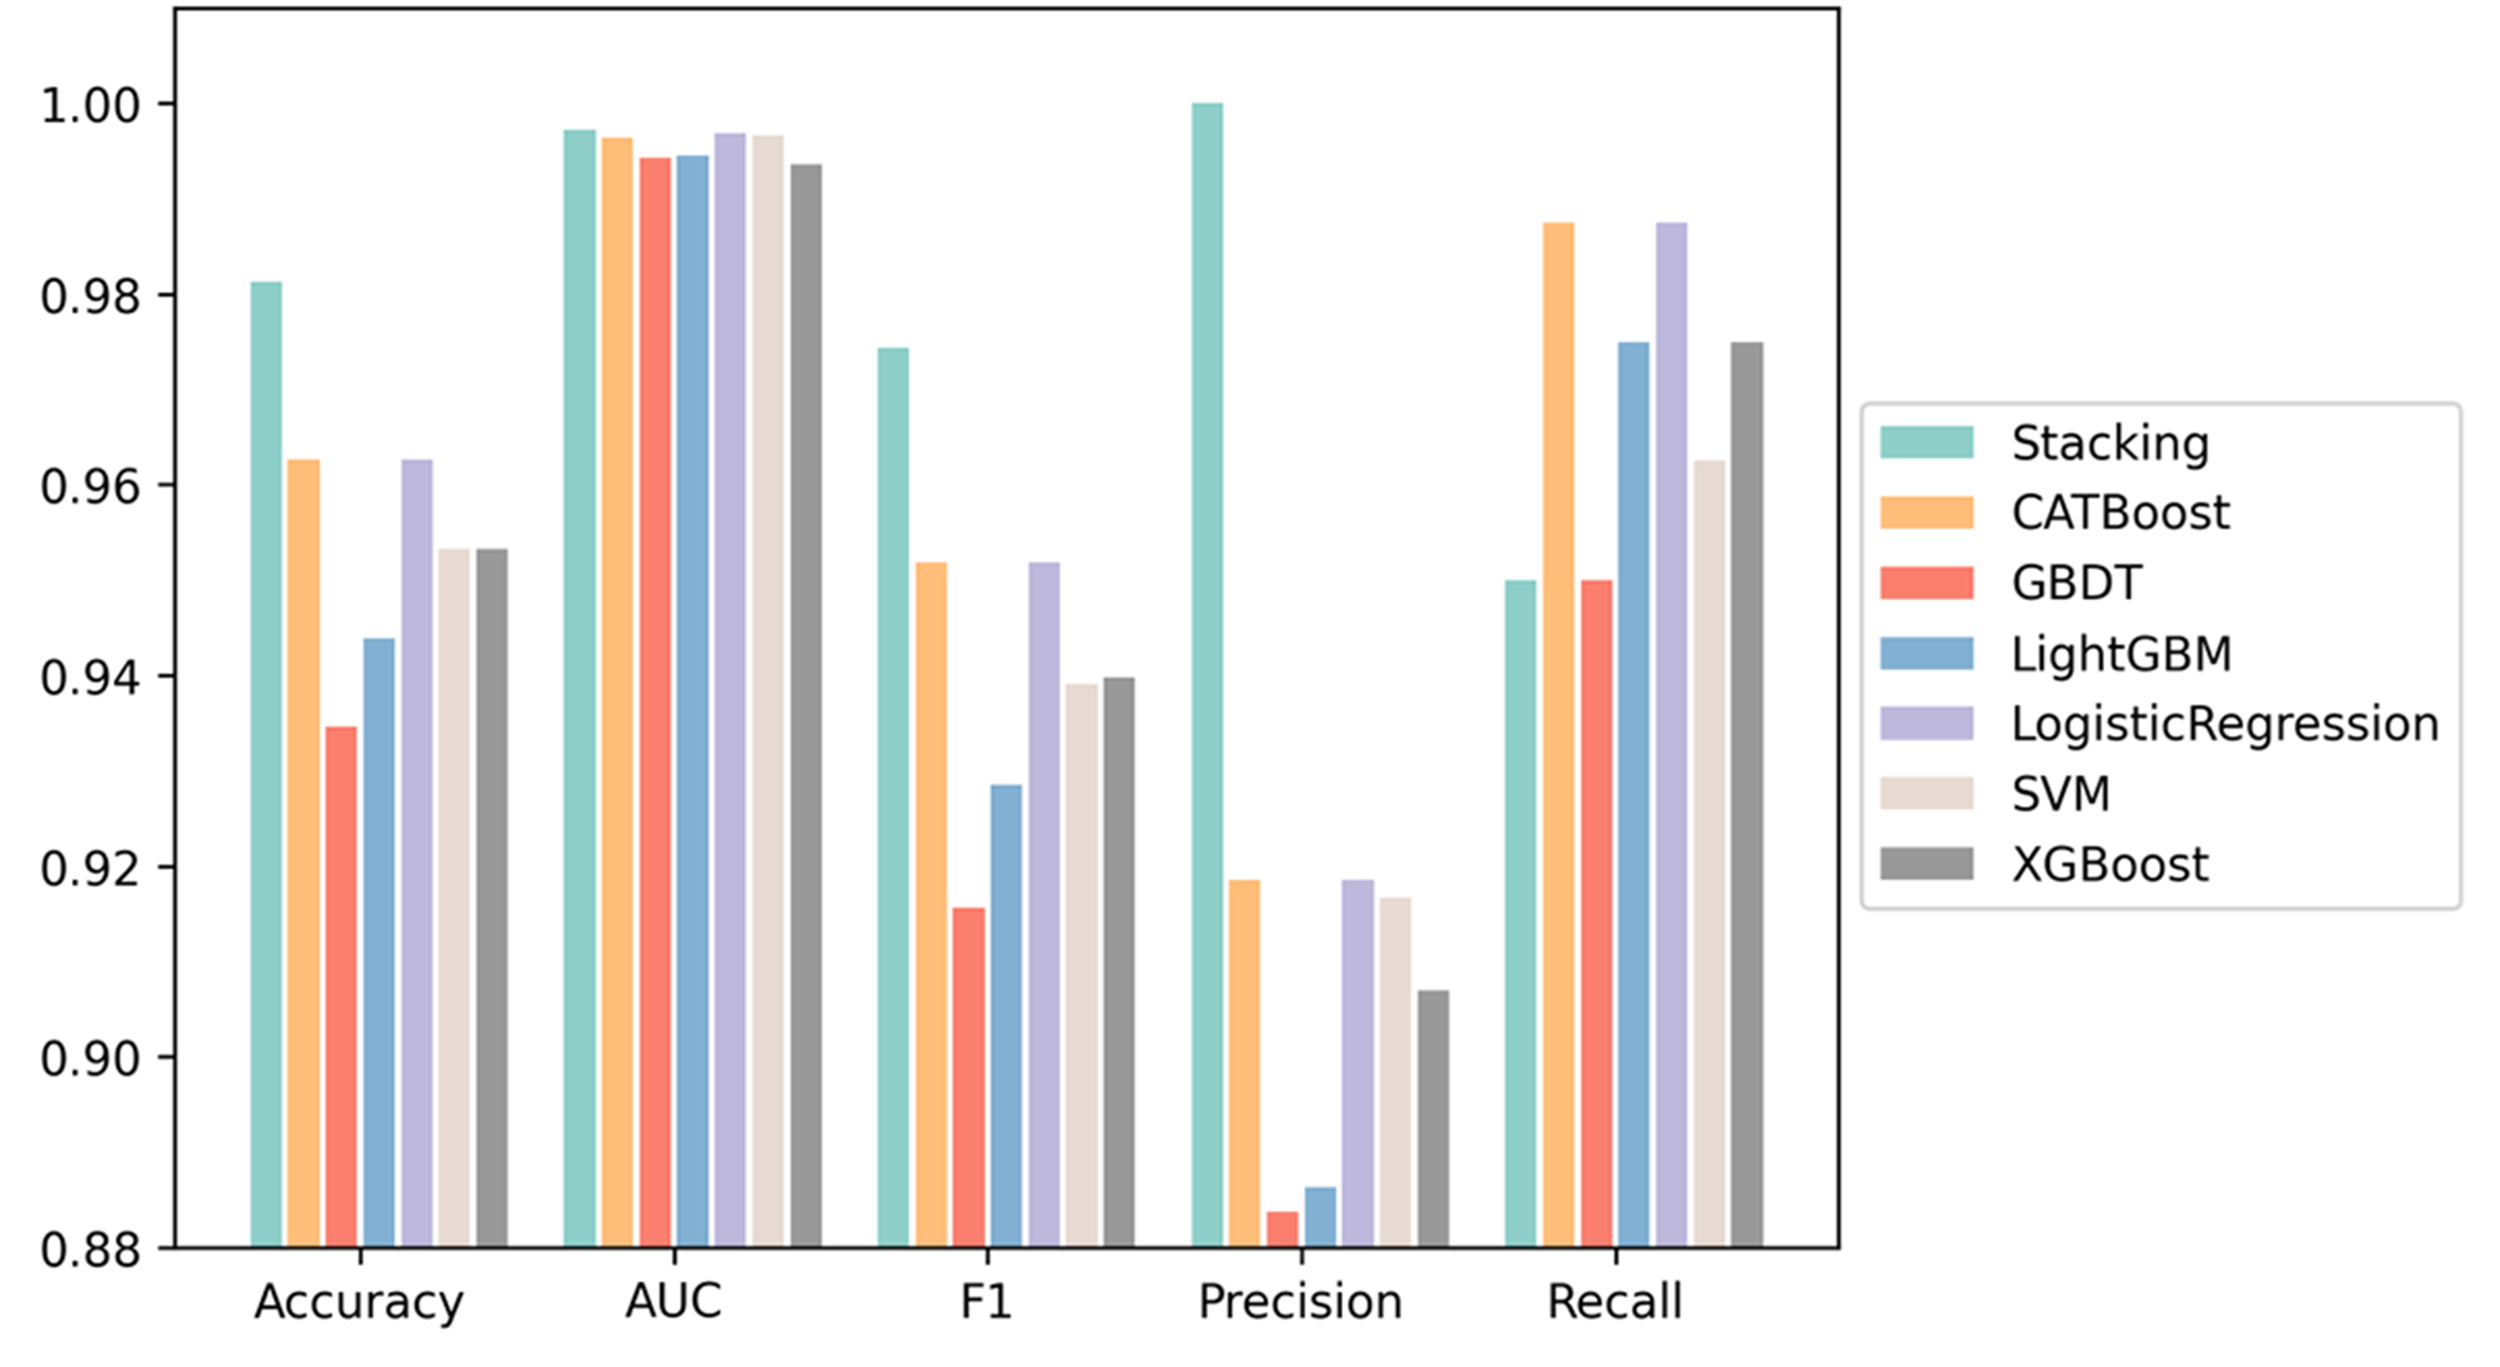
Performance comparison of six machine learning models (XGBoost, GBDT, CatBoost, SVM, Logistic Regression, and LightGBM) with the PSCI risk model on an independent test set (20% of the total dataset). The x-axis represents five evaluation metrics (Accuracy, AUC, F1-score, Precision, and Recall), and the y-axis represents the corresponding metric values. Evaluation metrics include accuracy, AUC, F1-score, precision, and recall. The results show that the ensemble strategy of combining multiple models outperforms individual model.
Feature importance
We utilized SHapley Additive exPlanations (SHAP) values from the PSCI risk model to determine the importance of features for PSCI prediction (Figure 3A). 25 The analysis revealed that MoCA and MMSE during the acute phase of stroke were the most critical variables, with wide SHAP value distributions indicating significant impact on model output. High feature values (magenta) are concentrated in the negative SHAP value region (Figure 3B), suggesting that higher MoCA and MMSE scores negatively contribute to the model's prediction. Conversely, low feature values (light blue) are concentrated in the positive SHAP value region, indicating that lower MoCA and MMSE scores positively influence the prediction. Additionally, brain atrophy scores such as “Whole Brain Volume”, “Cingulate-Isthmus Thickness (L)”, and “Temporal Pole Thickness (R)” were inversely related to PSCI risk. In contrast, “Infarct Volume” from the infarct scores showed a positive correlation, indicating that larger infarct volumes are associated with higher PSCI risk. Figure 3A confirms that MoCA carries the largest mean absolute SHAP value, followed by MMSE, underscoring the dominant role of acute-phase cognitive assessments. Figure 3B further shows that lower MoCA and MMSE scores consistently shift predictions toward PSCI, while greater whole brain volume and cortical thickness values are associated with negative SHAP contributions, reducing predicted PSCI risk.
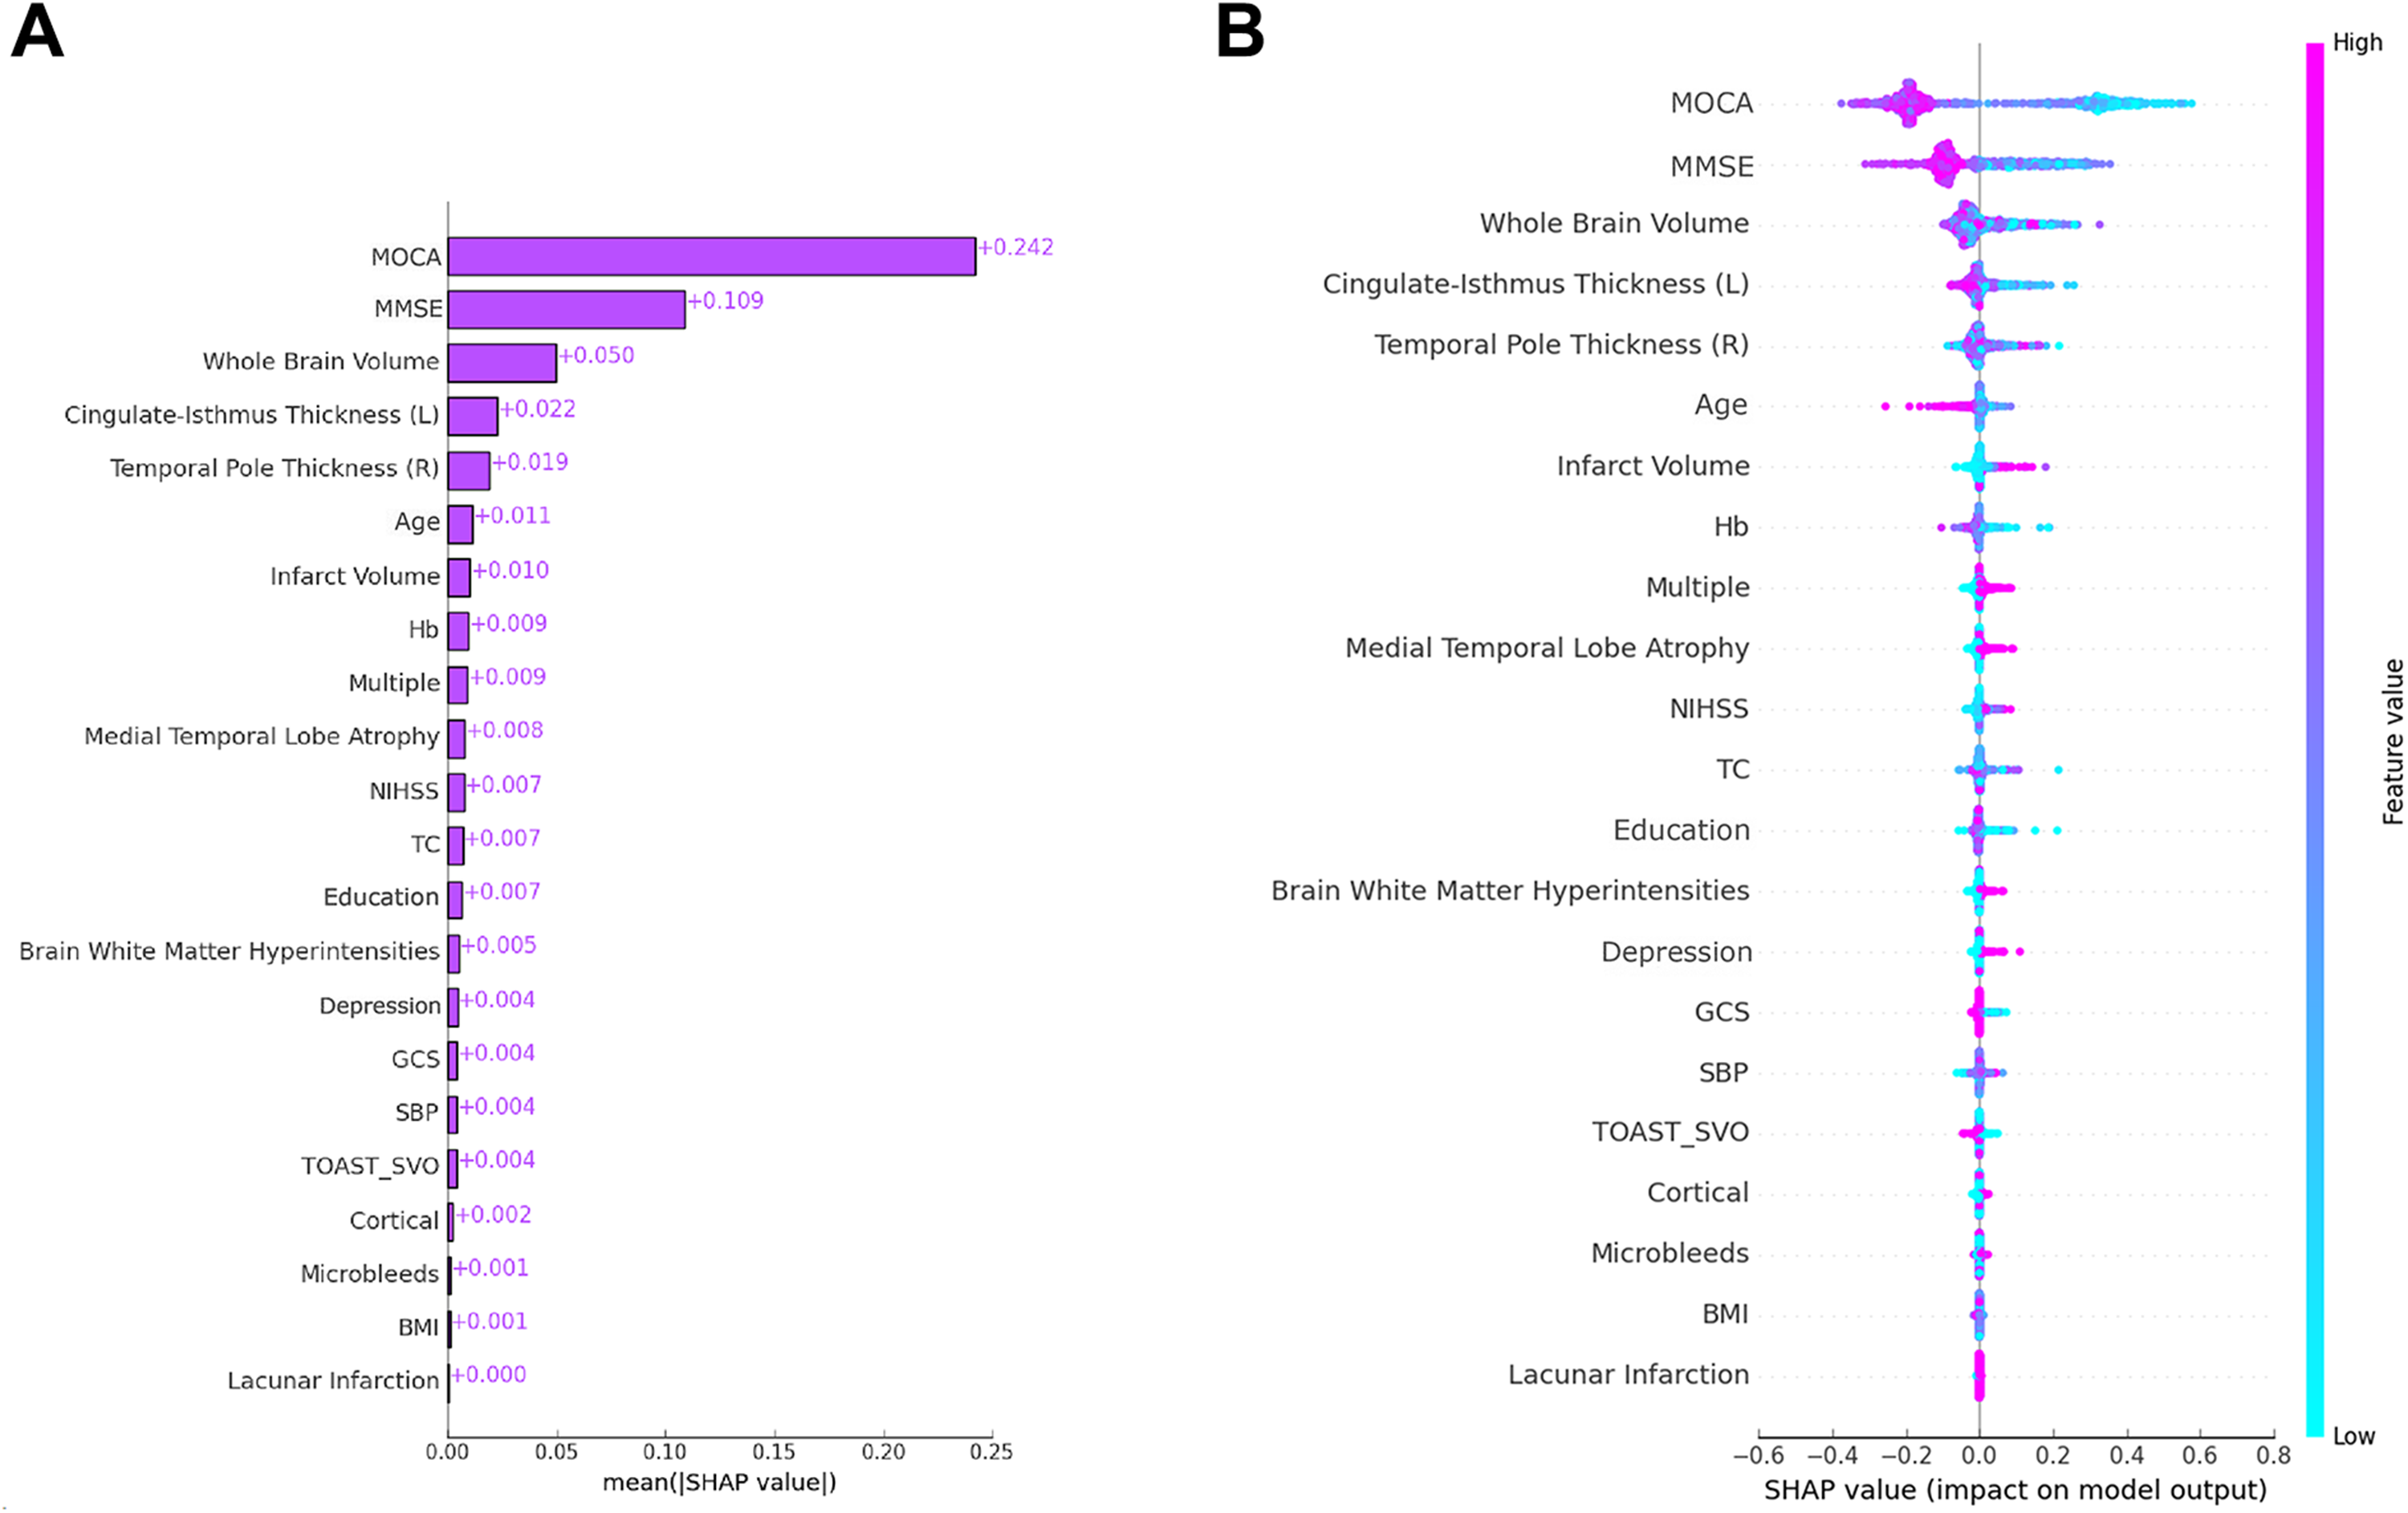
The SHapley Additive exPlanations values of the best prediction model. (A) Bar plot showing the mean absolute SHAP values of each feature, reflecting overall feature importance. (B) Beeswarm plot illustrating the SHAP value distribution for each feature across all patients. Each dot represents an individual patient; magenta dots indicate high feature values and light blue dots indicate low feature values. Positive SHAP values indicate a positive contribution to the predicted risk of PSCI, while negative SHAP values indicate a protective effect.
Local explanation for different evaluation units
Local explanations provide insights into the contribution and direction of each variable's effect on the model's decision for individual evaluation units (Figures 3 and 4). For a randomly selected evaluation unit from PSCI and non-PSCI samples, we visualized the local explanation results using the SHAP algorithm. The vertical axis represents the variables and their values used in the model, while the horizontal axis indicates the magnitude and direction of the variable's influence on the model's decision. Blue represents inhibitory effects, and red represents promotive effects. The cumulative result of each factor's contribution and the model's processed prediction value is denoted by f(x). The contributions of MoCA, MMSE, and brain atrophy-related variables were found to be the most significant in the model's decision-making process.
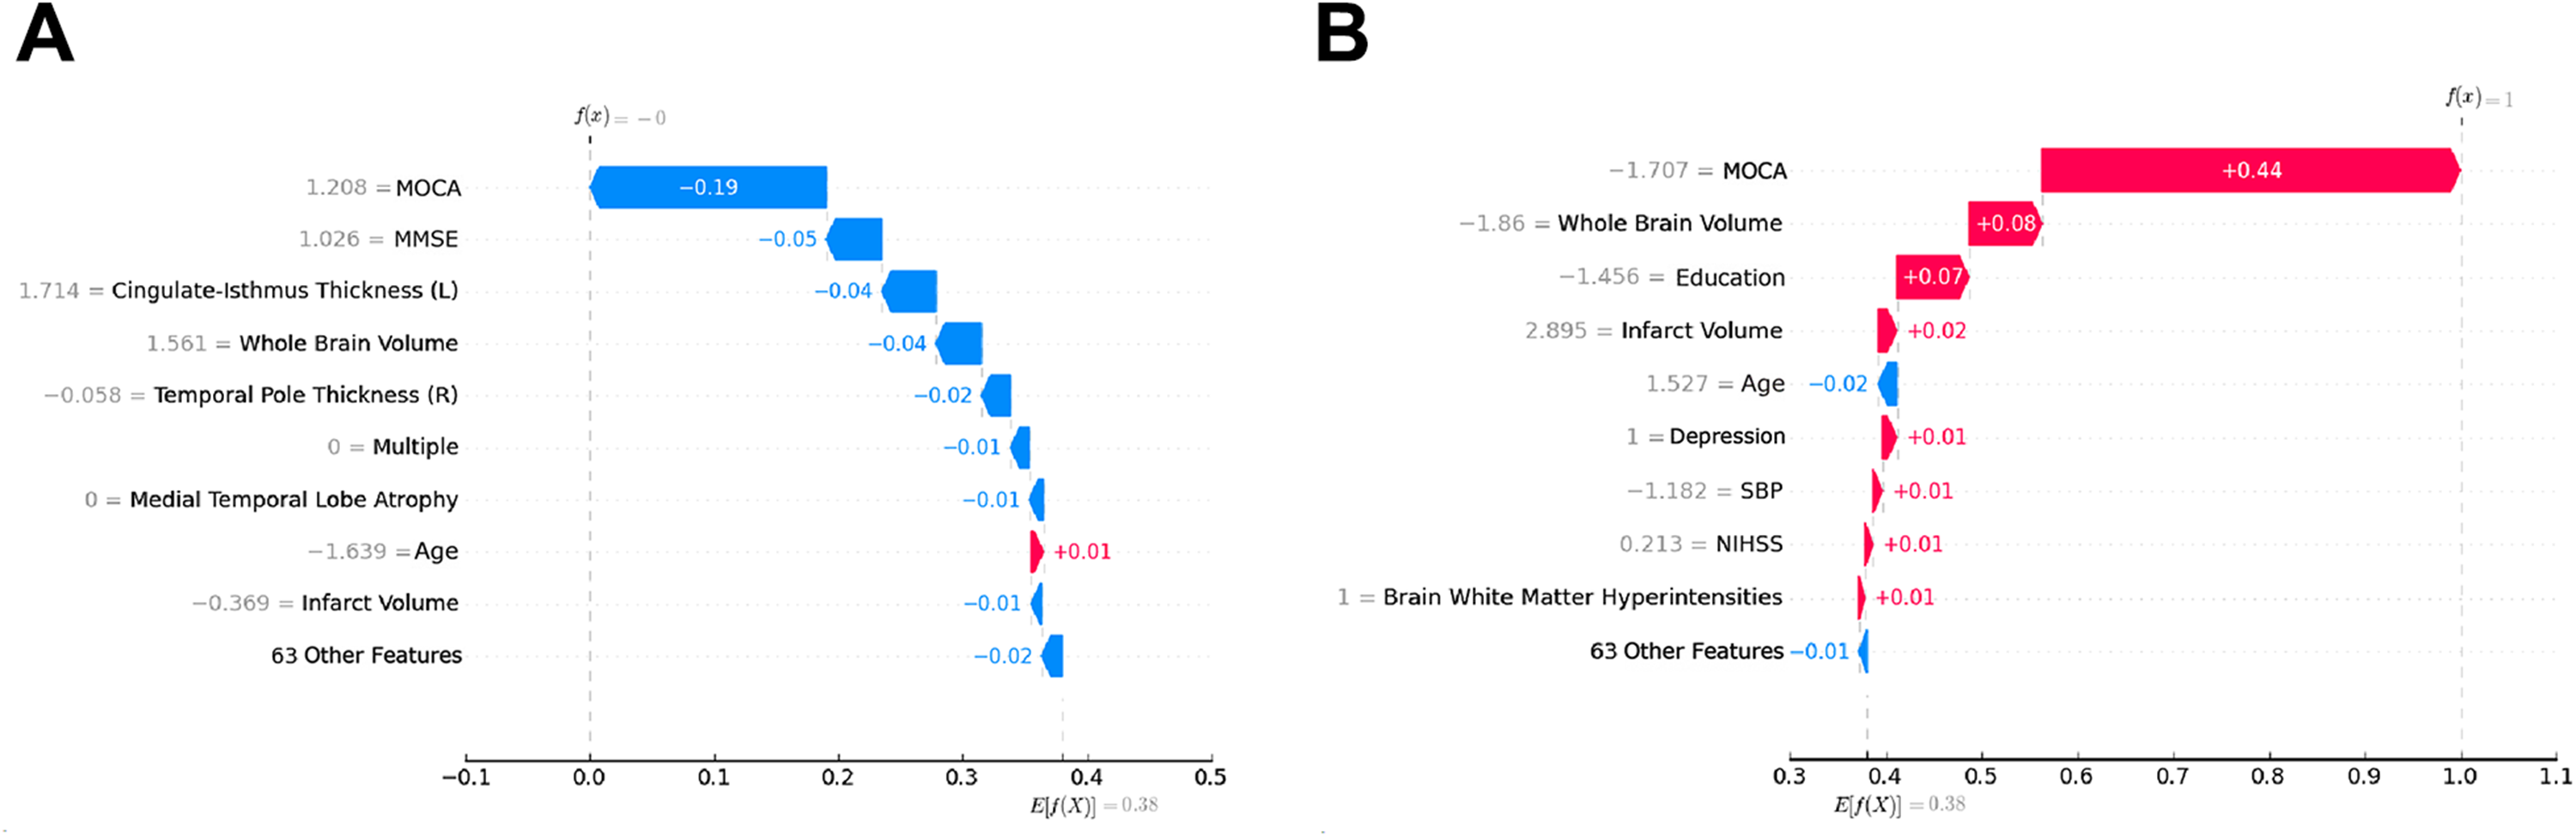
Local explanations showing the contribution and direction of each variable's impact on the model's decision for individual evaluation units. The y-axis represents feature names and values; the x-axis represents the magnitude and direction of each feature's contribution to the model output f(x), relative to the baseline E[f(x)] = 0.38. SHAP algorithm was used to visualize the local explanation results for evaluation units randomly selected from PSCI and PSNCI samples.
External validation
The model demonstrated strong predictive performance on the external validation set. The external validation dataset consisted of 100 patients, including 41 (41%) with PSCI. The proposed PSCI risk model achieved the following performance: accuracy = 0.810 (95% CI: 0.722–0.875), AUC = 0.905 (95% CI: 0.839–0.971), F1-score = 0.791 (95% CI: 0.707–0.862), precision = 0.720 (95% CI: 0.595–0.844), and recall = 0.878 (95% CI: 0.778–0.978). The proportion of PSCI events (41%) was comparable to that in the development cohort, reducing concern about event sparsity. The narrow confidence intervals—particularly for AUC (lower bound 0.839)—indicate acceptable reliability of the model's generalization. These results indicate that the model performs well not only on the training data but also exhibits strong generalization ability on external data, effectively predicting the occurrence of PSCI.
Discussion
This study successfully developed a predictive model for PSCI by integrating machine learning techniques with recursive feature elimination and hyperparameter optimization. SHAP analysis was employed to identify and interpret the most influential features, revealing MoCA performance, MMSE performance, whole brain volume, cingulate-isthmus thickness, temporal pole thickness, age, and infarct volume as the most impactful predictors. The model incorporated multimodal features, including neuropsychological scales, imaging features (e.g., brain volume, cingulate gyrus thickness, temporal pole thickness), and clinical data (e.g., age, hemoglobin, NIHSS scores), to significantly enhance predictive accuracy. Structural brain metrics, such as brain volume and local thickness, were strongly correlated with cognitive decline, particularly in post-stroke populations. 26 The integration of multimodal data not only captured complex interactions comprehensively but also improved both prediction accuracy and interpretability.27,28 Furthermore, the Stacking ensemble method, combining models like SVM and logistic regression, provided distinct advantages in handling complex, nonlinear data, enhancing both predictive accuracy and robustness. 29
MoCA and MMSE scores, assessed within seven days post-stroke, emerged as the most influential predictors for PSCI. MoCA, with its high sensitivity to mild cognitive impairment, and MMSE, a more generalized cognitive status measure, provided complementary insights into cognitive deficits. The high SHAP values for these assessments confirm their critical role in early PSCI identification. Previous research has underscored the importance of early cognitive assessments, especially in stroke patients, to facilitate timely interventions.10,30 Clinically, these non-invasive and accessible tools enable routine cognitive screening, supporting their role as core features in the PSCI prediction model.
Beyond functional assessments, neuroimaging features provided the structural basis for these cognitive deficits, further reinforcing the predictive value of the model. Whole brain volume, a marker of brain atrophy, strongly predicted cognitive decline, emphasizing the role of structural brain metrics in dementia-related impairments. 26 Regional measures, including cingulate-isthmus and temporal pole thickness, highlighted their roles in attention, executive function, memory, and language, with SHAP values confirming their relevance.27,28 Infarct volume was another significant predictor, with larger lesions linked to severe cognitive deficits due to extensive neural damage. These findings highlight the importance of integrating neuroimaging metrics into PSCI prediction models to improve accuracy and sensitivity.
The predictive value of these neuroimaging features is further supported by established neurocognitive frameworks and neurobiological mechanisms. Whole brain volume reflects global structural integrity, with progressive atrophy following stroke representing a recognized substrate of secondary neurodegeneration and cognitive decline. 31 The cingulate-isthmus, as a core node of the default mode network, is critically involved in memory consolidation and self-referential processing, and cortical thinning in this region has been consistently linked to cognitive deterioration. 32 At the neurobiological level, post-stroke injury to the cingulate gyrus disrupts the structural integrity of the cingulum bundle, a white matter tract connecting the cingulate cortex to the hippocampus and parahippocampal gyrus, 33 thereby impairing hippocampal-dependent memory consolidation and contributing to the disconnection of large-scale cognitive networks.34,35 Temporal pole thickness, reflecting a convergence zone for semantic memory and language comprehension, has similarly been associated with impairments in attention and memory when structurally compromised. 36 Ischemic damage to the temporal pole further disrupts the uncinate fasciculus, a white matter pathway critical for semantic memory retrieval and multimodal associative processing, 37 resulting in fragmentation of the temporal-frontal and temporal-limbic networks. Beyond focal lesion effects, stroke triggers secondary neurodegeneration through Wallerian degeneration of connected fiber tracts, 38 as evidenced by longitudinal neuroimaging studies demonstrating progressive cortical thinning and subcortical atrophy in regions remote from the primary infarct.35,39 Concurrently, sustained neuroinflammatory cascades, including microglial activation and pro-inflammatory cytokine release, have been identified as key contributors to diffuse cognitive decline following stroke. 40 Infarct volume compounds these vulnerabilities by disrupting long-range cortical-subcortical connectivity, with larger lesions exerting strategic effects on cognitive networks. 31 Together, these converging pathophysiological mechanisms provide a neurobiological foundation for the predictive value of cingulate-isthmus and temporal pole thickness in the proposed PSCI model, bridging the SHAP-identified imaging features with known pathophysiology.
Building upon the feature selection and neuroimaging insights described above, the integration of RFE and TPE significantly enhanced the performance of predictive models, as demonstrated in this study. Specifically, the optimized PSCI risk model achieved superior results across multiple metrics, including an AUC of 0.9972, an accuracy of 0.9813, and an F1 score of 0.9744, outperforming traditional machine learning models such as CatBoost and XGBoost. RFE effectively streamlined the feature selection process by iteratively removing irrelevant features, improving model interpretability and generalizability.29,41 Similarly, TPE demonstrated its capacity for hyperparameter optimization by systematically exploring parameter combinations, ensuring robust performance across feature sets. 42 This combination of RFE and TPE not only improved predictive accuracy but also enhanced model robustness, providing a reliable foundation for PSCI risk stratification.
The superior performance of our stacking model is further supported by comparison with recently published PSCI prediction models. Existing machine learning approaches have predominantly relied on either clinical variables alone or limited imaging inputs, which may constrain their capacity to capture the full complexity of post-stroke cognitive decline.10,43,44 In contrast, our model integrates comprehensive multimodal inputs spanning neuropsychological assessments, structural neuroimaging, and clinical variables, enabling a more holistic representation of PSCI risk. As demonstrated in Table 4, this integration contributed to consistently superior performance across accuracy, AUC, F1-score, and precision metrics compared with all individual benchmark models evaluated in this study.
This study combines multi-modal data and machine learning techniques for PSCI prediction. However, several limitations should be acknowledged. Firstly, the external validation was limited to temporal validation within our institution, without validation from external centers. This may affect the generalizability of the findings to other populations or settings. Secondly, the quantitative indicators used for cerebral small vessel disease in this study may require further refinement for improved accuracy. Thirdly, the exclusion of patients with hearing impairment, aphasia, or severe neurological deficits was necessitated by the requirement for reliable completion of standardized neuropsychological assessments. However, this criterion may introduce selection bias toward less severely affected patients, as excluded individuals tend to have more severe strokes and are potentially at higher risk for PSCI. Lastly, the external validation dataset comprised only 100 patients from a single institution, which may limit the stability and reliability of the reported performance metrics. Although the proportion of PSCI events was comparable to the development cohort and confidence intervals remained acceptably narrow, and the final analysis was restricted to complete cases, with 133 patients (11.1%) excluded whose data were no longer retrievable; thus, the possibility of selection bias cannot be entirely excluded. Larger multicenter external validation cohorts are needed to more robustly assess the generalizability of the model. Addressing these limitations in subsequent studies could contribute to the development of more robust and generalizable PSCI prediction models.
Conclusion
This study demonstrates methodological innovation in feature selection, model optimization, and data integration. The combination of RFE with hyperparameter optimization allowed for improved accuracy at each feature elimination step.45,46 The integration of multimodal data enhanced both model performance and clinical insights.10,30 Additionally, the Stacking ensemble and SHAP-based analysis provided an effective, interpretable clinical decision support tool for PSCI prediction.47,48 This model has demonstrated potential for application in the early risk stratification of post-stroke cognitive impairment. However, given the absence of calibration analysis, decision curve analysis, and multicenter external validation, further studies are warranted before broader clinical application can be recommended.
Supplemental Material
sj-docx-1-alz-10.1177_13872877261454538 - Supplemental material for Multimodal machine learning for early risk stratification of post-stroke cognitive impairment
Supplemental material, sj-docx-1-alz-10.1177_13872877261454538 for Multimodal machine learning for early risk stratification of post-stroke cognitive impairment by Xingyongpei Zheng, Panpan Zhao, Na Wang, Xinyu Wang, Ziyi Dong, Caihong Gu, Yong Sun, Xinru Gu and Xinyu Zhou in Journal of Alzheimer's Disease
Footnotes
Acknowledgements
The authors sincerely thank all the patients who participated in this study for their cooperation and support.
ORCID iDs
Ethical considerations
Institutional Review Board approval was obtained. The study was approved by the Medical Ethics Committee of The First People's Hospital of Lianyungang, and all study participants provided informed consent (KY-20240826002-01).
Consent to participate
All study participants provided informed consent (KY-20240826002-01).
Consent for publication
Not applicable
Author contribution(s)
Funding
The authors disclosed receipt of the following financial support for the research, authorship, and/or publication of this article: This work was supported by the Science and Technology Bureau of Lianyungang, Jiangsu Province, China (Project No. SF2426), High-level Project Cultivation Program of Lianyungang Medical Education Innovation Research Center, Nanjing Medical University (Project No. LYGYB09 and LYGYB20), Natural Science Foundation of the Jiangsu Higher Education Institutions of China Programme (Project No. 25KJB360002), and Zhongda Hospital Affiliated to Southeast University, Jiangsu Province High-Level Hospital Pairing Assistance Construction Funds (zdlyg13).
Declaration of conflicting interests
The authors declare no competing financial interests or personal relationships that could influence the work reported in this paper. The funding source (Science and Technology Bureau of Lianyungang, Jiangsu Province; Project SF2426) had no involvement in study design, data collection, analysis, interpretation, manuscript preparation, or publication decisions.
Data availability statement
The data and code used in this study are available from the corresponding author upon reasonable request.
Supplemental material
Supplemental material for this article is available online.
References
Supplementary Material
Please find the following supplemental material available below.
For Open Access articles published under a Creative Commons License, all supplemental material carries the same license as the article it is associated with.
For non-Open Access articles published, all supplemental material carries a non-exclusive license, and permission requests for re-use of supplemental material or any part of supplemental material shall be sent directly to the copyright owner as specified in the copyright notice associated with the article.