
Abstract
Rural populations are underrepresented in cognitive impairment research and have limited resources for education about brain and cognitive health, Alzheimer's disease and related dementias, or caregiving. As our Outreach, Recruitment, and Engagement team aimed to expand activities into more rural communities, we also wanted to better understand the characteristics of the communities surrounding our center and gain insight into the social exposome of the areas. The goal of the manuscript is to reflect on our experience and share measures that were useful in this effort, which can be further enriched and adjusted by other outreach teams.
Introduction
Regardless of the exact definitions used, rural residence is often an important independent contributor to health-related inequities in studies with health outcomes. 1 In the US, rural counties comprise the majority (84%) of “older-age counties,” defined as those with over 20% of their population aged 65 or older. 2 Furthermore, gaps in health outcomes have widened markedly between rural and urban areas over the past 3 decades, with worse outcomes in rural than urban areas. 3
A scoping review reported that of the 30 studies examining rural-urban differences in prevalence or incidence of Alzheimer's disease and related dementias (ADRD), 17 studies observed higher ADRD incidence and prevalence, five reported the opposite, and six reported no statistically significant difference. 4 Older adults in rural areas might be less likely to be clinically diagnosed with ADRD; when diagnosed, the diagnosis might occur at later disease stages, with shorter survival after diagnosis compared with older adults in urban areas.5,6 Rural areas often lack specialists for cognitive impairment care and have less contact with cognitive specialists and mental health providers, 4 while people with ADRD make more visits to the emergency department (versus urban residents). 5 Furthermore, there are limited resources for education about ADRD, as well as home- and community-based care and services, such as day care programs, adapted transportation, and respite care. 7
The Mayo Alzheimer's Disease Research Center (ADRC) Outreach, Recruitment, and Engagement (ORE) Core team in Rochester, Minnesota, has over 25 years of building relationships and partnerships with surrounding communities, many of which are rural. Rurality often reflects differences in social advantage and physical environments; some consider it a root of, or a fundamental social determinant of health (SDoH). 1 Therefore, as we aimed to expand our outreach in more rural communities, we also wanted to better understand the characteristics of the communities surrounding our center and have an insight into the social exposome 8 of the areas, i.e., social factors external to the person, such as neighborhood disadvantage and SDoH, which could also inform us of barriers to healthcare access and better brain health. Such knowledge can underscore the need to strengthen efforts for equitable access to the types of education, support, and resources we could offer. This initiative, we believed, had the potential to address some of the barriers to inclusion and representativeness that rural communities face. The goal of this communication is to reflect on our experience and share measures that were useful in such an effort, not as a strict regimen, but as suggestions that can be enriched and adjusted by other outreach teams, as well as public health organizations, aging services, and those wishing to provide needed education-based support to rural communities.
Methods
At first, we endeavored to better understand the characteristics of the areas surrounding our center. Our outreach environment at the Mayo Clinic ADRC in Minnesota is often defined by the areas served by the Mayo Clinic Health System (MCHS; map in Supplemental Figure 1), though our team's outreach very often extends beyond this system. MCHS includes 53 multidisciplinary clinics, 16 community hospitals, and other healthcare facilities in more than 60 communities in Minnesota, Wisconsin, and Iowa. 9 To set the stage for our expanded outreach into rural communities, we created a background presentation/module on rural health and health outcomes, which was shared with our team at the yearly Mayo Clinic ORE Core retreat in Minnesota. This offered a snapshot of current knowledge and emphasized the importance of our focus and efforts for rural outreach, engagement, and research recruitment.
We reviewed multiple measures of rurality (details in Supplemental Material) and chose the primary Rural-Urban Commuting Area (RUCA) codes 10 (US Department of Agriculture (USDA) Economic Research Service) of 4 to 10 to define rural areas. We used a map showing the locations of MCHS facilities (mostly in towns, hereafter called communities) in the surrounding counties at that time, assigned primary RUCA codes to all locations, and visualized rural-urban community patterns within the counties.
Next, we identified social exposome indicators, including social vulnerability, neighborhood socioeconomic deprivation, and healthcare workforce shortage designations, which would also imply potential barriers to better health in surrounding areas and ensure that our activities also reach communities that may be under-resourced, resulting potentially in barriers to healthcare access and better health outcomes. As a place-based measure of the social exposome at the county level, we chose the Social Vulnerability Index (SVI)11,12 (created by the Centers for Disease Control and Prevention and Agency for Toxic Substances and Disease Registry; county level). We used the 2022 SVI at the county level for Minnesota, USA. To gain insight into neighborhood socioeconomic disadvantage, we examined the national Area Deprivation Index values 13 (2021 v4.0.1, Neighborhood Atlas®, using the 9-digit ZIP Code crosswalk) for areas where MCHS facilities were located.
Because some members of our outreach team had long-standing relationships with leaders and residents within rural communities, it made sense to leverage these relationships, as well, as we recognize that it can often take years to build trusting relationships with communities. In addition, to ensure consistent outreach touchpoints, we focused on areas within a 90-min drive from our center.
As rural communities have barriers to healthcare access, we also examined additional measures of health workforce shortage designations, 14 in the counties surrounding our center. Additional details on these measures are included in the Supplemental Material. Cumulatively (Figure 1), this information provided a more in-depth understanding of rurality and the social exposome in surrounding areas, which could be potential areas for outreach, ensuring outreach activities also reach under-resourced rural communities.
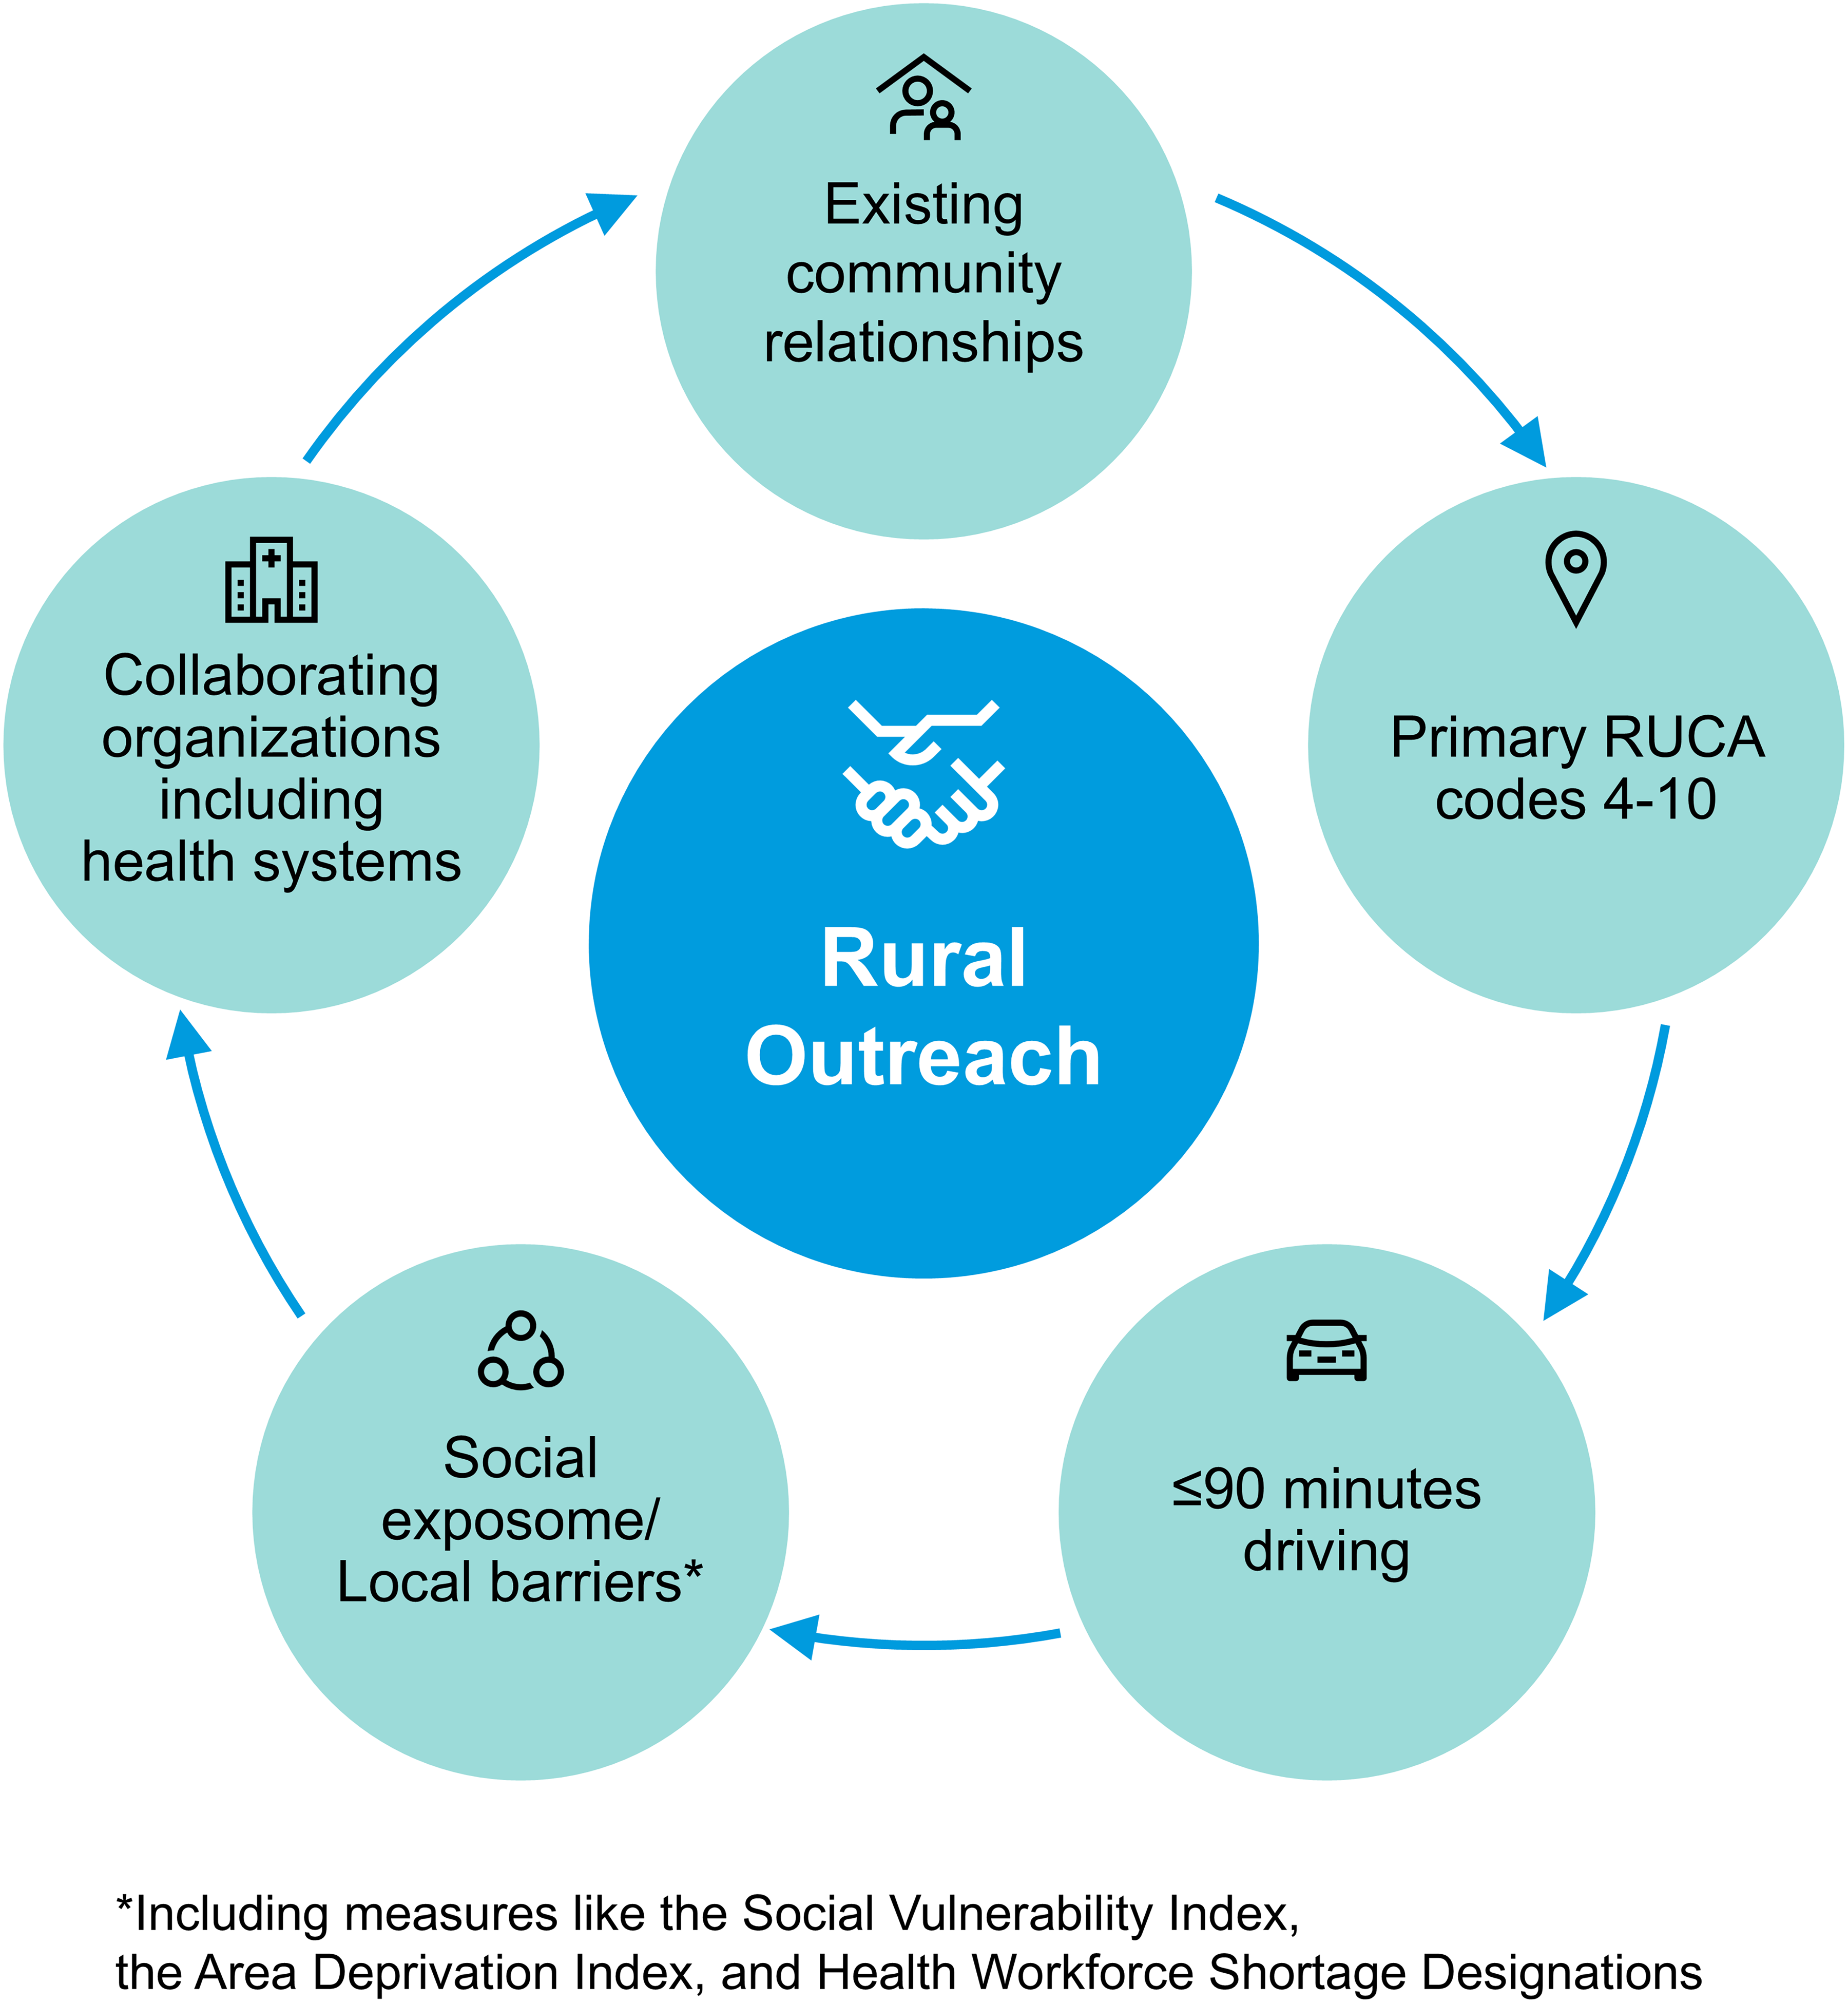
Considerations of an outreach, recruitment and engagement approach.
Results
At first as described in the Methods section, we examined the primary RUCA codes of the areas surrounding our center, where 81 MCHS healthcare related facilities (e.g., hospitals and clinics, rehabilitation centers, healthcare facilities stores, mobile health clinic) in 49 different locations in 29 Counties were located, to understand which facilities are located in rural and urban areas; 24 facilities were in areas with primary RUCA codes of 1 (urban area), 8 facilities in areas with RUCA of 2 (urban area), 17 facilities in areas with RUCA of 4 (rural, large towns), 21 facilities in areas with RUCA of 7 (rural, small towns) and 11 facilities in areas with RUCA of 10 (isolated rural areas).
Once we recognized the urban-rural patterns in the areas examined, we focused on 10 counties geographically closest to our center for a more detailed look. This selection was independent of any prior outreach activities and established relationships. SVI values were assessed for these counties to identify which were most vulnerable to social stressors (hereafter, under-resourced counties). Three counties had very high overall SVI scores (0.86, 0.85, and 0.80; Figure 2), higher values indicating greater social vulnerability, and based on distance from our center and established connections, we selected potential areas for ORE activities in two of these counties; overall, five counties were selected for potential outreach activities (Counties 1–5; Figure 2). We also looked at national ADI values for the areas where health care-related facilities were located in the five counties, which ranged from 22 to 97 (higher values indicating greater neighborhood socioeconomic disadvantage), suggesting a wide range of socioeconomic disadvantage across these communities. In addition, we reviewed data on the health workforce shortage areas in these counties. Because our ORE team has been involved with many communities for decades, it was also important to leverage these well-established relationships and their requests for education and support.
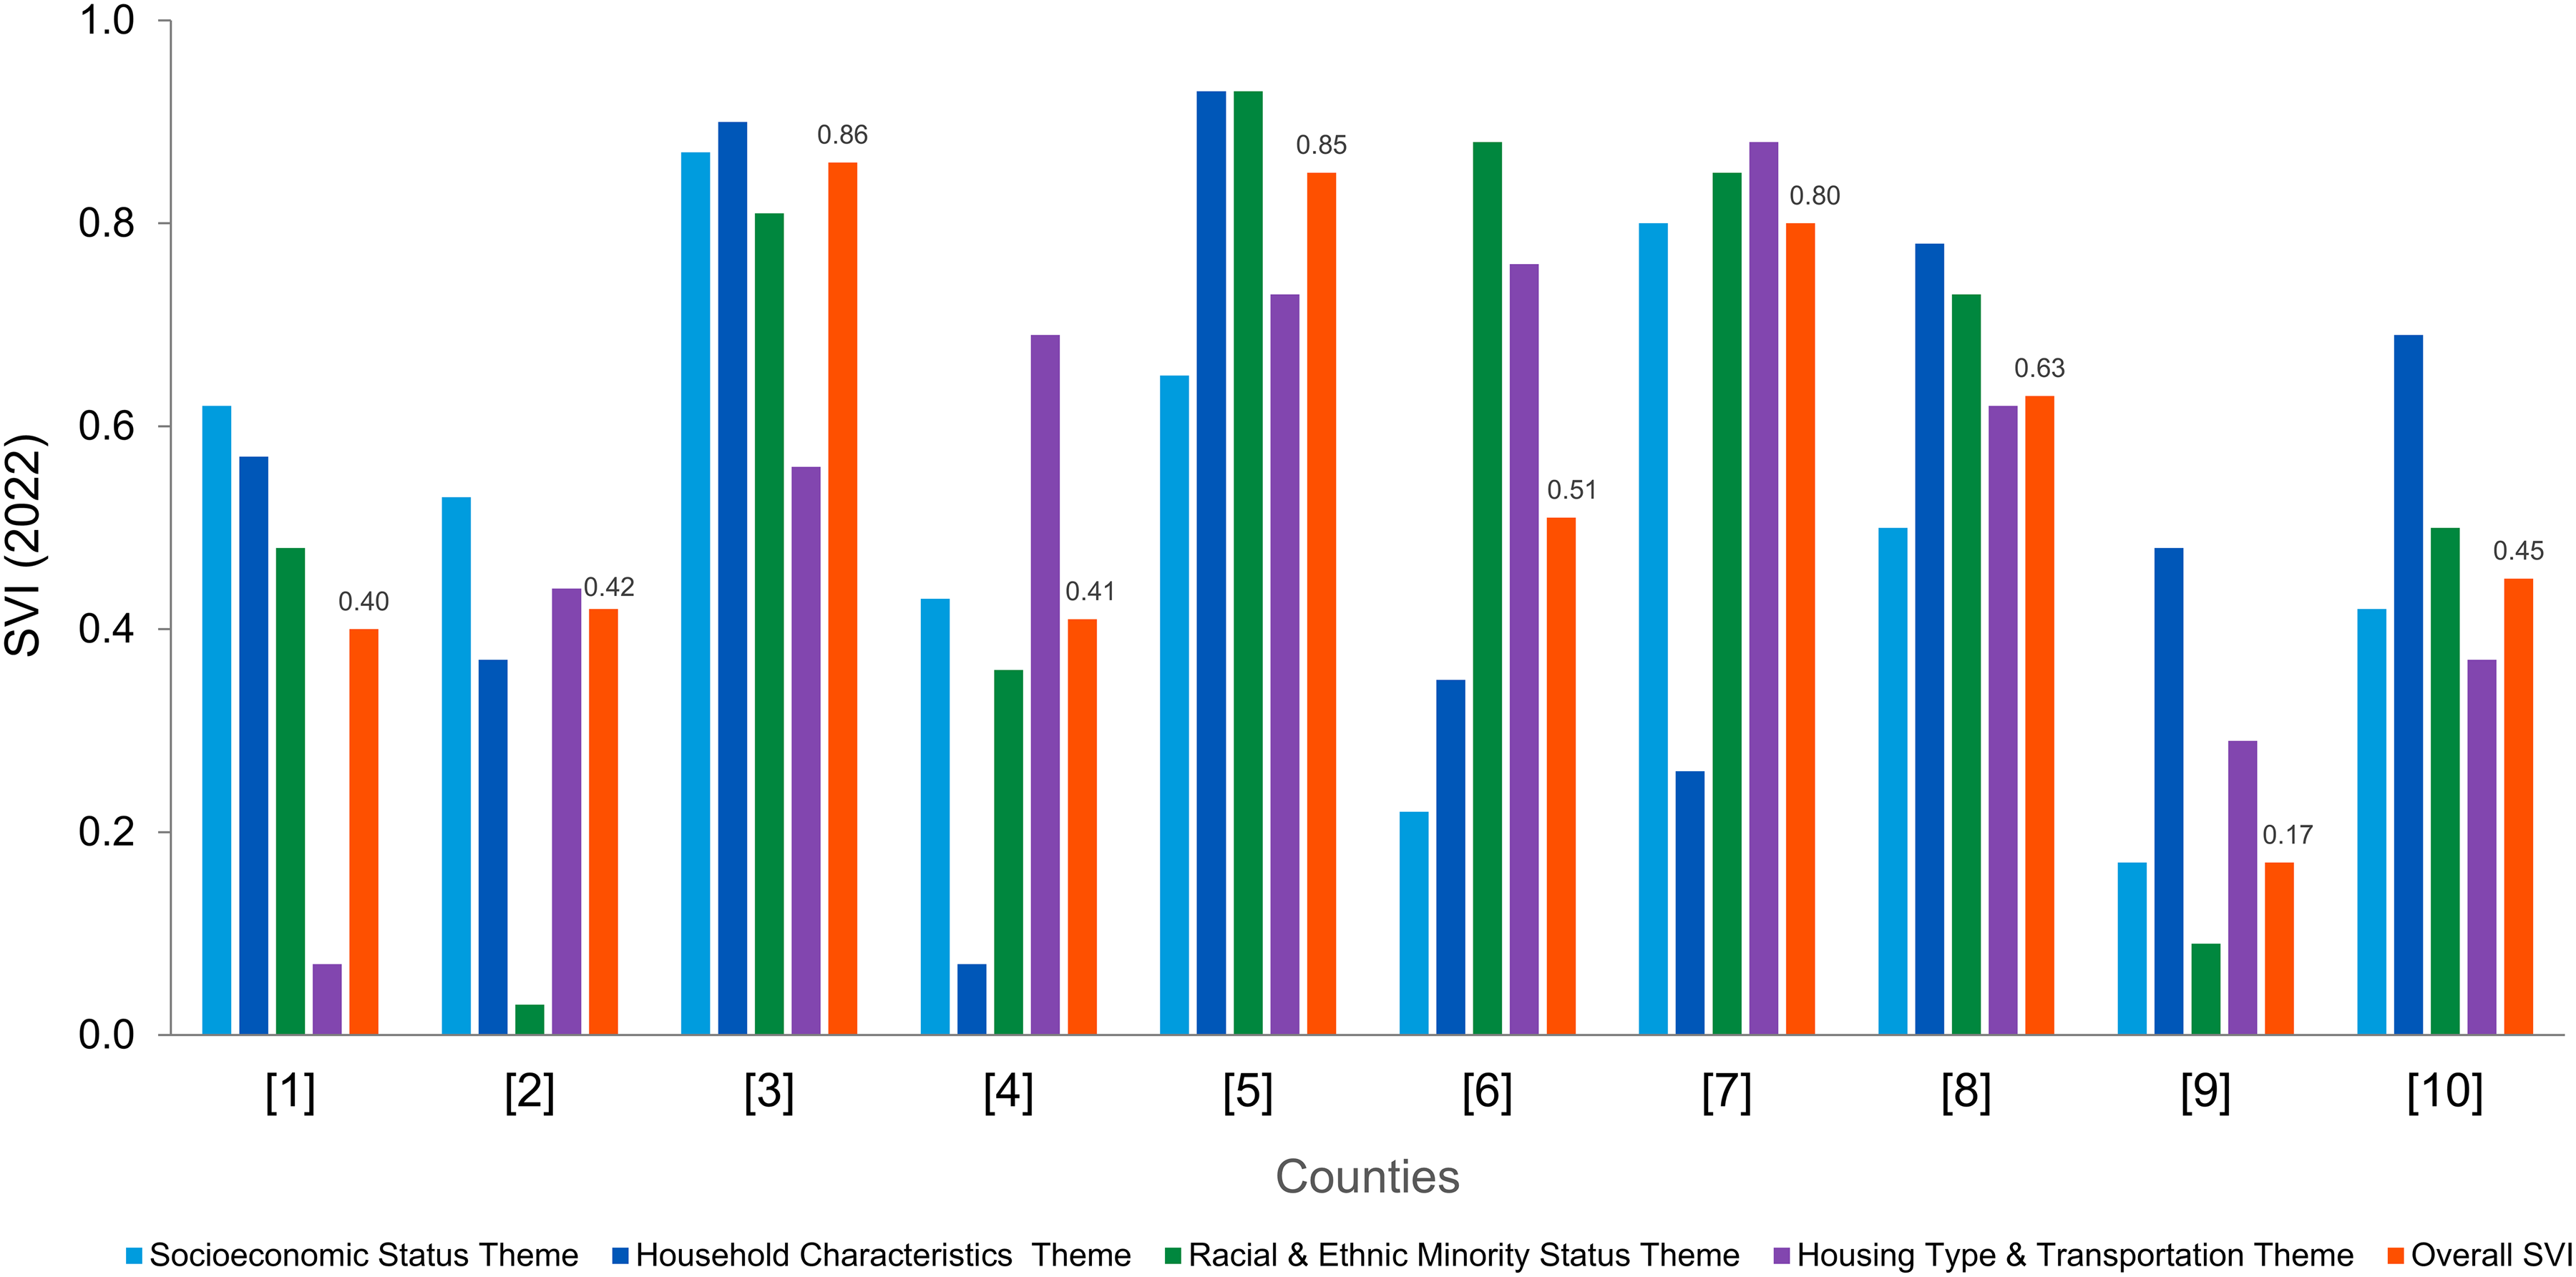
Social Vulnerability Index (SVI 2022, county level, Minnesota, US). Overall SVI values are shown. SVI values are provided to 4 decimal places, but they are rounded to 2 decimal places for the figure.
Taking all this information into account (Figure 1), we selected potential communities for the first wave of ORE activities (Table 1), focusing on rural communities (areas with primary RUCA codes 4–10), ensuring inclusion of counties with high SVI, and requiring a drive of 90 min or less. It was not necessary to have an MCHS facility in the selected communities. All selected communities were in areas designated as primary care Health Professional Shortage Areas (HPSA; Table 1); two were in areas designated as mental health HPSA; one was in a medically underserved area; and one was a medically underserved population. First touchpoints could be initiated by our team with local community-based services and organizations, and vice versa, and there had to be an interest from the communities to engage with our center.
Characteristics of rural communities considered for outreach activities.
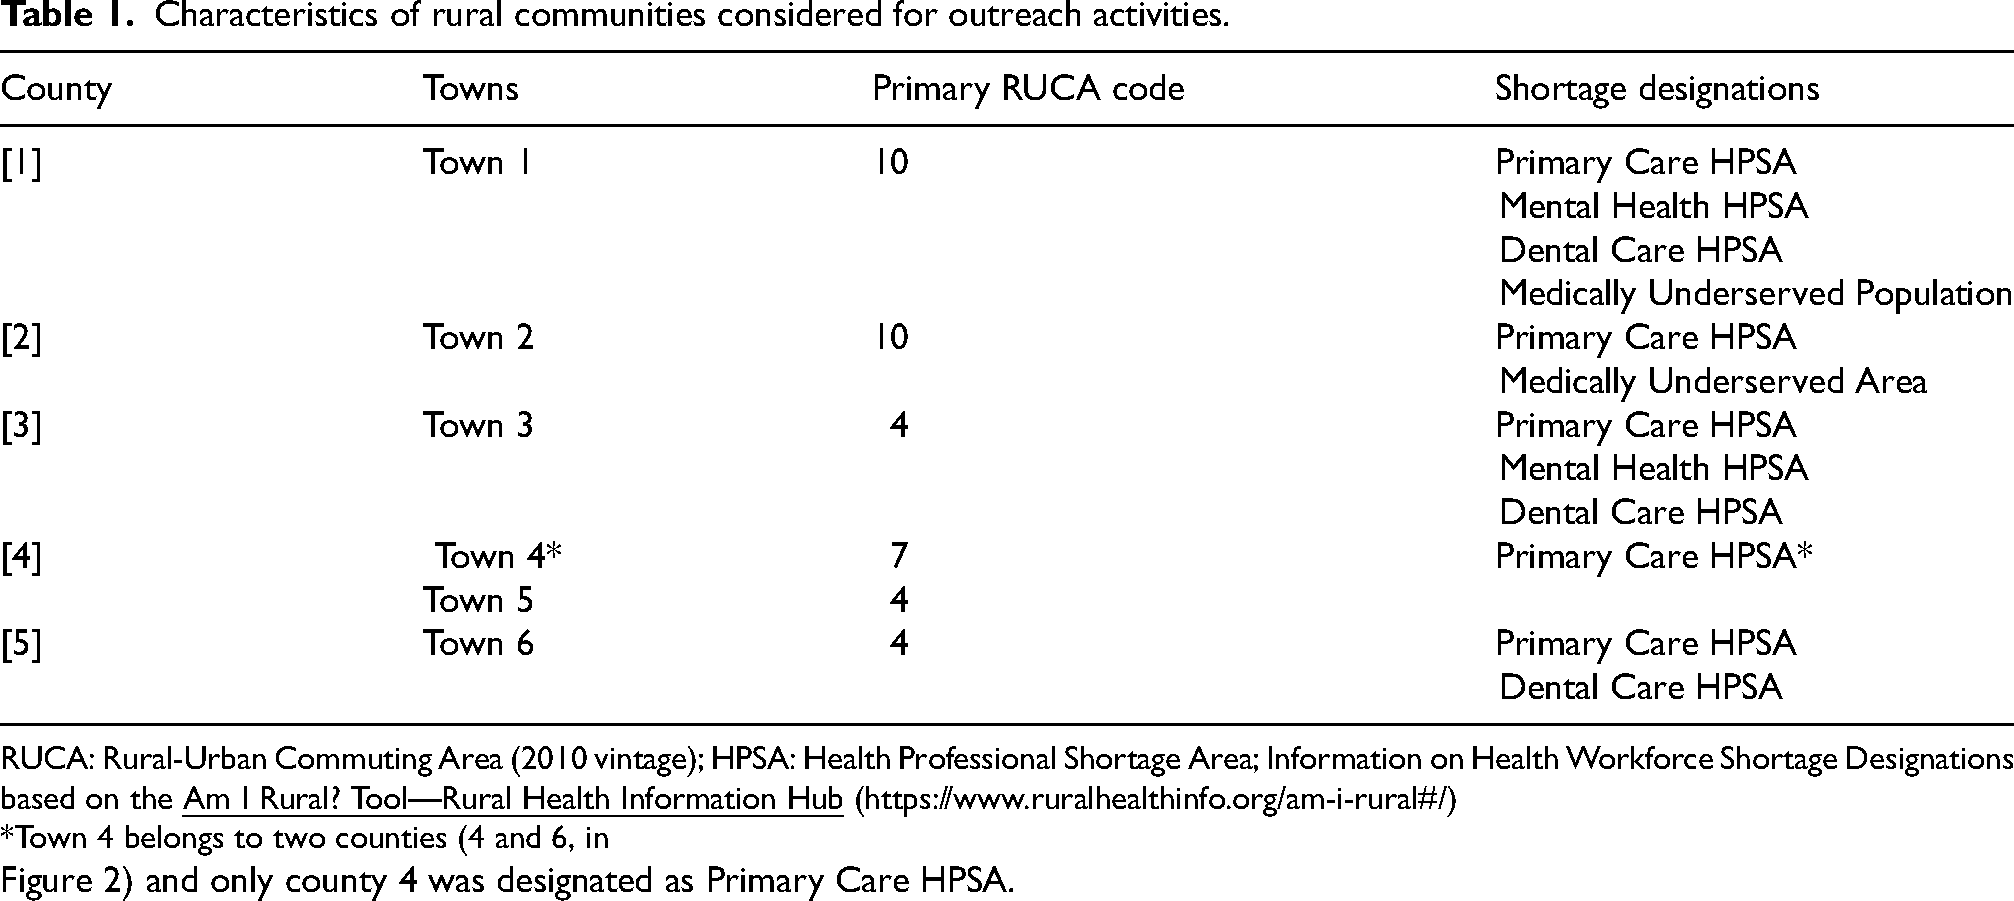
RUCA: Rural-Urban Commuting Area (2010 vintage); HPSA: Health Professional Shortage Area; Information on Health Workforce Shortage Designations based on the
*Town 4 belongs to two counties (4 and 6, in Figure 2) and only county 4 was designated as Primary Care HPSA.
Discussion
Our center is known for its dedication to addressing the needs of adults impacted by ADRD through partnerships with local community organizations in our city and surrounding communities. Often, a community resident or leader reaches out to us because their neighboring community participated in one of our offerings and wants the same in their area. We did not prioritize the described steps; outreach activities could start at any bubble in Figure 1. We have outreach activities in parallel with new communities and also maintain outreach with communities with long-standing relationships. However, across all steps, this approach helped us become familiar with social exposome metrics for potential outreach areas, which could also inform us of potential barriers to healthcare access and better health outcomes, and ensure that our activities extend to rural and potentially under-resourced communities, thereby supporting greater inclusion and representativeness.
The goal of this communication is to reflect on our experience and share measures that were useful in this effort. In Figure 1, the bubble devoted to the social exposome and local barriers includes the publicly available measures we used (or will add in the future), except the RUCA codes. These measures did not have cut-off points in our approach, but they were useful to understanding the social exposome/SDoH of the areas and also helped us make informed outreach decisions and ensure inclusion of communities we believed had greater barriers. We used measures from easy-to-find publicly available databases, which we were able to explore with some, but not extensive, help from experienced data scientists. This helped our group become more independent and flexible, enabling us to swiftly determine where the ORE Core team would go for outreach and engagement. We also found it easy to explore measures mapped to ZIP codes, which may reflect the fact that many towns around our center have a single 5-digit ZIP code; measures based on census tracts (e.g., SVI based on the census tract) could also be very helpful and would provide values more geographically precise for the outreach areas and are candidates for future examinations. In addition, not all measures were used as often. Once we examined SVI and ADI values in areas around our center or where MCHS facilities were located, we focused more on the RUCA codes to guide our expansion of rural outreach. As new areas or counties are added to our outreach, we will revisit these and potentially additional publicly available measures that help reflect societal and community barriers or facilitators to better health in rural communities. 7
Using primary RUCA codes to assign rurality status helped us visualize the rural-urban community patterns within the counties and also ensured that isolated rural areas (primary RUCA codes of 10) were included in a diverse selection of rural communities (primary RUCA codes 4–10). However, we have not yet systematically assessed whether rurality defined by these measures aligns with residents’ perceptions of rurality. The definition we used for rurality covers part of the criteria used by the Federal Office of Rural Health Policy (FORHP) in its definition of areas eligible for Rural Health Grants; the FORHP definition includes additional criteria related to counties, RUCA codes and the inclusion of the Road Ruggedness Scale (RRS). 15 However, we also examined whether our areas of potential outreach were eligible for such grants, and most of the counties we initially explored were eligible in all their locations (21 of 29), while a few were not eligible (5 counties) or were eligible in some locations (3 counties). All locations of the five counties (1–5) included in Table 1 were eligible for FORHP Rural Health Grants. Additional details are included in Supplemental Material.
Rural communities are not monolithic, and this was also evident in the measures we examined, which shed light on the social exposome in areas within our center's reach; they provide insight into potential area-level social and structural barriers to better brain health outcomes. In selecting the measures, it was also important to consider whether prior research has evaluated their association with cognitive impairment risk. For instance, living in disadvantaged neighborhoods (as assessed by ADI) has been associated with higher cognitive impairment risk.13,16,17 In addition, although SVI has been used to identify social vulnerability in the context of disaster management, both census tract and county-level higher SVI have been associated with worse health-related outcomes18–20; higher SVI (at the census tract level) has been associated with greater AD risk and faster rate of global cognitive decline, 19 as well as with higher cardiovascular risk factors and coronary heart disease prevalence, 20 risk factors for late-life cognitive impairment.
Although not the primary purpose of this communication, it is important to note that once rural communities are identified, the focus turns to arranging meetings with community stakeholders to assess their specific needs and interests, and to ensure that we align our programming style (delivery, content, and cultural references) with each unique community. By engaging with rural community residents in such a relationship-centric manner through consistent interactions, we can tailor our engagement activities and offerings to each community. More recently, we have created a “Menu of Offerings” for community members to review, which has led to productive conversations with community stakeholders as well as further customization. Outreach activities we offer include education on healthy brain aging, ADRD prevention, age-related cognitive decline, warning signs of ADRD, the value of early diagnosis, ADRD management, caregiving skills training and support, understanding research, and creating dementia-friendly communities, to name a few.
As older residents of rural communities might be diagnosed later with ADRD, 6 this community outreach education has the potential to positively impact those seeking a diagnosis earlier. An early diagnosis has significant benefits. It validates what the person with ADRD and their family are experiencing, explains the symptoms so they can be attributed to the disease rather than personal failure and increases the likelihood of positive coping strategies, access to resources, supports planning for future care, timely use of treatment and lifestyle approaches, and opens opportunities to participate in research. Rural-dwelling individuals are underrepresented in research, including studies on environmental and lifestyle factors affecting ADRD risk 4 and a lack of awareness of the potential benefits of research has been identified in rural communities. 21
Our approach is not without limitations. While SVI is useful as a metric of the social exposome at the county level, it may not accurately reflect the social vulnerability of specific census tracts related to a rural community; thus, SVI at the census tract level would provide more geographically precise values for outreach areas of interest. Both ADI and SVI are multidimensional indices that use ACS data; however, we considered it important to review county-level metrics (such as SVI), neighborhood-level metrics (such as ADI), and shortage designations. Each measure provides unique insights, such as the SVI “racial and ethnic minority status” theme, which offers insight into a county's ethnic and racial diversity. There are multiple definitions of rurality, none of which is unanimous, and many are not created with healthcare services and outcomes in mind. In addition, as we used publicly available measures, their availability is limited to specific years, and updates do not depend on the outreach team.
Using multiple indicators of the social exposome provides valuable, complementary insights for outreach regions. As rural communities are underrepresented in cognitive health research, ensuring that the outreach, recruitment, retention, and engagement activities also reach under-resourced rural communities is of the utmost importance. Outreach groups can select the measures most appropriate for their specific target areas. This approach can serve as an example for other groups seeking to enhance their rural outreach.
Supplemental Material
sj-pdf-1-alz-10.1177_13872877261454612 - Supplemental material for Reflections on rural community characteristics by an outreach, recruitment, and engagement team
Supplemental material, sj-pdf-1-alz-10.1177_13872877261454612 for Reflections on rural community characteristics by an outreach, recruitment, and engagement team by Maria Vassilaki, Steven M. Smith, Tasha M. Loftin, Essa A. Mohamed, Nick Rethemeier, Ryan P. Coburn, Jonathan Graff-Radford, Ronald C. Petersen, Bradley F. Boeve and Angela M. Lunde in Journal of Alzheimer's Disease
Footnotes
Acknowledgements
The authors thank the communities participating in the Outreach, Recruitment, and Engagement (ORE) Core activities and the staff of the Mayo Alzheimer's Disease Research Center.
ORCID iDs
Ethical considerations
Outreach to rural communities was approved by the Mayo Clinic Institutional Review Board.
Consent to participate
Not applicable
Author contribution(s)
Funding
The authors disclosed receipt of the following financial support for the research, authorship, and/or publication of this article: The study was supported by National Institute on Aging [NIA] (grant number P30 AG062677).
Declaration of conflicting interests
The authors declared the following potential conflicts of interest with respect to the research, authorship, and/or publication of this article: Steven M. Smith, Tasha M. Loftin, Essa A. Mohamed, Nick Rethemeier and Ryan P. Coburn declared no potential conflicts of interest with respect to the content of this manuscript.
Maria Vassilaki receives research support from the NIH; she currently has equity ownership in Amgen, Johnson and Johnson, and Medtronic. She is an Editorial Board Member of this journal, but was not involved in the peer-review process of this article, nor had access to any information regarding its peer-review.
Jonathan Graff-Radford reports serving on the Data Safety Monitoring Board (DSMB) for NINDS strokeNET, is a consultant for Open Evidence, site investigator Eisai and JAMA Neurology and an associate editor for JAMA Neurology.
Ronald C. Petersen reports serving as a consultant for Roche Inc., Genentech Inc.,
Eli Lilly and Company, Eisai Inc., Novartis, Novo Nordisk and on a DSMB for Genentech, contributing to Medscape education, and receiving royalties from Oxford University Press and UpToDate.
Bradley F. Boeve, reports honorarium for SAB activities for the Tau Consortium—funded by the Rainwater Charitable Foundation; institutional research grant support for clinical trials from Alector, Transposon, Cognition Therapeutics, EIP Pharma; grant support from NIH, Lewy Body Dementia Association, American Brain Foundation, Mayo Clinic Dorothy and Harry T. Mangurian Jr. Lewy Body Dementia Program, the Little Family Foundation, the Ted Turner and Family Foundation
Angela M. Lunde receives NIH research funding and is also a community engagement research consultant/mentor for the University of Minnesota.
Data availability statement
Not applicable. The manuscript does not contain participant data. All data presented in the manuscript are publicly available.
Supplemental material
Supplemental material for this article is available online.
References
Supplementary Material
Please find the following supplemental material available below.
For Open Access articles published under a Creative Commons License, all supplemental material carries the same license as the article it is associated with.
For non-Open Access articles published, all supplemental material carries a non-exclusive license, and permission requests for re-use of supplemental material or any part of supplemental material shall be sent directly to the copyright owner as specified in the copyright notice associated with the article.