
Abstract
Cerebrospinal fluid (CSF) status is an indicator of pathological feature associated with metabolic waste clearance dysfunction in Alzheimer's disease (AD) progression. Magnetic resonance-based conductivity imaging provides novel contrast sensitive to ion concentration, mobility, and microstructural changes. We applied conductivity imaging to 5xFAD mice and age-matched wild-type controls using 9.4 T MRI, measuring regional conductivity in ventricular CSF, caudate putamen, cerebral cortex, thalamus, and hippocampus. AD mice showed ventricular enlargement with significantly elevated CSF conductivity, and increased hippocampal conductivity consistent with AD involvement, but no changes in other regions. These findings suggest conductivity imaging as a marker of fluid microenvironmental changes in AD.
Keywords
Introduction
Alzheimer's disease (AD) is biologically defined by the pathological presence of amyloid-β and tau proteins, and clinically characterized by progressive neurodegeneration.1,2 Recent evidences indicate that impairment of the glymphatic system plays a crucial role in the accumulation of metabolic waste and the progression of neurodegeneration.3–6 Neuroimaging techniques such as magnetic resonance imaging (MRI), positron emission tomography, and magnetic resonance spectroscopy have been widely applied to noninvasively monitor brain atrophy, glucose metabolism, and amyloid/tau protein deposition.7,8 Although brain metabolic waste clearance in AD is strongly associated with ion homeostasis, cerebrospinal fluid (CSF) composition, and fluid-tissue interactions, it is notable that contemporary imaging methods still provide only limited information on these processes.9,10
CSF flow imaging using conventional MRI has been widely applied to the study of AD.10–12 Advanced methods such as phase-contrast MRI and diffusion tensor imaging of CSF have provided crucial information on metabolic waste clearance pathways and fluid dynamics.13–15 These methods enable noninvasive evaluation of CSF movement and volume changes, which are closely related to amyloid clearance and brain homeostasis. However, current CSF flow imaging alone provides limited information on the underlying ionic and molecular composition of the fluid, primarily capturing movement and volume changes. Volumetric expansion analysis provides limited information to noninvasively and directly interpret changes in electrolyte homeostasis, protein content, or extracellular ion mobility, which are critical for understanding the microenvironmental changes in AD. Furthermore, CSF flow imaging requires high technical precision and is often affected by motion artifacts and image acquisition limitations.
MR-based electrical conductivity imaging provides quantitative maps of tissue ionic properties and microstructure.16–18 Since electrical conductivity is influenced by ion concentration and mobility, as well as cellular microstructure, it offers a functional assessment tool that complements structural and metabolic imaging.17,18 The changes in tissue conductivity have been reported to reflect pathophysiological processes such as inflammation, extracellular matrix changes, and altered CSF homeostasis.19–21 In particular, hippocampal atrophy and ventricular enlargement are established hallmarks of AD,22,23 and CSF alterations and extracellular ionic changes are known to be involved in disease progression. 24
In this preliminary study, we evaluated the potential of MR-based conductivity imaging as an imaging biomarker for AD brain by quantifying the conductivity distribution of CSF. In vivo conductivity imaging was performed using a 9.4 T MRI in a 5xFAD transgenic mouse model of AD and age-matched wild-type (WT) control. To compare differences between two groups and two time points, tissue conductivity was measured in the intraventricular CSF, caudate putamen, cerebral cortex, thalamus, and hippocampus of WT control and AD model mice at 9 and 11 months of age, respectively.
Methods
Animal preparation
5xFAD transgenic mouse line was used in this study because it rapidly develops amyloid-β plaques from an early age and exhibits progressive hippocampal degeneration. 5xFAD mice (n = 5) and age-matched WT mice (n = 5) were included. Animal care, maintenance, and treatments followed the protocol approved by the Institutional Animal Care and Use Committee (IACUC, No. 2021-0077) of the Korea Institute of Radiological & Medical Sciences (KIRAMS). MRI experiments were performed on WT and AD model mice at 9 and 11 months of age, respectively.
In vivo MR-based conductivity imaging
After anesthetizing mice with isoflurane (anesthetized with a 1–2.5% isoflurane in oxygen), mice were placed inside the bore of a 9.4 T MRI scanner (Agilent Technologies, Santa Clara, CA, USA) equipped with a birdcage volume RF coil. A multi-echo multi-slice (MEMS) spin-echo pulse sequence was applied to obtain B1 maps (see Figure 1), which were used to calculate high-frequency (about 400 MHz at 9.4 T) conductivity images. 25 Imaging parameters were as follows: TR/TE = 1500/15–90 ms, number of echoes = 6, number of averages = 5, slice thickness = 1 mm, number of slices = 6, matrix size = 128 × 128, FOV = 25 × 25 mm, 2 and total imaging time = 13 min.
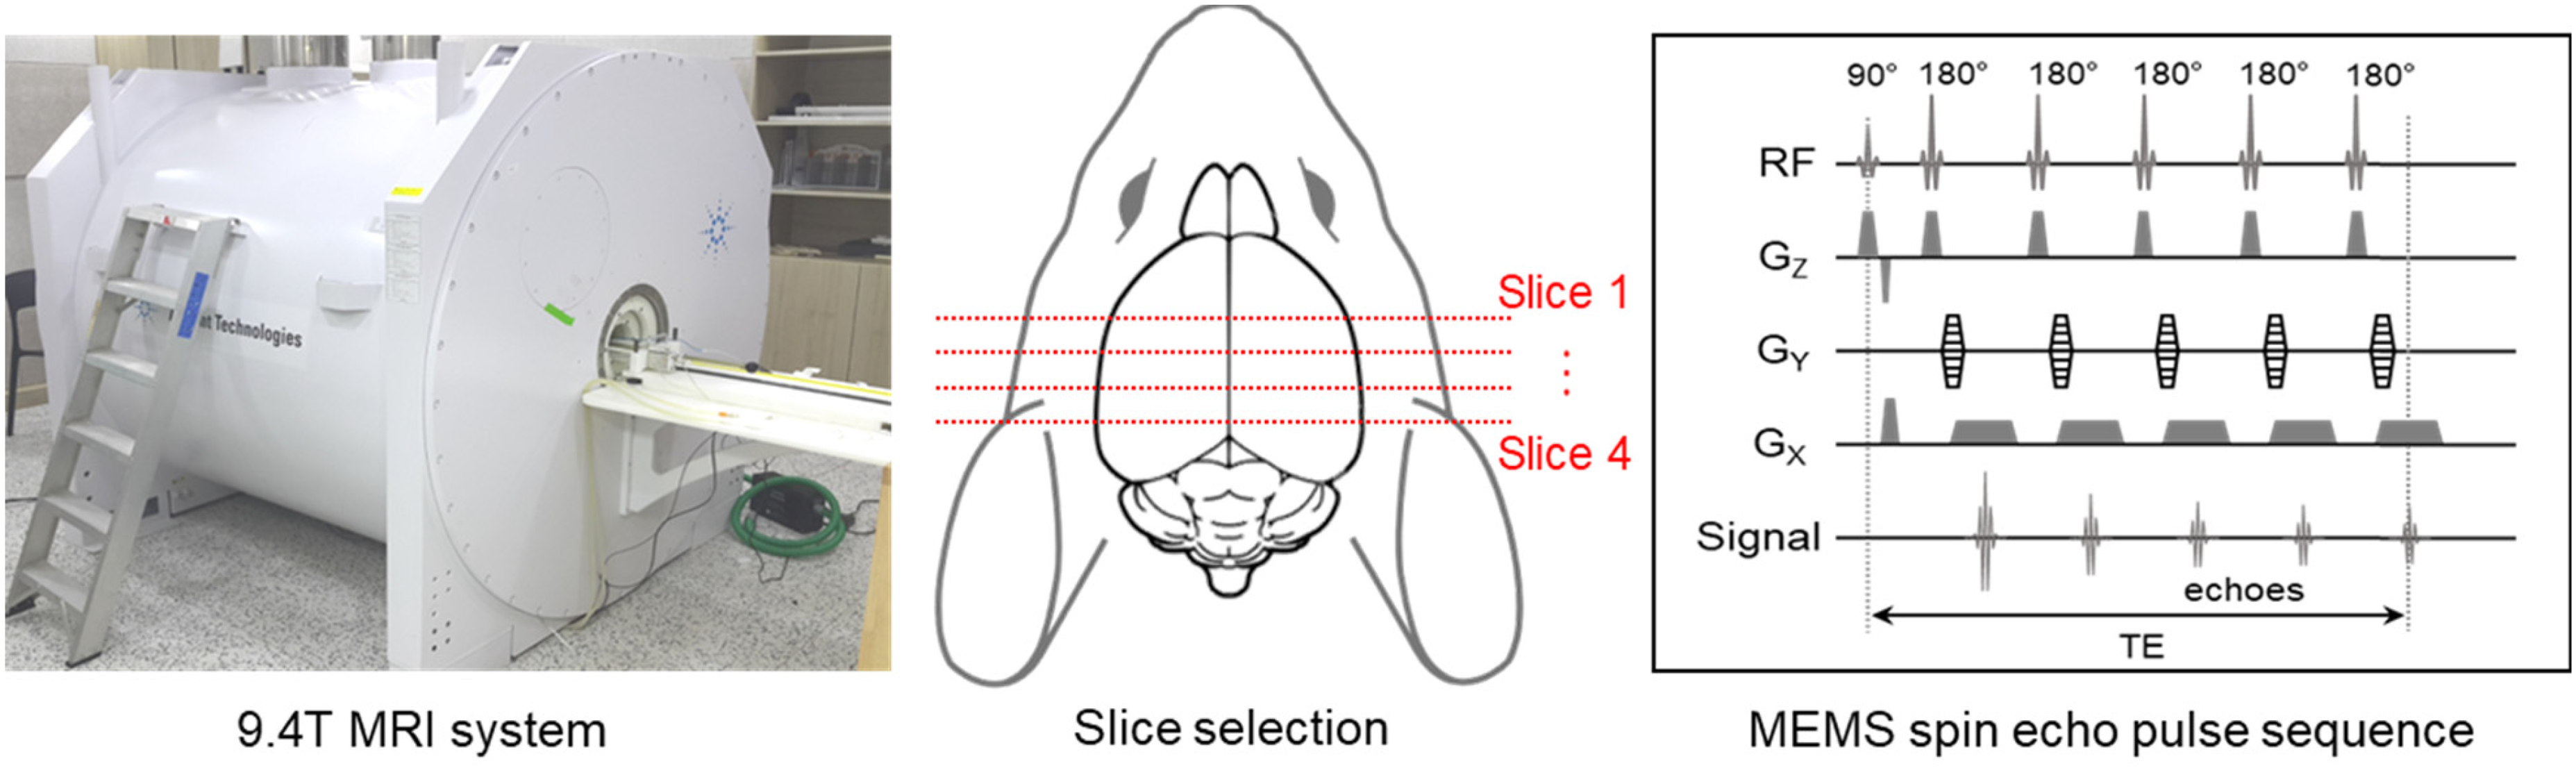
Experimental setup for electrical conductivity imaging of mouse brain using a 9.4 T MRI. High-frequency conductivity images of brain were acquired with a MEMS spin echo pulse sequence, and slices were selected to include the ventricles, caudate putamen, cerebral cortex, thalamus, and hippocampus.
Reconstruction and quantification of electrical conductivity
Electrical conductivity was reconstructed from optimized B1 phase images obtained from MEMS data after multiple preprocessing steps. The raw data were extracted from the k-space of the MR spectrometer. MEMS images were reconstructed using a 2D fast Fourier transform and then separated into magnitude and phase images. The phase images were unwrapped using the PUMA algorithm, 24 and the unwrapped phase images of each echo were averaged with a weighting factor to improve the signal-to-noise ratio (SNR). Details of conductivity image reconstruction followed the method described by Lesbats et al. (2021). 25 For comparison, regions-of-interests (ROIs) were manually delineated on the lateral ventricles, caudate putamen, cerebral cortex, thalamus, and hippocampus using co-registered anatomical images. Conductivity values were measured and compared between two groups using unpaired t-tests (p < 0.05).
Results
In vivo conductivity images of mouse brains
Figure 2 shows typical results of electrical conductivity imaging obtained from WT and AD model mice at 9 months of age. Anatomical MR images (upper panel) showed ventricular enlargement in the AD mice relative to controls, but no differences in morphological changes were observed in the other regions. In contrast, conductivity images (lower panel) showed a marked increase in ventricular conductivity (yellow arrow) in the AD mice relative to controls. Meanwhile, a marked increase in conductivity was also observed in the hippocampus (red arrow), but no differences in conductivity were observed in the other regions between two groups.
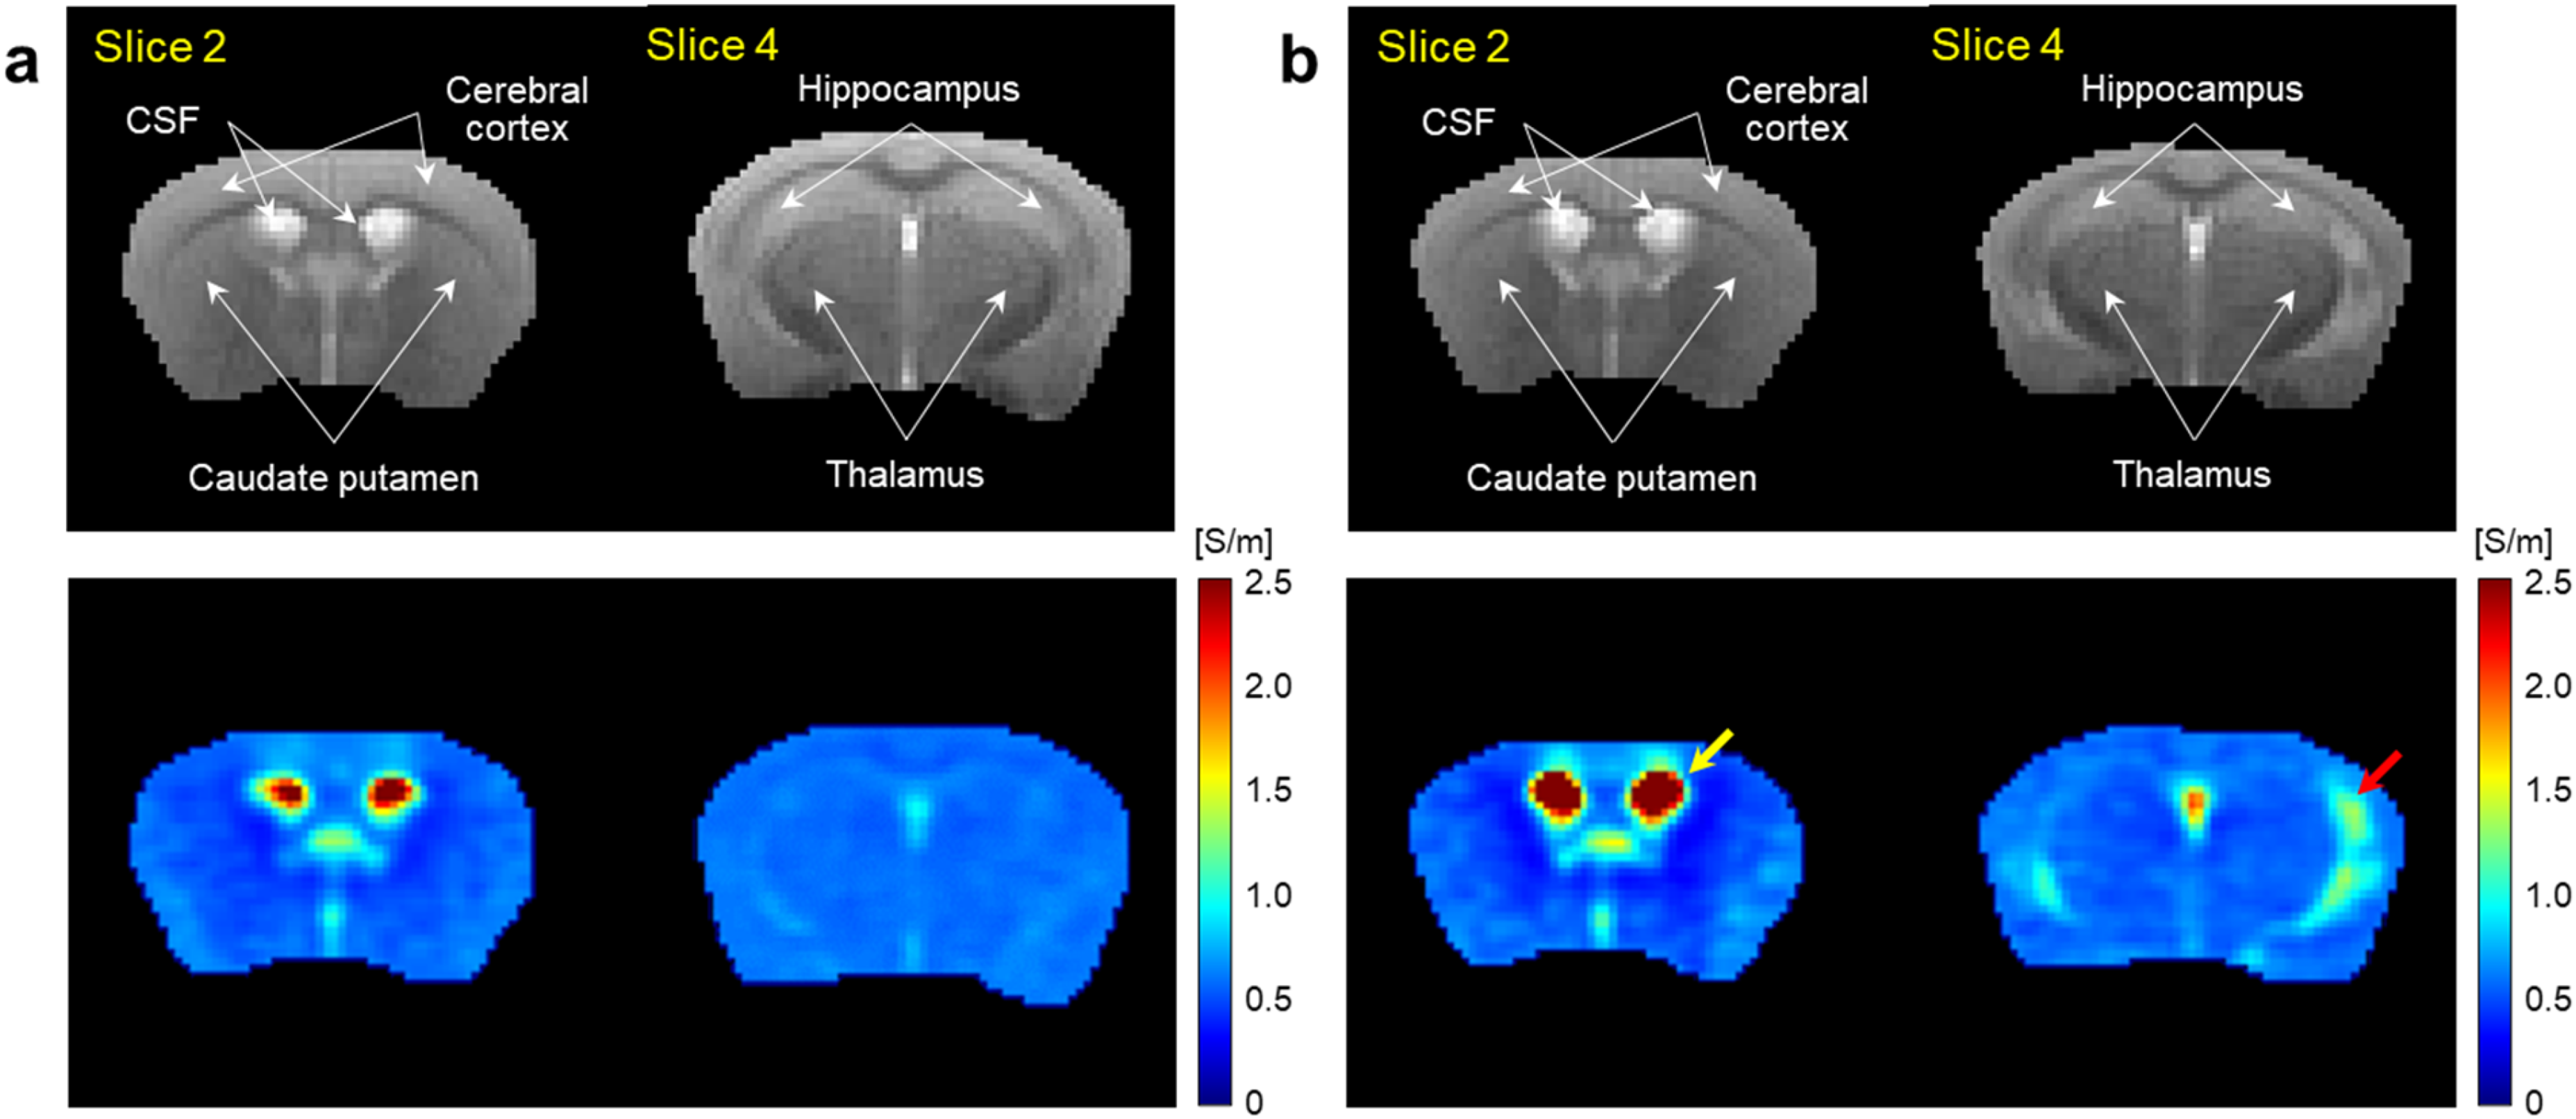
T2-weighted MR (upper) and electrical conductivity (lower) images of brains obtained from WT (a) and AD model (b) mice at 9 months of age. Imaging slices were selected to include the intraventricular CSF, caudate putamen, cerebral cortex (slice 2), thalamus and hippocampus (slice 4) in both groups. Yellow (CSF) and red (hippocampus) arrows indicate regions of increased conductivity in AD mice compared to WT controls (Color figure available online).
Figure 3 shows the results of electrical conductivity imaging obtained from multiple slices of 9-month-old WT and AD model mice. Anatomical MR images showed a ventricular enlargement in the AD mice compared to the WT control. Signal intensity was increased in the hippocampus, while no difference was observed in the other regions. Electrical conductivity images showed a marked increase in the ventricles (yellow arrows) of the AD mice compared to the WT controls, as well as a marked increase in the hippocampus (red arrows). In other regions, there was no difference in conductivity between two groups.
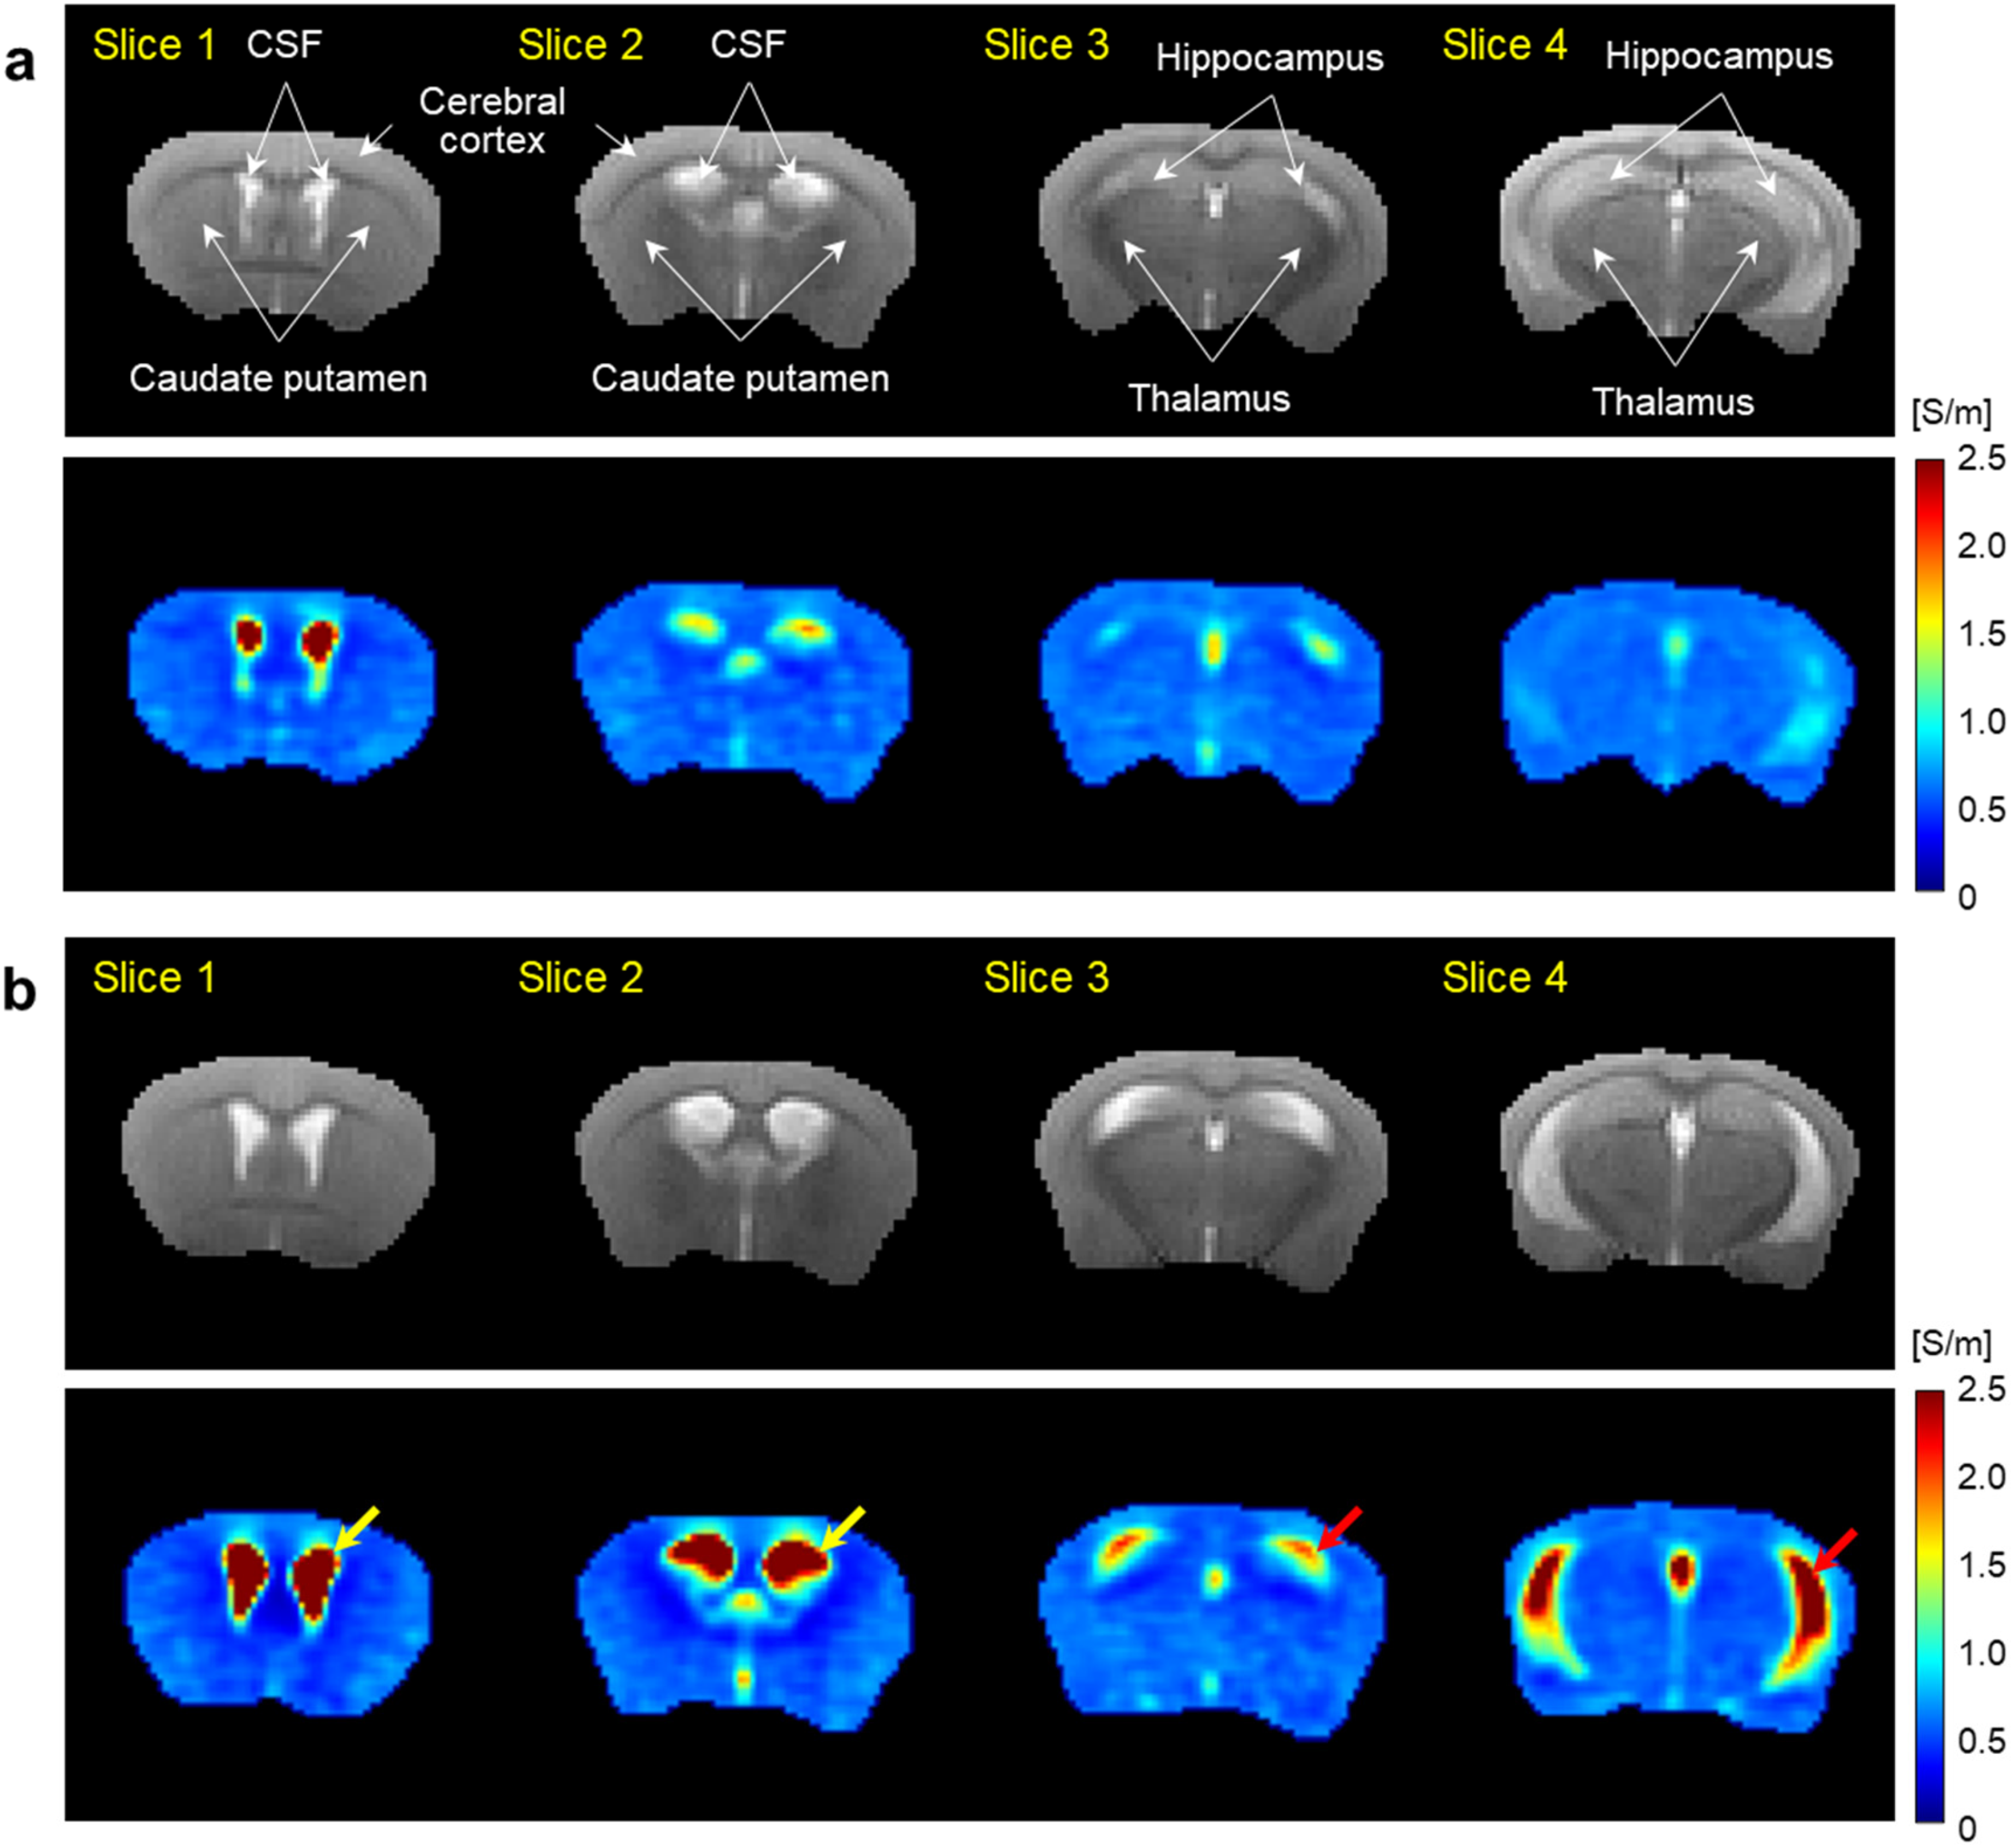
Multi-slice T2-weighted MR (upper) and electrical conductivity (lower) images of brains obtained from WT (a) and AD model (b) mice at 9 months of age. Imaging slices were selected to include the intraventricular CSF, caudate putamen, cerebral cortex (slice 1 and 2), thalamus and hippocampus (slice 3 and 4) in both groups. Yellow (CSF) and red (hippocampus) arrows indicate regions of increased conductivity in AD mice compared to WT controls (Color figure available online).
Comparison of regional conductivity between two time points
Figure 4 shows electrical conductivity images of the WT and AD model mice obtained at 9 and 11 months of age, respectively. In the WT controls (Figure 4(a)), conductivity in the ventricles markedly increased at 11 months compared to 9 months, but no difference was observed in the caudate putamen, cerebral cortex, thalamus. Interestingly, there was a modest conductivity increase in the hippocampus at 11 months of age. In the AD mice (Figure 4(b)), conductivity of the ventricular CSF and hippocampus markedly increased at both two time points, but no difference was observed in the other regions. Specifically, the ventricles were more enlarged and their conductivity was relatively higher at 11 months than that of 9 months.
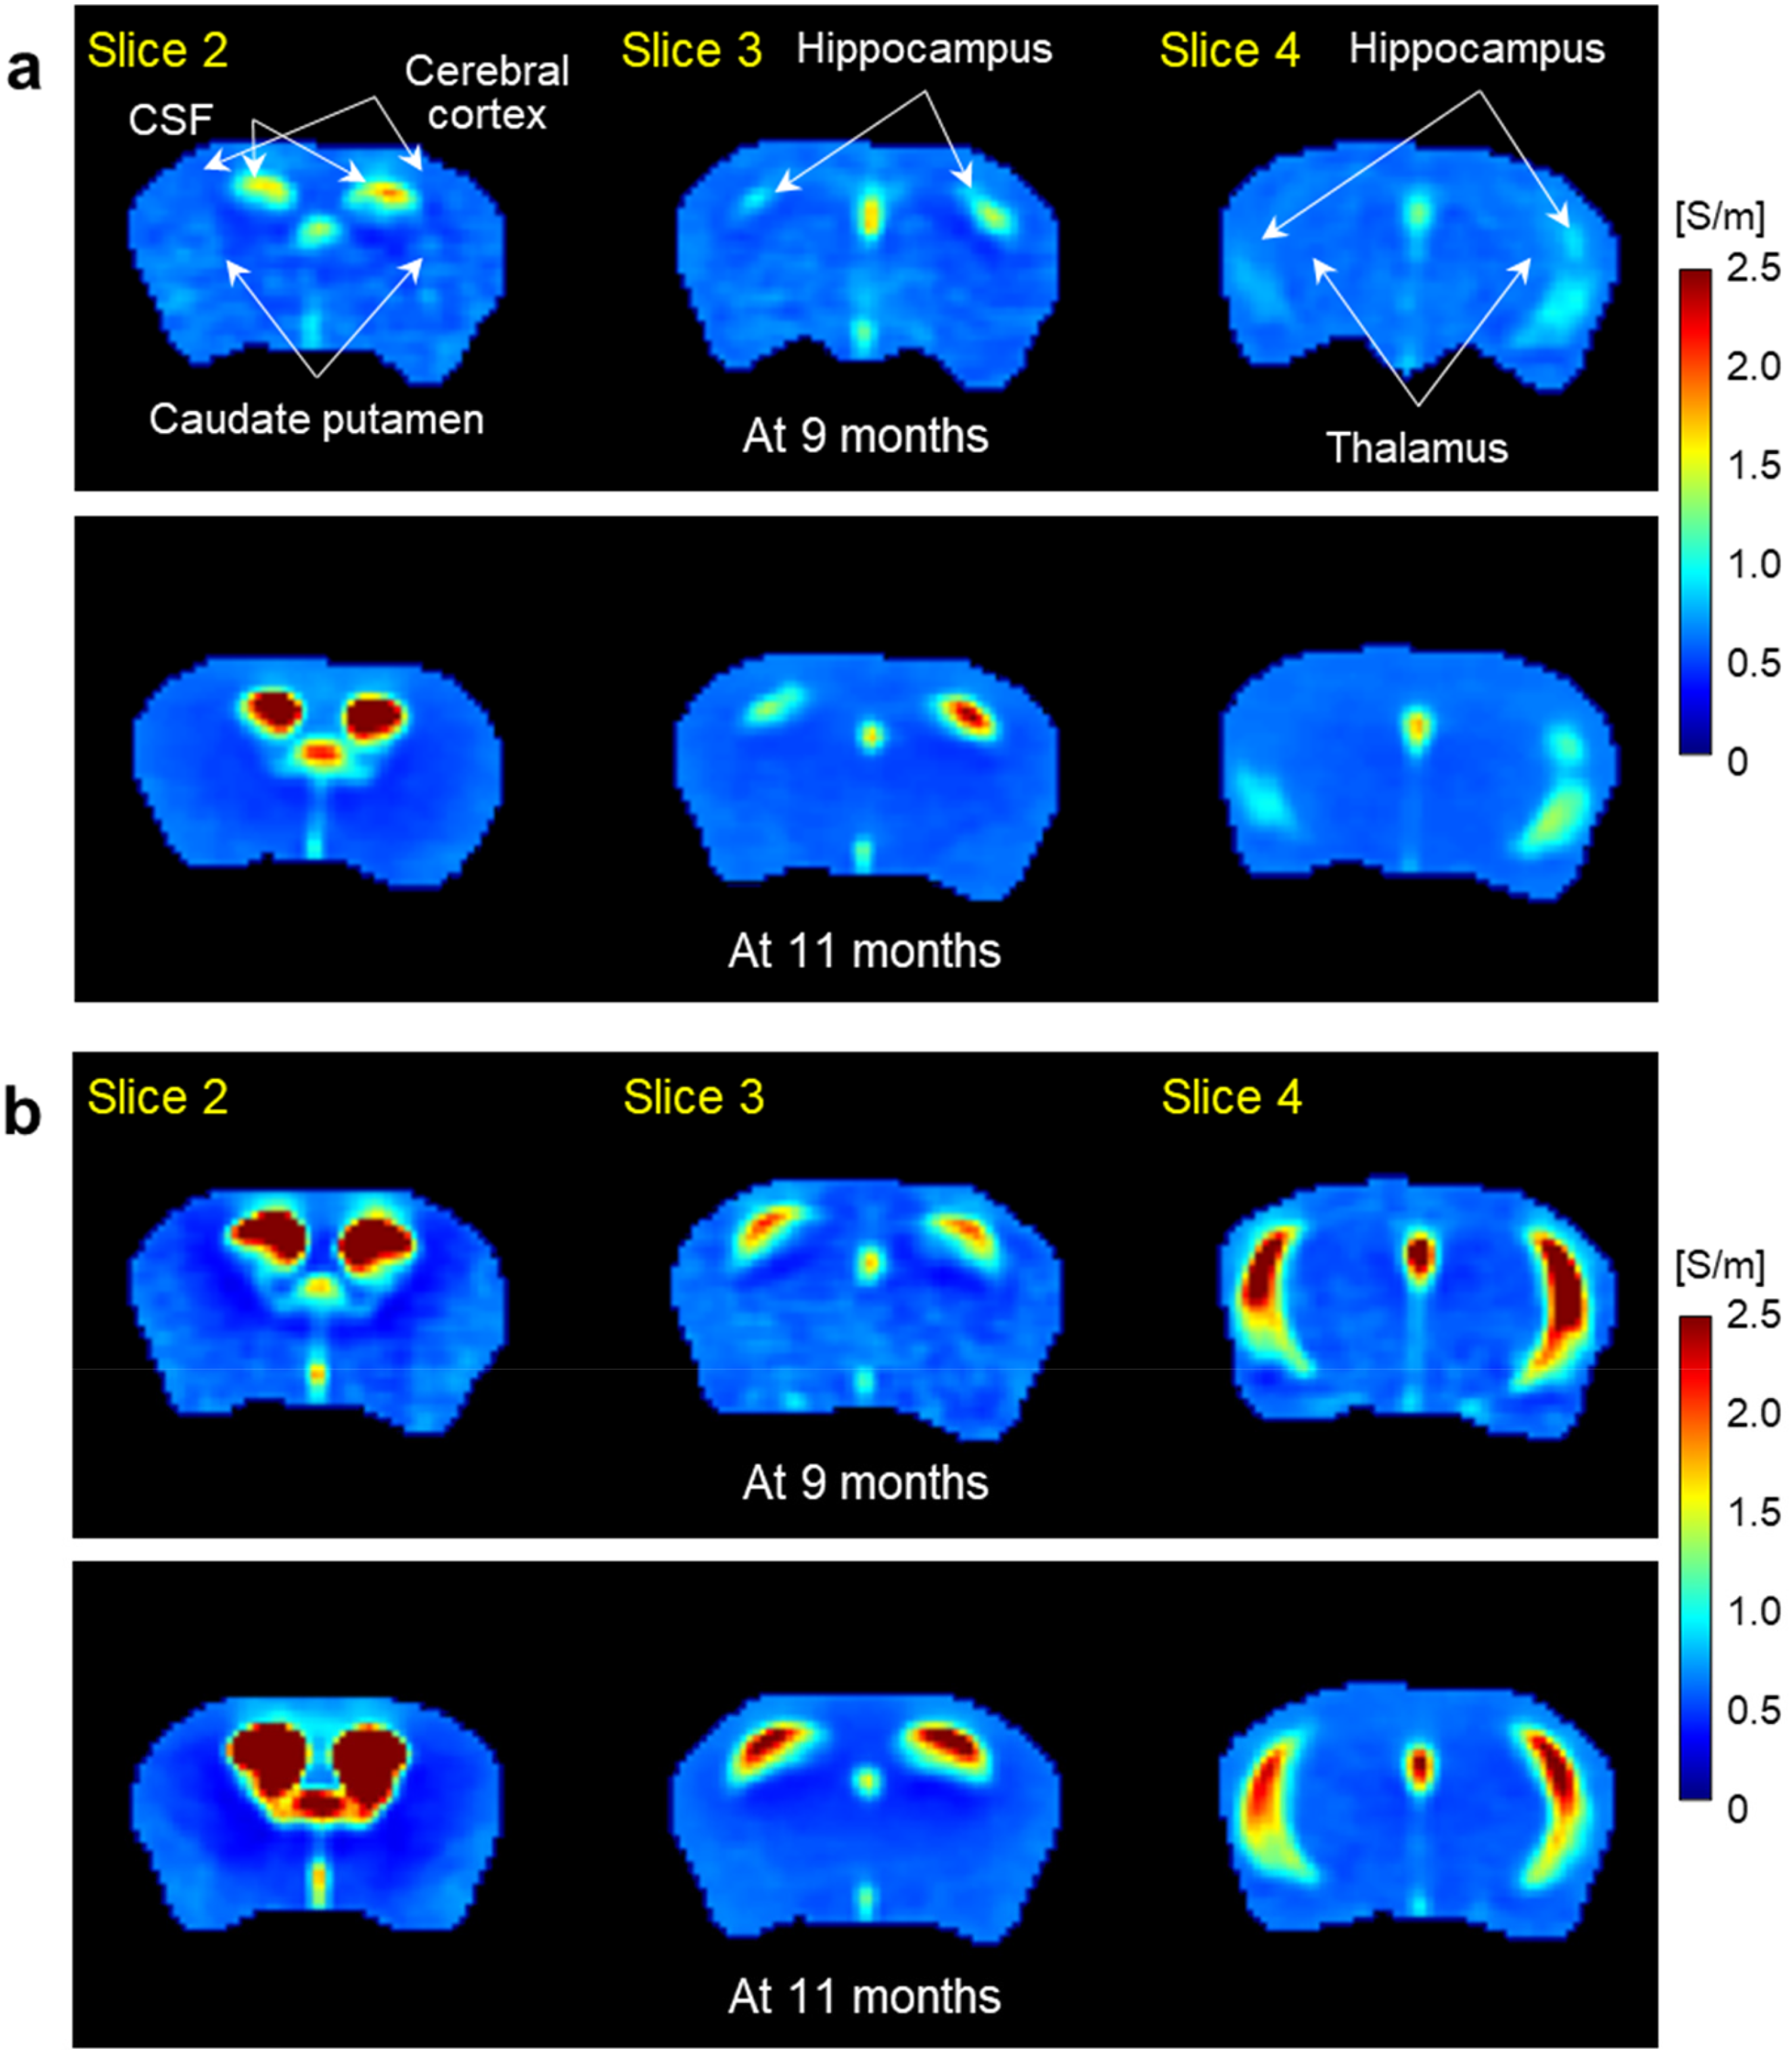
Electrical conductivity images of the WT (a) and AD model (b) mice obtained at 9 months (upper panels) and 11 months (lower panels) of age, respectively. Imaging slices were focused on the intraventricular CSF, caudate putamen, cerebral cortex (slice 2), thalamus and hippocampus (slice 3 and 4).
Conductivity analysis between WT and AD mice
Figure 5 is a bar graph comparing tissue conductivity measured in the WT and AD model mice. The conductivity of the intraventricular CSF, caudate putamen, cerebral cortex, thalamus, and hippocampus were measured at 9 and 11 months of age, respectively. At 9 months of age (Figure 5(a)), the conductivity of the CSF and hippocampus in the AD mice was significantly increased compared to the WT controls (p < 0.01). However, there was no significant difference in the other regions between two groups. At 11 months of age (Figure 5(b)), there was a significant difference in the CSF and hippocampus (p < 0.01 for CSF, p < 0.05 for hippocampus), but no difference in the other regions. Meanwhile, conductivity of CSF in the WT controls was higher at 11 months than that of 9 months, while there was little difference in the other regions. In AD model mice, no significant difference in conductivity was observed in any tissue between two time points.
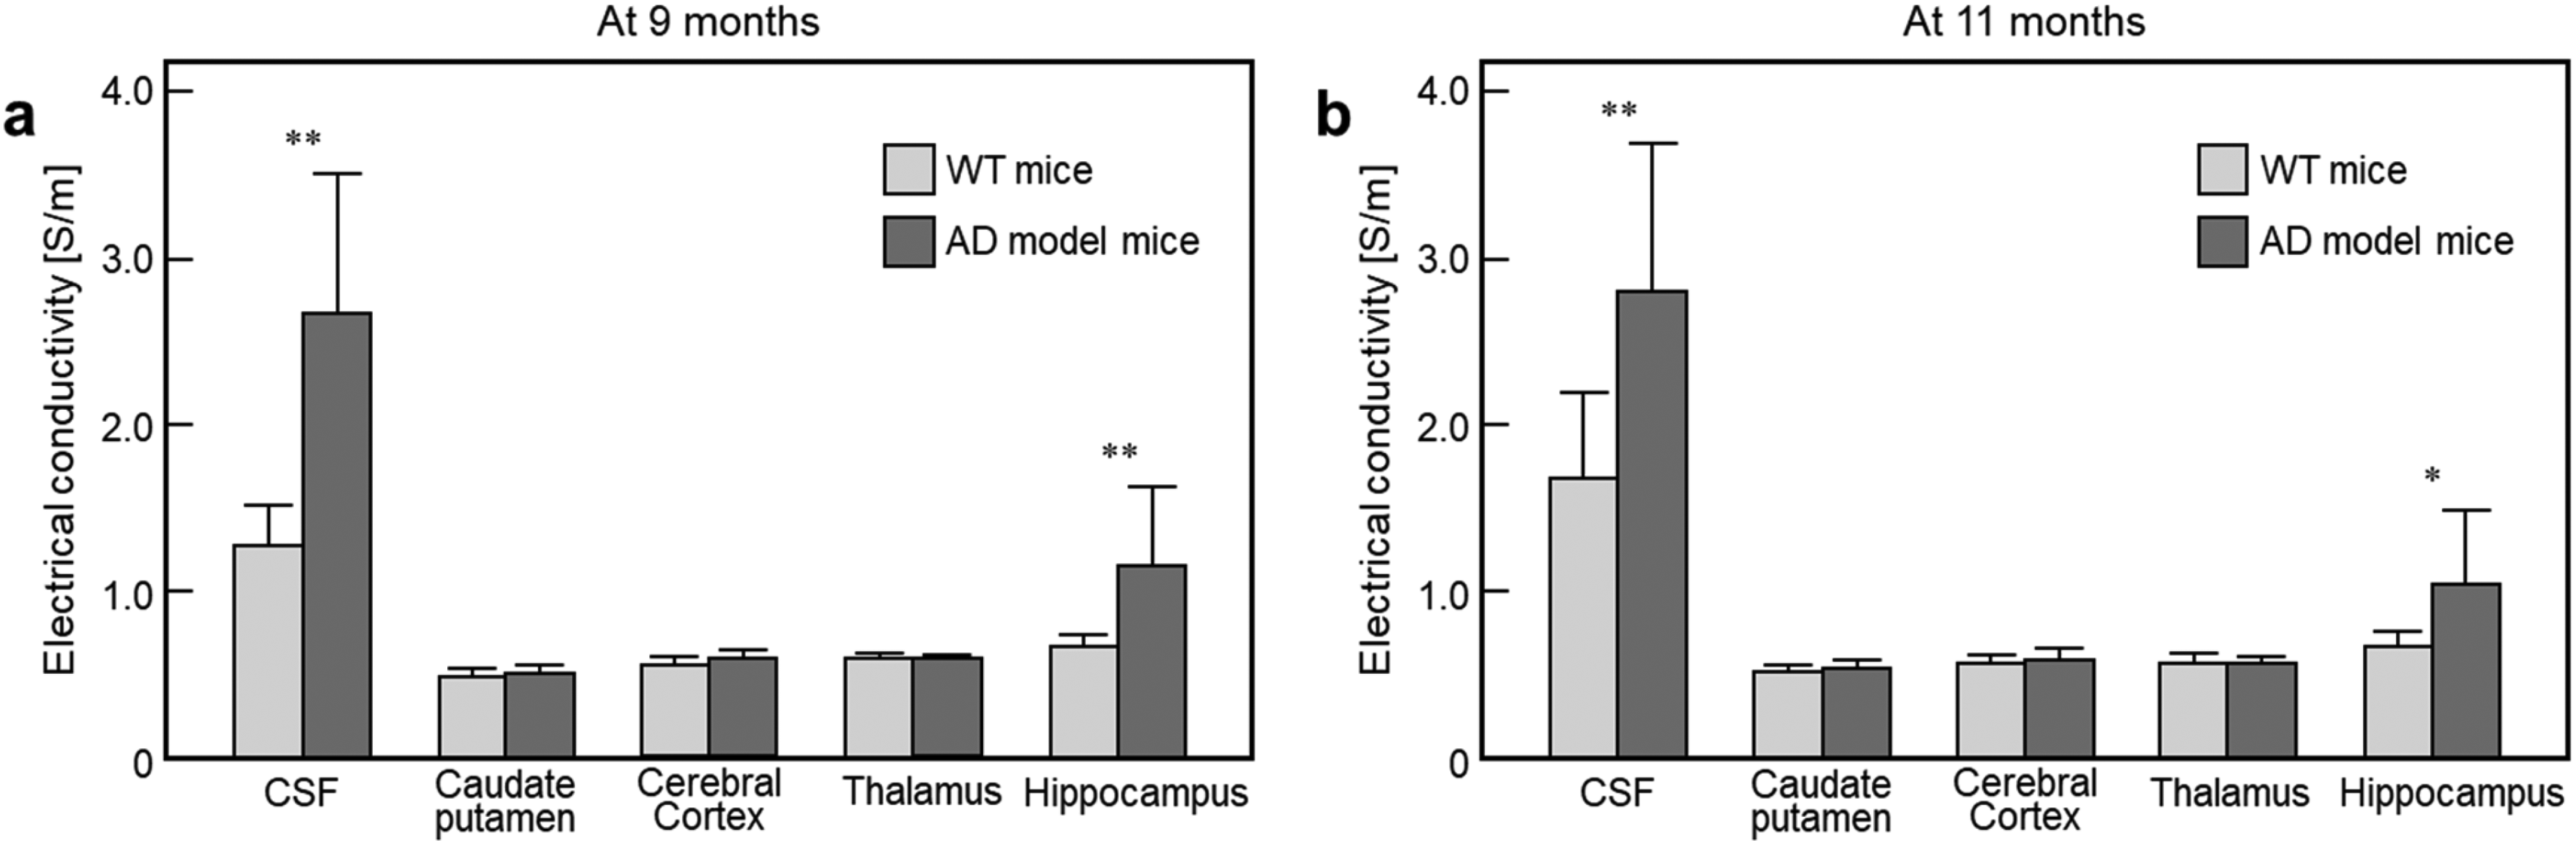
Bar graph showing measured tissue conductivity obtained from the WT and AD model mice at 9 months (a) and 11 months (b) of age. Absolute conductivity values were measured in the ventricles, caudate putamen, cerebral cortex, thalamus and hippocampus. Significances are compared between WT versus AD model (*p < 0.05; **p < 0.01).
Discussion
The status of CSF is related to the metabolic waste clearance function of the glymphatic system, which is known to be a mechanism for AD. 26 Electrical conductivity provides direct contrast information on the concentration, mobility, and microstructure of ions constituting the tissues, allowing for subtle detection of intra- and extracellular fluid conditions.17,18,25 This preliminary study aimed to evaluate the potential of MR-based conductivity imaging as a noninvasive tool for monitoring alterations in ionic homeostasis in both CSF and brain tissue.
The most remarkable finding of this study was the significantly increased conductivity in the CSF of AD model mice, accompanied by ventricular enlargement. The increase in ventricular conductivity in AD mice is likely associated with both CSF volume expansion and altered ionic composition. Previous studies have reported that AD pathology disrupts CSF clearance mechanisms and glymphatic function, leading to abnormal accumulation of metabolites and changes in electrolyte balance.9,10,15 Specifically, electrolyte concentrations in CSF are normally maintained under homeostatic regulation, 27 and AD-related proteins such as amyloid-β and tau do not directly contribute to ionic conductivity. Therefore, these pathological molecules alone are unlikely to account for the increase in ventricular conductivity. Instead, the increase may arise from a combination of factors, including metabolic dysregulation in AD, characterized by impaired glucose utilization and a shift toward anaerobic glycolysis, which has been associated with increased production of lactic acid, an ionizable metabolite capable of elevating conductivity.28,29
Enlargement of the ventricles is a well-defined structural hallmark of AD progression, 19 and these findings support this observation by demonstrating that conductivity mapping can detect functional changes in CSF composition together with volumetric information. Meanwhile, WT mice also showed a ventricular enlargement and increased conductivity over time, which is interpreted as a normal aging process. 30
In the hippocampus, increased conductivity in AD model may reflect a combination of extracellular ionic imbalance, neuroinflammation, and tissue remodeling. The hippocampus is a primary region of amyloid deposition and neuronal loss in 5xFAD mice,22,31 and ionic disturbances associated with neurodegeneration could contribute to the observed changes. Interestingly, a modest increase in hippocampal conductivity was also observed in WT mice at 11 months, which may reflect age-related alterations in tissue composition and fluid balance. This finding aligns with reports from longitudinal cohorts of cognitively normal mid- to late-life adults demonstrating sustained, and sometimes accelerated, atrophy in the hippocampus. 32 In contrast, conductivity in the caudate putamen, cerebral cortex, and thalamus did not differ between groups or across time points. It can be inferred that the microstructural alterations and the degree of amyloid-β and tau protein accumulation in those regions are less pronounced or progress at a slower rate than in the hippocampus. This regional specificity suggests that conductivity changes in AD progression are not global but rather are associated with brain regions closely related to AD pathology. Such findings suggest that conductivity imaging could serve as a sensitive tool for disease-related microenvironmental changes rather than nonspecific aging effects.
Although this imaging experiments were performed using a 9.4 T MRI system to achieve high spatial resolution and signal-to-noise ratio for small-animal imaging, MR-based electrical conductivity imaging has been demonstrated at clinical field strengths.17,21 Previous studies have reported the feasibility of conductivity mapping using clinical MRI scanners at 3 T and 7 T, indicating that this technique can be translated to human imaging.33,34 While the spatial resolution achievable in small-animal imaging is higher than that typically obtained in clinical systems, the contrast mechanism of conductivity imaging, which reflecting ion concentration and mobility, remains applicable across field strengths. Therefore, with appropriate sequence optimization and reconstruction methods, conductivity imaging may have potential as a noninvasive biomarker for assessing CSF dynamics and tissue microenvironment alterations in AD.
Limitations
This study has several limitations. First, the significant increase in ventricular conductivity may reflect combined effects of metabolic alterations such as lactate accumulation, rather than direct influences of AD pathology. In addition, ventricular enlargement in AD mice can reduce partial volume effects relative to WT mice, amplifying apparent conductivity differences. Thus, the observed conductivity elevations likely arise from both biological and methodological factors. Second, only two time points (9 and 11 months) were examined, and thus early-stage or late-stage changes in conductivity could not be fully assessed. Specifically, in this model, amyloid plaque accumulation and associated pathological changes tend to plateau in the later stages of the disease, rather than progressing linearly. The longitudinal studies will be important to determine the initial emergence and progression of conductivity alterations during AD development. Third, the sample size was relatively small (n = 5 per group), which may limit the generalization of the findings. Fourth, comparative analyses with other transgenic AD models or additional brain regions implicated in AD pathology, such as the hypothalamus, or amygdala, were not performed, which may limit the broader interpretation of the observed conductivity alterations. Finally, conductivity changes were not directly validated with biochemical assays of CSF ionic composition or histopathological correlates in the hippocampus.
Conclusion
These results demonstrate that MR-based electrical conductivity imaging is capable of detecting AD-related alterations in CSF and hippocampal microenvironments. This method offers complementary contrast to conventional structural MRI by reflecting ionic properties and fluid–tissue interactions. Future studies with larger cohorts, multimodal validation, and longitudinal designs enable to validate conductivity mapping as a biomarker of disease progression and to clarify its relationship with amyloid and tau pathology.
Footnotes
Acknowledgements
The authors have no acknowledgments to report.
Ethical considerations
Animal care, maintenance, and treatments followed the protocol approved by the Institutional Animal Care and Use Committee (IACUC, No. 2021-0077) of the Korea Institute of Radiological & Medical Sciences (KIRAMS).
Consent to participate
Not applicable
Consent for publication
Not applicable
Author contribution(s)
Funding
The authors disclosed receipt of the following financial support for the research, authorship, and/or publication of this article: This work was supported by the National Research Foundation of Korea (NRF) grants funded by the Korea government (No. RS-2021-NR059059, RS-2025-00521051). This work was also supported by a grant from the Korea Institute of Radiological and Medical Sciences (KIRAMS), funded by MSIT, Republic of Korea (No. 50461-2026).
Declaration of conflicting interests
The authors declared no potential conflicts of interest with respect to the research, authorship, and/or publication of this article.
Data availability statement
The original contributions presented in the study are included in the article, further inquiries can be directed to the corresponding authors.