
Abstract
Background
Changes in sleep characteristics are critical in the course of Alzheimer's disease (AD).
Objective
We aimed to explore the relationship between sleep duration and tau pathology progression in patients with AD and mild cognitive impairment (MCI).
Methods
This cross-sectional study included 172 patients (70 with MCI and 102 with AD). Sleep duration and disturbances were assessed through standardized questionnaires, while tau deposition and cerebrospinal fluid clearance were evaluated using tau-PET and diffusion tensor image analysis along the perivascular space (DTI-ALPS), along with comprehensive cognitive assessments. The data were adjusted for variables such as demographic factors, clinical symptoms, and medications.
Results
Sleep duration showed a positive association with tau deposition in the MCI stage (total sleep: β = 0.18, p = 0.014; nighttime sleep: β = 0.20, p = 0.007) but negatively associated in the AD stage (total sleep: β = −0.18, p = 0.039; nighttime sleep: β = −0.20, p = 0.039). Patients with sleep disturbances demonstrated lower tau burdens (group difference = 0.62, p = 0.005). Mediation analysis revealed a significant indirect effect of depression in the sleep-tau relationship (total sleep: β = −0.26, p = 0.040; nighttime sleep: β = −0.24, p = 0.040).
Conclusions
This study first revealed the stage-dependent characteristics of sleep-tau relationships, highlighting the MCI stage as a critical research focus.
Clinical Trial
The study was registered with ClinicalTrials.gov (NCT05623124). URL: https://clinicaltrials.gov/study/NCT05623124.
Introduction
The global aging population poses a considerable challenge to contemporary society. As the population structure changes, age-induced cognitive impairment has become a serious public health issue, particularly in China. By 2050, over 45 million individuals in China are expected to have dementia, driving the total costs of AD in China up to $1.89 trillion.1,2 The ATN framework is a recognized biomarker classification system that identifies amyloid-β (Aβ) deposition, tau hyperphosphorylation, and neurodegeneration as the key pathological drivers of AD progression. 3 In recent years, with advances in tau-positron emission tomography (PET) imaging, there has been an increased interest in the association between tau proteins and cognitive decline, emphasizing their importance in AD. 4 Tau-PET standardized uptake value ratio (SUVR) has shown stronger links to gray matter atrophy and cognitive decline than conventional biomarkers, making it a reliable predictor of Mini-Mental State Examination (MMSE) score deterioration.5–7 Regional tau accumulation patterns are associated with specific clinical manifestations. For instance, temporoparietal deposits are linked to language deficits, while occipital involvements are correlated with visuospatial impairment.8,9 In addition, p-tau217 shows a stronger correlation with amyloid-PET and can be an effective predictive tool for AD.10,11
Sleep is important for maintaining brain health through eradicating harmful metabolites from the brain. 12 Recent evidence indicates that the impact of sleep duration on cognitive function is complex and nuanced, especially in individuals with AD. Previous studies have found that nighttime sleep duration has a U-shaped relationship with AD biomarkers, and both insufficient and excessive sleep are linked to higher levels of Aβ deposition and tau protein deposition. A sleep duration of 6.0 to 6.5 h appears to be optimal, correlating with better brain health indicators and cognitive performance.13,14 Sleep disturbances, such as reduced sleep efficiency and prolonged sleep latency, are associated with lower cognitive performance and higher burden of AD biomarkers. 15 The underlying mechanisms include several pathways: the removal of metabolic waste by the glymphatic system during slow-wave sleep, synaptic homeostasis and memory consolidation processes mediated by sleep spindles, and circadian rhythm regulation of neurohormones.16–18
However, the relationship between sleep characteristics and AD biomarkers remains controversial due to several gaps in our current understanding. Firstly, evidence from existing studies reveals that nighttime sleep duration has a U-shaped relationship with the cerebrospinal fluid (CSF) Aβ, 13 but there is no agreement on the ideal sleep duration.19,20 Although associations between short sleep duration and brain atrophy have been identified in cross-sectional studies, longitudinal studies have not confirmed a direct causal relationship. 14 Secondly, most research has focused on Aβ, with limited studies dedicated to tau deposition, though its role remains debated.21,22 Finally, there is a severe lack of data specific to the Chinese demographic, which questions the effectiveness of sleep intervention strategies in the region.
This cross-sectional study investigated the relationships between total sleep duration, nighttime sleep duration, global cortical tau deposition, and cognitive test scores in patients with cognitive impairments. By integrating PET tau imaging with cognitive assessments, we aimed to explain the mechanisms linking sleep and cognition while providing evidence for effective sleep management in cognitive protection.
Methods
Data sources
This study is a cross-sectional analysis of baseline data from our longitudinal cohort: RJNeuroBank-Dementia (The RJNB-D Study: NCT05623124). It contains several different measures, including multi-shell diffusion magnetic resonance imaging (NODDI), 18F-MK6240-PET, 18F-Florbetapir-PET (FBP-PET), and cognitive assessments. The final cohort used in this study comprised 172 patients, after excluding the 112 who either did not undergo Aβ PET scanning or had negative results in their scans. AD and mild cognitive impairment (MCI) diagnoses were determined according to the National Institute on Aging–Alzheimer's Association (NIA-AA, 2011) core clinical criteria. Briefly, MCI was defined by: (1) concern about cognitive change, (2) objective impairment in ≥1 cognitive domain (typically memory), (3) preserved independence in functional abilities, and (4) absence of dementia. AD dementia was defined by progressive cognitive impairment sufficient to interfere with daily function. All diagnoses incorporated supportive biomarker evidence where available, as stipulated by the NIA-AA framework. 23 Dementia severity was assessed with the MMSE and Clinical Dementia Rating Sum of Boxes (CDR-SB). These scores and the prevalence of key comorbidities such as diabetes are presented in Table 1. This study received approval from the Ruijin Hospital Ethics Committee, Shanghai Jiao Tong University School of Medicine, China. Written informed consent was obtained from participants with decision-making capacity, or from legally authorized representatives for those without capacity, in accordance with the Declaration of Helsinki. When sleep questionnaire data were provided by caregivers, their involvement was covered under the consent. The study was registered on ClinicalTrials.gov (NCT05623124).
Demographic and neuropsychological testing data for participants.
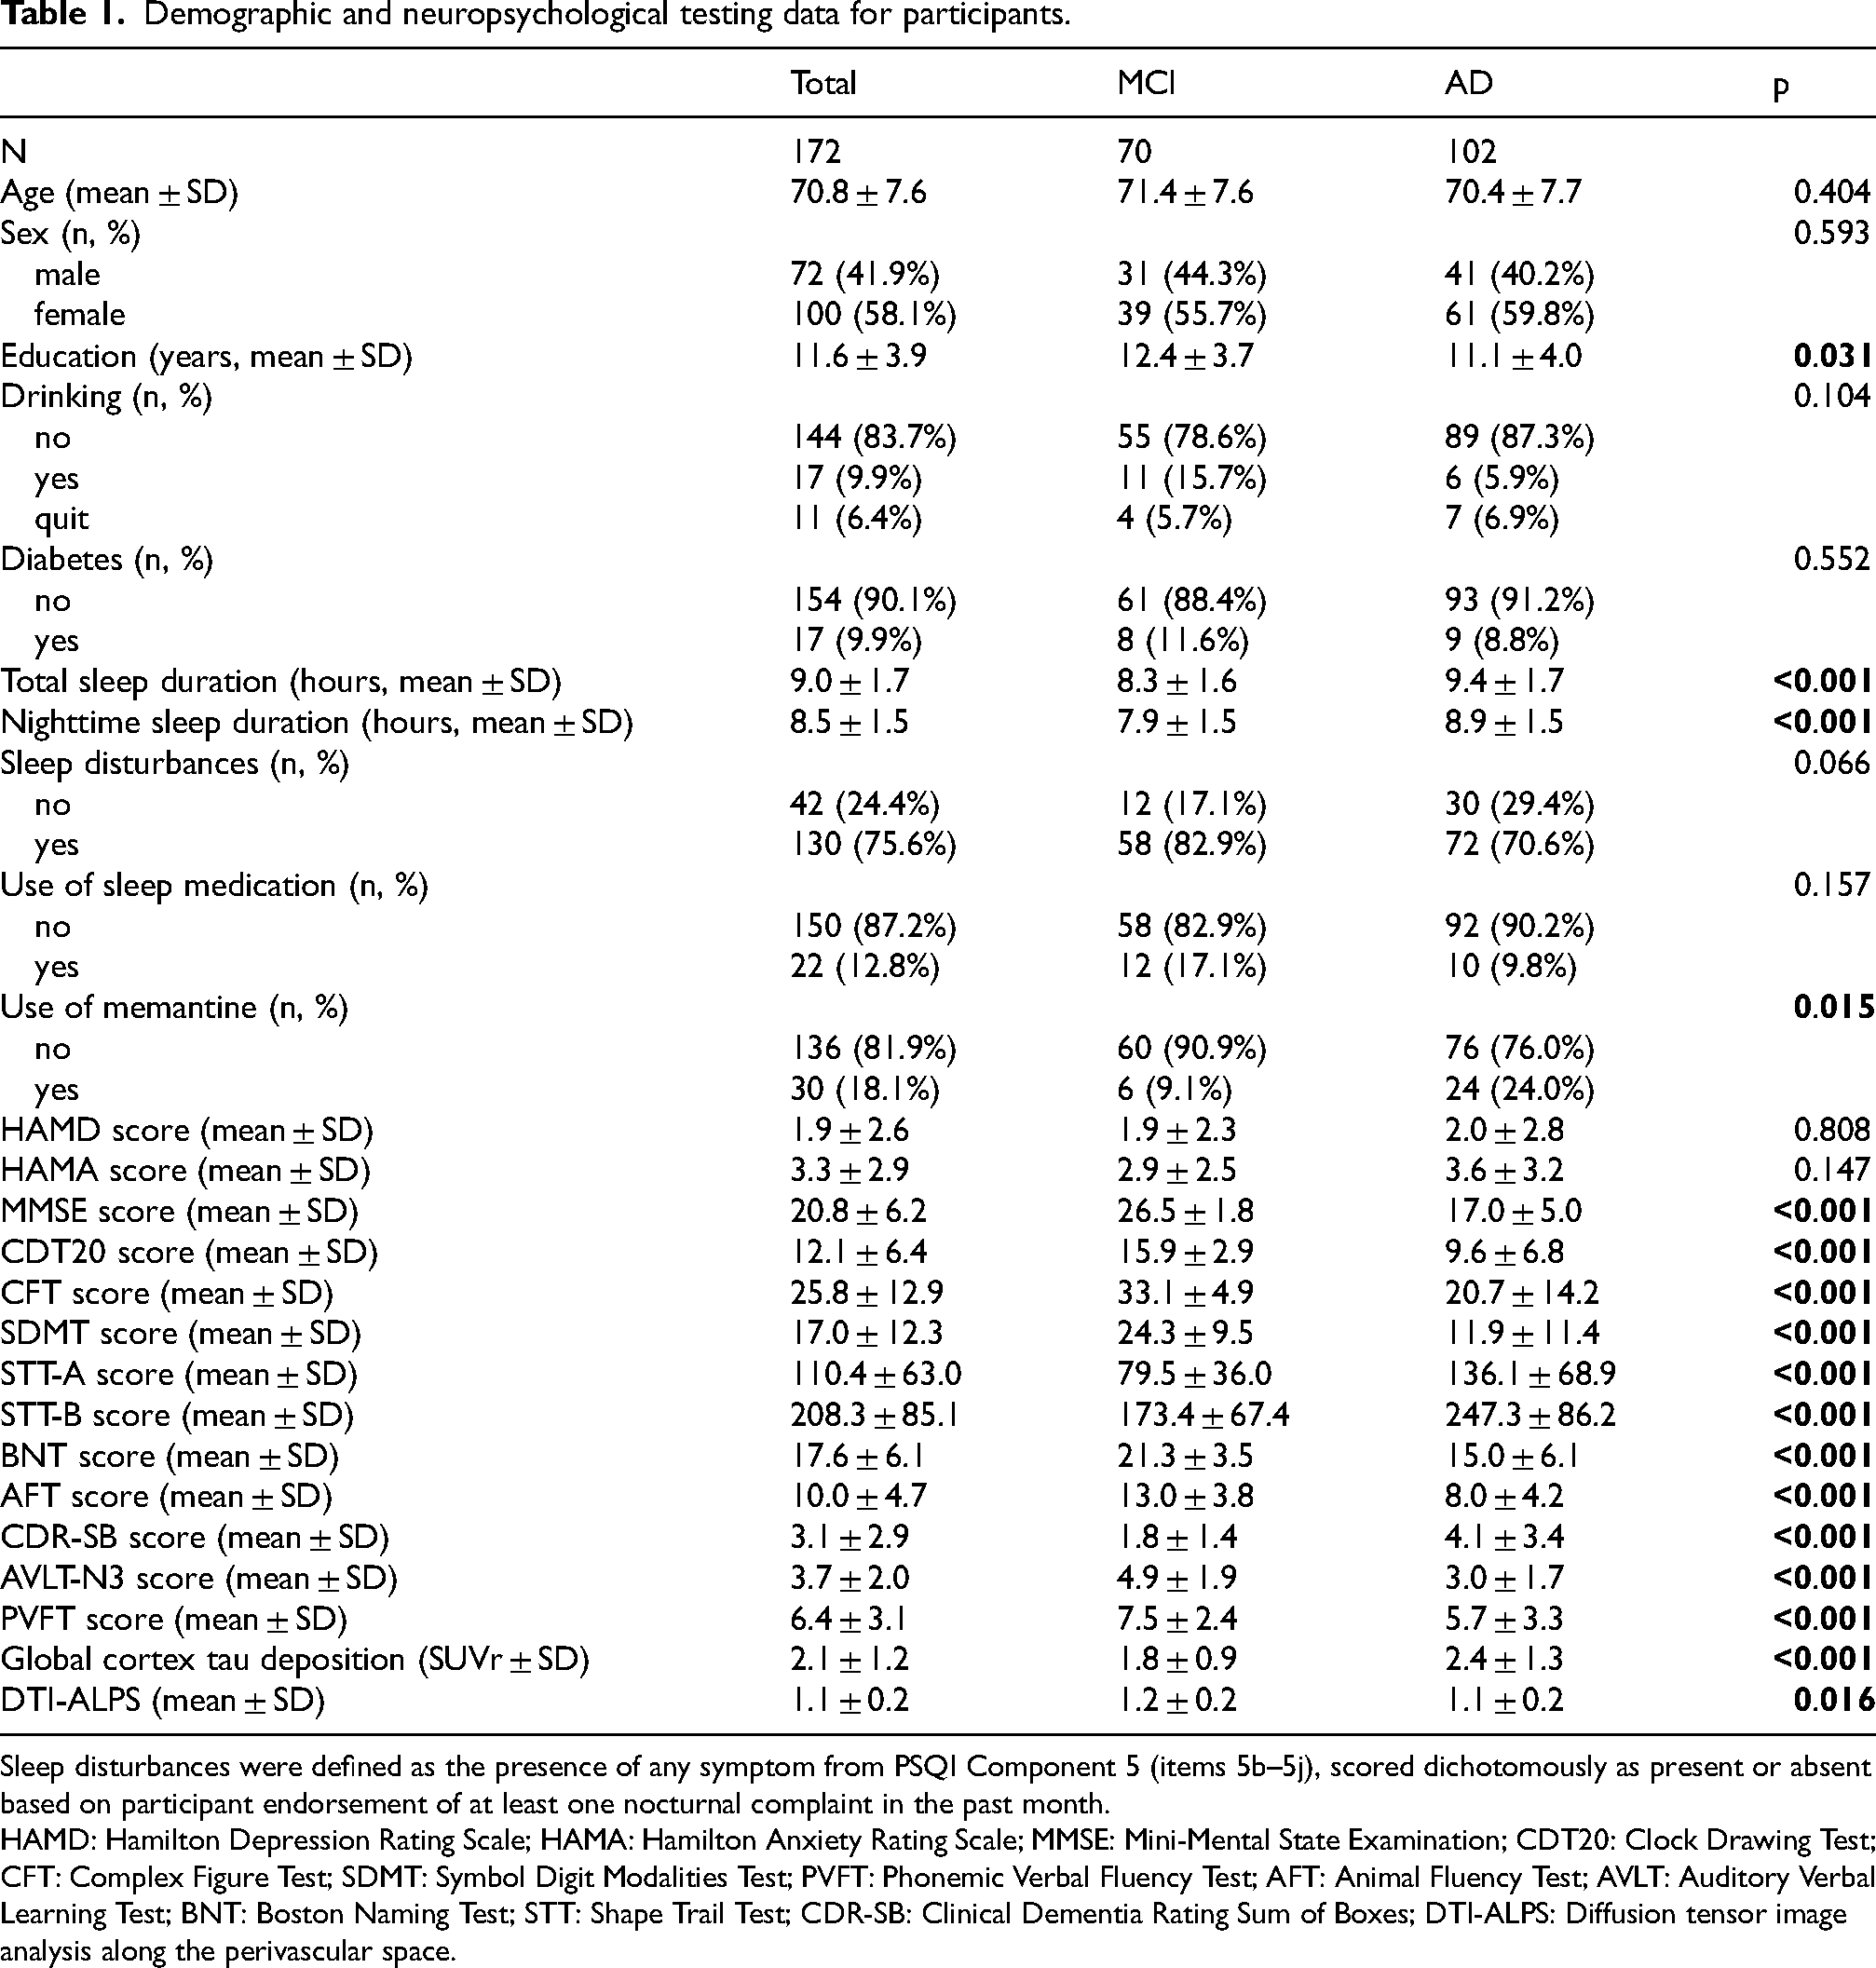
Sleep disturbances were defined as the presence of any symptom from PSQI Component 5 (items 5b–5j), scored dichotomously as present or absent based on participant endorsement of at least one nocturnal complaint in the past month.
HAMD: Hamilton Depression Rating Scale; HAMA: Hamilton Anxiety Rating Scale; MMSE: Mini-Mental State Examination; CDT20: Clock Drawing Test; CFT: Complex Figure Test; SDMT: Symbol Digit Modalities Test; PVFT: Phonemic Verbal Fluency Test; AFT: Animal Fluency Test; AVLT: Auditory Verbal Learning Test; BNT: Boston Naming Test; STT: Shape Trail Test; CDR-SB: Clinical Dementia Rating Sum of Boxes; DTI-ALPS: Diffusion tensor image analysis along the perivascular space.
Outcome
The primary outcome was global cortical tau deposition, quantified as standardized uptake value ratio from 18F-MK6240 PET. Secondary cognitive outcomes included the MMSE, 24 CDR-SB, Clock Drawing Test (CDT20), Complex Figure Test (CFT), Auditory Verbal Learning Test (AVLT), Shape Trail Test (STT), Symbol Digit Modalities Test (SDMT), Boston Naming Test (BNT), Phonemic Verbal Fluency Test (PVFT), and Animal Fluency Test (AFT). The diffusion tensor image analysis along the perivascular space (DTI-ALPS) index (derived from diffusion MRI) was analyzed as a separate exploratory measure of glymphatic function.
Exposure
Sleep-related information was collected through standard questionnaires completed by patients themselves. For patients with significant cognitive impairment who were unable to respond reliably, responses were obtained from caregivers. Sleep habits were assessed over the preceding month. Nighttime sleep duration was calculated from self-reported sleep onset time to morning wake time, which represented the actual sleep time during the night. Items regarding sleep disturbances (including waking during the night, early waking, nightmares, pain, discomfort, breathing difficulties, coughing or loud snoring, temperature fluctuations, nocturia, or other factors) were adapted from the Pittsburgh Sleep Quality Index (PSQI) and recorded as present or absent. Total sleep duration included nighttime sleep and daytime naps, both recorded in hours.
Covariates
Unlike the primary exposure and outcome, covariates are potential confounders that were adjusted for in the statistical models to reduce bias and isolate the independent effect of sleep on tau pathology and cognition. Covariates were selected a priori based on prior literature, clinical judgment, and a change-in-estimate criterion of >10% for the exposure coefficient. Continuous covariates included age, years of education, Hamilton Depression Rating Scale (HAMD) score, and Hamilton Anxiety Rating Scale (HAMA) score; categorical covariates were sex, sleep medication use, alcohol drinking, diabetes, and memantine use.
Diffusion MRI acquisition and processing
MRI scans were acquired using a 3 T uMR 890 scanner (United Imaging Healthcare: https://www.united-imaging.com/zh-cn/product-service/products/mr/umr-890). The imaging protocol included multi-shell diffusion-weighted imaging (DWI), three-dimensional (3D) T1-weighted images, and 3D FLAIR images. All images were acquired with a dedicated 64-channel head coil.
The DTI-ALPS index was used to assess perivascular water movement along the medullary veins near lateral ventricles, which indicated the brain glymphatic system's efficiency in draining fluid from subcortical areas to the ventricles. DTI pre-processing was performed using the FMRIB Software Library (FSL; version 6.0.5.1; available at https://fsl.fmrib.ox.ac.uk/) and MRtrix3 (https://www.mrtrix. org). Before subsequent analysis, all DWI data were preprocessed using MRtrix3: denoised (dwidenoise), Gibbs ringing removal (mrdegibbs), and eddy current, motion, and susceptibility distortion corrections (dwifslpreproc with FSL eddy), followed by bias field correction (dwibiascorrect ants). Diffusion tensors were fitted with FSL (dtifit) to obtain the tensor volumes, generating FA maps. To enable standard-space analyses, each FA image was linearly registered with a six degrees of freedom rigid transformation to the FMRIB58_FA_1 mm template (flirt), and the transformation matrix was applied to the tensor volumes (vecreg) to obtain reoriented tensors. direction-encoded color FA maps were created using MRtrix3 (mrconvert and tensor2metric). Finally, tensor volumes were converted to 3D tensor images and color maps for region of interest (ROI) drawing in ITK-SNAP (ImageMath). Four 5 mm spherical ROIs were manually placed on each subject's own reoriented color-coded maps using ITK-SNAP (www.itksnap.org). ROIs were located bilaterally in projection and association fiber regions adjacent to medullary veins at the level of the lateral ventricle body. The DTI-ALPS index = mean (Dx-proj, Dx-assoc)/mean (Dy-proj, Dz-assoc), with a global index derived from both hemispheres’ ALPS indices, where Dx-proj and Dx-assoc are the x-axis diffusivities in projection and association fibers, and Dy-proj and Dz-assoc are the y-axis (projection) and z-axis (association) diffusivities, respectively. Visual inspection of all transformations was performed, with manual corrections to confirm ROI placement accuracy. Participants with poor image quality or incorrect ROI placement were excluded.25–27
PET data acquisition and processing
Static PET imaging for both Aβ and tau was performed using a 3 T whole-body PET/MR scanner (uPMR 790, United Imaging, China). For Aβ imaging, participants received intravenous injections of 18F-florbetapir (AV45) at a mean dose of 3.7 MBq/kg, followed by a sinogram mode 50-min scan. Tau imaging was accomplished through static 18F-MK-6240 PET scanning.
PET data processing was conducted using the PETSurfer toolbox in FreeSurfer 7.1.1 (https://surfer.nmr.mgh.harvard.edu), with the cerebellum cortex serving as the reference region, to derive cortical SUVRs. 28 First, high-resolution cortical and subcortical segmentations were obtained from the structural T1-weighted MR images to facilitate subsequent partial volume correction. The averaged PET images were rigidly co-registered to the corresponding anatomical T1 images, and all registrations were visually inspected for quality assurance. To address partial volume effects arising from atrophy, we applied the extended Müller–Gärtner partial volume correction (PVC) method. 29 Surface-based maps of Aβ and tau were smoothed on a two-dimensional surface using a Gaussian kernel with a full width at half maximum (FWHM) of 5 mm. These smoothed surface maps served as the basis for vertex-wise comparisons and extraction of mean cortical SUVRs for subsequent analyses.
Statistical analysis
R software (version 4.2.0) was used for statistical analyses. Continuous variables were defined as mean ± standard deviation, and categorical variables as numbers with percentages. Group comparisons used t-tests and chi-square tests, with statistical significance set to p < 0.05 (two-tailed). For global cortical tau deposition analysis, values exceeding the mean ± 3 SD were excluded from analysis, and incomplete questionnaires were treated as missing data. All analyses were conducted using available-case data; the amount and distribution of missing data for key variables are summarized in Supplemental Table 1.
Initial exploratory analyses using Generalized Additive Models (GAM) were conducted to flexibly assess the functional form of the relationship between sleep duration and tau deposition without imposing linearity assumptions. Within each diagnostic subgroup, the estimated smooth functions suggested approximately linear trends (see Supplemental Figure 2 and Supplemental Table 12 for details); therefore, linear regression assuming a Gaussian distribution and identity link function was subsequently adopted for parsimony and interpretability, with univariable and multivariable models fitted and adjusted β coefficients along with 95% confidence intervals (CI) reported. To evaluate potential collinearity among covariates, variance inflation factors (VIFs) were calculated for all variables in the adjusted models. All VIF values were below 3.1, with the maximum VIF for HAMD and HAMA scores being 2.8, confirming that multicollinearity did not materially affect model estimation. Tau deposition values were processed to exclude outliers (defined as values exceeding the mean ± 3 SD). A sensitivity analysis retaining the outliers was performed for the fully adjusted model (Supplemental Table 10). To assess potential unmeasured confounding, we performed a negative control outcome analysis using height as the outcome, given that adult height cannot be plausibly influenced by sleep duration (Supplemental Table 11).
For sleep disturbance analyses, differences between groups were calculated with 95% confidence intervals (CIs) in the total population, as well as in the MCI and AD subgroups. Normality of the data within each group was formally assessed using the Shapiro-Wilk normality test. Homogeneity of variances was evaluated using the Bartlett test of homogeneity of variances. For normally distributed variables with equal variances, two-sided independent t-tests were used (difference in means); for approximately normal variables with unequal variances, Welch's t-tests were used; and for skewed distributions with unequal variances, Wilcoxon rank-sum tests were used (difference in medians).
To investigate the relationship between sleep duration and cognition, correlation scatterplots were generated with reported correlation coefficients and p values using Pearson's method. Their associations were further analyzed using stratified multiple regression models, progressively adjusted for demographics, clinical symptoms, and comorbidities.
In MCI patients, mediation analyses were conducted to examine the mediating role of depression between tau and sleep duration using the “mediation” package in R. Total, direct, and indirect effects were reported along with mediation proportions.
This study is reported in accordance with the Strengthening the Reporting of Observational Studies in Epidemiology (STROBE) guidelines for cross-sectional studies. 30
Results
Demographics
A total of 172 participants participated in the study, including 70 MCI patients and 102 AD patients (Figure 1). After excluding those with missing tau PET data (9 MCI; 15 AD), missing sleep duration (5 AD), 1 AD participant with implausibly long total sleep (15 h) excluded from primary analyses only (retained in supplementary analyses), and a tau outlier exceeding mean ±3 SD (2 AD), the final analytic sample consisted of 61 MCI and 79 AD participants. There were no significant differences between the two groups in age (MCI: 71.4 ± 7.6 years; AD: 70.4 ± 7.7 years; p = 0.404) and sex (male proportion: MCI 44.3% versus AD 40.2%; p = 0.593). However, MCI patients had significantly higher education levels compared to AD patients (12.4 ± 3.7 versus 11.1 ± 4.0 years; p = 0.031) (Table 1).
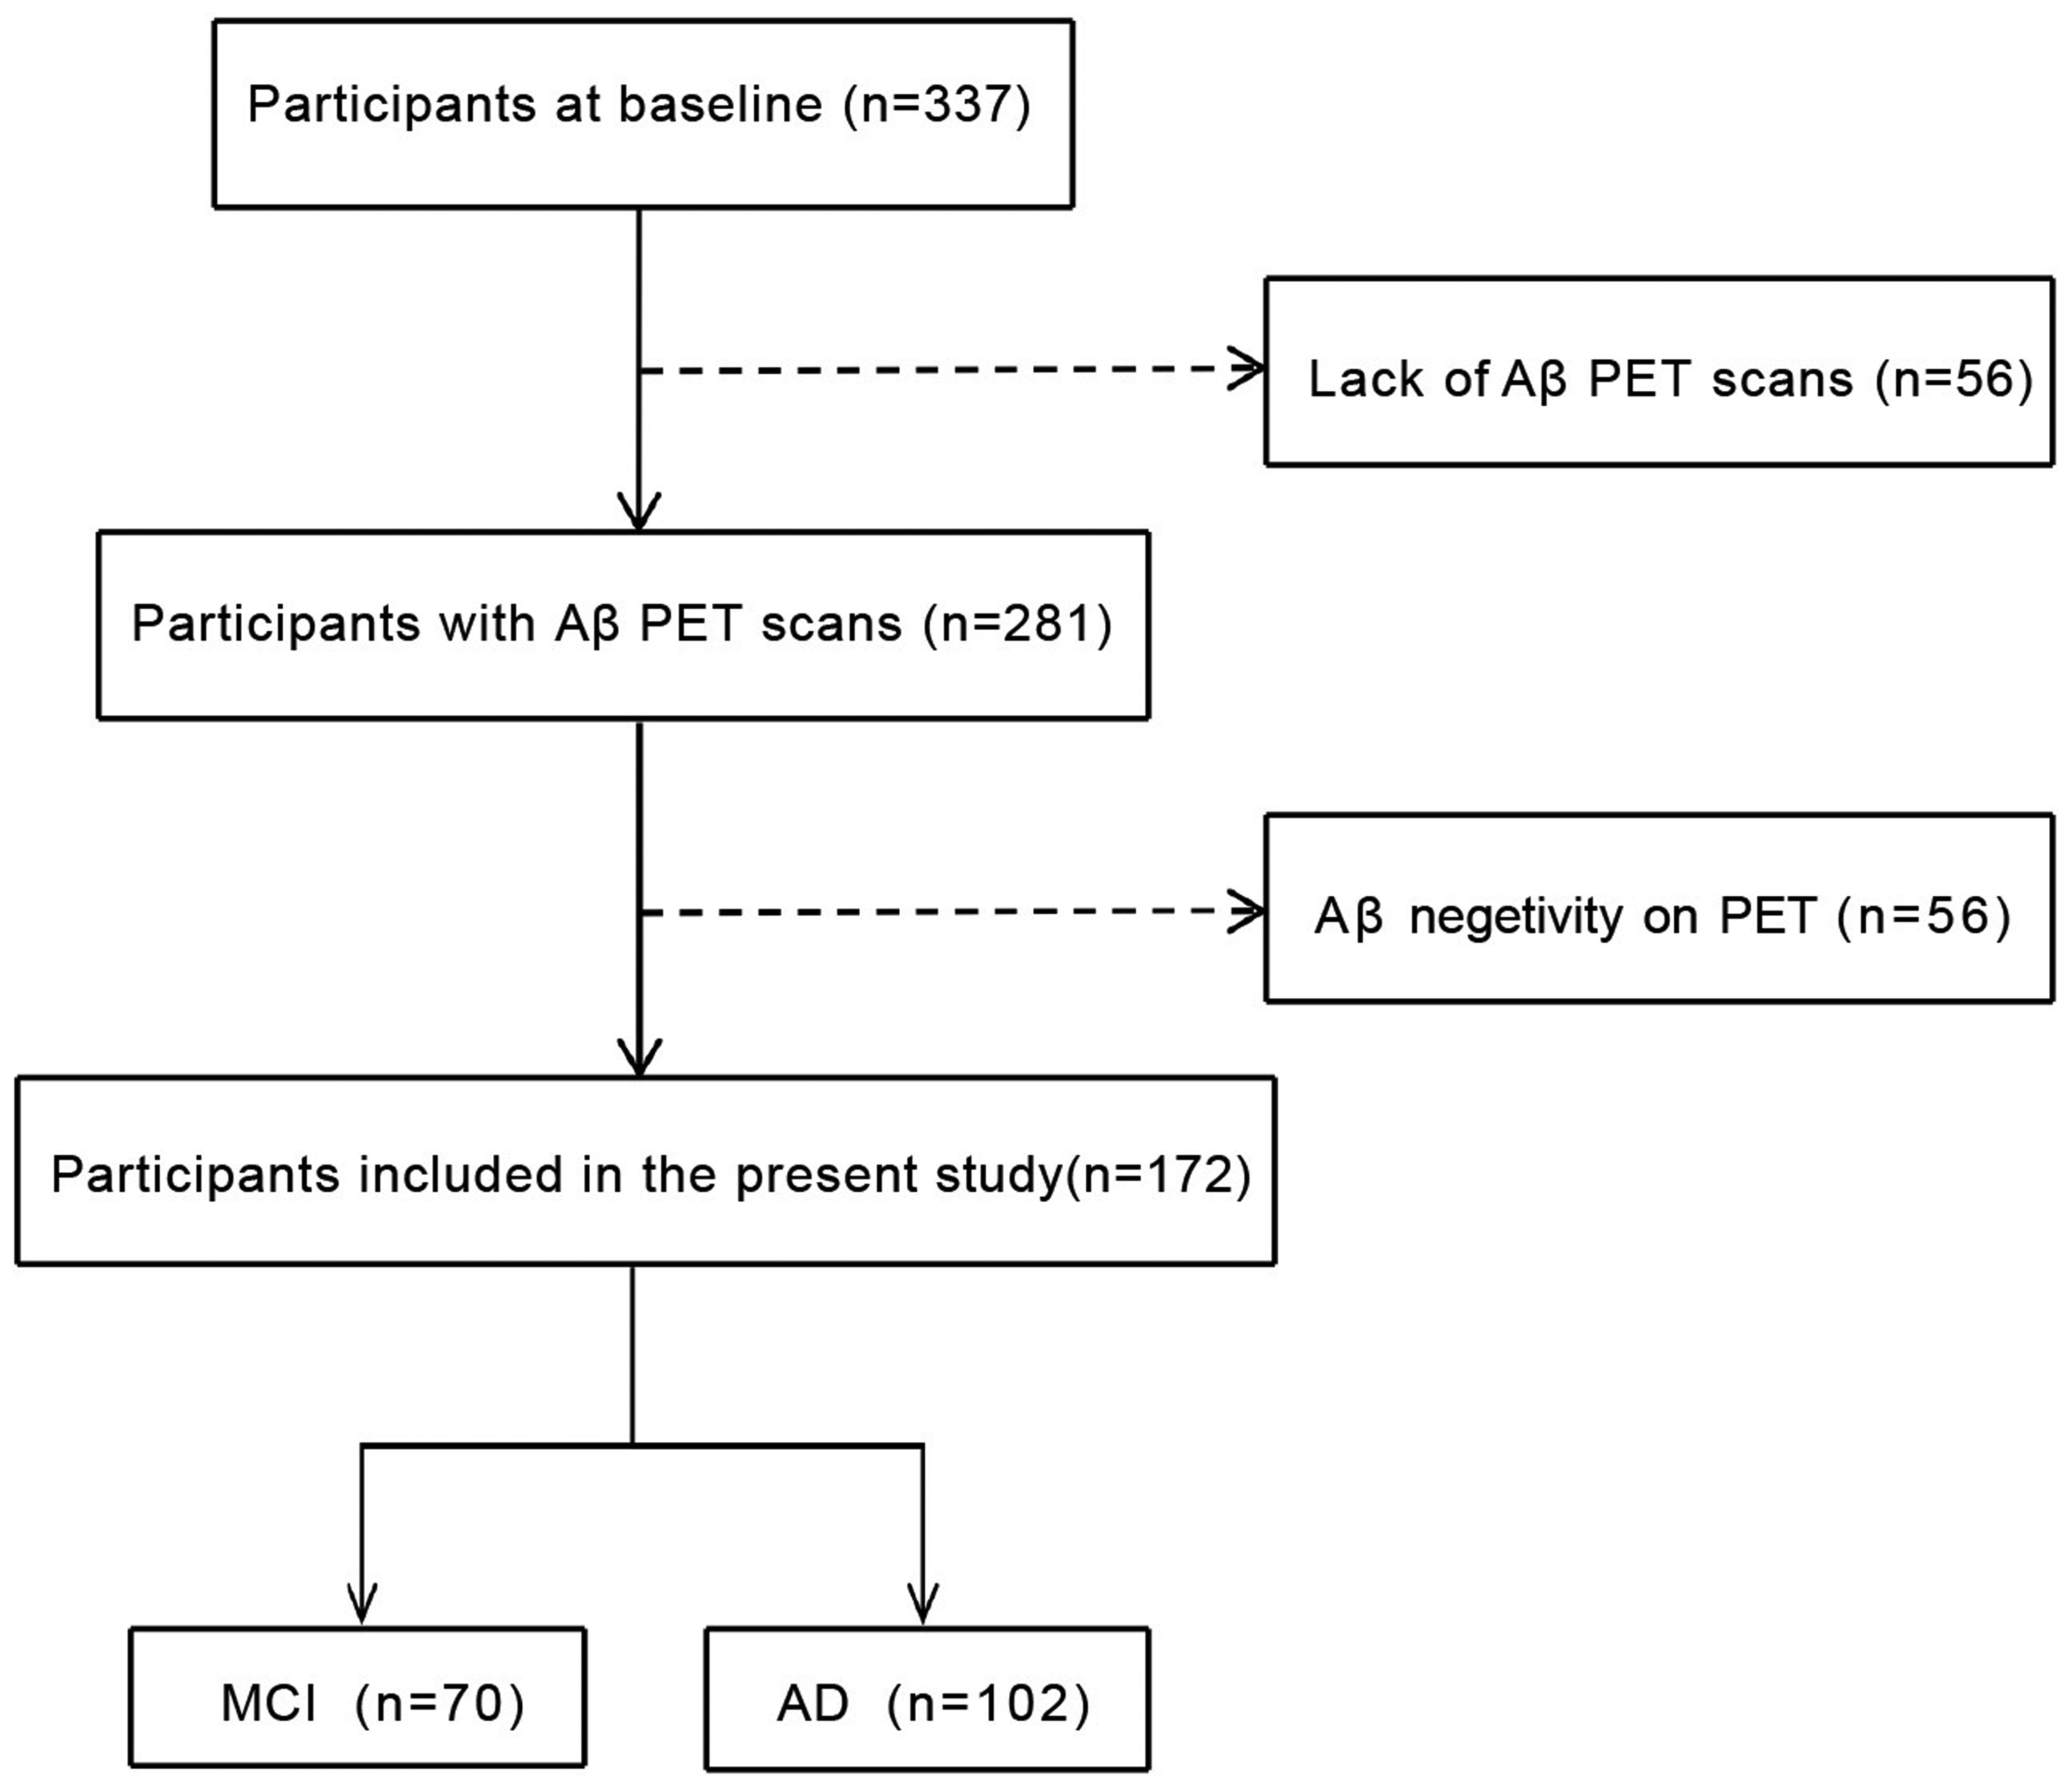
Flow chart of the present study.
Cognitive assessments revealed significantly better performances for the MCI group across all measured domains (all p < 0.001). Emotional assessments (HAMD, HAMA) were also conducted yielding no significant difference (p > 0.05). For neuroimaging markers, AD patients showed markedly higher global cortical tau deposition compared to the MCI group (2.4 ± 1.3 versus 1.8 ± 0.9 SUVr; p < 0.001), while MCI patients demonstrated slightly higher DTI-ALPS values than the AD group (1.2 ± 0.2 versus 1.1 ± 0.2; p = 0.016).
Regarding sleep patterns, AD patients demonstrated significantly longer total sleep duration (9.4 ± 1.7 versus 8.3 ± 1.6 h; p < 0.001) and nighttime sleep duration (8.9 ± 1.5 versus 7.9 ± 1.5 h; p < 0.001) than the MCI patients. Sleep disturbances were common in both groups (82.9% in MCI versus 70.6% in AD, p = 0.066). Though the two groups generally had similar usage of sleep medication (17.1% in MCI versus 9.8% in AD, p = 0.157), memantine use was significantly higher in the AD group (9.1% in MCI versus 24.0% in AD; p = 0.015) (Table 1).
Stage-specific association between sleep duration and tau pathological progression
In this study, we explored the association patterns between sleep duration and global cortical tau deposition by using GLM. In the MCI group (n = 61), both total sleep duration (β = 0.18, p = 0.014) and nighttime sleep duration (β = 0.20, p = 0.007) showed significant positive associations with global cortical tau deposition. In contrast, the AD group (n = 79) exhibited significant negative correlations between total sleep duration (β = −0.18, p = 0.039) and nighttime sleep duration (β = −0.20, p = 0.039) with tau deposition (Figure 2).
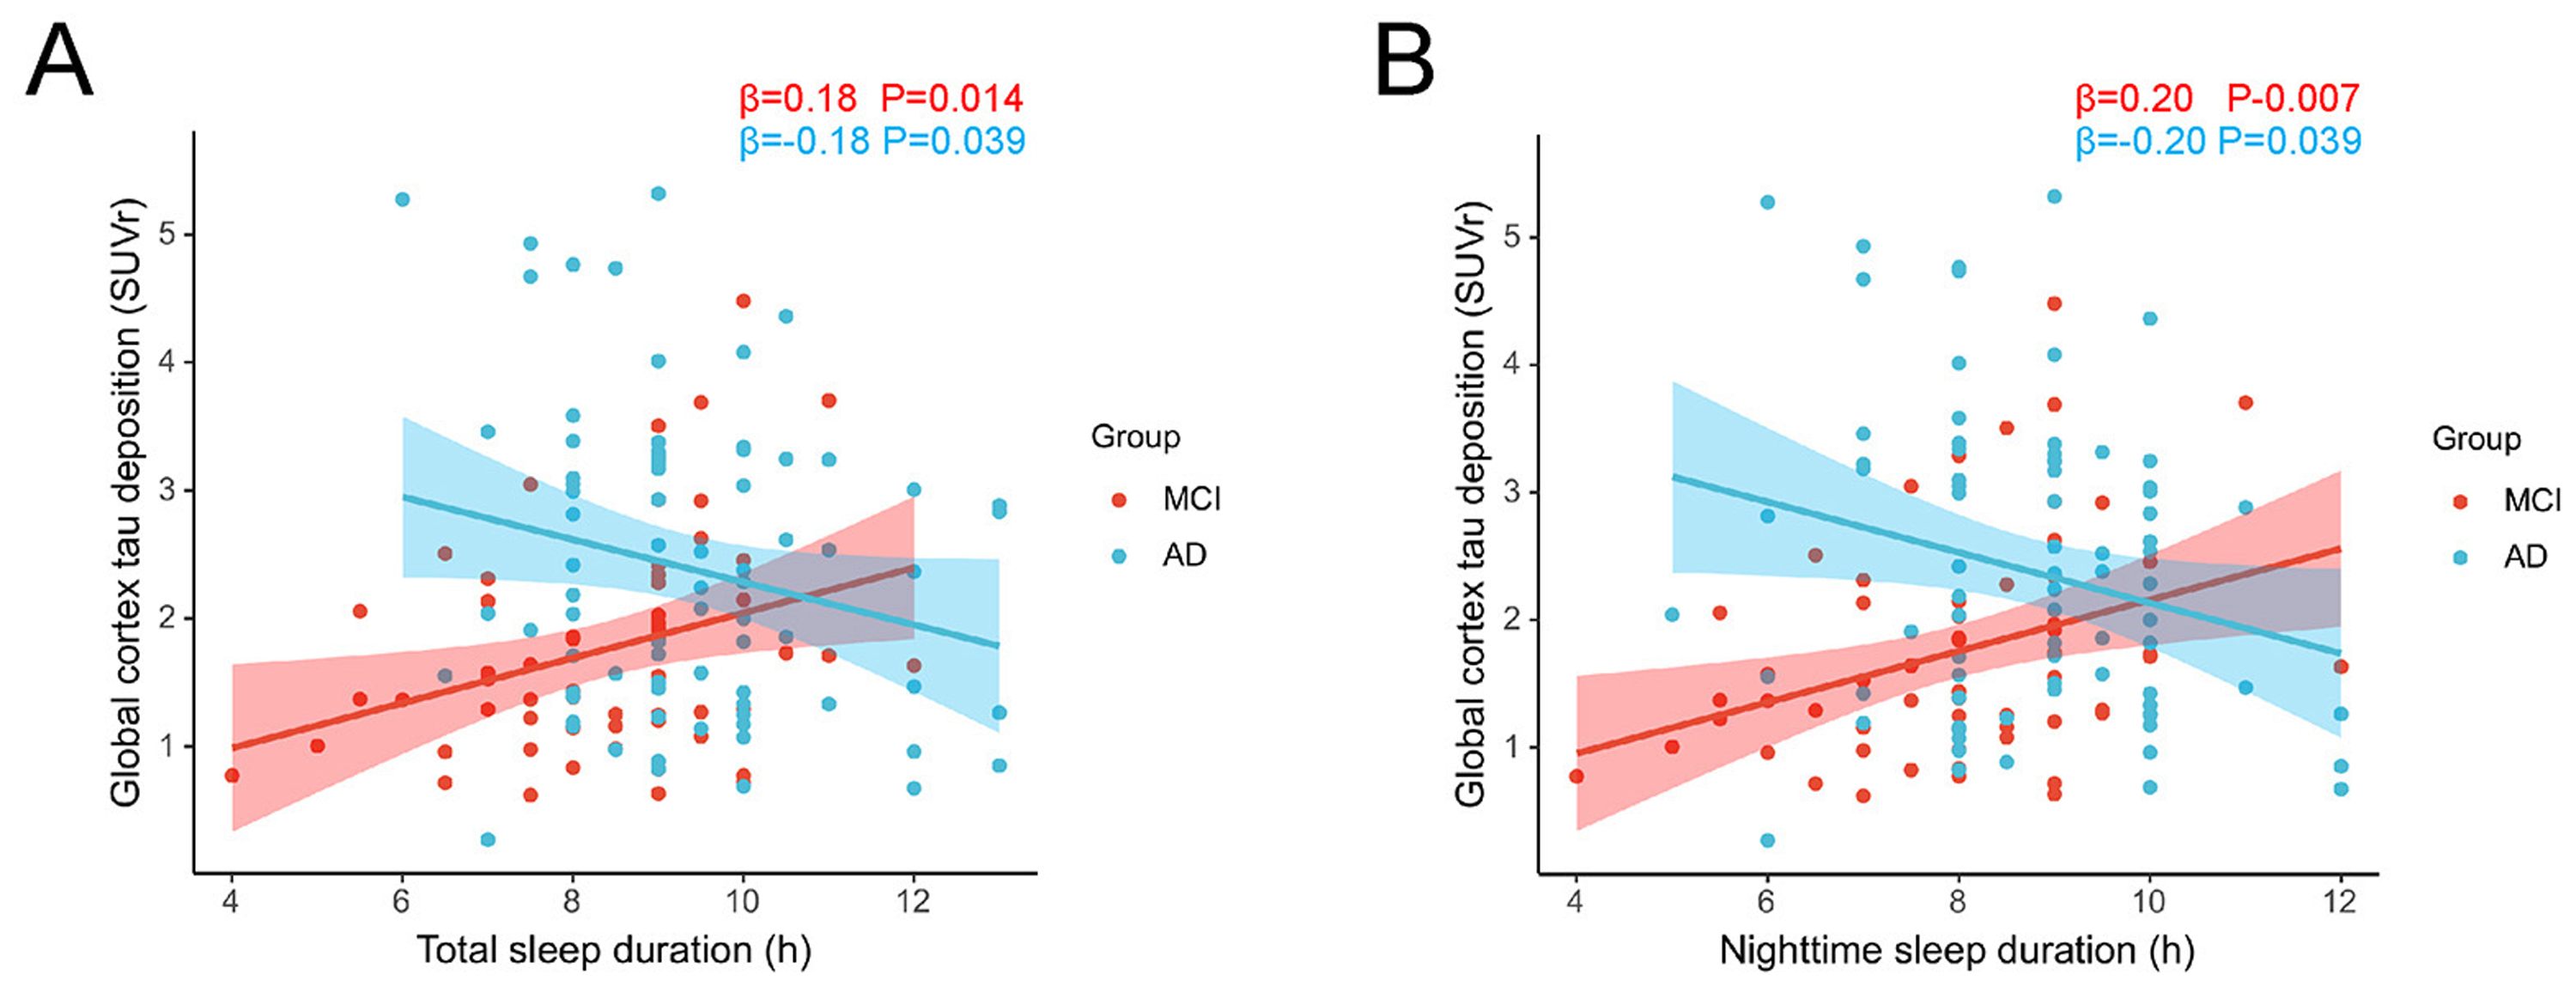
Stage-specific associations between sleep duration and tau pathology in MCI (n = 61, red line) and AD (n = 79, blue line) patients. (A) Association between total sleep duration and global cortical tau deposition in MCI and AD patients. (B) Association between nighttime sleep duration and global cortical tau deposition in MCI and AD patients. Lines represent the fitted relationships derived from linear regression model and the shaded area represents the 95% confidence interval. The x-axis represents sleep duration in hours, and the y-axis shows the global cortical tau deposition measured by 18F-MK6240 PET SUVR. Tau deposition values were processed to exclude outliers (defined as values exceeding mean ± 3 SD). Estimates and p-values for each group are displayed. MCI: mild cognitive impairment; AD: Alzheimer's disease; SUVR: standardized uptake value ratio (Color figure available online).
Further multivariate analyses revealed distinct stage-specific associations between sleep duration and tau pathology. In the fully adjusted model (controlling for age, sex, education, HAMD score, HAMA score, sleep medication, drinking, diabetes, and memantine), MCI patients demonstrated strong positive associations between tau deposition and both total sleep duration (β = 0.26, 95% CI: 0.13–0.40, p < 0.001) as well as nighttime sleep duration (β = 0.26, 95% CI: 0.12–0.40, p < 0.001). These associations remained consistent across all adjustment models and strengthened after controlling for potential confounding variables. In terms of clinical relevance, these effect sizes indicate that in the MCI stage, each additional hour of total or nighttime sleep is associated with an approximately 0.26 increase in global cortical tau SUVR. Relative to the mean tau burden in the MCI group (1.8 SUVr), this corresponds to roughly a 14% higher tau deposition per hour of sleep. In contrast, AD patients exhibited marginal negative correlation trends that did not reach statistical significance (total sleep: β = −0.14, 95% CI: −0.30–0.01, p = 0.078; nighttime sleep: β = −0.17, 95% CI: −0.35–0.01, p = 0.075) (Table 2). In a sensitivity analysis additionally adjusting for sleep disturbances and APOE ε4 carrier status, results remained consistent (Supplemental Tables 7 and 9).
Relationship between sleep duration and tau pathology.
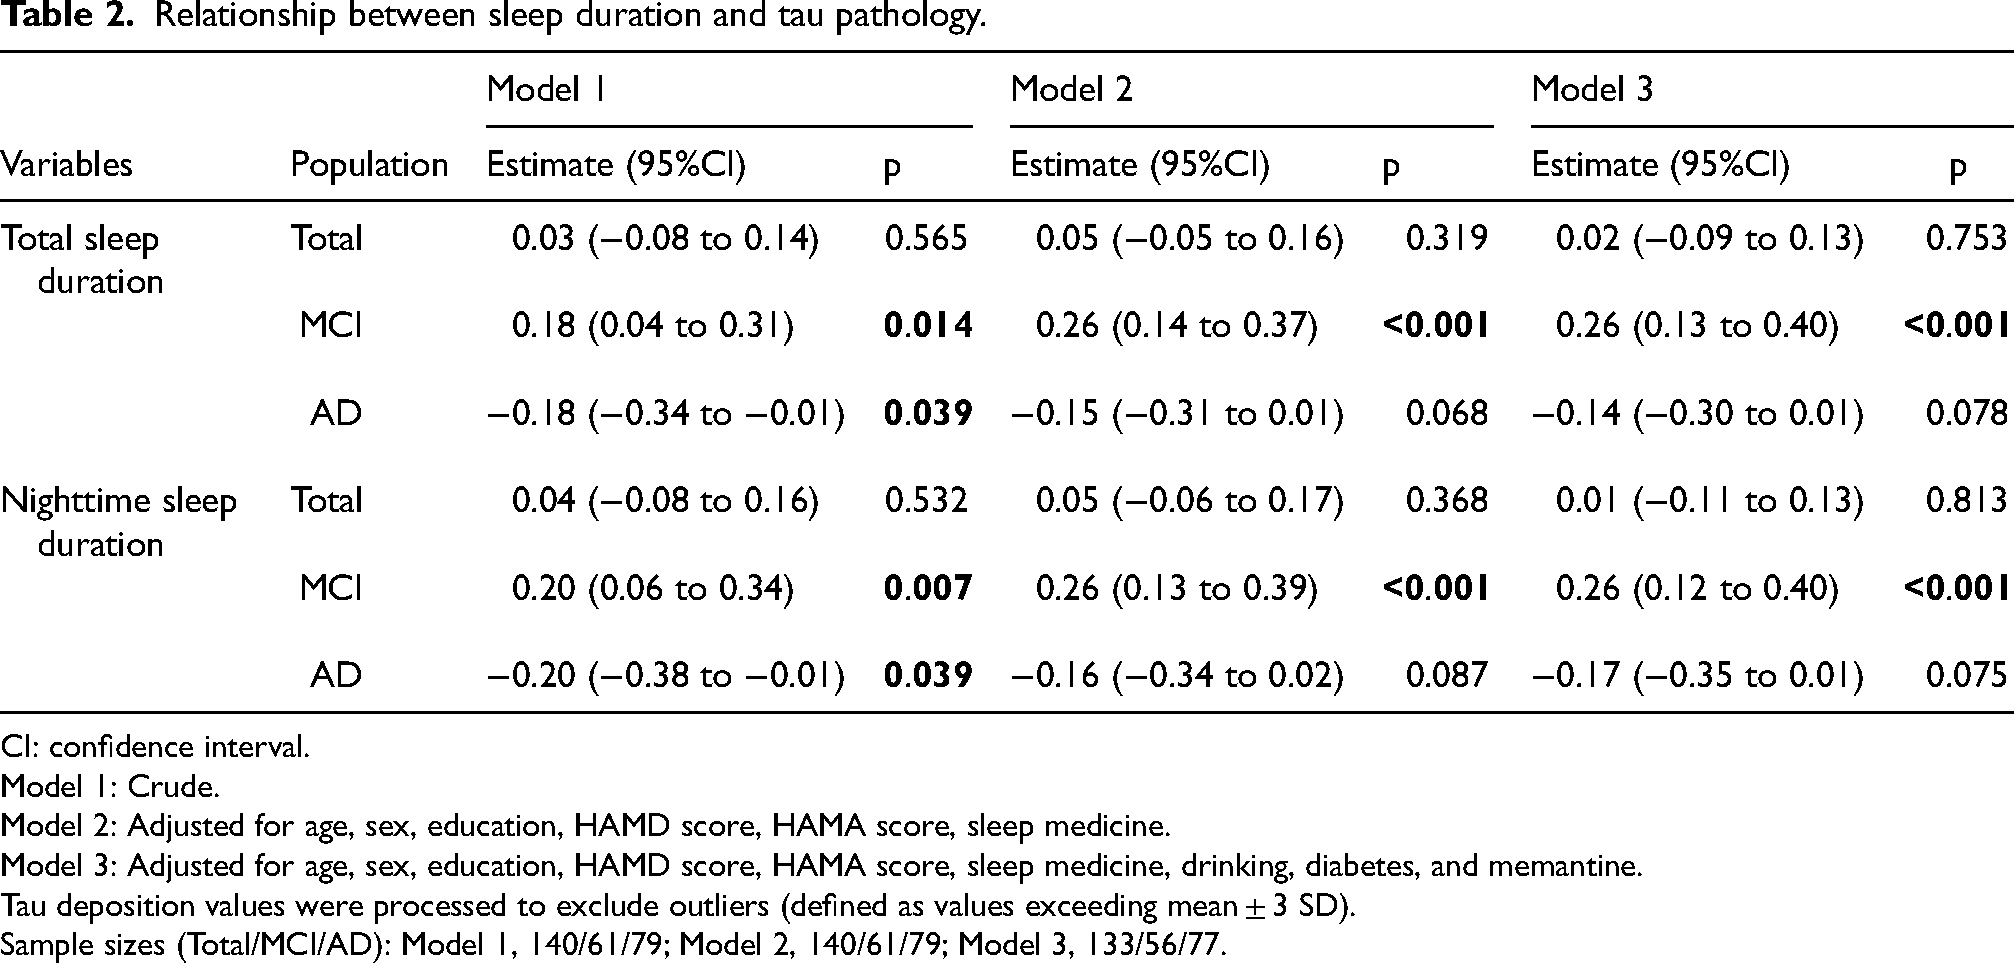
CI: confidence interval.
Model 1: Crude.
Model 2: Adjusted for age, sex, education, HAMD score, HAMA score, sleep medicine.
Model 3: Adjusted for age, sex, education, HAMD score, HAMA score, sleep medicine, drinking, diabetes, and memantine.
Tau deposition values were processed to exclude outliers (defined as values exceeding mean ± 3 SD).
Sample sizes (Total/MCI/AD): Model 1, 140/61/79; Model 2, 140/61/79; Model 3, 133/56/77.
To formally test whether the sleep-tau association differed by diagnostic stage, we examined the interaction between sleep duration and group (MCI versus AD). In fully adjusted models, significant interactions were observed for total sleep duration (β = −0.30, 95% CI: −0.52 to −0.08, p = 0.007) and nighttime sleep duration (β = −0.33, 95% CI: −0.57 to −0.10, p = 0.006), indicating stage-dependent differences in the direction of association. Full interaction results across adjustment models are presented in Supplemental Table 8.
In the negative control outcome analysis, sleep duration showed no association with height across all populations and adjustment models (all p > 0.20; Supplemental Table 11), arguing against substantial residual confounding (Supplemental Table 11).
Tau deposition and cognitive performance in participants with and without sleep disturbances
Our analysis revealed significant differences between participants with and without sleep disturbances. Global cortical tau deposition was lower in those with sleep disturbances (1.98 versus 2.66, difference = 0.62, 95% CI: 0.18–1.08, p = 0.005). Cognitive performance was better in the sleep disturbance group, with higher MMSE scores (21.46 versus 18.90, difference = −3.00, 95% CI: −5.00 to 0.00, p = 0.021), CDT20 scores (12.84 versus 9.75, difference = −3.00, 95% CI: −5.00 to −1.00, p = 0.003), and AFT scores (10.75 versus 7.56, difference = −3.19, 95% CI: −4.80 to −1.58, p < 0.001).
In the MCI group, global cortical tau deposition was significantly lower in participants with sleep disturbances (1.64 versus 2.43, difference = 0.77, 95% CI: 0.12–1.44, p = 0.026). For cognitive measures, only the CDT20 scores showed a statistically significant difference, with higher scores for those with sleep disturbances (16.33 versus 13.70, difference = −2.00, 95% CI: −5.00 to 0.00, p = 0.038). Other cognitive assessments including the MMSE (p = 0.850), CFT (p = 0.246), SDMT (p = 0.594), PVFT (p = 0.208), and AFT (p = 0.092) showed no statistically significant differences.
Sleep disturbances showed no significant difference in tau deposition in AD participants (p = 0.158). However, AFT scores were significantly higher in those with sleep disturbances (8.65 versus 6.30, difference = −2.35, 95% CI: −4.12 to −0.58, p = 0.010). No significant differences were found in other cognitive measures, including MMSE (p = 0.149), CDT20 (p = 0.179), and PVFT (p = 0.325) (Figure 3 and Supplemental Table 5).
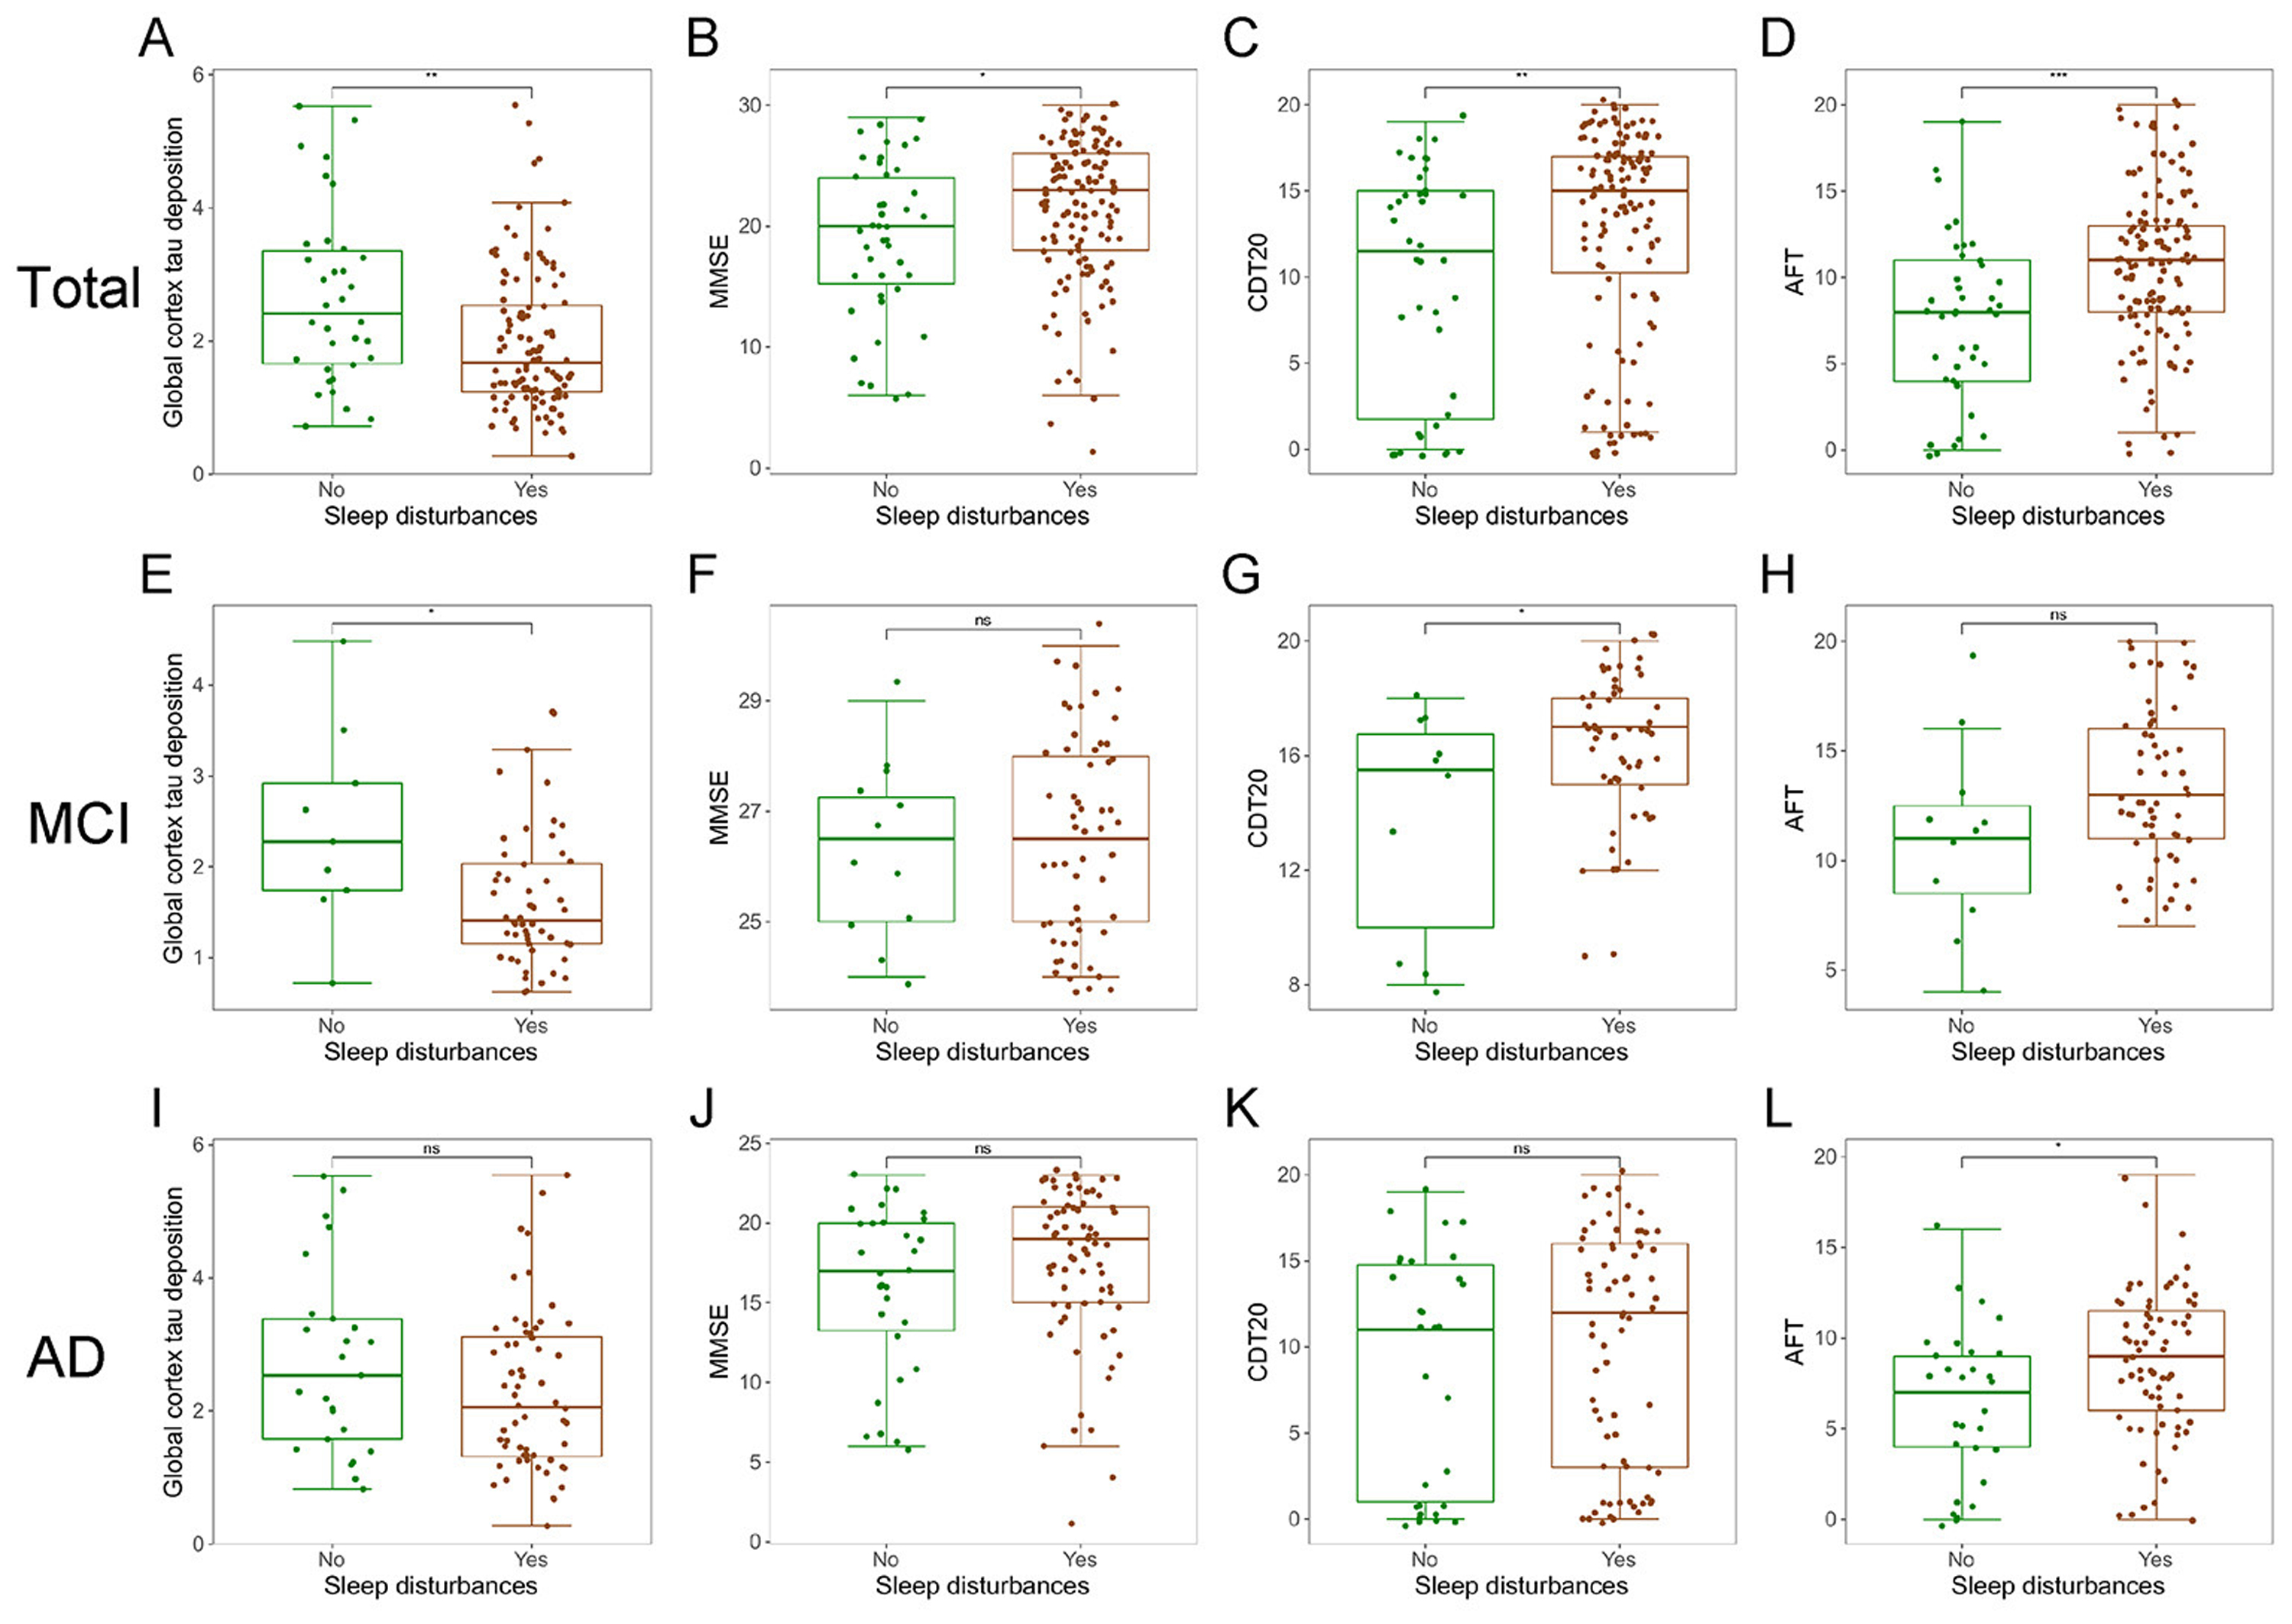
Comparison of AD pathology and cognitive performance metrics between participants with and without sleep disturbances. Box plots comparing cognitive test scores between participants with (red) and without (green) sleep disturbances across total population (A-D), MCI (E-H), and AD (I-L) group. Measures include: Global Cortex tau deposition (A, E, I), Mini-Mental State Examination (B, F, J), Clock Drawing Test 20 (C, G, K), and Animal Fluency Test scores (D, H, L). The boxes represent the interquartile range (IQR) with the median line, and whiskers extend to 1.5 times the IQR. Between-group differences were assessed using two-sided independent samples t-test (normal distribution, equal variances), Welch's t-test (normal distribution, unequal variances), or Wilcoxon rank-sum test (non-normal distribution) as appropriate; *p < 0.05, **p < 0.01, ***p < 0.001. ns: not significant; MCI: mild cognitive impairment; AD: Alzheimer's disease (Color figure available online).
Mediation effects of depression on the association between tau and sleep duration in MCI
Statistical mediation analysis revealed significant associations between global cortical tau deposition, depression, and sleep duration in a cross-sectional framework. The MCI group demonstrated a significant correlation between global cortical tau deposition and total sleep duration (β = 0.63, 95% CI: 0.18–1.14, p = 0.012). This relationship was mediated by HAMD scores, which showed a significant negative mediation effect (β = −0.26, 95% CI: −0.56 to −0.02, p = 0.040) and a stronger direct effect (β = 0.89, 95% CI: 0.45–1.36, p < 0.001), with depression accounting for −38.81% of the total effect (Figure 4A and Supplemental Table 6). Similarly, global cortical tau deposition exhibited a significant overall correlation with nighttime sleep duration (β = 0.60, 95% CI: 0.16–1.09, p = 0.016), with HAMD scores mediating this relationship (indirect effect: β = −0.24, 95% CI: −0.53 to −0.02, p = 0.040; direct effect: β = 0.84, 95% CI: 0.41–1.30, p < 0.001; proportion mediated: −38.30%) (Figure 4B and Supplemental Table 6).
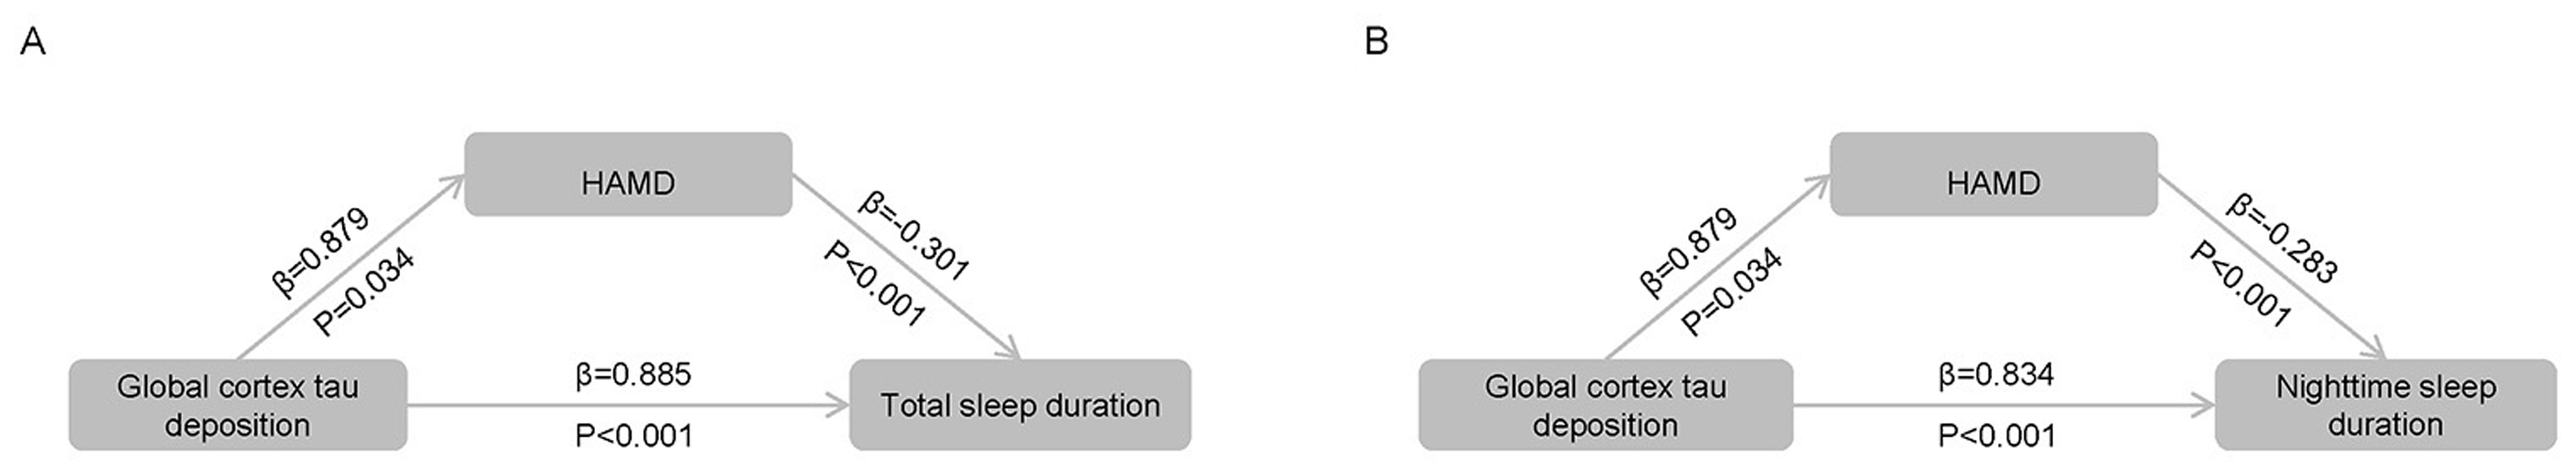
Mediation analyses of tau deposition, depression, and sleep duration in MCI. (A) Mediating effects of depression on association between global cortex tau deposition and total sleep duration (indirect effects = −0.26, 95% CI = −0.56 to −0.02, p = 0.040; direct effects = 0.89, 95% CI = 0.45 to 1.36, p < 0.001). (B) Mediating effects of depression on association between global cortex tau deposition and nighttime sleep duration (indirect effects = −0.24, 95% CI = −0.53 to −0.02, p = 0.040; direct effects = 0.84, 95% CI = 0.41 to 1.30, p < 0.001). All analyses were adjusted for age, sex, education, sleep medicine, and memantine. HAMD: Hamilton Depression Rating Scale. Given the cross-sectional nature of the data, these path coefficients represent statistical associations rather than confirmed causal sequences; alternative directional models are plausible.
In contrast, no significant mediation effects between tau deposition and sleep duration were observed in the AD group (all p > 0.05; Supplemental Table 6), highlighting the stage-specific nature of this pathway during MCI.
Differential associations of sleep duration with cognitive and pathological markers across diagnostic groups
Our analysis revealed that both total and nighttime sleep duration are negatively correlated to scores on cognitive evaluations in the total population. The scatter plots clearly demonstrate negative correlation patterns between sleep duration and MMSE (total: r = −0.291, p < 0.001; nighttime: r = −0.264, p < 0.001), SDMT (total: r = −0.225, p = 0.004; nighttime: r = −0.185, p = 0.017), AVLT-N3 (total: r = −0.286, p < 0.001; nighttime: r = −0.271, p < 0.001), AFT (total: r = −0.172, p = 0.027; nighttime: r = −0.153, p = 0.049), and CDR-SB (total: r = 0.175, p = 0.024; nighttime: r = 0.176, p = 0.023). After adjusting for confounding factors, these associations persisted for MMSE (total: β = −0.83, p = 0.001; nighttime: β = −0.79, p = 0.006), SDMT (β = −1.24, p = 0.021 for total sleep), AVLT-N3 (total: β = −0.28, p = 0.001; nighttime: β = −0.31, p = 0.002), and CDR-SB (total: β = 0.27, p = 0.033; nighttime: β = 0.30, p = 0.031), while AFT only showed significance in the crude data model (total: β = −0.47, p = 0.027; nighttime: β = −0.46, p = 0.049) (Figure 5 and Supplemental Table 2).
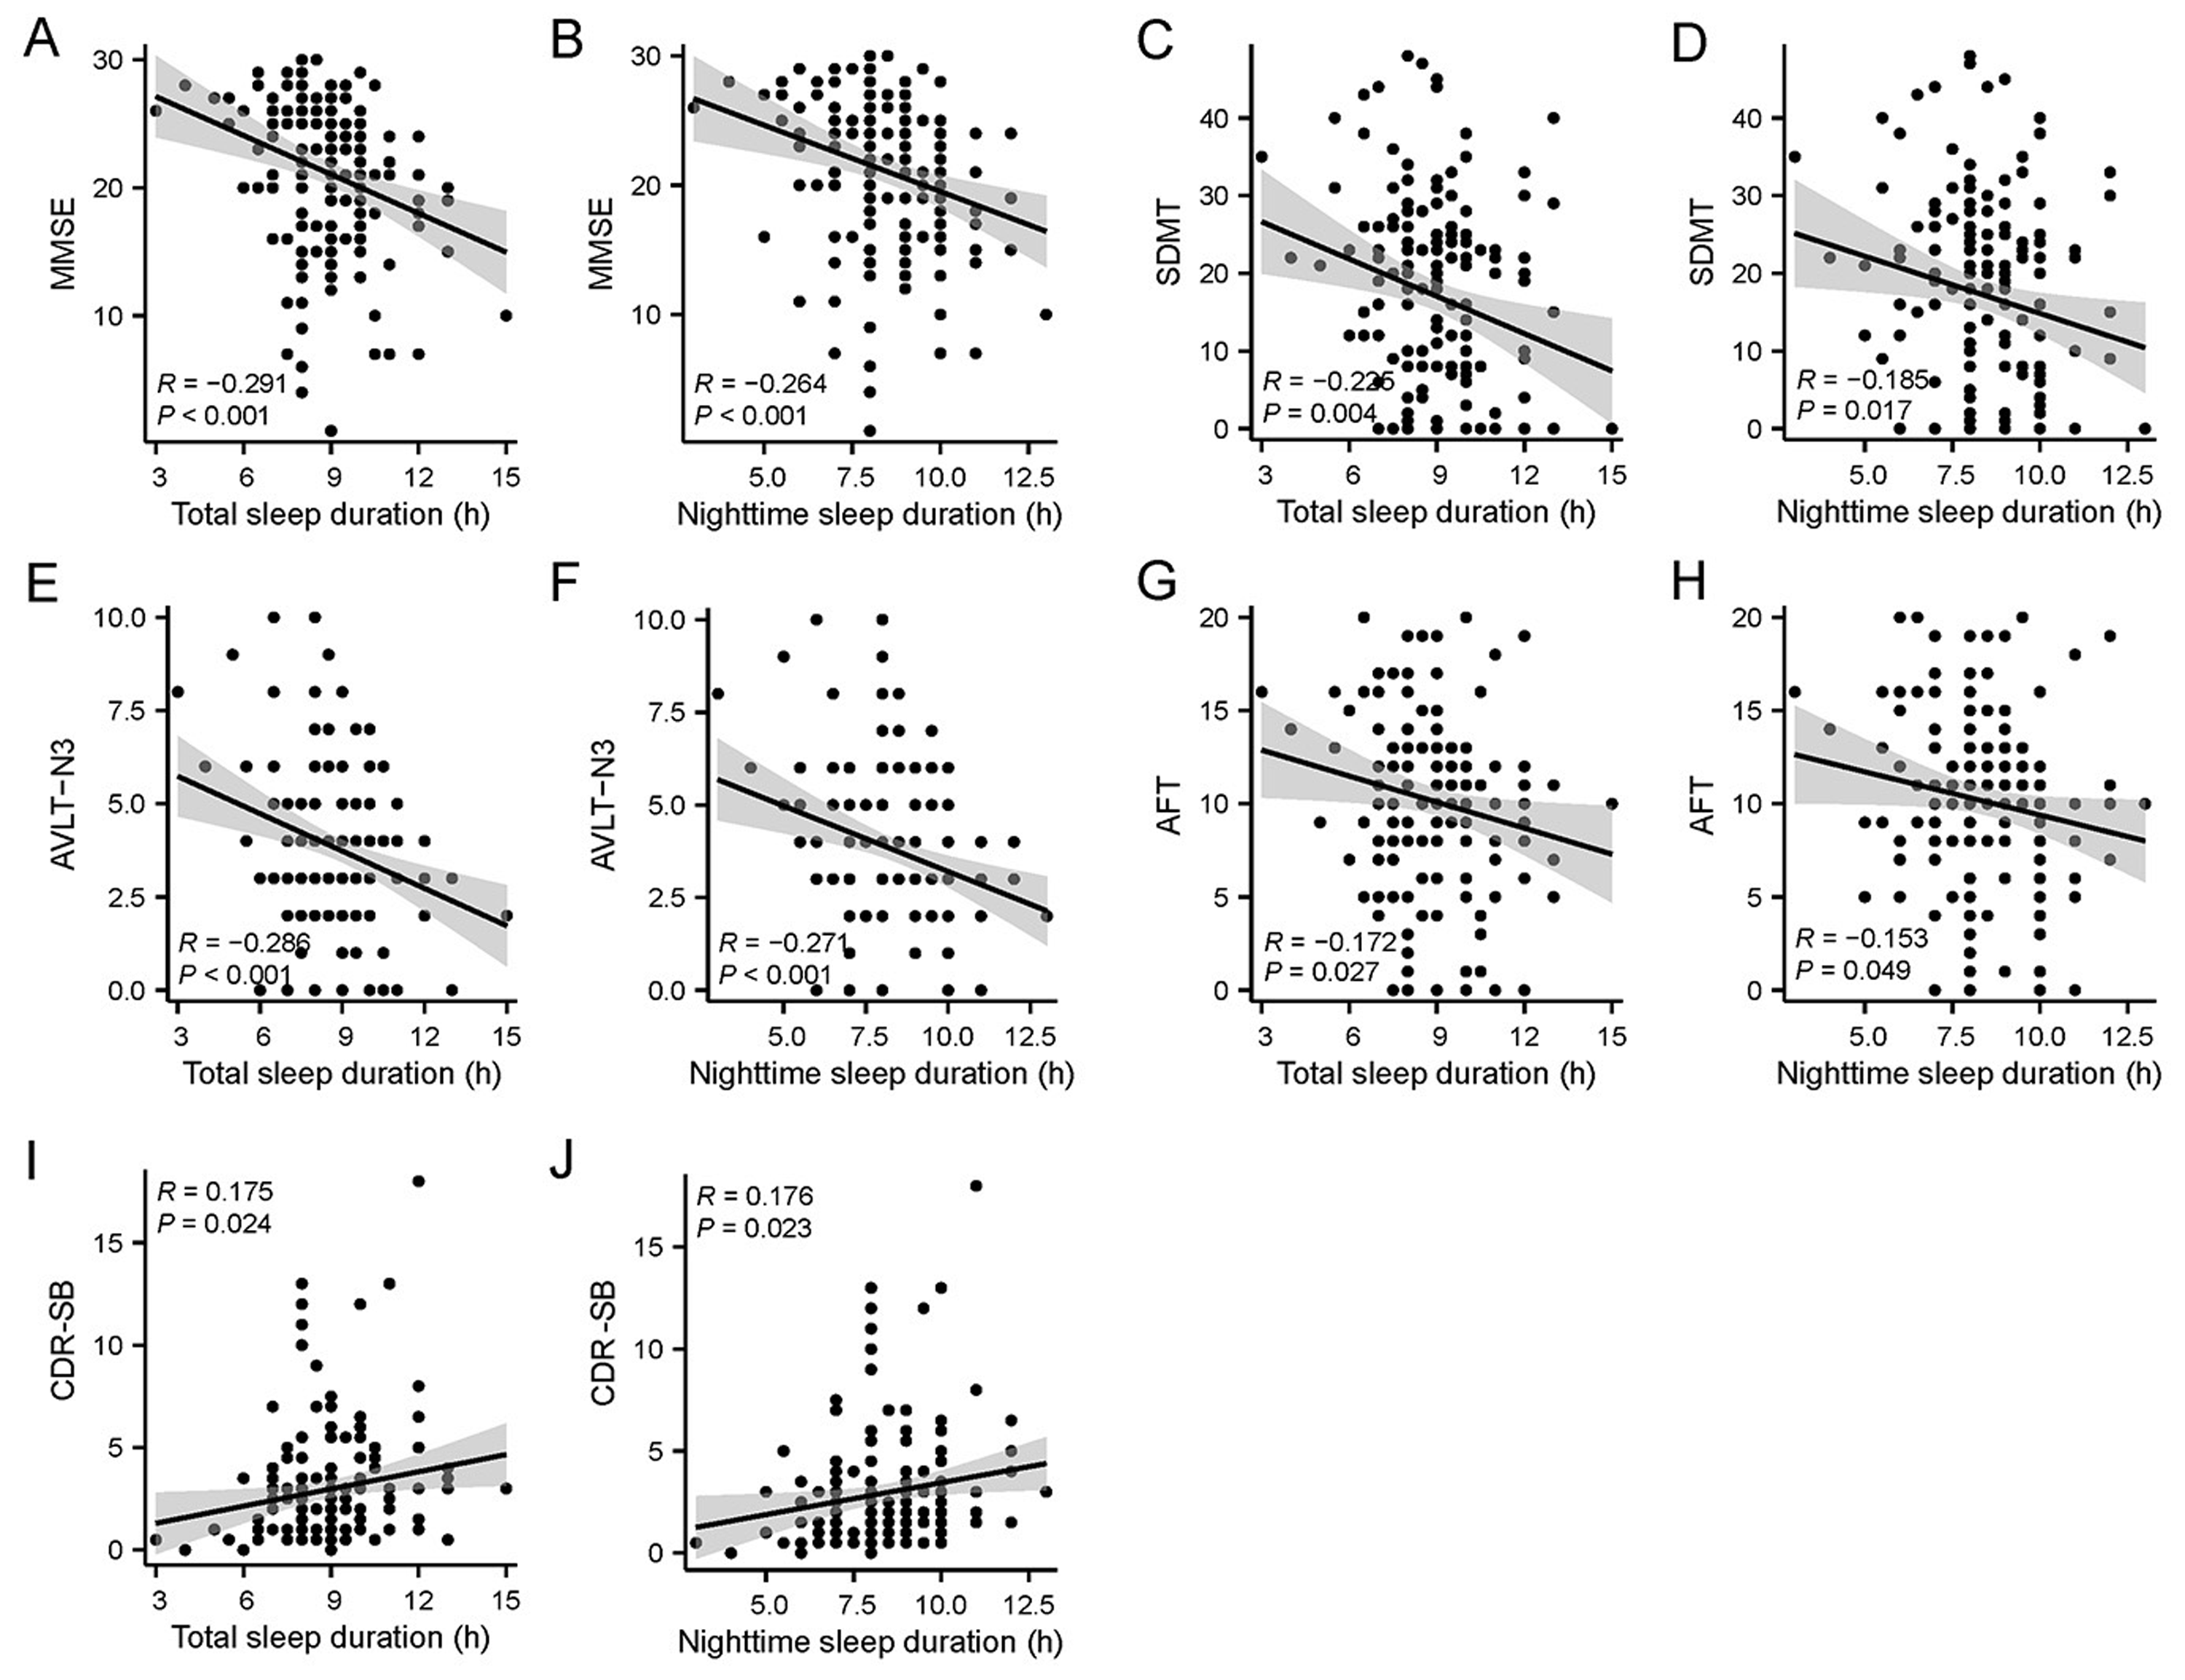
Relationship between sleep duration and cognitive function in the total population. Scatter plots showing correlations between sleep duration and cognitive function. (A, B) Mini-Mental State Examination (MMSE) scores versus total sleep duration and nighttime sleep duration, respectively. (C, D) Symbol Digit Modalities Test (SDMT) scores versus total and nighttime sleep duration. (E, F) Auditory Verbal Learning Test (AVLT)-N3 scores versus total and nighttime sleep duration. (G, H) Animal Fluency Test (AFT) scores versus total and nighttime sleep duration. (I, J) Clinical Dementia Rating Sum of Boxes (CDR-SB) scores versus total and nighttime sleep duration. Each point represents an individual participant. The solid line indicates the linear regression line, with the gray shaded area representing the 95% confidence interval. Correlation coefficients (R) and p values are shown in each panel.
In patients with MCI, longer sleep duration was significantly correlated with poorer performance in specific cognitive domains, particularly in the SDMT (β = −1.68, p = 0.020 for total sleep) and AVLT-N3 (total: β = −0.44, p = 0.002; nighttime: β = −0.43, p = 0.004). Conversely, AD patients showed no significant correlations between sleep duration and cognitive performance (Supplemental Figure 1 and Supplemental Table 3–4).
In the fully adjusted model, sleep duration showed significant negative correlations with the ALPS indices, specifically in MCI patients (total: β = −0.03, p = 0.028; nighttime: β = −0.03, p = 0.026), suggesting that increased sleep duration may be associated with decreased lymphatic clearance functionality (Supplemental Table 3).
Discussion
This study explored how sleep duration and sleep disturbances correlate with tau protein deposition and cognitive performance. As a cross-sectional study involving 172 patients, the strength of our conclusion depended on its comprehensive multimodal neuroimaging examinations and extensive cognitive assessments. Given the cross-sectional design, exposure and outcome were measured concurrently; temporality cannot be established and findings must be interpreted strictly as associations rather than causal relationships. The findings revealed a significantly positive correlation between sleep duration and tau deposition in the MCI stage, and a reversed negative correlation in the AD stage. Moreover, patients with sleep disturbances demonstrated lower tau protein deposition and better cognitive performance. Mediation analyses revealed significant associations between tau deposition, depression, and sleep duration only in MCI.
Our study revealed a stage-dependent association between sleep and tau protein accumulation. In the MCI stage, we found a significant positive correlation between sleep duration and tau deposition (β = 0.18, p = 0.014 for total sleep duration; β = 0.20, p = 0.007 for nighttime sleep duration). After comprehensive covariate adjustment, these associations remained robust (β = 0.26 for both, p < 0.001), corresponding to a clinically meaningful increase in tau burden per additional hour of sleep in this prodromal stage. Previous studies have investigated the relationship between sleep duration and AD biomarkers, although research specifically focusing on sleep duration and tau is still limited and holds contradictions. Baril et al. found no significant relationships between sleep duration changes and tau or Aβ both in longitudinal and cross-sectional analyses 31 ; Yoon et al. reported that longer total sleep duration is associated with tau deposition in multiple brain regions (amygdala, hippocampus, and basal forebrain) and speculated on faster tau accumulation in Braak V-VI regions (β = 0.016, p = 0.007), while showing no correlation with amyloid accumulation. 32 These findings align with ours to some extent, although they do not reflect the different stages of AD progression. The relationship between sleep duration and AD biomarkers is quite complex. Although the subgroup-specific associations appeared largely linear in exploratory GAM analyses, the opposite directions of these trends in MCI versus AD suggest that the relationship between sleep duration and tau burden may be more complex across the full cognitive spectrum. Studies have identified a U-shaped relationship between sleep duration and CSF Aβ deposition, with both inadequate (<6 h) and excessive (>8 h) sleep duration linked to higher Aβ levels.13,33 In middle-aged adults, insufficient sleep mainly impacts tau pathology, whereas in older adults, sleep latency and efficiency are more sensitive indicators.13,34 While cross-sectional studies support this U-shaped association between sleep and AD pathology, genome-wide association analyses have not confirmed a direct relationship between sleep duration and brain atrophy. 14 A cause of this complexity may be due to population differences and other confounding factors, emphasizing that the relationship isn’t straightforward. Our findings do not contradict those observations; rather, they indicate that within clinically defined MCI and AD stages, the sleep-tau relationship may be well approximated by a linear function. One interpretation is that patients in the MCI stage may extend sleep duration as a compensatory response to incipient cognitive decline. This does not imply that prolonged sleep impairs glymphatic function. Indeed, the efficacy of glymphatic clearance is dependent not simply on sleep duration, but on the presence of deep, restorative slow-wave sleep. 35 Rather, it may suggest that despite increased sleep duration, clearance efficiency remains suboptimal, likely reflecting poor sleep quality rather than excessive duration. This hypothesis is supported by our DTI-ALPS analysis, which showed a negative correlation between sleep duration and ALPS index in patients with MCI (total: β = −0.03, p = 0.028; nighttime: β = −0.03, p = 0.026). Previous studies also have demonstrated that lower ALPS indices, reflecting impaired glymphatic function, can predict a higher risk of conversion to amyloid-PET positivity, suggesting that inefficient clearance of Aβ through the glymphatic system may lead to its progressive accumulation. 36
In contrast, this association became negative in the AD stage (β = −0.18, p = 0.039 for total sleep duration; β = −0.20, p = 0.039 for nighttime sleep duration). However, this relationship was not statistically significant after adjusting for confounding factors. Based on prior research, sleep regulatory centers may suffer more severe damage in the later stages of the disease. Studies indicate that tau and Aβ accumulation in key brain regions, such as TRN, directly disrupts sleep continuity and slow-wave sleep.37,38 This disruption creates a vicious cycle in the sleep-clearance system by impairing glial cell clearance effectiveness, interfering with CSF dynamics, and APOE4-related mechanisms.39–41 Additionally, degeneration of circadian regulatory centers, such as the suprachiasmatic nucleus, along with disturbances in REM sleep, may further accelerate disease progression. 42 As tau and Aβ accumulate in critical regions, both the sleep-clearance system and circadian rhythm regulation become impaired. While this negative correlation aligns superficially with findings in healthy individuals, 43 the underlying mechanism likely differs: in advanced stages, neurodegeneration of sleep centers may drive both fragmentation and tau accumulation, rendering total sleep time an epiphenomenon of severity.
Cognitive test results supported this stage-specific pattern. For patients with MCI, longer sleep duration significantly correlated with poorer cognitive performance, particularly in SDMT (β = −1.68, p = 0.020 for total sleep) and AVLT-N3 (total: β = −0.44, p = 0.002; nighttime: β = −0.43, p = 0.004). Similarly, a large-scale prospective study involving 7444 elderly women in the community found that, compared to the control group who slept 7 h per night, long sleepers (> 7 h) showed significantly higher risk of dementia. 44 These associations remained significant after adjusting for confounders, suggesting that sleep duration may serve as a cross-sectional correlate of cognitive changes. In MCI, excessive sleep duration (e.g., ≥9 h per night) is prospectively associated with worse cognitive performance, 45 as well as elevated plasma IL-9 and MIP-1β, suggesting that extended sleep may reflect underlying neuroinflammation and neurodegeneration rather than restorative sleep. 46 However, in patients with AD, these associations largely disappear. This may reflect a more complex relationship between sleep and cognition in the later stages of AD, influenced by multiple factors that require further investigation.47–49
Our mediation analyses revealed another crucial stage-specific characteristic in the tau-sleep relationship: emotional state significantly mediated the tau-sleep pathway in the MCI stage (β = −0.26, p = 0.040 for total sleep duration; β = −0.24, p = 0.040 for nighttime sleep duration), while this mediation effect was not significant in the AD stage. Previous research has demonstrated that among cognitively normal adults, PET imaging shows that tau deposition is significantly associated with depression diagnosis. Individuals who are tau-positive have twice the risk of depression compared to those who are tau-negative. 50 Research shows participants with depression also report shorter sleep duration and reduced sleep efficiency.51,52 It should be acknowledged that depression can also present with hypersomnia. 53 Additionally, most antidepressants suppress REM sleep to varying degrees, which may confound sleep assessments. 54 Nonetheless, the mediation effect we observed in MCI remains robust. This supports the interpretation that depression may represent a stage specific intermediate correlate linking tau pathology to sleep alterations in the prodromal phase of AD. However, the cross-sectional design precludes temporal inference. Alternative directions such as sleep affecting depressive symptoms or tau accumulation remain plausible.
Notably, we observed a seemingly paradoxical phenomenon: patients reporting fewer sleep disturbances actually showed higher tau deposition levels (difference = 0.62, p = 0.005) and poorer cognitive performance. This could be explained through “pseudo-high sleep quality”, resulting from a reporting bias, where patients with worse cognitive function paradoxically report better subjective sleep quality. This “pseudo-high sleep quality” might result from impaired self-monitoring abilities due to cognitive dysfunction (e.g., anosognosia), making it difficult for patients to accurately evaluate their own sleep quality.55,56 Crucially, such reporting bias is potentiated by anosognosia, the loss of insight inherent to tau-related neurodegeneration, which renders subjective complaints an unreliable proxy for actual sleep disruption in this population. This finding underscores the necessity of objective sleep assessment methods rather than sole reliance on patient self-report.
Placing these findings within the broader dementia risk landscape, sleep-related factors represent one domain among several modifiable contributors. Recent Canadian estimates indicate that 12 such factors account for approximately half of dementia cases, with sleep disturbances contributing a population attributable fraction of 3.0%. 57 Studies have extended risk models by incorporating additional covariates such as resting heart rate. 58 The present study focused specifically on sleep duration and tau deposition in Chinese population, so the analytic framework was not designed to incorporate additional modifiable factors. Regarding consistency across racial groups, machine-learning risk models reveal notable ethnic heterogeneity in predictive accuracy, 59 suggesting that sleep-pathology associations may vary across populations. Whether these stage-dependent patterns extend to other racial groups warrants investigation.
This study demonstrates several key strengths. First, we uniquely combined multimodal neuroimaging with comprehensive cognitive assessments to investigate sleep-tau-cognition relationships. Second, we used standardized sleep questionnaires and multiple cognitive tests to ensure data quality. Third, by conducting mediation analysis, we explored how depression might affect the relationship between sleep and tau deposition. Finally, we included more patients with positive Aβ PET results than in previous studies to provide strong statistical power and ensure population homogeneity, enabling a more thorough understanding of sleep's role in AD progression.
However, several limitations of this study should be noted. First and foremost, the cross-sectional design precludes causal inference; temporality cannot be established, and reverse causation as well as residual confounding remain significant concerns. Second, sleep data were based on self-reported and caregiver-reported PSQI items without objective polysomnography, which is a limitation. However, the primary contribution of this study lies in its quantitative multimodal neuroimaging outcomes. Third, detailed information on sleep architecture and specific sleep disturbance subtypes (e.g., snoring, breathing discomfort) was unavailable, which could have offered deeper insights into the sleep-tau relationship. Fourth, no correction for multiple comparisons was applied to secondary cognitive and sleep-disturbance analyses; therefore, marginal associations should be regarded as exploratory and interpreted with appropriate caution. Moreover, as this study was conducted at a single center with Chinese participants, the findings need to be repeated in diverse populations, and more longitudinal research is required in the future.
Conclusions
This study demonstrated a stage-dependent relationship between sleep and tau pathology. During the MCI stage, sleep duration showed a significantly positive correlation with tau deposition, which reversed to be negatively correlated in the AD stage. Mediation analyses revealed the role of depressive symptoms in the tau-sleep relationship. These findings deepen our understanding of sleep's role in AD pathological progression and highlight the MCI stage as a critical period warranting further investigation in the future.
Supplemental Material
sj-docx-1-alz-10.1177_13872877261462419 - Supplemental material for Stage-dependent relationship between sleep duration and cortical tau deposition in cognitively impaired individuals: A cross-sectional study
Supplemental material, sj-docx-1-alz-10.1177_13872877261462419 for Stage-dependent relationship between sleep duration and cortical tau deposition in cognitively impaired individuals: A cross-sectional study by Yingting Zheng, Lin Kang, Xinyuan Yang, Ruixuan Zhou, Haijuan Chen, Wenjing Wang, Xiaomeng Xu, Wei Xu, Jun Liu, Binyin Li and Yulei Deng in Journal of Alzheimer's Disease
Footnotes
Acknowledgements
We would like to thank our anonymous reviewers for thoughtful comments on the manuscript. We are grateful to all research participants. We are also grateful to all the study participants for their patience and cooperation.
Ethical considerations
This study received approval from the Ruijin Hospital Ethics Committee, Shanghai Jiao Tong University School of Medicine, China. The study was in accordance with the Declaration of Helsinki and its amendments. The study was registered with ClinicalTrials.gov (NCT05623124).
Consent to participate
Informed consent forms were completed by all participants or their family members.
Consent for publication
Written informed consent for publication was obtained from all participants or their legally authorized representatives.
Author contribution(s)
Funding
The authors disclosed receipt of the following financial support for the research, authorship, and/or publication of this article: This study was supported by National Natural Science Foundation of China (grant numbers 82171400, 82271441), Shanghai Huangpu District Health System Professional Talent Training Project (grant number 2023XD01), Shanghai Rising-Star Program (grant number 21QA1405800), The National Key Research and Development Program of China, Scientific and technological innovation 2030—“Brain science” (grant number 2022ZD0213800).
Declaration of conflicting interests
The authors declared no potential conflicts of interest with respect to the research, authorship, and/or publication of this article.
Data availability statement
The datasets generated and analyzed during the current study are not publicly available due to ethical-legal considerations and participant privacy but are available from the corresponding author on reasonable request.
Supplemental material
Supplemental material for this article is available online.
References
Supplementary Material
Please find the following supplemental material available below.
For Open Access articles published under a Creative Commons License, all supplemental material carries the same license as the article it is associated with.
For non-Open Access articles published, all supplemental material carries a non-exclusive license, and permission requests for re-use of supplemental material or any part of supplemental material shall be sent directly to the copyright owner as specified in the copyright notice associated with the article.