
Abstract
Aim:
To systematically examine associations between six inequality indicators from different life-course domains and the adult prevalence of six non-communicable diseases (NCDs) within a Nordic population-based study.
Methods:
We conducted a cross-sectional analysis using data from the seventh Tromsø Study survey (2015–2016) in Norway. All residents aged ⩾40 years were invited (65% participation). Age-adjusted, sex-stratified logistic regression models were used to assess associations between inequality indicators (parental and own educational level, childhood economic status, adverse childhood experiences (ACEs), income, and subjective occupational status) on continuous 0–1 cumulative proportion scales, and NCDs (major adverse cardiovascular events (MACE), cancer, chronic obstructive pulmonary disease (COPD), diabetes, musculoskeletal symptoms, and mental distress). Odds ratios (ORs), with 95% confidence intervals (CIs), were estimated, where OR >1 indicates higher odds of an NCD with greater disadvantage.
Results:
Among 21,069 participants, greater social and economic disadvantage was associated with higher odds of MACE, COPD, diabetes, musculoskeletal symptoms, and mental distress. For musculoskeletal symptoms, significant associations were observed across all inequality indicators in both sexes. The steepest gradients were observed in mental distress for ACEs in women (OR 7.81, 95% CI 6.20–9.86) and men (10.09, 7.34–13.88). In contrast, greater disadvantage was associated with lower odds of cancer for some indicators; sensitivity analyses indicated these findings reflected cancer types with known positive socioeconomic gradients.
Conclusions:
Life-course social and economic disadvantage was consistently associated with higher prevalence of MACE, COPD, diabetes, musculoskeletal symptoms, and mental distress, with the pattern and magnitude varying across inequality indicators and NCDs.
Keywords
Background
Non-communicable diseases (NCDs), including cardiovascular diseases, cancers, chronic respiratory diseases, diabetes, musculoskeletal disorders, and mental health conditions, are highly prevalent worldwide [1]. However, their distribution is unequal, even within Nordic welfare states that offer universal healthcare and comprehensive social protection [2]. Gradients of inequality, defined by poorer health outcomes at lower socioeconomic positions, are consistently observed across various NCDs, including in high-income countries [3–5].
Multiple indicators have been applied to capture health inequality, most commonly education, income, and occupational status [6]. Although inequality indicators are correlated and tend to accumulate, they also reflect distinct pathways through which social and economic determinants affect health [6]. Education may increase health literacy, enabling healthier behaviours and more effective healthcare utilisation [6, 7]. Income determines access to nutritious food, favourable living environments, and opportunities for physical activity, while financial insecurity may contribute to chronic stress and associated health risks [6, 8]. Occupational status reflects both physical and psychosocial demands, with lower-status jobs more often associated with hazardous work environments, repetitive strain, and less autonomy, all of which influence health outcomes [6, 9].
The impact of childhood factors on adulthood NCD risk is increasingly recognised [10]. Early life disadvantage, including exposure to chronic stress, limited access to resources, and intergenerational transmission of disadvantage, is associated with developmental and behavioural risk trajectories that extend into adulthood [11]. Recent research has made progress in highlighting how underlying mechanisms triggered by early life adversity, such as the disruption of biological systems and the influence of neural and epigenetic processes, lay the foundation for NCDs in adulthood [12].
Although the literature on social determinants of health is extensive, most studies examine a limited number of socioeconomic indicators and NCD outcomes [3, 4]. Comparing gradient strength across studies is challenging when differences in populations, measurement, and analytical approach confound interpretation. Although a recent, large, register-based study in Denmark included a broad range of NCD outcomes, it focused on education and income as inequality indicators [13]. Few studies incorporate childhood factors alongside conventional adulthood socioeconomic indicators, in relation to a broad range of NCDs. Sex differences also require consideration, as men and women may experience and respond to social and economic conditions in distinct ways [14].
Aim
We aimed to systematically examine associations between six inequality indicators that capture different life-course domains – parental educational level, childhood economic status, adverse childhood experiences (ACEs), educational level, income level, and occupational status – and the adult prevalence of six NCDs: major adverse cardiovascular events (MACE), cancer, chronic obstructive pulmonary disease (COPD), diabetes, musculoskeletal symptoms, and mental distress. With attention to sex differences, we aimed to map the relative magnitude and consistency across all indicator–outcome combinations within a single population-based study in Norway.
Methods
Setting and study design
Our cross-sectional analysis was based on data from the seventh survey (Tromsø7; 2015–2016) of the Tromsø Study, an ongoing population-based cohort study (Tromsø1–Tromsø7; 1974–2016) conducted in the municipality of Tromsø, Norway [15]. Tromsø is the largest municipality in Northern Norway with ~73,000 inhabitants in 2015. It comprises both urban (80%) and rural areas, with residents primarily employed in tertiary sectors such as trade, healthcare, education, and public administration [15]. As a university city and regional administrative centre, Tromsø has a higher concentration of university-educated residents than the national average [16, 17]. Approximately 85% of the population is of Norwegian descent [15]. Data collection in Tromsø7, detailed in other sources [15], involved questionnaires, biological sampling, clinical examinations and linkages to adjudicated hospital records and registry data. Tromsø7 and the present study were approved by the Regional Committee of Medical and Health Research Ethics North (references 2014/940 and 2021/262445 respectively) and the Norwegian Data Protection Authority (reference 14/01463-4/CGN) [15].
Public involvement
Public involvement in Tromsø7 encompassed a range of stakeholders, including the municipality, county, health authorities, healthcare providers, participants, and the general public. These stakeholders engaged at a strategic level through participation in the Tromsø7 steering group, as well as contributing to the detailed planning of subprojects, piloting of questionnaires, and dissemination of results.
Participants
All 32,591 residents of Tromsø aged 40 years and older in 2015 were invited to participate in Tromsø7, of whom 65% attended. Fourteen participants were excluded after withdrawing their consent, resulting in a total sample size of 21,069 individuals. All participants provided written informed consent. A non-response analysis of Tromsø7, linking the invitation file to Statistics Norway, showed that non-participants were more likely to be men, unmarried, widowed, or separated/divorced, born outside of Norway, and to have lower educational attainment, lower income, be residential renters, and reside in areas with lower socioeconomic status [18].
Variables
Detailed descriptions of the study variables are available in Supplementary Document 1.
Self-reported educational attainment was categorised into four levels (primary, upper secondary, short tertiary, long tertiary), aligning with the International Standard Classification of Education 2011 categories 1–2, 3–4, 5–6, and 7–8, and validated against national records [19, 20]. Parental educational level was based on the highest level of education attained by either parent.
Childhood economic status was assessed by self-reported family economic situation during childhood, categorised into four levels (very hard, hard, good, very good).
ACEs were assessed as self-reported exposure to 11 types of highly stressful life events before the age of 18, involving oneself or a loved one. ACEs included serious illness or accidents, violence, sexual abuse, bullying, other dangerous or frightening experiences, bereavement and severe grief, painful or frightening medical treatment, and physical and emotional neglect [21]. ACEs were categorised by the number of experiences (0, 1, 2, 3, 4, 5–11).
Income was based on self-reported total household income, reported on eight levels.
Subjective occupational status for current or most recent occupation was self-reported on five levels (very low, fairly low, middle, fairly high, very high).
Prevalent MACE included first-ever myocardial infarction, unstable angina, and ischaemic and haemorrhagic stroke occurring prior to attendance at Tromsø7. Diagnoses were derived from the Tromsø Study’s adjudicated cardiovascular disease endpoint registry, and from hospital records at the University Hospital of North Norway (ICD-10: I20.0, I21, I22, I61, I63, I64; ICD-9: 410, 411, 431, 433, 434, 436).
Prevalent cancer was defined as any cancer diagnosis (ICD-10: C00-C97) registered in the Norwegian Cancer Registry prior to attendance at Tromsø7.
COPD was self-reported by the question ‘Have you ever had, or do you have chronic bronchitis/emphysema/COPD?’.
Diabetes was defined by glycated haemoglobin (HbA1c) ⩾6.5% (⩾48 mmol/mol), self-reported diabetes or use of antidiabetic medication.
Musculoskeletal symptoms were defined by self-report of severe complaints (with response categories ‘no’, ‘some’ and ‘severe’ complaints) of pain or stiffness in muscles or joints lasting at least three consecutive months in one or more specified body regions.
Mental distress was assessed using the 10-item Hopkins Symptom Checklist, with a cutoff score of ⩾1.85 for clinically significant psychological distress [22].
Age and sex were obtained from national registries.
Statistical methods
We assumed all missing values were missing at random and employed multiple imputation using chained equations to generate a complete dataset for the full sample of 21,069 participants (more detailed description provided in Supplementary Document 2).
To enable assessment of the relative effects of distinct inequality indicators on the outcomes, all inequality indicators were modelled as continuous independent variables on a cumulative proportion scale between zero and one [23]. The scale was constructed by ordering the levels of each indicator from the level of most advantage (e.g. highest educational level or lowest level of ACE-count) to the least advantage, and assigning a score based on the midpoint of their cumulative proportion. For example, 33% of women reported a long tertiary level of education and were assigned a score of 0.17 (0.33/2). Similarly, short tertiary education (18%) was assigned a score of 0.42 (0.33+(0.18/2)), upper secondary education (25%) a score of 0.64 (0.33+0.18+(0.25/2)), and primary education (24%) a score of 0.88 (0.33+0.18+0.25+(0.24/2)). This approach accounts for the population size of each socioeconomic group and places all indicators on a common scale regardless of the number of their original response categories, enabling meaningful interpretation of associations across indicators. Age was modelled as a continuous independent variable. All NCD outcome variables were dichotomised. The associations between each inequality indicator and each NCD were estimated in separate logistic regression models, with each indicator entered as the sole exposure. Each model was adjusted for age, and the results were expressed as odds ratios (ORs) with 95% confidence intervals (CIs) and p-values. The ORs represent the relative odds of the outcome across the full range of the cumulative proportion scale, comparing the theoretically most advantaged position (score 0) to the most disadvantaged (score 1). While no individual occupies these exact positions, this comparison captures the full extent of the socioeconomic gradient within the population distribution. An OR >1 indicates higher odds of an NCD with greater disadvantage.
To assess whether cumulative NCD burden was associated with social and economic disadvantage, we constructed an NCD sum score by summing the six binary NCD outcomes for each participant (range 0–6). Due to sparse data in the upper categories, the score was categorised as 0, 1, 2, or ⩾3. Age-adjusted ordinal logistic regression models were used to estimate the association between each inequality indicator, on the 0–1 cumulative proportion scale, and the NCD sum score. The proportional odds assumption was assessed using the Brant test on the original non-imputed dataset, as this test is not compatible with multiple imputation estimates. The Brant test indicated some violation of the proportional odds assumption, driven primarily by age, with the inequality indicator itself showing violation in 5 of 12 models. As our primary interest was in the overall direction and magnitude of the associations, we retained the ordinal logistic regression approach, as multinomial regression would have produced a threefold increase in the number of estimates, complicating interpretation.
All analyses were stratified by sex. Sex interactions were assessed in separate models for each inequality indicator by including a two-way cross product term between sex and each inequality indicator, adjusting for age and an age–sex interaction term. The age–sex interaction was included to allow for differential effects of age between sexes, consistent with the sex-stratified main analyses. Two-sided p-values <0.05 were considered statistically significant.
To account for potential Type I errors due to multiple testing, we applied the Simes method, based on the Benjamini–Hochberg procedure, to control for false discovery rate (FDR) [24]. All 84 p-values from the main analyses were included in a single correction procedure: seven outcomes (six individual NCDs and NCD sum score) × six inequality indicators × two sexes. The 42 p-values from the sex-interaction analyses were addressed in a separate procedure. Adjusted p-values (q-values) are reported alongside the original p-values in the tables. In the results text, associations are described as statistically significant only where both the original p-value and the FDR-adjusted q-value were below 0.05.
Sensitivity and additional analyses
All the analyses of individual NCD outcomes were performed in the multiply imputed datasets (presented in Figure 1(a) to (c), and Supplementary Tables 2 and 3) and repeated as sensitivity analyses using listwise deletion in the original dataset (Supplementary Tables 4 and 5). As sensitivity analyses, we also assessed the inequality indicators as categorical variables (described in Supplementary Document 1), in separate age-adjusted models for each NCD (Supplementary Tables 6–9). Here we estimated ORs with 95% CIs for prevalence of NCDs for each level of the inequality indicators, using the highest, most privileged levels as the reference levels. We additionally calculated the probability of having each NCD by each inequality indicator, by setting age as average and reporting as age-adjusted proportions in percentages. For associations with steeper gradients, ORs from the main analyses were expected to be larger than those from the categorical analyses, as they span the full theoretical range of the scale rather than comparing specific groups within it.

Age-adjusted odds ratios (ORs) with 95% confidence intervals (CIs) for associations between six inequality indicators (parental educational level, childhood economic status, adverse childhood experiences, educational level, income level and subjective occupational status) and six non-communicable diseases (NCDs): (a) major adverse cardiovascular events (MACE) and cancer. (b) Chronic obstructive pulmonary disease (COPD) and diabetes. (c) Musculoskeletal symptoms and mental distress. The inequality indicators were modelled as continuous variables on a cumulative proportion scale (0–1).
As sensitivity analyses for the cancer outcome, we examined associations within specific cancer types with known higher incidence among socioeconomically advantaged groups [25]: breast cancer in women (ICD-10: C50; 292 cases), prostate cancer in men (C61; 342 cases) and combined melanoma and non-melanoma skin cancer (C43 and C44; 196 cases). We also repeated the main cancer analyses after excluding breast cancer in women and prostate cancer in men, and then additionally excluding skin cancer (Supplementary Table 10).
To examine the interrelationships between the inequality indicators, we calculated pairwise Spearman rank correlation coefficients (r) between all six indicators in their original ordinal response categories, stratified by sex. Correlations were computed with listwise deletion in the original, non-imputed dataset (Supplementary Table 11).
Multiple imputation and all analyses were performed in Stata (StataCorp. 2023. Stata Statistical Software: Release 18. College Station, TX: StataCorp LLC.). We adhered to the Strengthening the Reporting of Observational Studies in Epidemiology (STROBE) guidelines for cross-sectional studies when writing the present report [26].
Results
Participants
Among the 21,069 participants, 53% were women, and mean age was 57.3 years (SD 11.4). The participants’ demographic, social and clinical characteristics are detailed in Table I, while NCD risk factors are presented in Supplementary Table 1.
Characteristics of study population (the Tromsø Study 2015–2016).
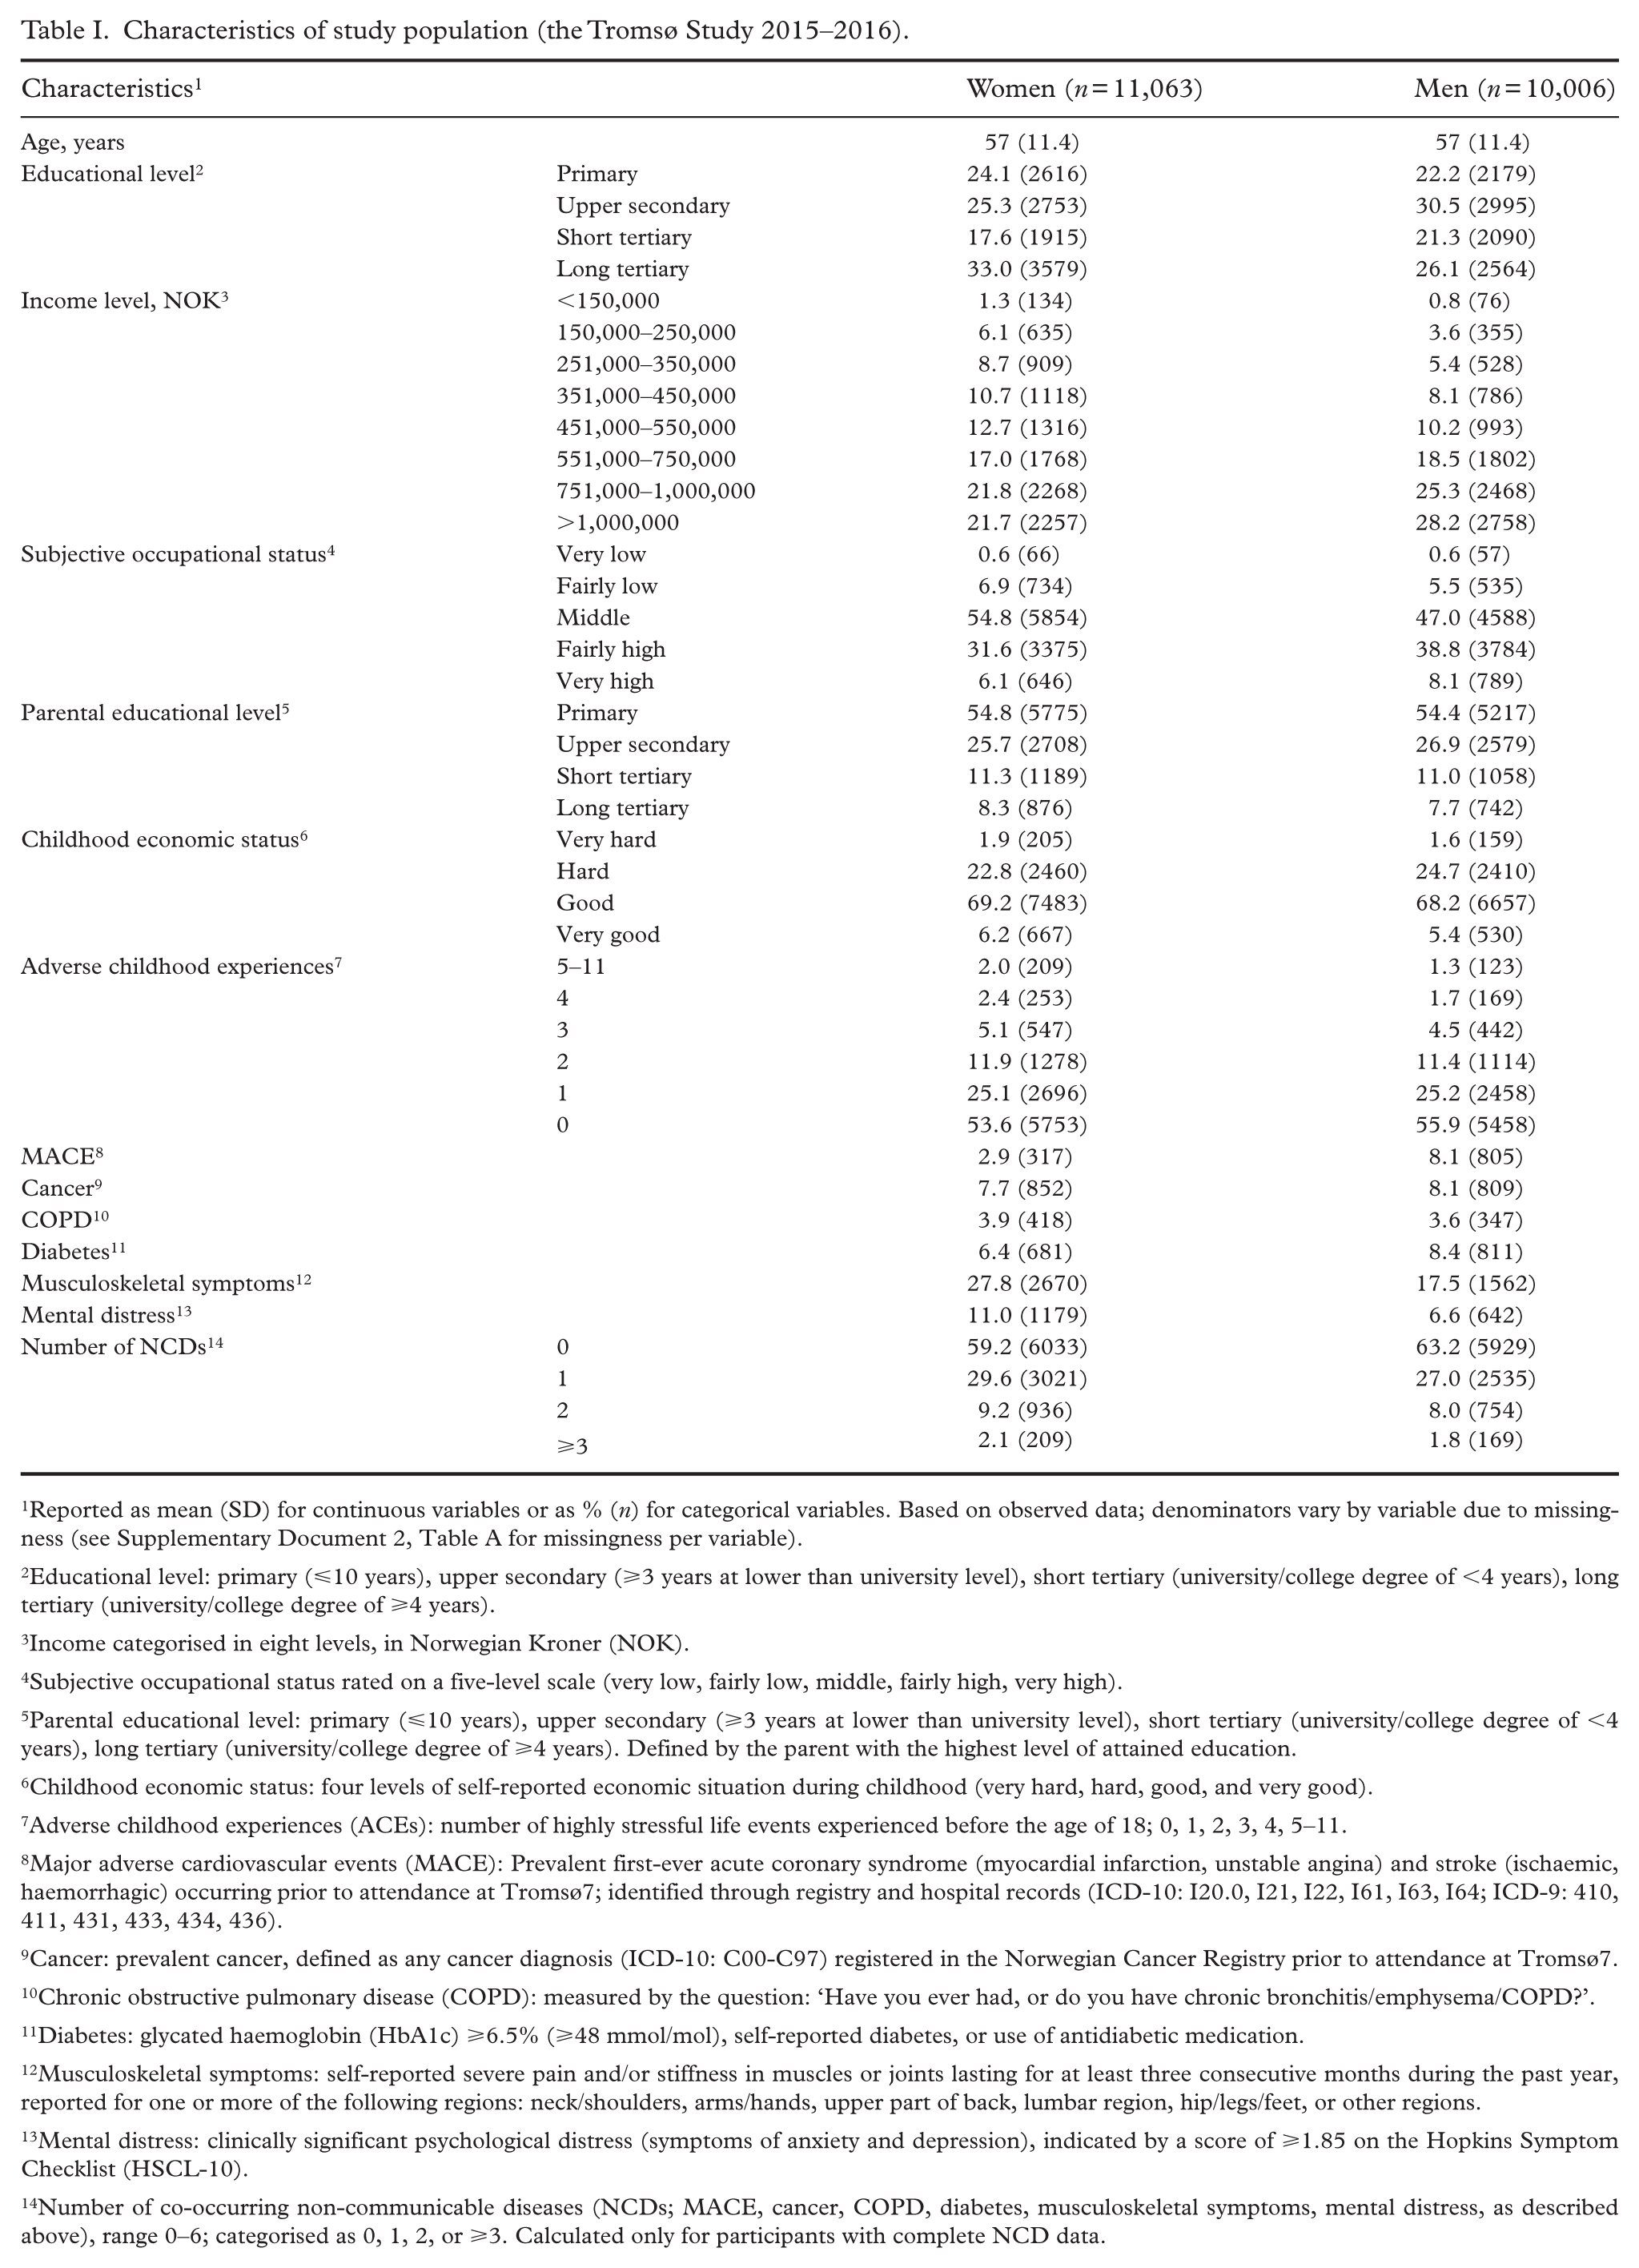
Reported as mean (SD) for continuous variables or as % (n) for categorical variables. Based on observed data; denominators vary by variable due to missingness (see Supplementary Document 2, Table A for missingness per variable).
Educational level: primary (⩽10 years), upper secondary (⩾3 years at lower than university level), short tertiary (university/college degree of <4 years), long tertiary (university/college degree of ⩾4 years).
Income categorised in eight levels, in Norwegian Kroner (NOK).
Subjective occupational status rated on a five-level scale (very low, fairly low, middle, fairly high, very high).
Parental educational level: primary (⩽10 years), upper secondary (⩾3 years at lower than university level), short tertiary (university/college degree of <4 years), long tertiary (university/college degree of ⩾4 years). Defined by the parent with the highest level of attained education.
Childhood economic status: four levels of self-reported economic situation during childhood (very hard, hard, good, and very good).
Adverse childhood experiences (ACEs): number of highly stressful life events experienced before the age of 18; 0, 1, 2, 3, 4, 5–11.
Major adverse cardiovascular events (MACE): Prevalent first-ever acute coronary syndrome (myocardial infarction, unstable angina) and stroke (ischaemic, haemorrhagic) occurring prior to attendance at Tromsø7; identified through registry and hospital records (ICD-10: I20.0, I21, I22, I61, I63, I64; ICD-9: 410, 411, 431, 433, 434, 436).
Cancer: prevalent cancer, defined as any cancer diagnosis (ICD-10: C00-C97) registered in the Norwegian Cancer Registry prior to attendance at Tromsø7.
Chronic obstructive pulmonary disease (COPD): measured by the question: ‘Have you ever had, or do you have chronic bronchitis/emphysema/COPD?’.
Diabetes: glycated haemoglobin (HbA1c) ⩾6.5% (⩾48 mmol/mol), self-reported diabetes, or use of antidiabetic medication.
Musculoskeletal symptoms: self-reported severe pain and/or stiffness in muscles or joints lasting for at least three consecutive months during the past year, reported for one or more of the following regions: neck/shoulders, arms/hands, upper part of back, lumbar region, hip/legs/feet, or other regions.
Mental distress: clinically significant psychological distress (symptoms of anxiety and depression), indicated by a score of ⩾1.85 on the Hopkins Symptom Checklist (HSCL-10).
Number of co-occurring non-communicable diseases (NCDs; MACE, cancer, COPD, diabetes, musculoskeletal symptoms, mental distress, as described above), range 0–6; categorised as 0, 1, 2, or ⩾3. Calculated only for participants with complete NCD data.
Main results
Sex differences
Statistically significant differences (p < 0.05) between women and men were observed for childhood economic status and diabetes (Supplementary Tables 2 and 3).
MACE
Lower educational and income levels were associated with higher odds of MACE in both sexes (Figure 1(a)). In women, ORs were 1.98 (95% CI 1.21–3.23) for educational level, and 2.47 (1.39–4.39) for income level. Corresponding ORs in men were 1.72 (1.30–2.28) and 2.34 (1.70–3.22). In men, MACE was also associated with lower parental educational level (1.89, 1.31–2.73) and subjective occupational status (1.69, 1.25–2.29).
Cancer
Greater disadvantage was associated with lower odds of cancer for parental educational level in women (OR 0.70, 95% CI 0.52–0.94) (Figure 1(a)). In men, lower odds of cancer were observed for lower educational level (OR 0.71, 0.54–0.93) and income level (OR 0.66, 0.48–0.90). These findings were explored further in sensitivity analyses.
COPD
Statistically significant higher odds of COPD were observed for childhood economic disadvantage in women, and for ACEs, educational and income levels, and subjective occupational status in both sexes (Figure 1(b)). The steepest gradients were observed for income levels in both sexes (women: OR 5.07, 95% CI 3.30–7.81; men: 8.39, 5.21–13.51).
Diabetes
Apart from the noted sex difference in the association with childhood economic status, all inequality indicators were significantly associated with higher odds of diabetes in both sexes (Figure 1(b)). The steepest gradients were observed in women for income level (OR 3.51, 95% CI 2.50–4.92) and educational level (OR 3.39, 2.46–4.69).
Musculoskeletal symptoms
All inequality indicators were significantly associated with higher odds of musculoskeletal symptoms in both sexes (Figure 1(c)). Educational level and income level showed the steepest gradients (women: OR 3.34, 95% CI 2.81–3.98 and 3.26, 2.73–3.90; men: 3.26, 2.64–4.03 and 3.11, 2.52–3.84).
Mental distress
The steepest gradients for mental distress were observed for ACEs in both sexes (women: OR 7.81, 95% CI 6.20–9.86; men: 10.09, 7.34–13.88) (Figure 1(c)). Significant associations with higher odds of mental distress were also observed for childhood economic status, educational and income levels, and subjective occupational status in both sexes.
NCD sum score
All six inequality indicators were significantly associated (p < 0.001) with higher cumulative NCD burden in both women and men (Supplementary Table 12). The pattern of associations was broadly consistent with the individual NCD analyses. Income level showed the steepest gradients in both sexes (women: 3.91, 95% CI 3.36–4.55; men: 3.98, 3.38–4.67), followed by ACEs (women: 3.18, 2.74–3.68; men: 2.48, 2.10–2.91) and educational level (women: 3.04, 2.62–3.52; men: 2.37, 2.03–2.76). Parental educational level showed the weakest gradients (women: 1.33, 1.14–1.55; men: 1.36, 1.14–1.61). Although some ORs differed in magnitude between sexes, no statistically significant sex interactions were observed after accounting for multiple testing.
Inequality indicator correlations
Pairwise Spearman correlations between the inequality indicators were generally weak to moderate (ranging from −0.08 to 0.44), with similar patterns in women and men (Supplementary Table 11). The strongest correlations were observed between educational level and income level (r = 0.44 in women, 0.40 in men) and between parental and own educational level (r = 0.40 in women, 0.36 in men). ACEs showed weak or negligible correlations with the other indicators (r = −0.08 to 0.18), with the strongest being the association with childhood economic status (r = 0.18 in women, 0.13 in men).
Sensitivity analyses
Associations between inequality indicators and NCDs were re-examined in the original dataset using listwise deletion (Supplementary Tables 4 and 5). The observed ORs were consistent with those from the multiple imputation datasets. Additionally, modelling the inequality indicators as categorical variables yielded results that followed the same patterns as the primary analyses, though with smaller ORs for associations with steeper gradients (Supplementary Tables 6–9).
In the cancer sensitivity analyses (Supplementary Table 10), lower odds of prostate cancer in men were observed for educational level (OR 0.52, 95% CI 0.34–0.78) and income level (OR 0.39, 0.24–0.62), while no statistically significant gradient was observed for breast cancer in women. Lower odds of skin cancer were observed for educational level and income level in both sexes, for parental educational level in women (OR 0.34, 95% CI 0.15–0.76), and for subjective occupational status in men (OR 0.41, 0.19–0.90). After excluding breast cancer in women and prostate cancer in men, most significant associations from the main analysis were no longer present, although lower odds persisted for parental education in women (OR 0.60, 0.42–0.86). After additionally excluding skin cancer, this association was also attenuated and no longer statistically significant.
Discussion
This study systematically examined associations between six life-course inequality indicators and six NCDs within a single adult population. Relative disadvantage was associated with higher odds of MACE, COPD, diabetes, musculoskeletal symptoms, and mental distress, consistent with existing evidence from other high-income countries [3, 4, 13, 27]. In contrast, greater disadvantage was associated with lower odds of cancer for some indicators. This was largely explained by cancer types with known positive socioeconomic gradients, particularly prostate cancer in men and skin cancer in both sexes [25].
Patterns across indicators and outcomes
The associations varied in magnitude and consistency across inequality indicators, NCD outcomes, and sexes, with comparable patterns observed in the categorical sensitivity analyses. For musculoskeletal symptoms, statistically significant gradients were observed across all indicators for both sexes, potentially reflecting a shared embodiment of multiple aspects of disadvantage [28]. For mental distress, the gradients were considerably steeper for ACEs, income, occupational status, and childhood economic status than for educational level. This pattern suggests that studies relying on education alone may substantially underestimate mental health inequalities. For MACE, associations were primarily observed for education, income, and occupational status, with no statistically significant associations for childhood economic status and ACEs. This may suggest that adult socioeconomic circumstances reflect more proximal pathways for cardiovascular outcomes [29]. More broadly, parental educational level was the weakest indicator across nearly all NCDs, possibly reflecting its distal position, with effects possibly mediated through own education and other adult circumstances [29]. The modest intercorrelations between the inequality indicators in this study suggest that they reflect multiple, partly distinct dimensions of disadvantage [6, 9]. Future studies could explore how these dimensions interact in their associations with both individual and multiple NCDs. When examining overall disease burden, our analysis showed that greater disadvantage on all six inequality indicators was associated with higher odds of NCD accumulation in both sexes. This is consistent with recent meta-analytic evidence of a dose-dependent relationship between childhood adversity and multimorbidity [30]. The magnitude of associations varied somewhat between women and men, but no clear sex-specific pattern emerged across the six indicators.
Life-course perspectives
Our findings suggest that childhood factors, along with socioeconomic conditions acquired in early adulthood, such as educational level, may have enduring impacts on health. We observed particularly strong associations between childhood inequality indicators and mental distress, with the most pronounced effects seen for ACEs. This highlights the profound impact early life adversity may have on mental health, persisting into adulthood [27]. Individuals exposed to ACEs are also more likely to experience stressful life events in adulthood, which may compound the adverse effects on health [31]. Childhood disadvantage was also associated with higher odds of MACE, COPD, diabetes, and musculoskeletal symptoms, further supporting a pathway between early life determinants and a wide range of NCDs [4, 27, 29, 32]. This relationship may in part be mediated by health behaviours and adult socioeconomic position [29]. Nevertheless, disadvantage during early life has been identified as a health risk independent of these factors, likely through biological embedding of neuroendocrine, immune, and metabolic dysregulation associated with NCDs [10, 33]. A cumulative model proposes that disease risk is driven by a cascade of physiological imbalances interacting with physical and psychosocial stressors over time [9, 10, 12]. While our cross-sectional approach does not allow us to disentangle these pathways, the consistent associations across all six inequality indicators underscore the importance of addressing social and economic disadvantage across multiple domains and life stages.
Sex differences
The stronger association between childhood economic status and diabetes in women may reflect sex differences in early life exposures, health behaviours, or biological susceptibility to metabolic conditions [34]. The lack of other statistically significant sex differences in our study may suggest that the pathways linking social and economic disadvantage to NCD risk operate similarly in men and women. However, further research on sex-specific patterns in the different domains of socioeconomic inequalities in NCDs is warranted.
Limitations
Tromsø has a higher concentration of residents with university-level education than the national average, which may compress the socioeconomic distribution and attenuate the observed gradients. Additionally, the 65% attendance rate raises the possibility of selection bias, as non-participants in Tromsø7 were more likely to have a lower socioeconomic position across several indicators [18]. If non-participation was also associated with poorer health within lower socioeconomic groups, this could further attenuate the observed inequalities. The patterns of associations are nevertheless consistent with findings from other Nordic and European populations [3, 13].
Individuals with severe health conditions, such as advanced cancer or MACE, may have died or been unable to participate, introducing survivor bias that could have underestimated the true associations. This may be particularly relevant for cancer, where higher socioeconomic position is associated with earlier detection and improved cancer prognosis, likely due to greater health awareness and increased participation in screening programmes [35]. This could potentially lead to differential survival and overrepresentation of socioeconomically privileged cancer survivors in the study population.
Furthermore, we chose broad NCD categories to illustrate how the overall burden of NCDs is distributed across inequality markers in a general population. These broad categories, such as MACE, cancer, musculoskeletal symptoms, and mental distress, comprise distinct diseases that may have different risk factors, causes, and outcomes. This heterogeneity within outcome categories may obscure associations, as the relationships between socioeconomic indicators and specific diseases within a category may differ substantially [25].
Another potential limitation is the possibility of misclassification due to the use of self-reported data for the inequality indicators and certain health outcomes. For example, participants may have overreported educational attainment or income to align with perceived social norms, and recall inaccuracies may have affected reports of childhood experiences. Similarly, the self-reported health outcomes COPD, mental distress, and musculoskeletal symptoms may have been subject to variability in individual or sex-specific health perceptions. Additionally, the occupational status measure captures self-perceived rather than objective occupational class, and the concentration of responses in the middle category may have attenuated the observed gradient for this indicator.
While the observed associations provide valuable insights, our cross-sectional design does not allow for confirming pathways from social and economic indicators to NCD outcomes. The reverse is also possible, as pre-existing health conditions may influence adult socioeconomic position. This concern is most acute for the registry-based outcomes MACE and cancer, which may have been diagnosed years before attendance at Tromsø7, while income and occupational status were measured at the time of participation. For income level, we observed particularly steep gradients of relative inequality across all the studied NCDs. It remains unknown whether these gradients primarily reflect important pathways from income level to NCD outcomes, or whether income level is, at least in part, influenced by the burden of living with an NCD. These limitations highlight the need for future studies with a longitudinal approach to understand how multiple dimensions of social and economic disadvantage across the life-course contribute to inequalities in NCDs during adulthood.
Conclusion
Life-course social and economic disadvantage was associated with higher odds of MACE, COPD, diabetes, musculoskeletal symptoms, and mental distress, with the pattern and magnitude varying across inequality indicators and NCDs. The associations were especially consistent for musculoskeletal symptoms across all inequality indicators. The steepest gradients were observed for ACEs in the association with mental distress in both sexes. Lower odds of cancer among more disadvantaged groups were largely explained by cancer types with known positive socioeconomic gradients. The findings illustrate the value of examining multiple inequality indicators and NCD outcomes within the same study to identify patterns not apparent from separate analyses.
Supplemental Material
sj-docx-1-sjp-10.1177_14034948261453066 – Supplemental material for Life-course social and economic inequalities in non-communicable disease prevalence: the Tromsø Study (2015–2016)
Supplemental material, sj-docx-1-sjp-10.1177_14034948261453066 for Life-course social and economic inequalities in non-communicable disease prevalence: the Tromsø Study (2015–2016) by Rebecca A. Hetland, Tom Wilsgaard, Laila A. Hopstock, Inger Ariansen, Jonas Johansson, Bjarne K. Jacobsen, Jens C. Thimm, Catharina E. Arfwedson Wang and Sameline Grimsgaard in Scandinavian Journal of Public Health
Supplemental Material
sj-docx-10-sjp-10.1177_14034948261453066 – Supplemental material for Life-course social and economic inequalities in non-communicable disease prevalence: the Tromsø Study (2015–2016)
Supplemental material, sj-docx-10-sjp-10.1177_14034948261453066 for Life-course social and economic inequalities in non-communicable disease prevalence: the Tromsø Study (2015–2016) by Rebecca A. Hetland, Tom Wilsgaard, Laila A. Hopstock, Inger Ariansen, Jonas Johansson, Bjarne K. Jacobsen, Jens C. Thimm, Catharina E. Arfwedson Wang and Sameline Grimsgaard in Scandinavian Journal of Public Health
Supplemental Material
sj-docx-11-sjp-10.1177_14034948261453066 – Supplemental material for Life-course social and economic inequalities in non-communicable disease prevalence: the Tromsø Study (2015–2016)
Supplemental material, sj-docx-11-sjp-10.1177_14034948261453066 for Life-course social and economic inequalities in non-communicable disease prevalence: the Tromsø Study (2015–2016) by Rebecca A. Hetland, Tom Wilsgaard, Laila A. Hopstock, Inger Ariansen, Jonas Johansson, Bjarne K. Jacobsen, Jens C. Thimm, Catharina E. Arfwedson Wang and Sameline Grimsgaard in Scandinavian Journal of Public Health
Supplemental Material
sj-docx-2-sjp-10.1177_14034948261453066 – Supplemental material for Life-course social and economic inequalities in non-communicable disease prevalence: the Tromsø Study (2015–2016)
Supplemental material, sj-docx-2-sjp-10.1177_14034948261453066 for Life-course social and economic inequalities in non-communicable disease prevalence: the Tromsø Study (2015–2016) by Rebecca A. Hetland, Tom Wilsgaard, Laila A. Hopstock, Inger Ariansen, Jonas Johansson, Bjarne K. Jacobsen, Jens C. Thimm, Catharina E. Arfwedson Wang and Sameline Grimsgaard in Scandinavian Journal of Public Health
Supplemental Material
sj-docx-3-sjp-10.1177_14034948261453066 – Supplemental material for Life-course social and economic inequalities in non-communicable disease prevalence: the Tromsø Study (2015–2016)
Supplemental material, sj-docx-3-sjp-10.1177_14034948261453066 for Life-course social and economic inequalities in non-communicable disease prevalence: the Tromsø Study (2015–2016) by Rebecca A. Hetland, Tom Wilsgaard, Laila A. Hopstock, Inger Ariansen, Jonas Johansson, Bjarne K. Jacobsen, Jens C. Thimm, Catharina E. Arfwedson Wang and Sameline Grimsgaard in Scandinavian Journal of Public Health
Supplemental Material
sj-docx-4-sjp-10.1177_14034948261453066 – Supplemental material for Life-course social and economic inequalities in non-communicable disease prevalence: the Tromsø Study (2015–2016)
Supplemental material, sj-docx-4-sjp-10.1177_14034948261453066 for Life-course social and economic inequalities in non-communicable disease prevalence: the Tromsø Study (2015–2016) by Rebecca A. Hetland, Tom Wilsgaard, Laila A. Hopstock, Inger Ariansen, Jonas Johansson, Bjarne K. Jacobsen, Jens C. Thimm, Catharina E. Arfwedson Wang and Sameline Grimsgaard in Scandinavian Journal of Public Health
Supplemental Material
sj-docx-5-sjp-10.1177_14034948261453066 – Supplemental material for Life-course social and economic inequalities in non-communicable disease prevalence: the Tromsø Study (2015–2016)
Supplemental material, sj-docx-5-sjp-10.1177_14034948261453066 for Life-course social and economic inequalities in non-communicable disease prevalence: the Tromsø Study (2015–2016) by Rebecca A. Hetland, Tom Wilsgaard, Laila A. Hopstock, Inger Ariansen, Jonas Johansson, Bjarne K. Jacobsen, Jens C. Thimm, Catharina E. Arfwedson Wang and Sameline Grimsgaard in Scandinavian Journal of Public Health
Supplemental Material
sj-docx-6-sjp-10.1177_14034948261453066 – Supplemental material for Life-course social and economic inequalities in non-communicable disease prevalence: the Tromsø Study (2015–2016)
Supplemental material, sj-docx-6-sjp-10.1177_14034948261453066 for Life-course social and economic inequalities in non-communicable disease prevalence: the Tromsø Study (2015–2016) by Rebecca A. Hetland, Tom Wilsgaard, Laila A. Hopstock, Inger Ariansen, Jonas Johansson, Bjarne K. Jacobsen, Jens C. Thimm, Catharina E. Arfwedson Wang and Sameline Grimsgaard in Scandinavian Journal of Public Health
Supplemental Material
sj-docx-7-sjp-10.1177_14034948261453066 – Supplemental material for Life-course social and economic inequalities in non-communicable disease prevalence: the Tromsø Study (2015–2016)
Supplemental material, sj-docx-7-sjp-10.1177_14034948261453066 for Life-course social and economic inequalities in non-communicable disease prevalence: the Tromsø Study (2015–2016) by Rebecca A. Hetland, Tom Wilsgaard, Laila A. Hopstock, Inger Ariansen, Jonas Johansson, Bjarne K. Jacobsen, Jens C. Thimm, Catharina E. Arfwedson Wang and Sameline Grimsgaard in Scandinavian Journal of Public Health
Supplemental Material
sj-docx-8-sjp-10.1177_14034948261453066 – Supplemental material for Life-course social and economic inequalities in non-communicable disease prevalence: the Tromsø Study (2015–2016)
Supplemental material, sj-docx-8-sjp-10.1177_14034948261453066 for Life-course social and economic inequalities in non-communicable disease prevalence: the Tromsø Study (2015–2016) by Rebecca A. Hetland, Tom Wilsgaard, Laila A. Hopstock, Inger Ariansen, Jonas Johansson, Bjarne K. Jacobsen, Jens C. Thimm, Catharina E. Arfwedson Wang and Sameline Grimsgaard in Scandinavian Journal of Public Health
Supplemental Material
sj-docx-9-sjp-10.1177_14034948261453066 – Supplemental material for Life-course social and economic inequalities in non-communicable disease prevalence: the Tromsø Study (2015–2016)
Supplemental material, sj-docx-9-sjp-10.1177_14034948261453066 for Life-course social and economic inequalities in non-communicable disease prevalence: the Tromsø Study (2015–2016) by Rebecca A. Hetland, Tom Wilsgaard, Laila A. Hopstock, Inger Ariansen, Jonas Johansson, Bjarne K. Jacobsen, Jens C. Thimm, Catharina E. Arfwedson Wang and Sameline Grimsgaard in Scandinavian Journal of Public Health
Footnotes
Acknowledgements
We thank the participants of the Tromsø Study for their invaluable contribution to this research.
Declaration of conflicting interests
The authors declared no potential conflicts of interest with respect to the research, authorship, and/or publication of this article.
Funding
The authors received no financial support for the research, authorship, and/or publication of this article.
Supplemental material
Supplemental material for this article is available online.
References
Supplementary Material
Please find the following supplemental material available below.
For Open Access articles published under a Creative Commons License, all supplemental material carries the same license as the article it is associated with.
For non-Open Access articles published, all supplemental material carries a non-exclusive license, and permission requests for re-use of supplemental material or any part of supplemental material shall be sent directly to the copyright owner as specified in the copyright notice associated with the article.