
Abstract
Objective
Thoracolumbar fractures (T11–L2) are common spinal injuries, and accurate classification is essential for treatment planning. However, diagnosis remains challenging because of complex fracture morphology and variability in clinical experience. This study evaluated the feasibility of a deep learning framework for automated classification of thoracolumbar fractures using CT images.
Methods
A retrospective study was conducted using CT images from 596 patients with thoracolumbar fractures. A convolutional neural network based on a Multiple Instance Learning (MIL) framework was developed, using AlexNet with a gated attention mechanism for feature aggregation. Separate models were trained for coronal (Z-type) and axial (S-type) views, and an ensemble strategy combined the two predictions. Model performance was compared with that of interns and senior physicians.
Results
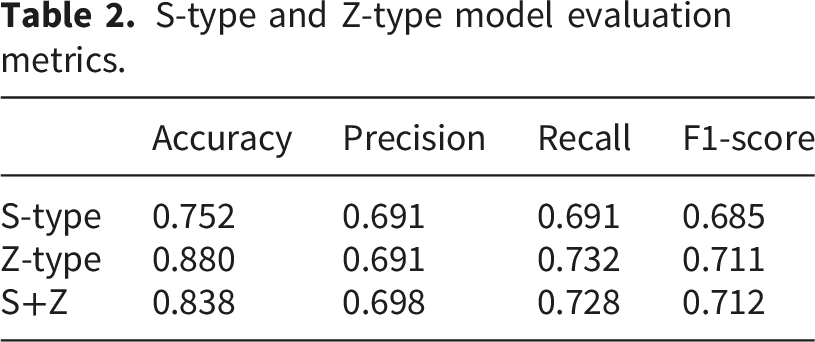
The S-type model achieved a classification accuracy of 75.2%, while the Z-type model achieved an accuracy of 88.0%. The ensemble model reached an overall accuracy of 83.8%. With assistance from the deep learning model, the diagnostic accuracy of interns improved from 74% to 95%, approaching the performance of senior physicians (98%).
Conclusion
The proposed deep learning framework showed promising performance for automated classification of thoracolumbar fractures and may serve as a decision-support tool to improve diagnostic efficiency.
Introduction
Thoracolumbar fractures (T11-L2) are a common type of traumatic injury, accounting for approximately 50%-70% of all spinal cord injuries. 1 The thoracolumbar segment is located in the transition zone between the relatively fixed thoracic spine and the more mobile lumbar spine, where the spinal cord transitions to the cauda equina. This unique anatomical structure contributes to the high incidence of both thoracolumbar fractures and associated spinal cord injuries. Accurate diagnosis of thoracolumbar fractures is crucial for determining subsequent treatment and prognosis, making it a key aspect of clinical management and therapy for these injuries.
According to the new AO Spine classification system for thoracolumbar fractures, the diagnosis of thoracolumbar fractures should involve a comprehensive assessment of both fracture morphology and neurological function. 2 The AO Spine thoracolumbar fracture classification categorizes fractures into several morphological subtypes (A0–A4 and related variants) according to the degree of vertebral compression, structural disruption, and involvement of the spinal columns (Figure S1). The morphological diagnosis of the fracture should be based on the extent of injury to the anterior, middle, and posterior columns of the spine. Therefore, the morphological evaluation of fractures relies heavily on imaging modalities such as X-ray, CT, and MRI. However, due to the irregular shape of vertebrae, the complexity of paraspinal soft tissues, and the relatively low resolution of imaging data, combined with variations in clinical expertise, it is often challenging and time-consuming for radiologists and clinicians to make accurate morphological diagnoses of thoracolumbar fractures. 3 This can lead to a high rate of misdiagnosis. In many primary healthcare settings, these issues are exacerbated by outdated medical information systems and lower-quality imaging equipment, making the thorough identification and precise classification of thoracolumbar fractures impractical. Therefore, developing efficient and reliable computer-assisted tools to support fracture identification and classification has become an important clinical need.
Currently, relatively few studies have explored deep learning approaches for the morphological diagnosis and classification of thoracolumbar fractures. Based on the considerations discussed above, it is reasonable to investigate whether deep learning techniques can be applied to analyze thoracolumbar fracture imaging data. In this study, we developed a deep learning–based framework for the automated morphological classification of thoracolumbar fractures using CT images. The proposed framework integrates a Multiple Instance Learning strategy with a gated attention mechanism, allowing the model to aggregate information from multiple CT slices to generate vertebra-level predictions. In addition, an ensemble strategy combining S-Type and Z-Type models was introduced to improve classification robustness across different fracture categories. By leveraging a large volume of high-quality clinical imaging data, the proposed system aims to provide a potential decision-support tool to assist clinicians in improving diagnostic efficiency and reducing potential misclassification in thoracolumbar fracture assessment.
Materials and methods
Given that the study is retrospective and poses minimal risk, we obtained approval to waive the requirement for informed consent.
Dataset preparation
CT imaging data of all thoracolumbar fracture patients since 2005 were collected from the Medical Imaging Center of the First Affiliated Hospital of Chongqing Medical University, with statistical analysis based on initial diagnoses and hospitalization occurrences.
Inclusion and exclusion criteria
The inclusion criteria were as follows: (1) acute thoracolumbar fractures involving the T11–L2 vertebral levels; (2) patients aged 18–65 years; (3) complete CT imaging data including bone window images and sagittal reconstruction.
The exclusion criteria were as follows: (1) osteoporotic or pathological fractures; (2) history of thoracolumbar spinal surgery; (3) severe spinal degeneration; (4) incomplete CT imaging data; (5) multiple vertebral fractures.
Sample size justification
The sample size was determined based on the availability of eligible cases in the retrospective imaging database of the participating institution. All patients who met the predefined inclusion and exclusion criteria during the study period were included in the analysis. Including all available cases helped maximize the dataset size and improve the robustness of the deep learning model.
The experimental data for this study includes spinal CT images from 596 patients and non-patients, which are categorized into two types of images: s-type (axial view) and z-type (coronal view). These two types of images encompass various fracture types as well as non-fracture types, with a total of 6 categories (Figure S6).
As shown in the diagram, the dataset is subdivided into six types, ranging from A0 to AZ, with AZ representing the non-fracture, normal type. Each fracture type has a corresponding case folder (e.g., 001, 002, etc.), and within each case folder, there are 5 s-type (axial view) and 5 z-type (coronal view) images. The “classic” folder contains the specific fracture images from each case folder. Notably, since AZ represents the non-fracture type, there is no “classic” folder for AZ. It is important to highlight that A0 fractures are typically diagnosed through the observation of s-type images, so there are no A0 fracture images in the z-type category. Finally, the internal dataset is randomly split into training and validation sets, with 80% of the data allocated to the training set and 20% to the validation set. This split is acceptable for deep learning (DL) datasets (Figure 1(a), Figure 1(b)). Representative original and preprocessed CT images used for model training. (A)Axial images (s-type) (B)coronal images (z-type) (C)Affine transformed images (D)randomly cropped images.
Data preprocessing
Data augmentation
During the data preprocessing phase, a series of image processing techniques were applied to enhance the model’s generalization ability and robustness. For the training set images, the following steps were performed: first, the images were resized to 256x256 pixels. Then, random affine transformations (such as rotation, translation, and scaling) were applied to increase data diversity (Figure 1(c)). The images were then randomly cropped to 224x224 pixels, followed by random horizontal flipping and rotation (Figure 1(d)). Finally, the images were converted to tensors and normalized with a mean of 0.5 and a standard deviation of 0.5. For the validation set images, the preprocessing steps included resizing the images to 256x256 pixels, center cropping them to 224x224 pixels, and normalizing them. The final data loader returned image data with a shape of [1, 5, 3, 224, 224], representing 1 batch, 5 instance images, 3 channels, and each image sized at 224x224 pixels.
Label mapping
In this study, label mapping was implemented using the Multiple Instance Learning (MIL) approach. MIL
4
is a typical form of weakly supervised learning. The key characteristic of traditional supervised learning is the use of clearly labeled data for training models to predict the labels of new data. In contrast, MIL is a specialized form of supervised learning where labels are assigned to a “bag” of instances rather than individual instances. The model must extract information from multiple instances to determine the label of the entire bag. In other words, in a MIL problem, the training process is based on bags, where the individual instances within the bag are neither dependent on one another nor ordered in any particular way. If all instances in a bag are classified as negative, the bag’s label will also be classified as negative. Conversely, if any instance in the bag is classified as positive, the bag’s label will be classified as positive. For example, in the context of this study, the determination of bag labels would be as follows:

In this study, the label mapping was designed to accommodate the multiple label categories present in the medical image classification task. The original dataset contains six label categories, labeled as 0, 1, 2, 3, 4, and 5. To optimize the classification process, we applied a specific mapping process to these labels. For each case folder, the bag labels were assigned based on whether fracture images for each task (s-type or z-type) existed in the “classic” folder. For example, in the A0 type, if case folder 001 only contains s4. jpg and s5. jpg in the “classic” folder, the bag label for the s-type task would be A0, while for the z-type task, it would be AZ (non-fracture type). For the s-type task, label categories were directly mapped following the normal classification rules. However, in the z-type task, we implemented a hierarchical label mapping, where labels were divided into major categories and subcategories. The subcategories remained the original six label categories, while the major categories grouped similar fracture types into broader categories. For example, labels 1 and 2 were mapped to one major category, while labels 3 and 4 were mapped to another major category. Since the z-type dataset does not contain A0-type fracture data, the z-type images in the A0 folder were labeled as AZ (non-fracture type). In the final data loader, for the s-type classification task, a two-dimensional label was returned in the shape, 5 where the first dimension represents the bag label and the second dimension represents the instance labels. For the z-type task, a three-dimensional label was returned in the shape, with the first two dimensions the same as the s-type task, and the third dimension storing the major category label.
In the final step of merging the s-type and z-type model predictions, we reprocess the bag labels. Specifically, if a fracture image exists in the “classic” folder, the bag label is set to the current fracture type label. For instance, in the above example, the bag label for case 001 would be set to A0. This label mapping strategy not only simplifies the complexity of the classification task but also improves the accuracy and robustness of the classification process. Then we calculate the number of training sets and verification sets in s-type and z-type respectively (Figure 2(a) and (b)). Based on the above data, we calculate the combined prediction accuracy (Figure 2(c)). Distribution of the training and validation datasets. (A)s-type training set and verification set distribution (s-type) (B)z-type training set and verification set distribution (C)Verification set sample label distribution used in joint prediction.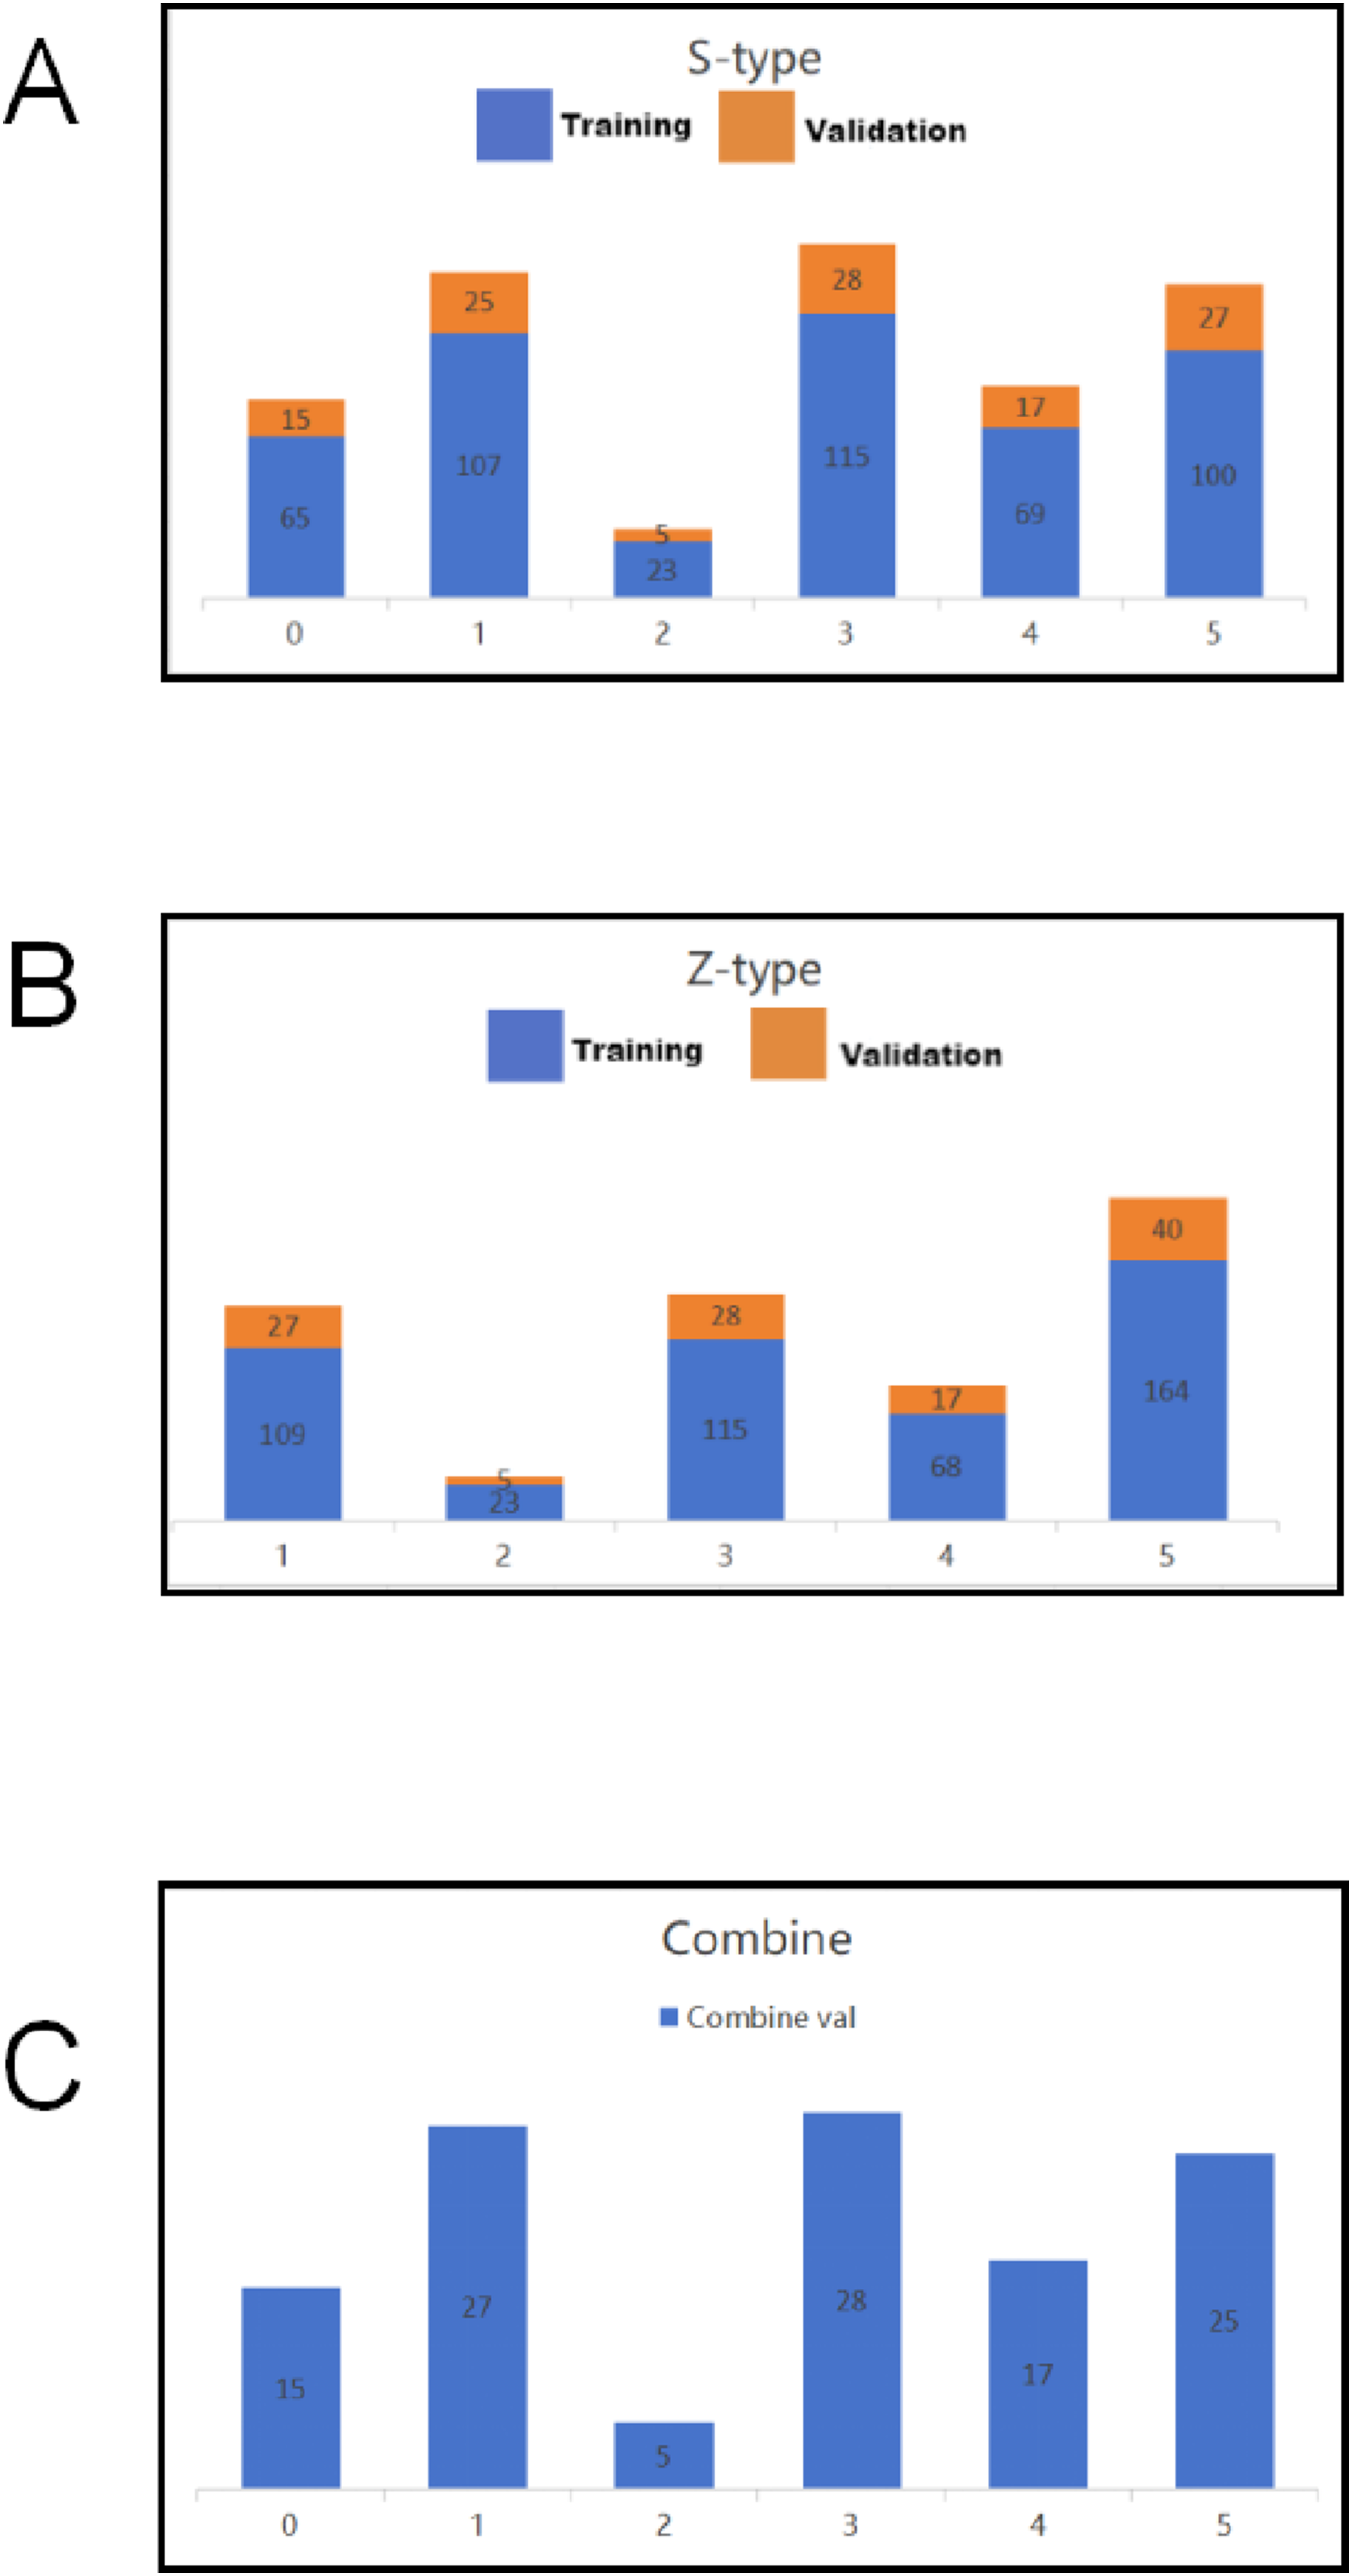
Algorithm preparation
Model design
In this study, we designed a convolutional neural network (CNN) model for classifying thoracolumbar fractures in CT images based on a Multiple Instance Learning (MIL) framework (Figure 3). The MIL framework was adopted because CT examinations typically contain multiple image slices for each vertebra, and the fracture pattern may only be visible in a subset of slices. By treating a group of images as a “bag,” the model can learn both slice-level and vertebra-level features. Overview of the proposed model architecture.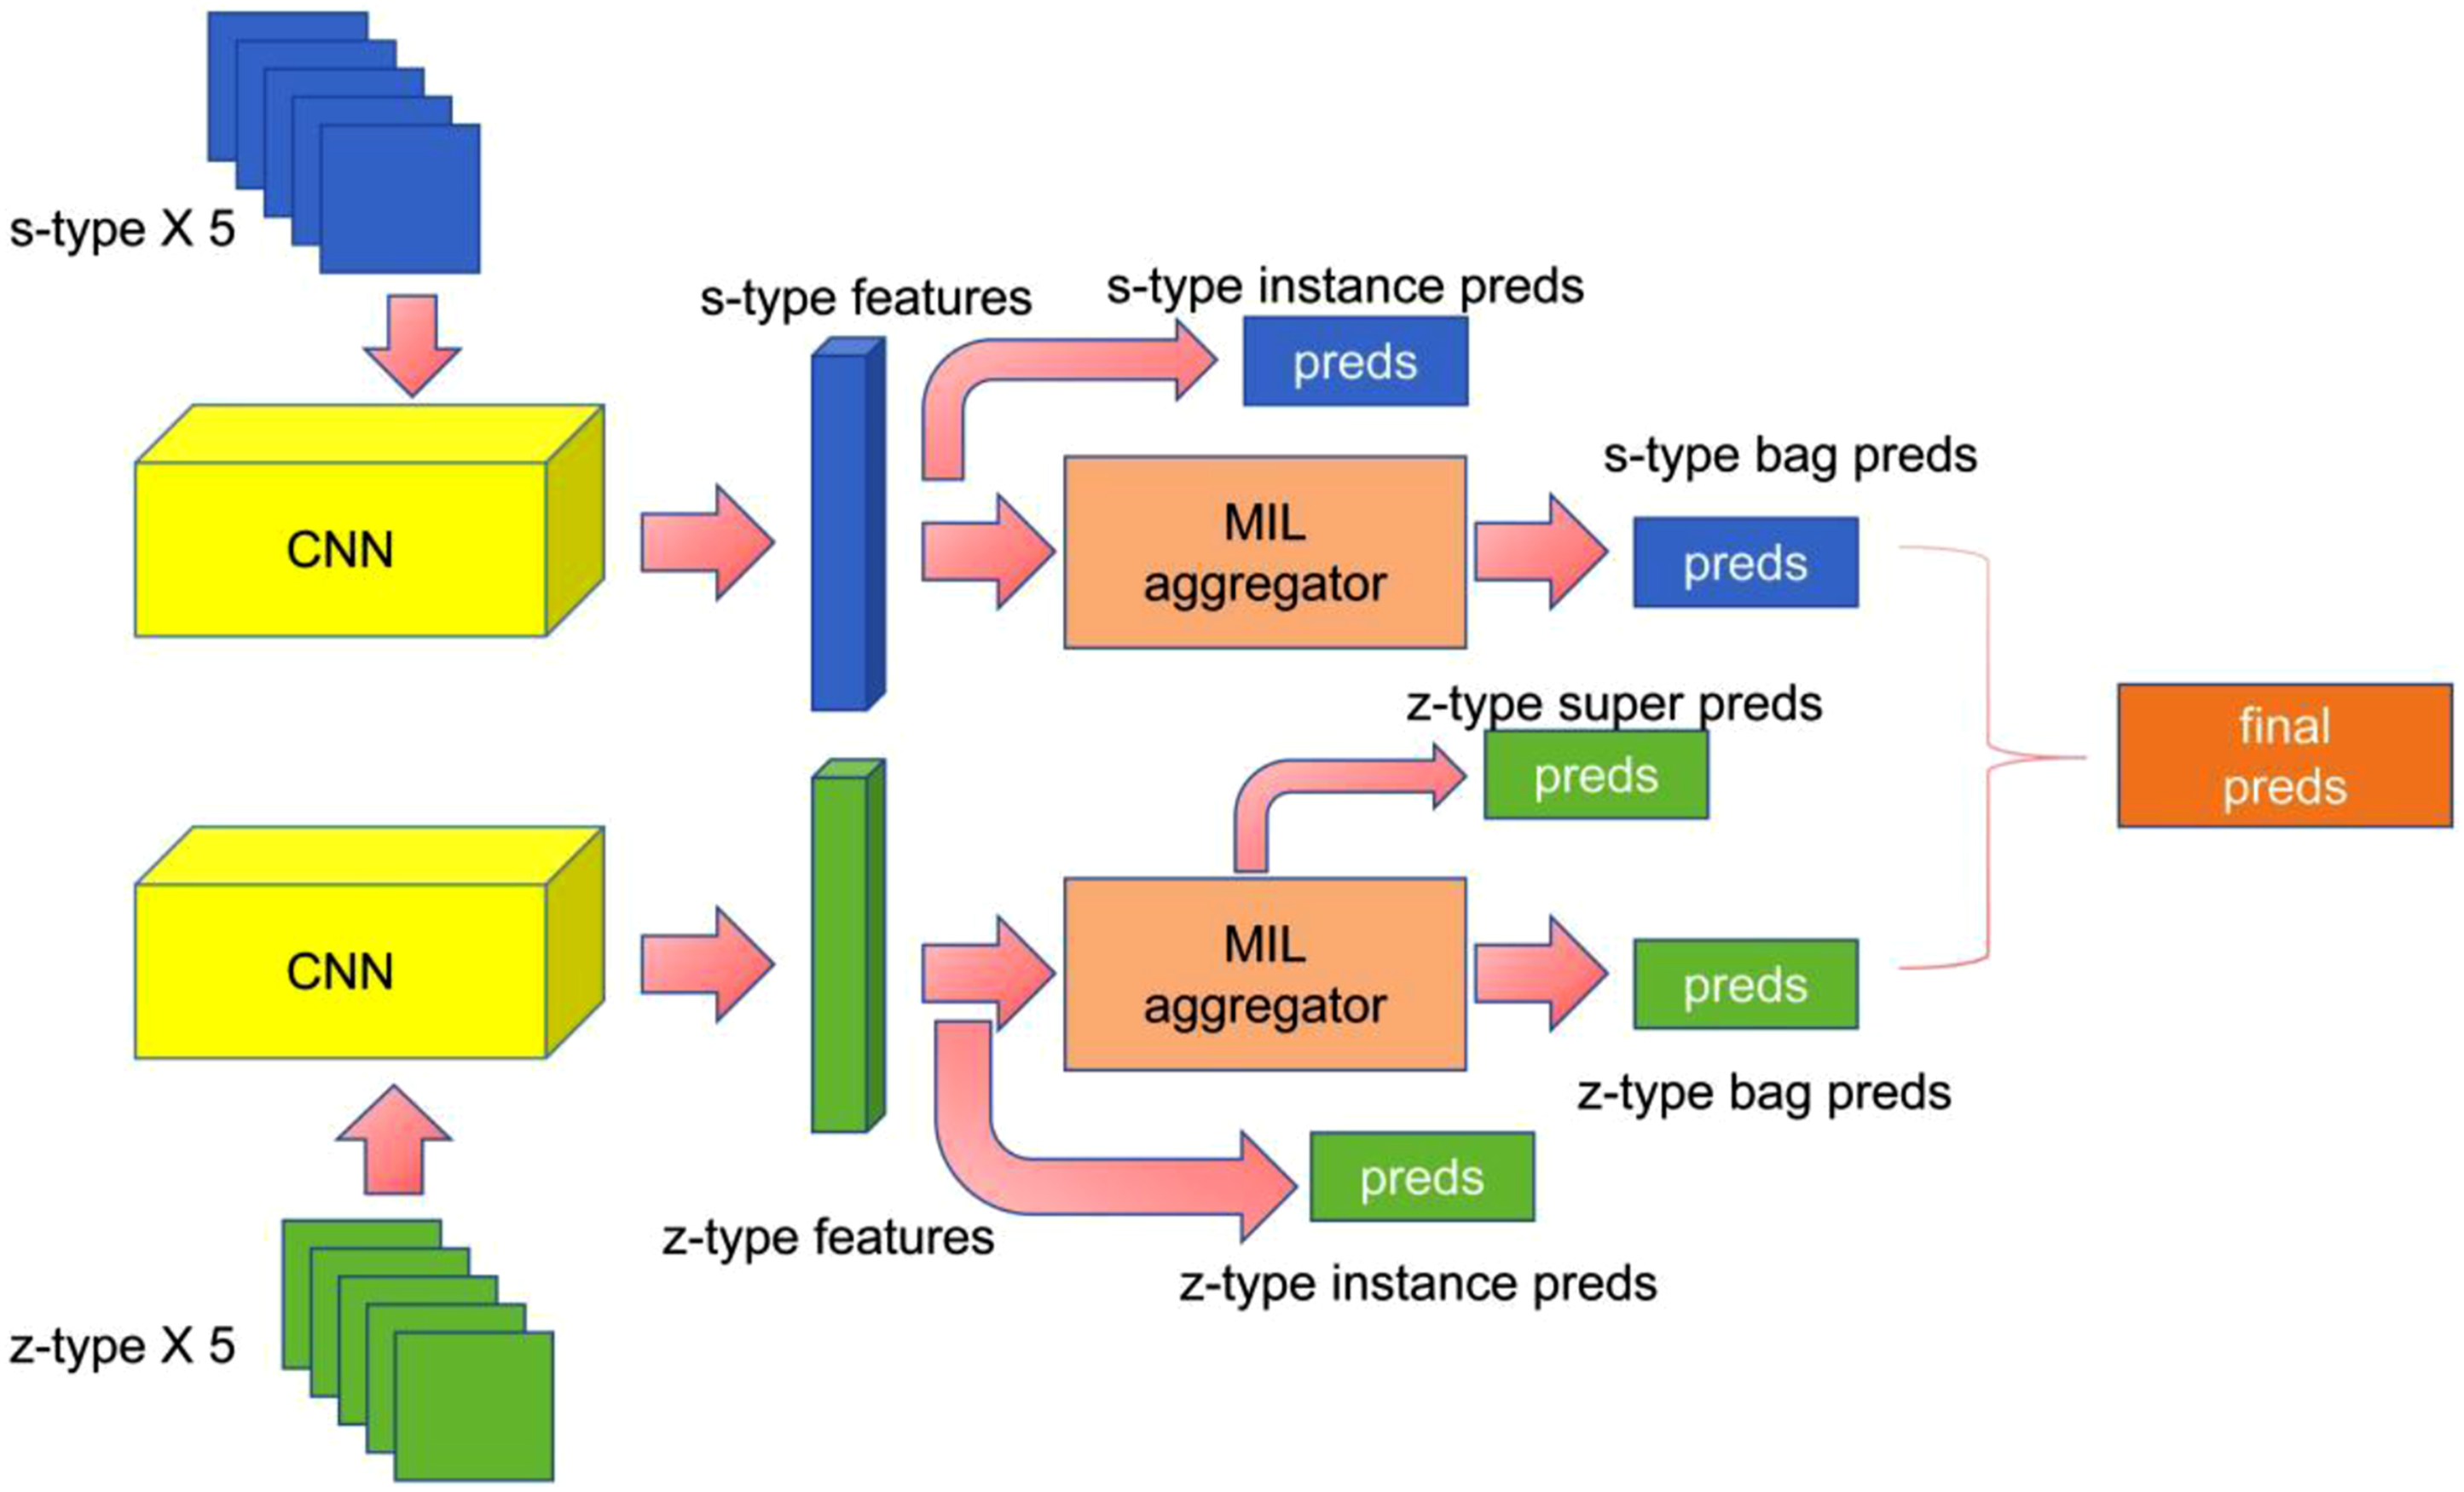
As shown in Figure 3, five s-type and five z-type images are grouped and processed through a CNN to extract feature representations, denoted as H. These feature representations capture the visual characteristics of vertebral structures and potential fracture patterns. The extracted features H are then aggregated using a gated attention mechanism to generate predictions for both the bag label and the super category (major category). The attention mechanism allows the model to assign higher weights to slices that contain more informative fracture features. Additionally, the features H are directly used for instance-level predictions. After training both the s-type and z-type models, their predictions are combined to determine the final bag label. This ensemble strategy integrates information from different CT views and improves the robustness of classification. The instance predictions (instance preds) and super category predictions (super preds) generated by the model are subsequently used for loss function calculation during model training.
AlexNet feature extractor
In this study, AlexNet was adopted as the backbone network for feature extraction. Although more recent convolutional neural network architectures such as ResNet and EfficientNet have been widely applied in medical image analysis, AlexNet was selected because of its relatively simple architecture and stable performance when integrated with the proposed MIL framework. The simpler structure also reduces computational complexity and facilitates efficient training on medical imaging datasets.
AlexNet consists of five convolutional layers and three fully connected layers, which progressively extract low-level, mid-level, and high-level features from input images. For the purpose of this study, the original fully connected layers of AlexNet were removed, and customized feature mapping layers were introduced to generate feature representations suitable for the MIL-based classification framework. This modification allows the network to produce generalized visual features that can be effectively aggregated by the attention mechanism. The extracted features provide informative representations of vertebral morphology and fracture characteristics, which support the subsequent classification tasks.
Multiple Instance Learning aggregation method
Traditional Multiple Instance Learning (MIL) typically employs aggregation methods such as mean-pooling or max-pooling. 6 However, recent studies have demonstrated that using neural network parameterized aggregation operators also yields promising results.7,8 In this paper, we adopt the gated attention aggregation mechanism proposed by Maximilian Ilse et al. 9
The gated attention mechanism is used to enable the model to selectively focus on the most informative image slices during fracture classification. In CT examinations, a vertebra is typically represented by multiple image slices, but only a subset of slices may clearly show fracture characteristics. The attention mechanism therefore helps the model identify and emphasize those informative slices while reducing the influence of less relevant images.
Specifically, the extracted feature representations from each slice are processed through two parallel transformation pathways, which capture complementary feature patterns. These transformed features are then combined through an element-wise interaction to generate attention weights. The attention weights indicate the relative importance of each slice within the image set.
The resulting attention scores are subsequently used to aggregate slice-level features into a single representation for vertebra-level classification. In this way, the model can automatically highlight the most relevant fracture-related information from multiple CT slices. For completeness, the mathematical formulation of the gated attention mechanism is provided in the Supplementary Materials (Equations S2–S5).
Overall, the gated attention mechanism dynamically adjusts the focus on different features, significantly enhancing the model’s feature selectivity and representational power. Its adaptive nature allows the model to accurately capture critical information in complex and noisy environments, while effectively filtering out irrelevant or distracting information. This improves the model’s robustness and overall predictive performance. Such a mechanism is particularly well-suited for handling diverse medical image data, demonstrating higher accuracy and stability in classification tasks.
Loss function
In this study, the loss function is designed to effectively integrate the hierarchical classification requirements of multitask learning and the unique demands of Multiple Instance Learning (MIL). The loss function consists of multiple components, each optimized for super-class classification, bag classification, and instance-level predictions. Each sub-loss function uses the Cross-Entropy Loss. For the z-type task, the loss function considers the classification loss for the super-class, the bag classification loss, and the prediction variance among multiple image instances. This comprehensive approach effectively guides the model to learn at multiple levels. By weighting and combining these three components, the model can balance the needs of different tasks while improving overall classification performance. In the s-type task, the primary objective is to address the inability of the z-type model to identify A0 fractures due to the absence of A0 data. During experimentation, we observed that adding super-class classification to the s-type task actually reduced the accuracy in identifying A0 fractures. Therefore, in training the s-type model, super-class classification was removed, and the loss function only includes bag classification loss and instance-level loss. Additionally, the MIL-specific loss function further enhances the model’s robustness when handling multiple image instances. This is especially important in cases where some instances may contain noise or inconsistent labeling, allowing the model to accurately predict the bag label despite these challenges.
Model combination and evaluation strategy
Model combination strategy
We trained deep learning models separately for the s-type and z-type tasks (Figure 3), and designed a conditional combination prediction strategy based on their specific performance characteristics in classification tasks.
First, we use the trained z-model to make an initial prediction on the input image. Since the z-model excels in identifying non-A0 categories, it is prioritized for classifying the input image. However, because the z-type task lacks data for A0 fractures, the labels for z-type images in the A0 folder are marked as AZ (non-fracture). Therefore, when the z-model predicts a label of AZ, we further use the s-model for secondary judgment, and the s-model’s prediction becomes the final classification result. If the z-model identifies the image as a non-A0 category, the final prediction remains the z-model’s prediction. This combination strategy effectively utilizes the strengths of the s-model to compensate for the z-model’s limitations with A0 data, improving classification accuracy and robustness through conditional decision-making.
Evaluation metrics
Model performance was evaluated using standard classification metrics, including accuracy, precision, recall, and F1 score. Accuracy reflects the overall proportion of correctly classified samples, while precision and recall assess the trade-off between false positives and false negatives. The F1 score provides a harmonic mean of precision and recall.
In addition, we further analyzed the model’s classification performance using a Confusion Matrix, which shows the correspondence between actual and predicted labels for each category. This helps identify which categories are more prone to misclassification and allows for in-depth analysis of potential causes.
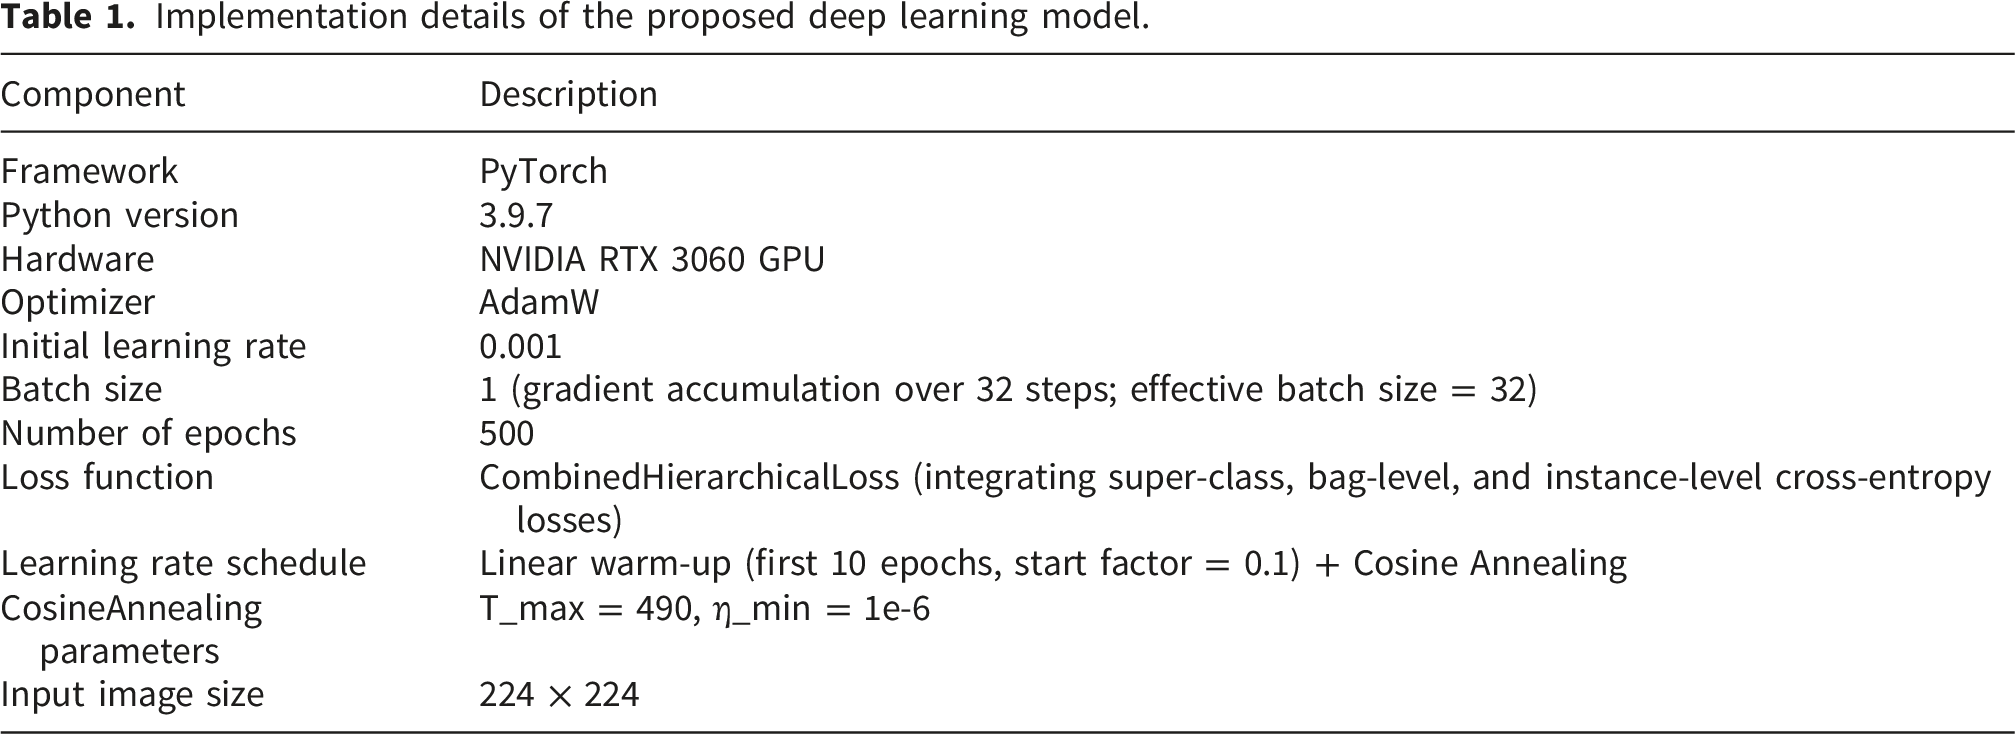
Software framework
Implementation details of the proposed deep learning model.
Statistical analysis
Statistical analysis was performed to evaluate the reliability of the reported diagnostic performance. Overall classification accuracy was calculated for each model and for each reader group. Ninety-five percent confidence intervals (95% CI) were computed to estimate the precision of the reported accuracy values. To assess whether the use of the deep learning model significantly improved the diagnostic performance of interns, the diagnostic accuracies of interns with and without model assistance were compared using a paired t-test. A two-sided p-value of less than 0.05 was considered statistically significant. All statistical analyses were performed using Python (version 3.9) with the SPSS statistical package.
Result
Single model performance evaluation
S-type and Z-type model evaluation metrics.
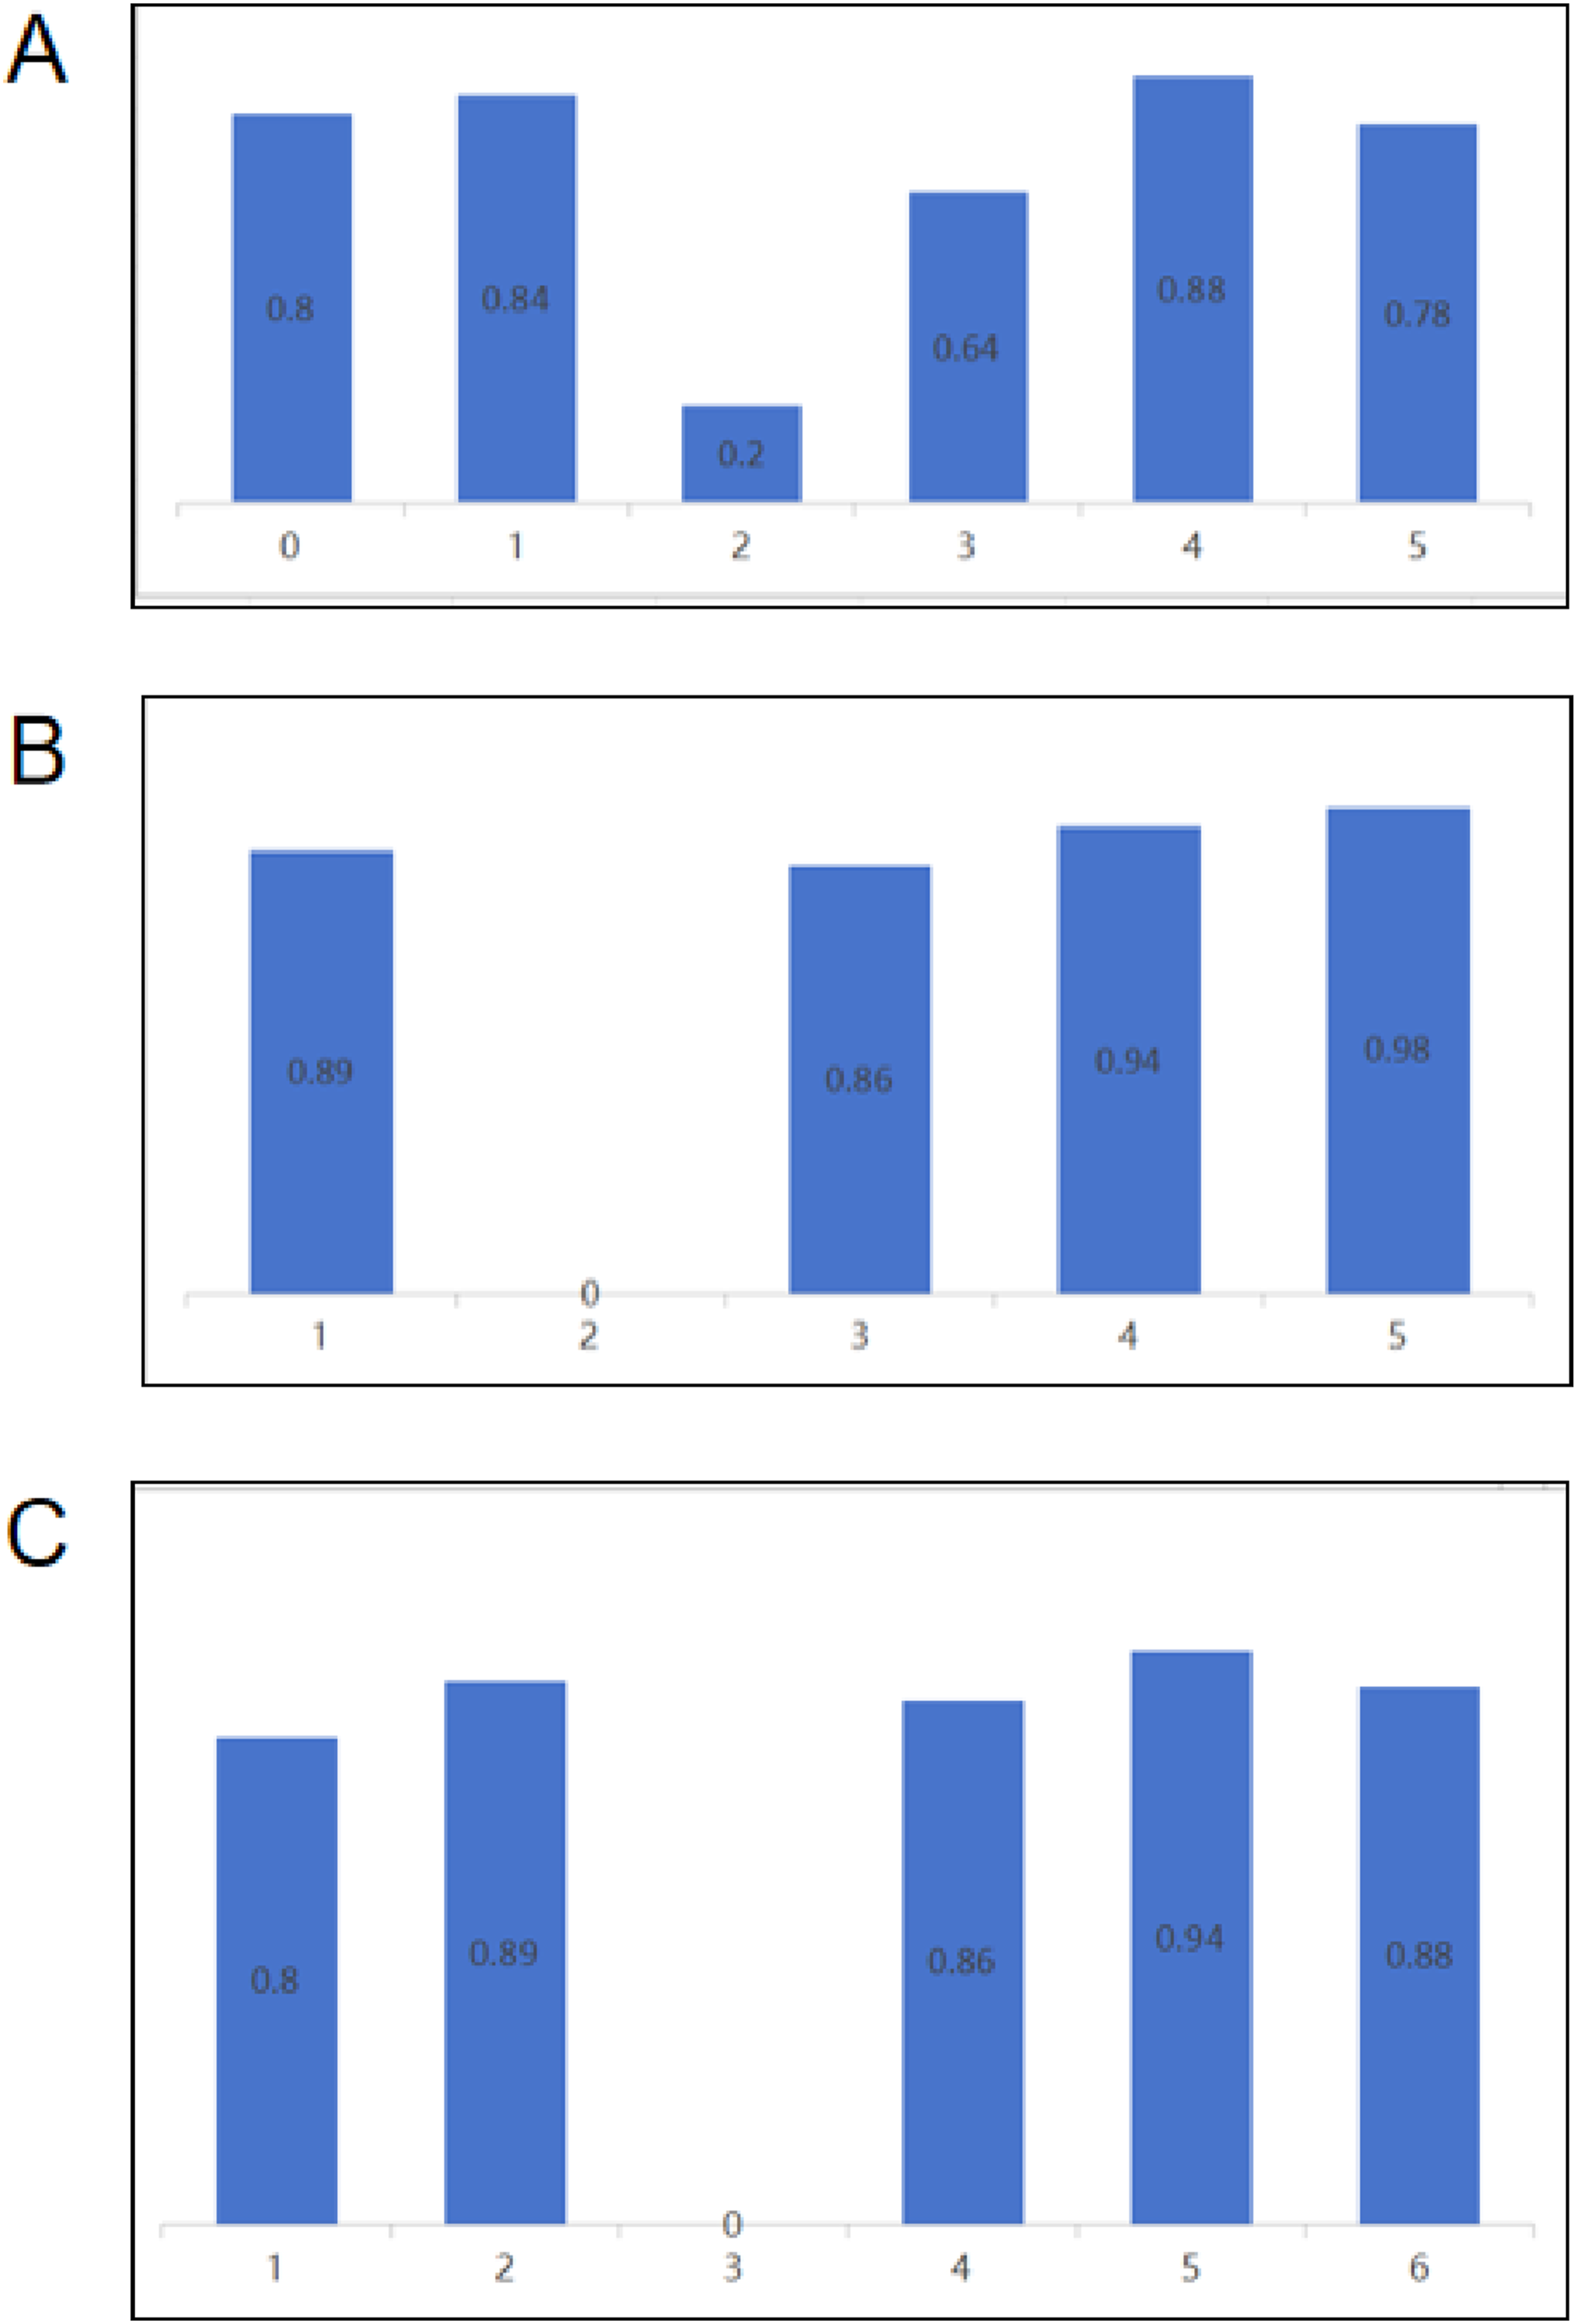
Class-specific accuracy of the single and ensemble models on the validation set. (A) S-Type Class-Specific Accuracy (s-type) (B)Z-Type Class-Specific Accuracy (C)Ensemble Model Class-Specific Accuracy.
Ensemble model performance evaluation
The clinician’s judgment results.
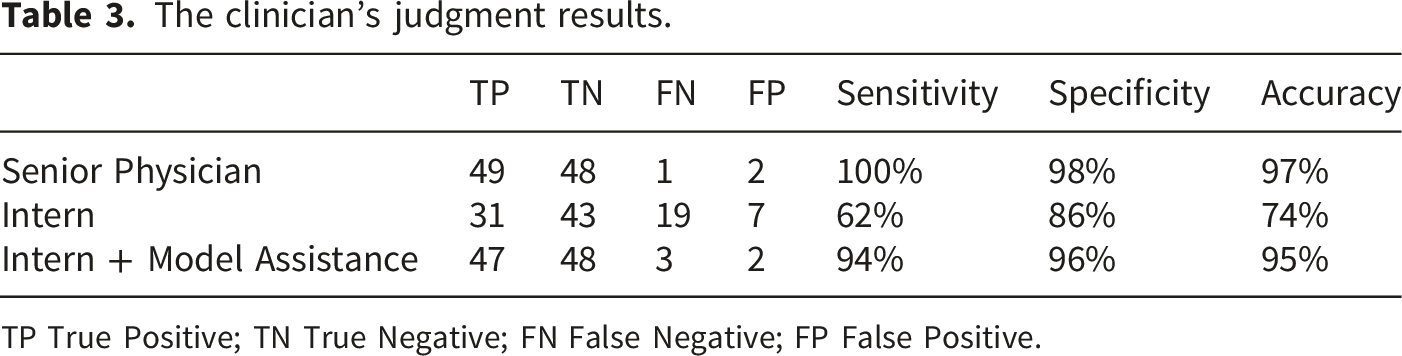
TP True Positive; TN True Negative; FN False Negative; FP False Positive.
Clinical performance of model-assisted interns
In this section, we evaluated the clinical performance of interns assisted by the deep learning model in comparison to unaided interns and senior physicians (Table 3). We randomly selected 100 patient CT images (with 10 cases from each fracture type and 50 healthy cases) and asked both senior physicians and interns to make fracture diagnoses. For each group, diagnostic accuracy was reported with 95% confidence intervals to provide a statistical estimate of performance reliability. In addition, a paired statistical test was performed to evaluate whether the improvement in diagnostic accuracy with model assistance was statistically significant.
Discussion
This study investigated the application of deep learning for AO classification of thoracolumbar fractures using coronal and axial views from 3D CT imaging data. The performance of the model was compared to the diagnostic results of two radiologists with different levels of experience. The aim was to determine whether machine learning assistance could help interns approach the diagnostic accuracy of senior physicians in assessing spinal fractures. The results showed that the Multiple Instance Learning (MIL)-based spinal fracture classification model achieved a satisfactory diagnostic accuracy of 83.8%. With the model’s assistance, the diagnostic accuracy of interns increased from 74% to 95%. Although this is still below the 98% accuracy of senior physicians, it represents a significant improvement over the interns’ unaided performance.
In thoracolumbar fractures, different fracture classifications determine the appropriate treatment strategy. The North American AO Spine classification provides detailed guidelines (Table S9). The guidelines suggest that injuries with a score of 3 or below should be managed non-surgically, while injuries with a score above 5 require surgical intervention. For injuries with a score of 4 or 5, the decision between surgical and non-surgical treatment is based on individual circumstances. Compression fractures (A0, A1, and A2 injuries) generally heal well in patients without osteoporosis. However, for incomplete (A3) and complete burst fractures (A4), the decision to pursue surgical treatment depends on the assessment of spinal cord injury. Therefore, rapid classification of thoracolumbar fractures before surgery is crucial for determining the appropriate surgical approach.
Analysis of experimental results
The predictions of the ensemble model are derived from the combined outputs of the S-Type and Z-Type models. Therefore, our analysis focuses on the performance of the individual S-Type and Z-Type models.
In the validation set for the S-Type model, the overall classification accuracy reached 75.2%. The confusion matrix shows that the model performed well in categories 0, 1, and 4, achieving accuracies of 80%, 84%, and 88%, respectively, indicating that the model is reliable in identifying these fracture types. These fracture categories typically present with relatively clear morphological features on CT images, which may facilitate more stable feature extraction by the deep learning model. However, the performance in categories 2 and 3 was relatively poorer, with category 2 reaching only 20% accuracy. This limitation may be attributed to several factors. First, the number of category 2 samples was relatively small (28 cases among 596 patients), which may have limited the model’s ability to learn representative imaging features. Second, the morphological characteristics of category 2 fractures may partially overlap with those of adjacent fracture types, increasing the difficulty of automated classification. Additionally, category 5 achieved an accuracy of 78%, suggesting that subtle differences between certain fracture patterns may still pose challenges for automated recognition.
The Z-Type model achieved an overall accuracy of 88.0% on the validation set, which was higher than that of the S-Type model. The confusion matrix indicates that the Z-Type model performed particularly well in categories 1 and 5, with accuracies of 89% and 98%, respectively, demonstrating strong stability in identifying these fracture patterns. However, the accuracy for category 2 was 0%. Similar to the S-Type model, this may be related to the limited number of training samples and the relatively subtle imaging characteristics of this fracture subtype. The accuracy for category 3 was 86%, and for category 4 it reached 94%, indicating that the model was able to effectively distinguish fracture patterns with more prominent structural changes. Overall, the Z-Type model outperformed the S-Type model in categories 1, 3, 4, and 5. Nevertheless, due to the absence of category 0 samples in the Z-Type dataset, the S-Type model remains necessary for predicting A0 fractures. Therefore, the ensemble model combines the strengths of both models, using the S-Type model for A0 prediction while relying on the Z-Type model for the classification of other fracture categories.
From a clinical perspective, these findings suggest that the proposed model demonstrated promising performance for most thoracolumbar fracture categories and may serve as a useful decision-support tool to assist clinicians in fracture classification. However, caution may be required when interpreting predictions for certain subtypes, particularly category 2 fractures. Future studies with larger and more balanced datasets may further improve the model’s performance for these challenging fracture patterns. Future studies incorporating multicenter datasets and larger sample sizes may further enhance model robustness and generalizability.
Interpretability heatmaps
This section introduces the Grad-CAM heatmap algorithm for interpretability analysis. Grad-CAM (Gradient-weighted Class Activation Mapping) is a widely used technique for visualizing and interpreting the decision-making process of convolutional neural networks (CNNs) by highlighting the image regions that contribute most strongly to a specific prediction. 10 Compared with traditional class activation mapping methods, Grad-CAM can be applied to a broader range of CNN architectures and provides intuitive visual explanations of model behavior.
Specifically, Grad-CAM first computes the gradient 

The activation map is ultimately mapped back to the original image dimensions, visually highlighting the areas of the image that the model focused on during its classification decision.
In this study, we used Grad-CAM to perform interpretability analysis on the last convolutional layer of AlexNet. Below are some examples, where “True” represents the actual instance label, and “Pred” represents the label predicted by the model (Figure 5(a)–(d)): Grad-CAM visualization of the S-type model on CT images. The heatmaps illustrate the regions that contributed most strongly to the model’s predictions. Warmer colors indicate areas with higher importance for classification. (A) True label: 0, predicted label: 0 (correct classification). (B) True label: 0, predicted label: 5 (misclassification). (C) True label: 5, predicted label: 5 (correct classification). (D) True label: 5, predicted label: 0 (misclassification).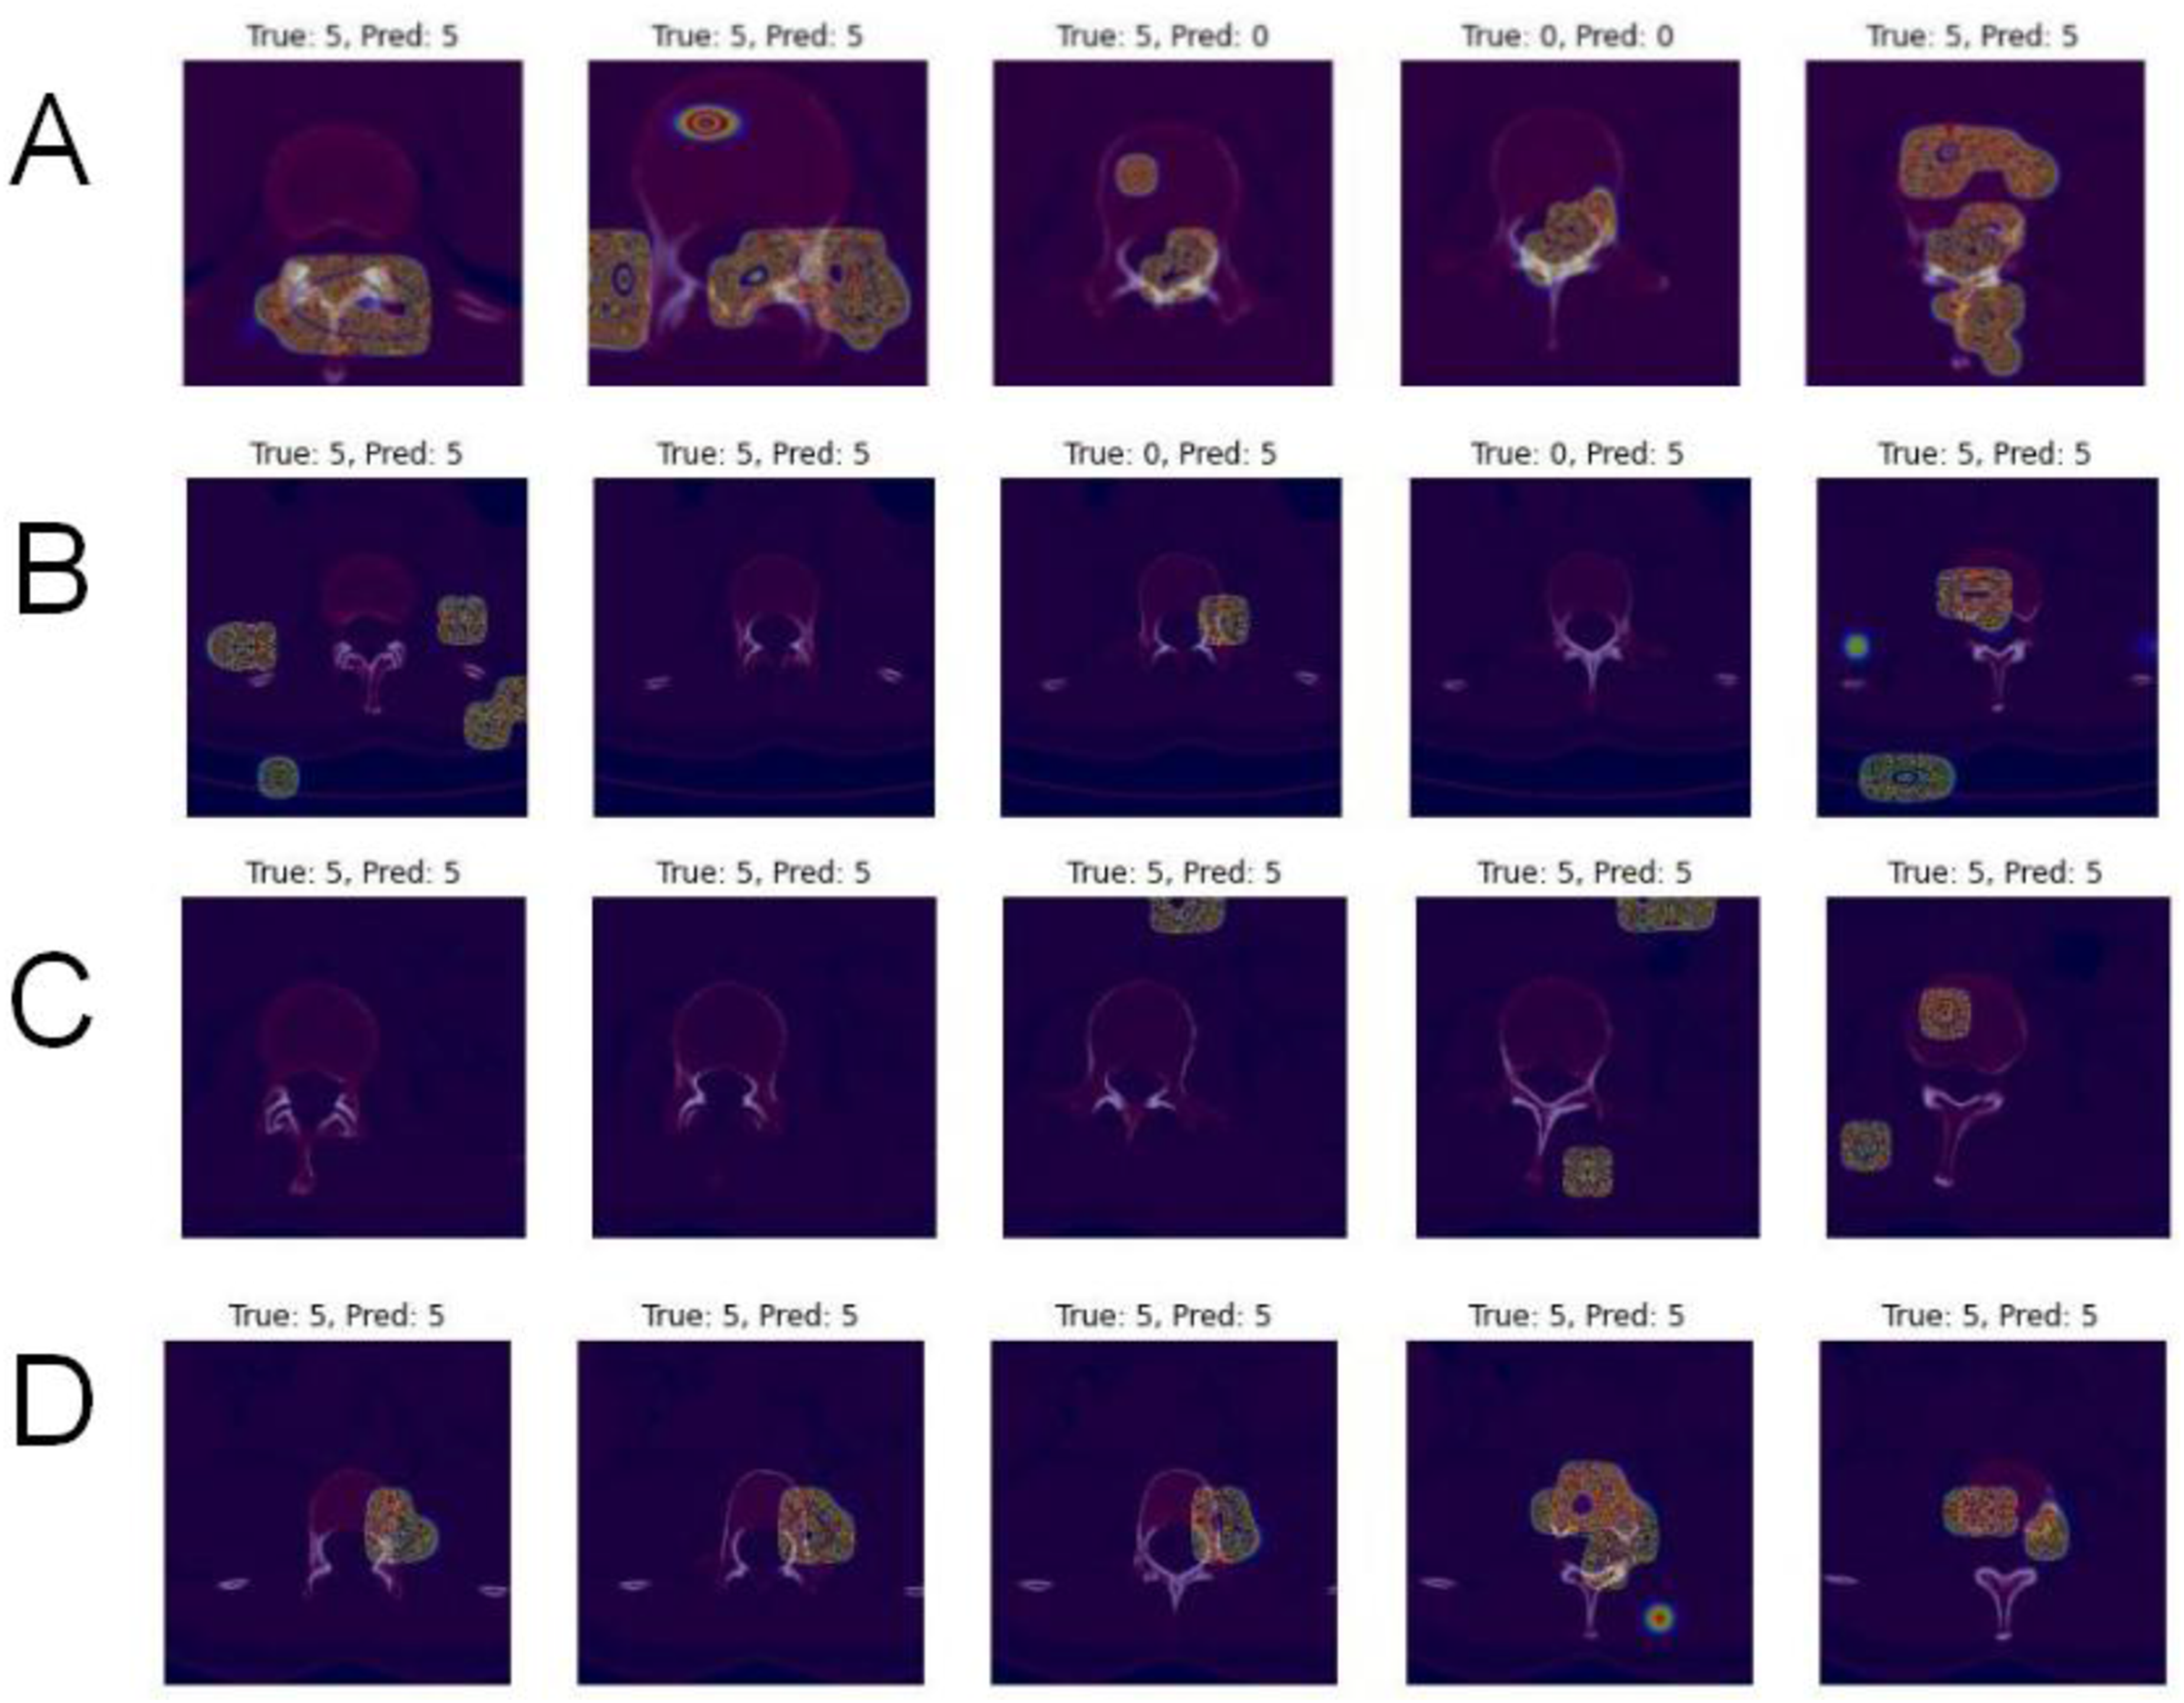
The four images above illustrate cases where the model correctly predicted A0 and AZ, as well as instances where these two types were confused. AZ corresponds to the non-fracture category, which might explain why the attention points for AZ (label 5) are not concentrated in a fixed area. However, there is significant overlap between the attention regions for AZ and A0. This is likely because A0 represents clinically insignificant spinous process fractures, which are quite similar to AZ, leading the model to easily confuse the two categories.
Next, we examine A3 fractures, which the Z-type model struggles with comparatively (Figure 6(a)–(d)). Grad-CAM visualization of the Z-type model on CT images. The heatmaps highlight vertebral regions that contributed most strongly to the model’s decision. Warmer colors represent areas with higher importance for fracture classification. (A) True label: 3, predicted label: 3 (correct classification). (B) True label: 3, predicted label: 4 (misclassification). (C) True label: 4, predicted label: 4 (correct classification). (D) True label: 4, predicted label: 3 (misclassification).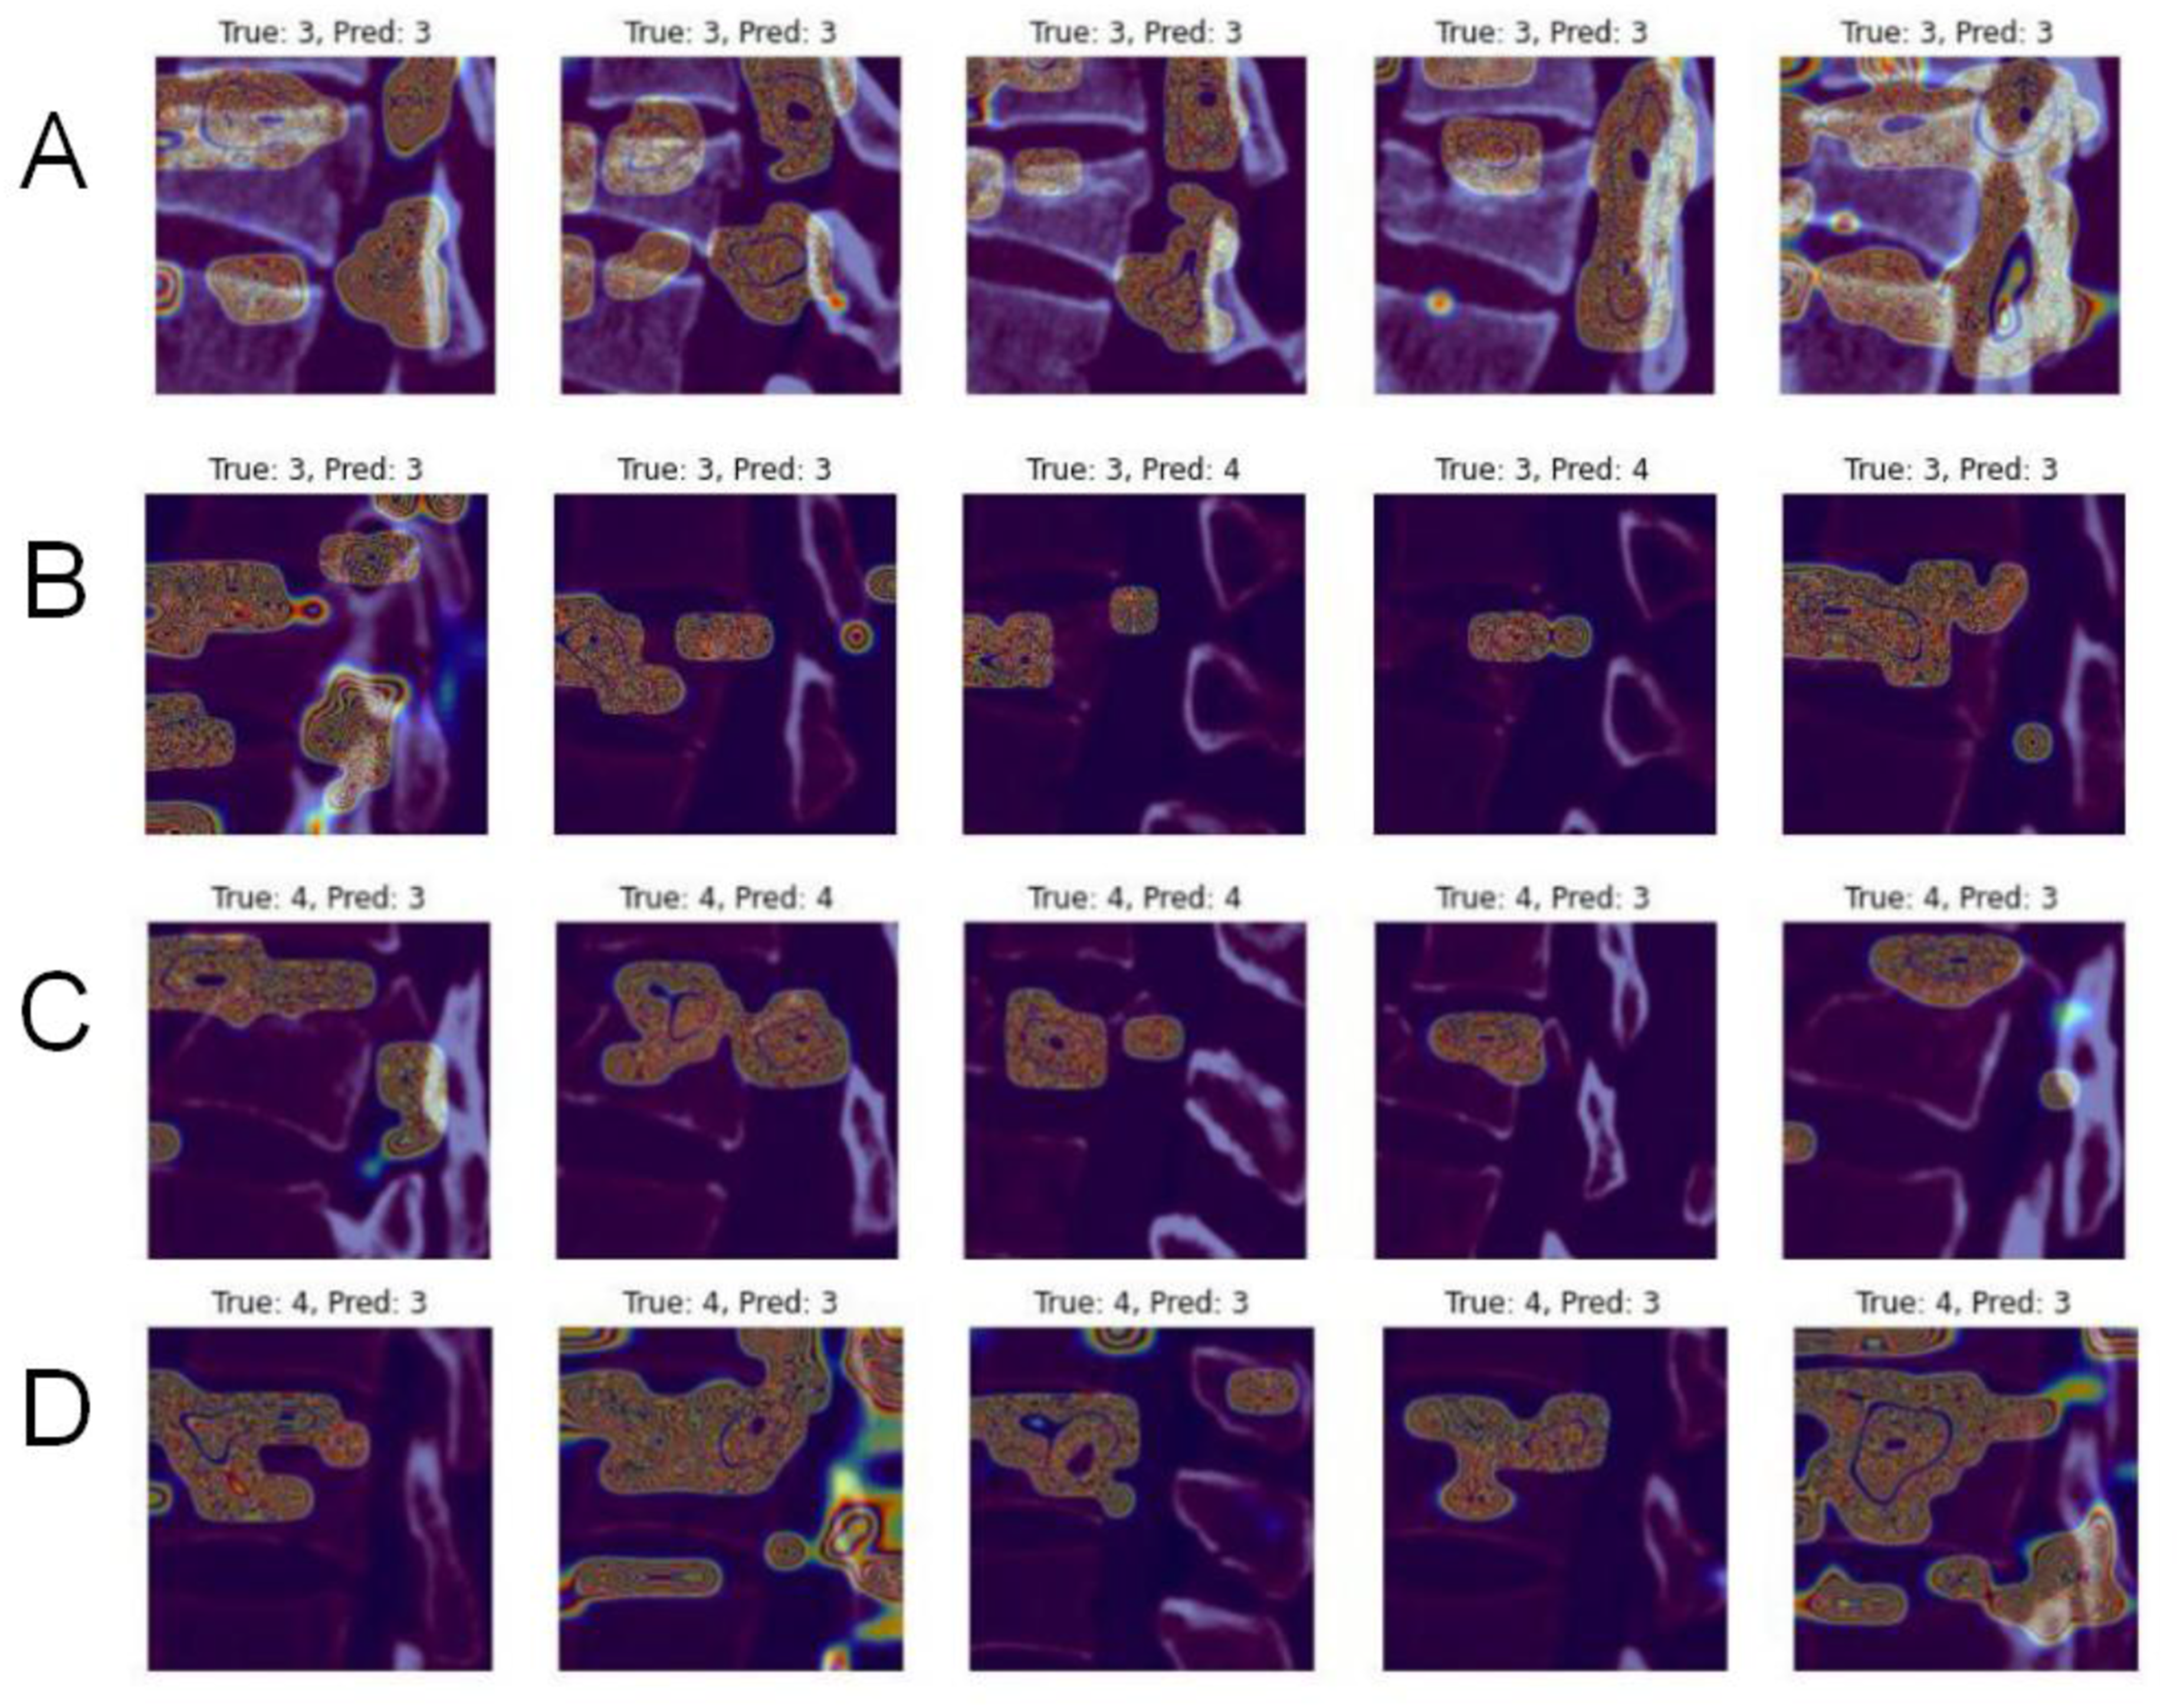
In the four Z-type images mentioned above, we can clearly observe that the model predominantly focuses on the fractured regions. However, the predicted bag labels for A3 and A4 types show some confusion, as also reflected in the confusion matrix (Table S9). Additionally, the instance labels also exhibit misclassification between A3 and A4, which is likely because both A3 and A4 fall under the broader category of burst fractures, influencing the model’s predictions.
Overall, the Grad-CAM heatmaps demonstrate that the model tends to focus on clinically relevant vertebral regions associated with fracture morphology. These visual explanations provide evidence that the model’s predictions are based on meaningful anatomical features rather than irrelevant image patterns, which may enhance the interpretability and potential clinical acceptance of the proposed deep learning framework.
Model strengths, weaknesses, and future improvement strategies
This experiment adopted the concept of Multiple Instance Learning (MIL) along with a gated attention mechanism for bag-level label prediction. The advantage of MIL lies in its ability to handle data uncertainty and heterogeneity, especially when labels cannot be accurately assigned to each individual instance. Additionally, MIL, through the gated attention mechanism, aggregates and classifies the overall features of multiple instances (i.e., bags), making it more effective in processing datasets with noise, sparse, or incomplete labels. This approach is particularly suited for complex data such as medical imaging, text classification, and bioinformatics, where instance-level labeling is challenging or impractical. The gated attention mechanism further enhances the model’s feature selection capability, allowing the model to automatically focus on the most discriminative regions in the image, which is especially useful for high-dimensional medical images.
Although the model performed well in some aspects, it still encountered classification errors and sample limitations. There was a high confusion rate between some categories, particularly with A2 fractures (almost unidentifiable). This could be due to the model’s insufficient ability to distinguish between certain categories or the limited sample size, which affected the model’s generalization capability.
Several improvement directions exist for future work. To further improve the model’s performance in medical image classification tasks, the following strategies can be implemented: introducing more complex attention mechanisms, adopting advanced data augmentation techniques, using more suitable feature extractors, employing GANs to generate additional dataset samples, and leveraging transfer learning and fine-tuning to optimize model performance. These improvements aim to enhance feature extraction, increase data diversity, and utilize more powerful pre-trained models, ultimately achieving significant improvements in precision, recall, and generalization capabilities.
With the rapid development of artificial intelligence, particularly deep learning techniques, automated systems have shown great potential in assisting clinicians in medical image analysis. Deep learning models are capable of automatically extracting complex imaging features and have been widely applied in radiological image classification, detection, and segmentation tasks. These approaches may help improve diagnostic efficiency and reduce interobserver variability in clinical practice.
In the field of spinal imaging, several deep learning models have been developed to analyze CT and MRI data, and recent reviews have highlighted the growing role of artificial intelligence in vertebral segmentation, anatomical localization, and automated spinal image analysis. 11 Previous studies have demonstrated that convolutional neural networks can accurately identify and segment vertebrae and intervertebral discs. 12 Jo et al. developed a deep learning model for detecting posterior ligamentous complex injury in acute thoracolumbar fractures using MRI and demonstrated reliable performance with both internal and external validation datasets. 13 Tian et al. proposed a deep learning method for automatic lumbar vertebral fracture detection based on CT images and reported promising diagnostic performance in external validation cohorts. 14 While these studies have shown promising results in vertebral detection and segmentation, relatively few studies have investigated automated morphological classification of thoracolumbar fractures according to clinically relevant systems such as the AO Spine classification. Compared with previous studies that mainly focus on vertebral detection or binary fracture identification, the present study addresses the more challenging task of detailed morphological classification, which may better align with clinical decision-making requirements. However, differences in dataset characteristics and evaluation protocols across studies may limit direct comparison of performance metrics.
Recent studies applying deep learning to spinal imaging tasks have reported encouraging diagnostic performance in vertebral detection, segmentation, and fracture identification. However, many existing approaches focus primarily on anatomical localization or binary fracture detection rather than detailed fracture morphology classification. In addition, conventional convolutional neural network approaches may have limited ability to effectively aggregate information from multiple CT slices when generating vertebra-level predictions.
In the present study, we developed a deep learning framework for thoracolumbar fracture classification using CT images. The proposed model achieved an overall diagnostic accuracy of 83.8%. By integrating a Multiple Instance Learning framework with a gated attention mechanism, the model can aggregate information from multiple CT slices to generate vertebra-level predictions. Furthermore, the ensemble strategy combining S-type and Z-type models enables the framework to leverage complementary information from different imaging views, thereby improving classification robustness.
Future studies should incorporate larger and more diverse datasets to further improve the robustness of the model. External validation using independent datasets from other institutions will also be necessary to evaluate the generalizability of the proposed framework. Moreover, future work could explore automated vertebral segmentation and multi-vertebra analysis strategies, allowing both intra-vertebral and surrounding structural features to be integrated into the model. Recent studies have demonstrated that convolutional neural network–based vertebral segmentation methods can provide reliable anatomical localization and facilitate more comprehensive spinal imaging analysis.
From a clinical perspective, the proposed model is intended to function as a decision-support tool rather than a replacement for clinical judgment. Future prospective studies involving radiologists and orthopedic surgeons with different levels of experience may help further evaluate the potential clinical utility of the model in real-world diagnostic settings.
Conclusion
This study explored the application of deep learning in the classification and differential diagnosis of thoracolumbar fractures using CT imaging. The results demonstrate that the Multiple Instance Learning (MIL)-based spinal fracture classification model provides a feasible approach for diagnosis by utilizing 3D CT images in coronal and axial views. The overall diagnostic accuracy per patient was 83%, lower than that of fully trained orthopedic surgeons but significantly higher than that of inexperienced interns. The findings suggest that in the absence of well-trained medical personnel, the developed deep learning model can serve as an auxiliary tool for accurate classification of thoracolumbar fractures, thereby facilitating precise surgical intervention. With further technical improvements to the model and specific adaptations for various clinical settings, this AI-based approach has the potential to become a clinical tool, assisting less experienced practitioners and improving workflow efficiency.
Supplemental material
Supplemental material - Deep learning framework for automated classification of thoracolumbar fractures using spinal CT images
Supplemental material for Deep learning framework for automated classification of thoracolumbar fractures using spinal CT images by Xiao Qu, Yucheng Shu, Huazhang Zhu, Chao Zhang, Dagang Tang, Ningdao Li and Xiaoji Luo in Health Informatics Journal.
Footnotes
Ethical considerations
This study was approved by the Ethics Committee of the First Affiliated Hospital of Chongqing Medical University (Ethics Approval No. 2019 Research Ethics Review [2019-225]). A waiver of informed consent was granted by the ethics committee as the research utilized fully anonymized archival imaging data. All analyzed CT images underwent complete anonymization procedures, with all identifiable patient information removed.
Consent for publication
(Individual consent for publication was not required since fully anonymized data were used.)
Author contributions
Guarantor of integrity of entire study, X.L.; study concepts/study design or data acquisition or data analysis/interpretation, all authors; manuscript drafting or manuscript revision for important intellectual content, all authors; approval of final version of submitted manuscript, all authors; agrees to ensure any questions related to the work are appropriately resolved, all authors; literature research, X.Q., Y.S., C.Z.; clinical studies, X.Q., C.Z.; experimental studies, Y.S., H.Z; statistical analysis, D.T., N.L.; and manuscript editing, all authors.
Funding
The authors disclosed receipt of the following financial support for the research, authorship, and/or publication of this article: This research was supported by the National Natural Science Foundation of China (NO. 62331008, 62276040)), the Doctoral Innovation Project of the First Affiliated Hospital of Chongqing Medical University (2024MD754029, CSTB2021TIAD-KPX0060), the Natural Science Foundation of Chongqing (CSTB2024NSCQ-MSX1218, CSTB2023NSCQ-LZX0047, CSTB2024TIAD-KPX0040), Medical Research Project of Chongqing Municipal Health Commission (Grant No. 2019GDRC001), the Technology Innovation and Application Development Key Projects of Chongqing (CSTB2025TIAD-KPX0009).
Declaration of conflicting interests
The authors declared no potential conflicts of interest with respect to the research, authorship, and/or publication of this article.
Supplemental material
Supplemental material for this article is available online.
References
Supplementary Material
Please find the following supplemental material available below.
For Open Access articles published under a Creative Commons License, all supplemental material carries the same license as the article it is associated with.
For non-Open Access articles published, all supplemental material carries a non-exclusive license, and permission requests for re-use of supplemental material or any part of supplemental material shall be sent directly to the copyright owner as specified in the copyright notice associated with the article.