
Abstract
Most studies in the mobile communication field focus on the acceptance of the technology rather than the resistance of it, a trend that makes researchers try to understand only the powerful actors in society. Instead, this paper explores the socio-economic characteristics of mobile phone service have-nots. Based on an analysis of samples from three consecutive nationwide annual surveys in Sweden, this study finds that two socio-economic factors – age and the household income
Keywords
Introduction
Studying mobile phone service users 1 these days, particularly in developed countries, seems like a meaningless activity as the statistics indicate both a high penetration rate and a market saturation trend. According to the Special Eurobarometer 356 Report (2011), the estimated percentage of mobile phone service have-nots in most European countries (EU-27) in 2010 was about seven per cent. Therefore, it is not surprising that most recent studies of mobile phone service usage focus on the ones who have mobile phones and not the ones without. However, as pointed out by Wyatt (2005: 78), this focus may run the risk of contributing to the view that adopters of mobile phones should be studied in order to understand and further develop mobile technologies – a trend which, indirectly, may further support the already powerful actors in society. Katz (2008: 435) therefore considers mobile phones service have-nots as a relevant study object, although emphasizes the problem of finding a large enough sample to study.
From a diffusion of innovation perspective, this approach – which pays more attention to the innovators and early adopters than to have-nots – may create a pro-innovation bias, a tendency in diffusion of innovation research that loosely assumes that an innovation should be diffused and adopted by all members of a social system, that the innovation should be diffused more rapidly and that the innovation should be neither re-invented nor rejected (Rogers, 2003: 106).With such a pre-occupied mindset, researchers of innovation diffusion tend to overlook non-adopters, have-nots, in their research agenda. In fact, the innovators and early adopters achieve windfall profits compared to have-nots, something that potentially will further widen the socio-economic gap between them 2 (Rogers, 2003: 457). Researchers, therefore, should free themselves from this pro-innovation bias and capture the whole adoption process of an innovation by involving studies on have-nots. This is in order to bring in insights that can prevent the potential social gap due to technological adoption inequalities in society.
In the context of mobile communication studies, a mobile phone service possession can be seen as a critical threshold, because the possession of a mobile phone service is the point of departure to access different mobile services and applications that involve different processes of adoption. This implies that mobile phone service have-nots may face a higher risk of being excluded from society as they may have difficulties adapting to it (Leung and Wei, 1999; Wei, 2001). The mobile phones service have-nots will also need to compensate the delay of their adoption with a tougher adoption process, as the mobile technology development is rapid with a constantly higher demand on knowledge. Given the fact that the mobile phone is the most obvious substitute for the fixed-line telephone and potentially will become the main media for the universal service obligation (Alleman et al., 2010), studying mobile phone have-nots also becomes critical in order to understand how this transition from fixed to mobile will affect the mobile phone have-nots. This motivates the present research to study the dynamic characteristics of mobile phone have-nots.
Sweden is selected as the case for this study as it represents a saturated market of mobile services and is similar to other markets in the developed world. The saturated market situation is also interesting, since at this stage the persistence appearance of have-nots typically can be observed. Moreover, Sweden has a long history of fixed communication and a well-developed fixed network infrastructure, which may encourage people to stick with their fixed lifestyle rather than change to a mobile lifestyle. This creates a certain barrier that may hinder parts of the population from using mobile phones and services, that is, people living in rural areas or people with long experience using fixed phone-based communication. However, it is important to emphasize that the discussion in this paper does not regard service availability but service use, a discussion that may have implications on the universal service policy as suggested by Levin (2010).
In order to identify and understand the dynamics of mobile phones have-nots, a multiple cross-sectional analysis has been conducted on data from an annual individual national survey from 2008 to 2010. This approach is crucial for the analysis, as the number of have-nots of mobile services is fairly low on each single occasion. This approach also enables a pattern analysis despite the fact that the number of identified have-nots is limited.
As a main contribution, the current study will explain the characteristics of mobile phones have-nots as well as their influences on the mobile service diffusion process. This can be achieved by contrasting the socio-economic characteristics of the respondents (age, education level, household income, gender, residing area, housing type and possession of alternative telecommunication media, i.e. fixed phone) over time. The result will also be useful as a means to target have-nots within the universal service policy. Finally, the possibility of using mobile communication services as an alternative to fixed communication as the basis for implementing the universal service obligation will be discussed.
Previous research
The scientific significance of have-nots of innovations can be attested by numerous studies and perspectives. From the marketing perspective, the have-nots are often associated with consumers’ ‘retention to innovations’ (see, for instance, Garcia et al., 2007; Ram and Sheth, 1989). In technology studies, the have-nots are associated with the concept of ‘technology resistance’ (Bruland, 1995), while in diffusion of innovation studies the have-nots are denoted as ‘non-users’, ‘non-adopters’ or ‘laggards’ (Rogers, 2003: 284). In relation to non-users, The European P-903 study distinguishes the term into several categories, that is, non-adopting users (individuals who do not ‘own’ the technologies or subscribe to services personally but who nevertheless have access to them and use them), adopting non-users (individuals who ‘own’ the technologies or subscribe to the services but do not use them), non-adopting non-users (individuals who neither have access to the technologies nor do they use them) and former users or dropouts (individuals who used to have access to the technologies and services and used to use them but no longer do so) (Haddon, 2004: 16).This study, however, uses the term ‘have-nots’ which represents individuals who stated they do not have a mobile phone at the time of the survey, a term which may, according to the European P-903 definition, include non-adopting as well as former users.
In information and communications technology (ICT) studies these different terms are applied in relation to a variety of technologies. Julsrud et al. (1998), as well as Selwyn (2006), investigate computer have-nots, Reisdorf et al. (2012) study non-users of the Internet (2012), while Paik and Marzban (1995) and Jackson-Beeck (1977) study TV non-viewers. When it comes to fixed telephony, Dyer (1997) and Schement (1995) study households without a fixed phone in the UK and the US in relation to the universal service obligation. Internet studies scholars (e.g. Wyatt et al., 2002) as well as others, such as Verdegem and Verhoest (2009) and Annafari and Bohlin (2009), also discuss the phenomenon of have-nots.
In relation to mobile phones and services, studies by Leung and Wei (1999), Ling (2000), Wei (2001), Rice and Katz (2003) are among the examples. The study by Leung and Wei (1999) can be considered as the first reference providing a discussion on the characteristic of mobile phones and services have-nots, as well as the factors motivating their decision. According to the study, the possession of alternative communication devices, such as a fixed phone, is the important predictor that influences the decision of being a non-user of mobile services. Another paper by Ling (2000) also addresses similar issues in a Norwegian context. The study concludes gender and employment status as the predictor of ownership of a mobile phone.
Nevertheless, both studies were done over a decade ago and the mobile phone market is still growing significantly; therefore, these observations may no longer be relevant. Moreover, the studies apply a static analysis framework, that is, they build on a single observation, at a certain point in time, a method that likely falls short when it comes to capturing the dynamics of the mobile phone have-nots and services. Therefore, a study design with multiple observations at different points in time is preferred, as it offers an opportunity to capture the dynamics of this specific group (Wei, 2001).
This methodological approach, however, is difficult to apply since it requires a dataset covering several observations during a certain period of time. However, some mobile communication studies that apply this approach provide a stronger analysis. Wei (2001), for instance, provides an analysis of have-nots in Hong Kong based on two consecutive surveys in 1998 and 2000. The study concludes that socio-economic status and social influences determine the non-usage of mobile phones and services. The study also found a correlation between low information and communication technology literacy and non-usage of mobile phones. However, due to data limitations, the study could not confirm dynamic interaction effects of socio-economic variables over time.
The current study applies a similar approach. This has been done by testing the have-nots’ status across several factors over time using repeated cross-sectional survey data. The factors represent socio-economic characteristics, that is, age, gender, education, employment and income; geographical aspects, that is, residing area (metro or rural area) and the status of housing (rented or owned) as well as technological aspects, that is, possession of fixed and/or mobile phone. Nevertheless, due to data limitations, this study does not include factors that may also be relevant, such as user-related personality variables, that is, traits and innovativeness, and the role of interpersonal communication channels and use of mass media and technology, as discussed by Rogers (2003: 288–290). However, since Wei (2001) and Rice and Katz (2003) point out that socio-economic factors are more significant than attitude, particularly in the later stages of the technology adoption process, focusing on the dynamics of the socio-economic characteristics is considered adequate for the current analysis.
Method
Data
It is quite a challenge to find someone without a mobile phone these days, particularly in a country such as Sweden where mobile phones have been around for more than two decades. Fortunately, this study is able to take advantage of a nationwide annual survey by Post-och Telestyrelsen (PTS) – the Swedish Post and Telecom Agency. Each year approximately 4000 questionnaires are distributed through postal mail to individuals between 16 and 75 years old living in Sweden. In the questionnaire, which has the main purpose to provide information about the market from a consumer perspective, the respondents are asked to provide information on their socio-economic and demographic background as well as responses related to usage of telecommunication services, including fixed phone, Internet and mobile phone. The respondents were given the option to return the response via web or postal mail. In order to keep the data consistent and comparable, the present study only uses survey data from 2008 and onwards. 3 In general, the survey has a comparable response rate in each region, which is about 55 per cent, or on average about 2150 samples annually. However, after the data cleaning process, the numbers of samples are 2019, 2094 and 1933 for the years 2008, 2009 and 2010, respectively. The proportions of samples in each socio-economic category are given in Table 1.
The sample proportion across variables (%).

Even though the sample in 2010 is smaller compared to the two earlier surveys, the proportion across each variable is relatively the same. However, one deviation is the mid household income, which is 458,730.6 SEK/year in 2008, 450,942.8 SEK/year in 2009 and 511,315.2 SEK/year in 2010. This indication, as well as the sample proportion for each socio-economic factor (see Table 1), should be kept in mind when interpreting the results. As expected, only a handful of the respondents reported themselves as have-nots, that is, on average approximately 2 per cent of the respondents every year. The analysis indicates that the number of mobile phone have-nots and services are decreasing over time.
Variable specifications
To describe the characteristics of the have-nots of mobile phones and services, the current study considers the individual’s ownership of a mobile phone (and services) as the dependent variable. Even though this may be too crude to conceptualize have
Moreover, mobile phone ‘have-nots’ do not have a level of non-use as the ‘haves’ may have the level of use, that is, frequent use, less frequent use, etc., and therefore it is not realistic to stratify the degree of non-use. In this case, however, the definition does not cover a situation where mobile phone have-nots may use the mobile phone through their peers, that is, family members, etc., which is also a possibility in everyday life. This decision is also made by considering the survey question, which was not suitable for constructing such categories.
Regarding the characteristics of mobile phone have-nots, Rogers (2003: 295) indicates that they typically consist of marginalized individuals with the least socio-economic power (e.g. elderly, low educated and/or unemployed). Some prior studies of the mobile phones have-nots (e.g. Leung and Wei, 1999; Wei, 2001) make similar propositions. Therefore, the current study involves several socio-economic variables in order to be able to investigate the marginalization issue. The variables and the hypotheses related to these, proposed on the basis of previous studies, are presented below.
Gender
Some studies have indicated that gender is associated with the adoption of technology such that females are later adopters than males. For instance, an early study by Schement (1995) found that females tend to be laggards when it comes to fixed telephony adoption in the US. However, Leung and Wei (1999) and Wei (2001) found that this is not the case when it comes to adoption of mobile phones and services in Hong Kong. In contrast, both Ling (2000), studying Norwegian mobile phones users, and Rice and Katz (2003), studying mobile phone users in the US, found that females are later adopters of mobile phones and services, findings which indicate that the gender issue may be country/culture specific. Therefore, it is interesting to investigate this issue in a Swedish context.
Hypothesis 1 (H1): Females are more likely than males to be have-nots of mobile phones and services.
Age
Many user behaviour studies of mobile phones and services show the importance of age. Axelsson (2010), for instance, argued that attitudes towards mobile phones are more dependent on life stage than culture. What is argued is that young adults in general have specific needs that are fulfilled by mobile phones and services, such as emancipation from their parents and perpetual contact with their new significant others, that is, their peers. Elderly people, on the other hand, do not have the same social network and therefore need to be in continuous contact. They may also suffer from physical deficiencies, such as problems with their sight or motoric problems, which may hinder them from using mobile phones. In addition, elderly people may lack sufficient knowledge (particularly in relation to mobile services) as well as knowledgeable friends, so called ‘warm experts’ (Bakardjieva and Smith, 2001), who could advise them. This issue will be investigated in the current study by contrasting the group of young adults (aged 16–25) and the group of elderly people (aged 65 and older).
Hypothesis 2 (H2): Individuals aged 16–25 are less likely than the average individual to be have-nots of mobile phones and services.
Hypothesis 3 (H3): Individuals aged 65 and older are more likely than the average individual to be have-nots of mobile phones and services.
Education level
Technology literacy is often associated with education level. In the current study we compare two groups, that is, individuals without a high school education and individuals with a university degree, in order to find out whether, in this specific context, technology adoption is associated with education level.
Hypothesis 4 (H4): Individuals with low education (less than high school) are more likely to be have-nots of mobile phones and services.
Hypothesis 5 (H5): Individuals with high education (university degree) are less likely to be have-nots of mobile phones and services.
Employment status
When it comes to the relationship between use of mobile phones and employment status, Ling (2000) found that employment status is associated with possession of mobile phones in Norway, whereas Leung and Wei (1999) and Wei (2001) both indicate that this is not the case in Hong Kong. Wei (2001) therefore elaborates this variable by further categorizing employment into various types of occupation. However, since the focus of the current study is mobile phones have-nots and services, we will only look at whether, and if so how, unemployment, since it is associated with the segment of population that most likely have least economic power, 4 is associated with non-usage of mobile phones and services.
Hypothesis 6 (H6): Unemployed individuals are more likely to be have-nots of mobile phones and services.
Fixed telephone ownership and type of housing
Rogers (2003: 15) argues that past adoption of innovations will likely affect the adoption of future innovations, as people will examine the relative advantage, compatibility, complexity, trialability and observability with reference to the past adoption. As a communication device, a mobile phone can, to some extent, be seen as a substitute for a fixed phone. Therefore, it makes sense looking at fixed phone ownership in order to predict and explain the decision to become a mobile phone have-not. The residential status is likely to be a critical factor in this context, since many rental apartments in Sweden typically have fixed phones included as a housing facility, something that may increase the probability of the tenant becoming a have-not of a mobile phone. The rental type of housing may also indicate less socio-economic power.
Hypothesis 7 (H7): Individuals with fixed phone are more likely to be have-nots of mobile phones and services.
Hypothesis 8 (H8): Individuals living in rental housing are more likely to be have-nots of mobile phones and services.
Household income level
In general, household income is related to consumption. For instance, a study by Wei (2001) found that income is a significant factor predicting the diversity of possession and use of mobile phones and services in a household. Therefore, it is important to see if income level is related to ownership and use of mobile phones and services. In this study, income level is equivalent with annual household income. The survey proposed 13 unequal intervals at different income levels. To approximate a continuous income value, the midpoint of each income interval is used to represent the continuous income. This categorization makes the assumption that the actual incomes of the individuals in each interval are evenly distributed (Bhat, 1994). As the top interval of this variable is open-ended, the midpoint is estimated using the Pareto Curve for each annual survey, as discussed by Parker and Fenwick (1983). The median of income is estimated by weighting the level of income with the associated annual Consumer Price Index (CPI) to provide comparable annual income effects.
Residential area
The access to mobile services is often determined by geography, that is, network coverage. Even though it may not be the case for Sweden, it is interesting to confirm this assumption. According to the survey data, there are several types of residential area, for example metro areas (consisting of Stockholm, Göteborg and Malmö), urban areas and rural areas. This study makes a comparison between individuals residing in a metro area with individuals living in rural areas in terms of mobile phone possession.
Hypothesis 9 (H9): Individuals residing in metro areas are less likely to be have-nots of mobile phones and services.
Hypothesis 10 (H10): Individuals residing in rural areas are more likely to be have-nots of mobile phones and services.
Estimation method
To estimate the contribution of each factor discussed in the earlier section, the analysis makes use of a logit model which assumes that an i-individual in a population N (i = 1, 2, 3…N), faces a binary choice, that is, being have-nots (j = 1) or not (j = 0) in the set J. If the likelihood of the individual’s decision is examined as a discrete choice (McFadden, 1981), individuals with similar socio-economic and other relevant attributes can be assumed to show a similar utility preference. Therefore, their socio-economic and other relevant attributes profile can be associated with the probability of making a decision to be a mobile phone have or have-not. The maximum utility of the i-individual when choosing the decision j then can be expressed as
where
The probability of the ith individual decided to become a mobile non-user (j = 1) can be estimated as

Since qi is not observed in this study, the indirect utility can be specified as
where
where
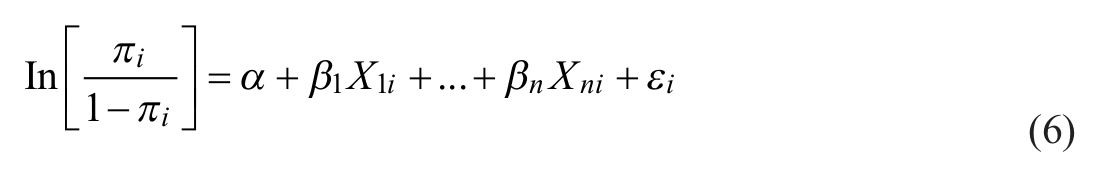
where ln is base of natural logarithms,
Since this study uses 11 explanatory variables, as listed in Table 1, then the probability of the ith user with socio-economic characteristics

The specified logit model (8) is used to estimate the samples for each annual survey as well as the pooled samples from 2008–2010. Using the pooled data, the interaction effects between the variables and the year of the survey are estimated to reveal the dynamic of each variable over time.
Results
The logit model specified earlier is applied using the logistic regression procedure in the SPSS software with the binary status of users as mobile have or have-nots as the dependent variable and other socio-economic variables as dependent invariables. The detailed estimation result is provided in Table 2. The model yielded a Nagelkerke 5 R square value of 0.17, for the 2008 data, 0.20 for the 2009 data, 0.24 for the 2010 data and 0.20 for the pooled data from 2008–2010. This suggests that only 17–24 per cent of the variance in the data can be explained by the model. For each socio-economic factor, the estimation results are discussed as the following.
Estimation results.
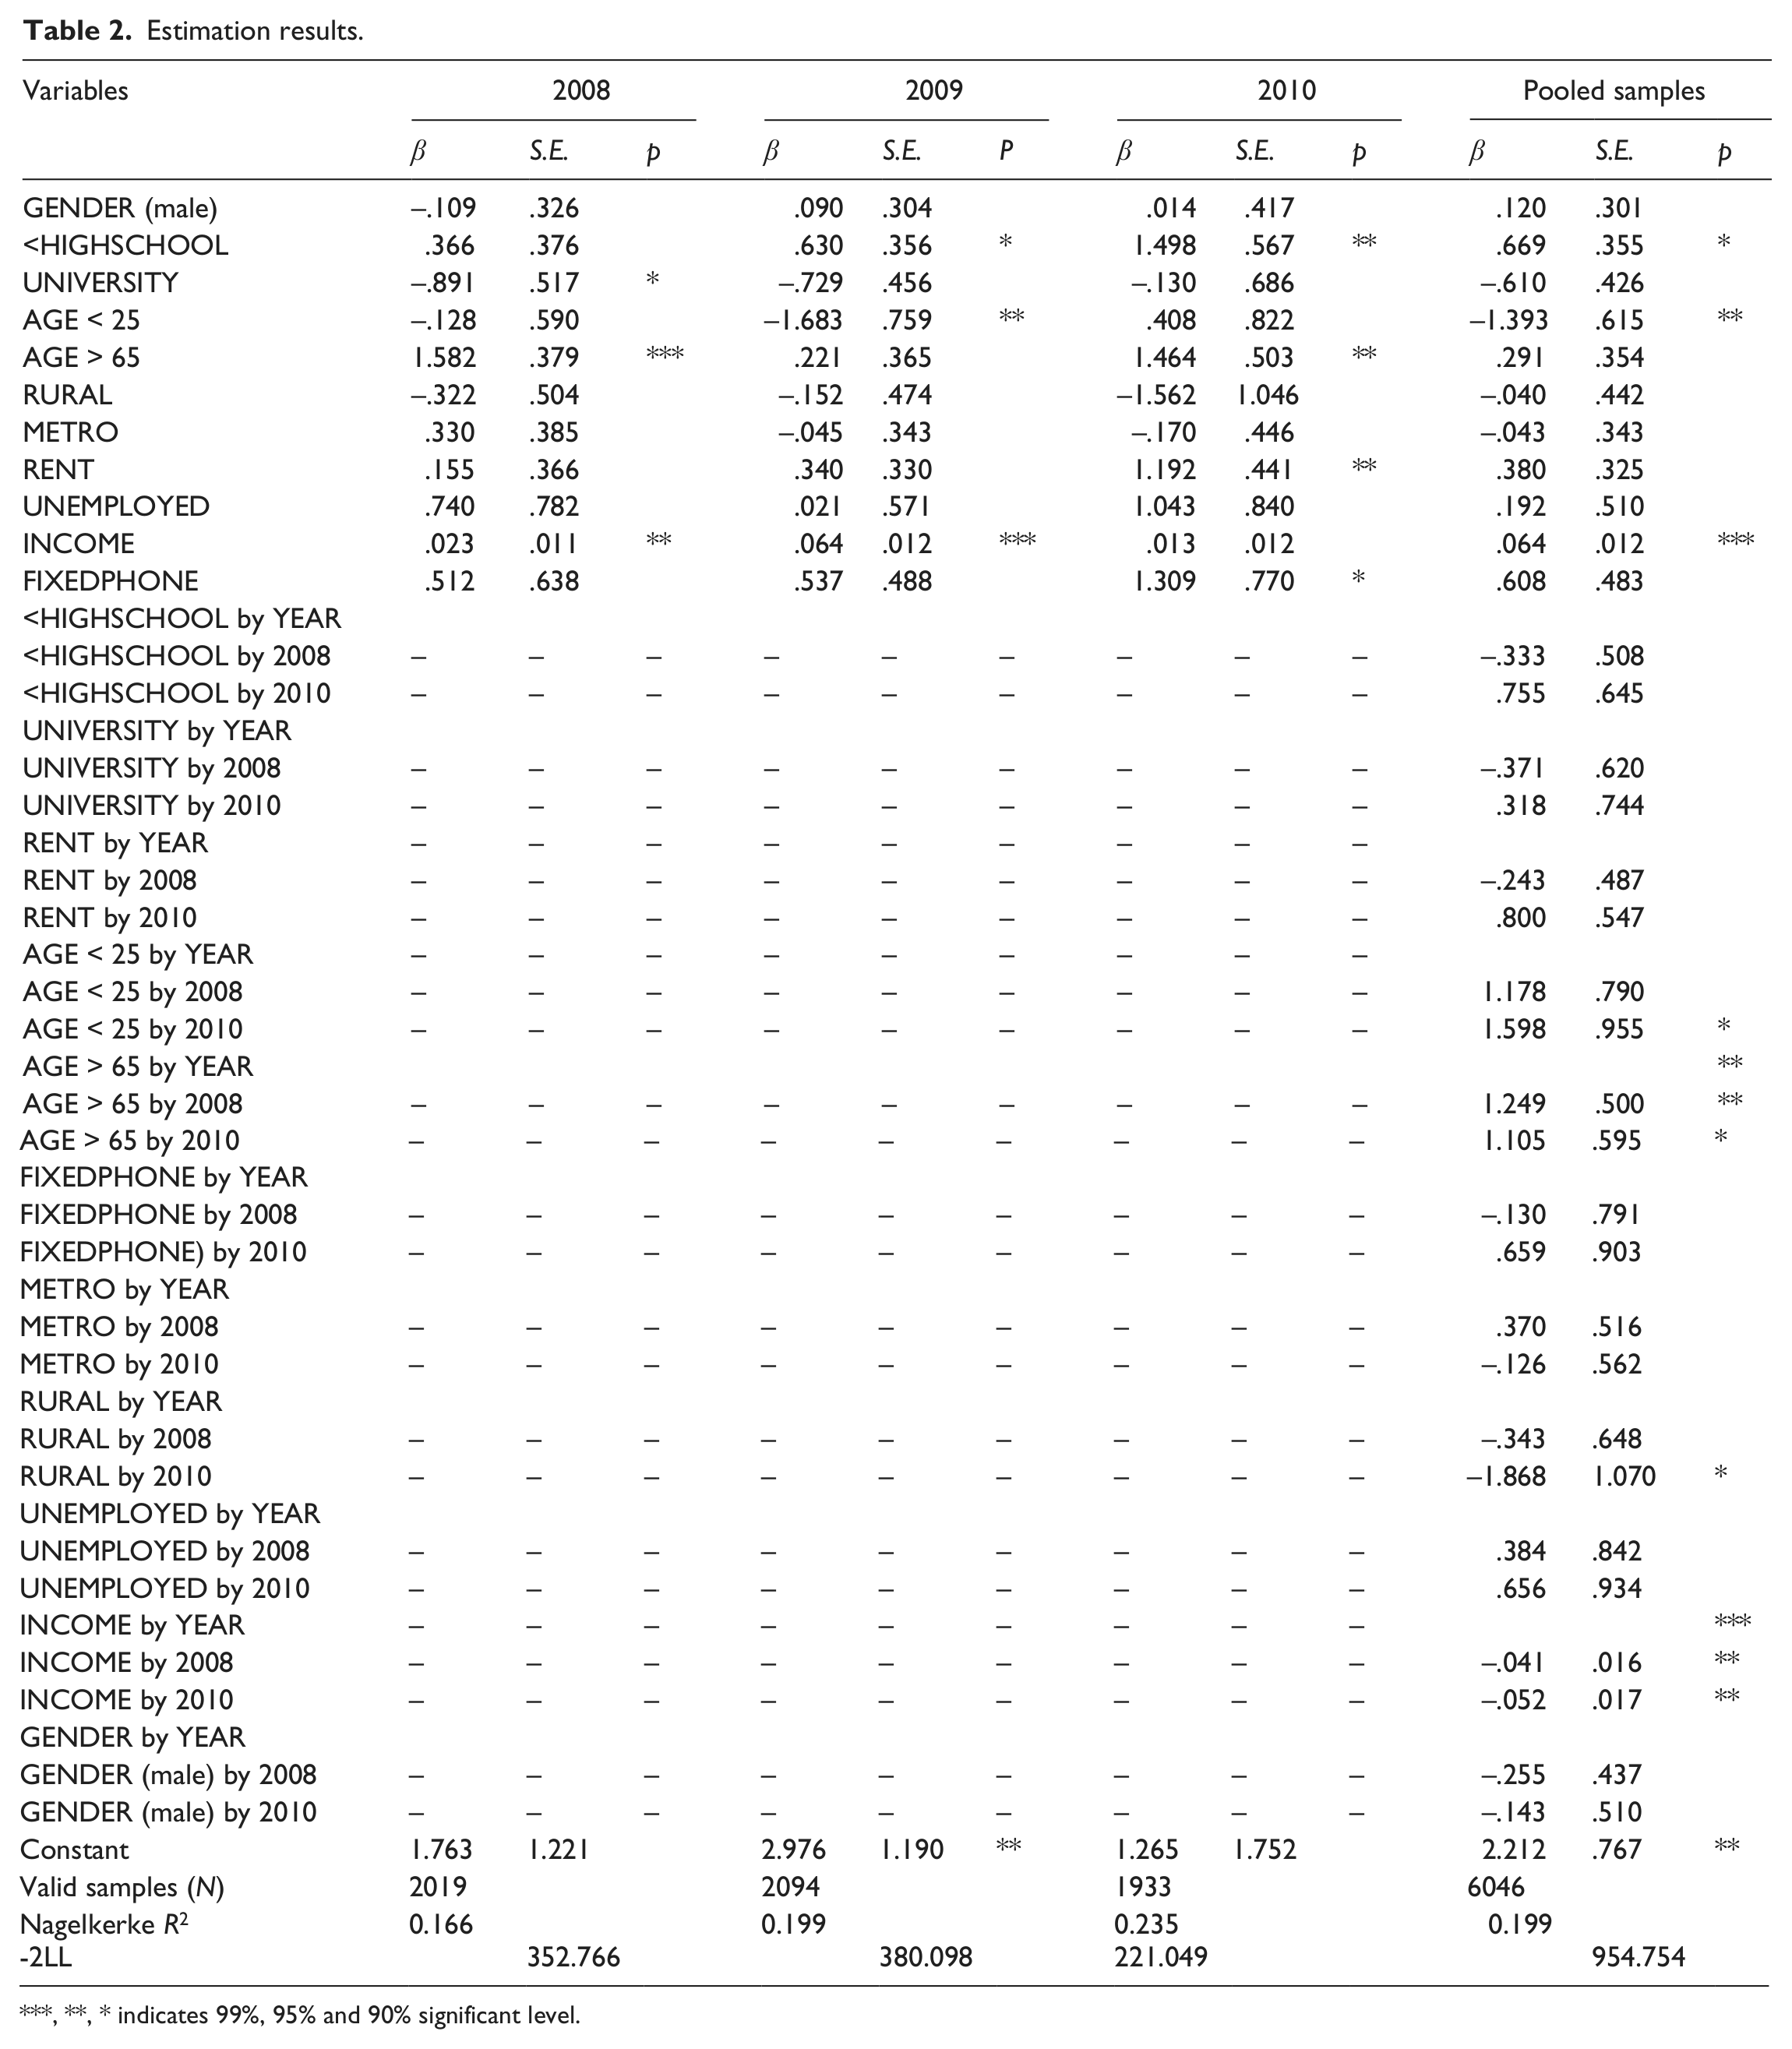
***, **, * indicates 99%, 95% and 90% significant level.
Gender
As shown in Table 2, there is no correlation between gender and likelihood of being a have-not. Also, there is no significant difference between males and females in terms of access to mobile services based on the annual survey samples. This trend is also consistent over time, as indicated by the interaction effect in all years as well as the proportion, as shown in Table 2. These results are similar to the ones from Hong Kong described by Wei (2001), arguing that gender is not a good predictor for the mobile phone have-nots and services. Hypothesis H1 cannot be confirmed.
Age
The results presented in Table 2 show that young adults (aged 16–25) are less likely to be mobile phone have-nots, and therefore age is a significant variable as predictor. However, there was no interaction effect observed between this variable and year of the survey, which proposes that the variable is not time dependent. In contrast elderly people (aged over 65) show a tendency to be have-nots, with an increasing trend. Thus, this segment of the Swedish population is likely to be the best predictor of the mobile phones have-nots and services. This result indicates that hypotheses H2 and H3 are strengthened. However, a further study at the micro level, of the attitudes of elderly people, is needed to support this argument.
Education level
Individuals with low education level (not having finished high school) are more likely to be have-nots of mobile phones and services, with an increasing trend over time. In the first wave (2008) the variable named <HIGHSCHOOL is not significant, but in subsequence waves (2009 and 2010) the variable is significant with 90 per cent and 95 per cent confidence levels. Thus in 2009 the likelihood that individuals not having completed high school will be have-nots of mobile phones and services is 1.870 times higher compared to those individuals who have completed high school, and that increased to 4.435 times higher in 2010, provided that all variables in the model were held constant.
A similar indication is shown by an analysis of the pooled data, which is significant at a 90 per cent confidence level with an odd ratio at 0.514. Thus hypothesis H3 is strengthened. However, the interaction effect of this variable with year of survey is not significant, something which indicates that the impact of low education basically does not change over time. This is also confirmed by the part of have-nots in the total sample of this group, which is fairly constant over time. However, it is fair to mention that the short time span of the data also contribute to the situation, as within three years the level is not expected to change significantly.
In contrast, people who have a university degree are not very likely to be have-nots. The variable named UNIVERSITY is only significant at a 90 per cent confidence level in the 2008 survey, but no longer significant in the subsequent years. The estimation result for the pooled samples and interaction effect shows similar results. This suggests that a high level of education is not a good predictor for being a non-user and thus hypothesis H4 cannot be confirmed.
Employment status
Although normally unemployed individuals are considered to have financial constraints preventing them from having mobile phone subscriptions, the current results indicate that this is not the case in Sweden. The tabulation of the mobile phone have-nots for this group in Table 1 shows that there is an extremely low number of unemployed individuals who are have-nots of mobile phones and services. The estimated parameter in Table 2 also indicates that this factor is insignificant as a predictor for being a non-user and thus hypothesis H5 is not supported.
Fixed telephone ownership and type of housing
As depicted in Table 2, there is no significant relationship between fixed phone ownership and the likelihood of being a non-user of a mobile phone. Individuals renting their apartment and a fixed infrastructure with the housing are not more likely than individuals owning their housing to be have-nots of mobile phones and services. This suggests that neither ownership of a fixed phone nor type of housing is correlated with non-usage of mobile phones and services. Neither hypothesis H6 nor H7 are thus supported.
Residential area
Although the possession of a mobile phone is, in practice, strongly related to network coverage, the result in the current study shows the opposite. There is no significant correlation between residential area and use of mobile phones and services. This is most likely an indication of the fact that both fixed and mobile networks are well developed in all areas of Sweden. Neither individuals living in metro areas (Stockholm, Gothenburg or Malmo) nor in rural areas (municipalities with less than 90,000 inhabitants within a radius of 100 km from the city centre) show any likelihood to be have-nots of mobile phones and services. Hence neither of the hypotheses H8 and H9 is supported.
Income level
The variable named INCOME, representing annual household income, is identified as the most significant factor determining ownership of a mobile phone. The results of the sample estimation of the sample for each year, as well as the pooled samples, indicate that this variable is highly significant as a predictor of usage of mobile phones and services. However, this variable has a considerably low marginal effect when it comes to the likelihood of being a non-user. Based on the result in Table 2, the estimated marginal effect for every 10,000 SEK income increase in annual household income (less than 860 SEK/month) for the year 2008 is −0.00027, −0.00047 for 2009 and −0.00012 for 2010. The negative value, which is close to zero, means that annual household income is (negatively) inelastic to the decision of being mobile service have-nots. Thus a decrease in household income will not encourage people to be have-nots of mobile phones and services.
Discussion
The results of this study suggest that among the socio-economic factors, only age and household income significantly correlate with the likelihood of being a have-not of mobile phones and services, even though the aggregated effect of household income is very low. Some factors are also found to dynamically change over time, that is, education, housing status and possession of fixed phone. This observation indicates that socio-economic factors are transient during different stages of the innovation adoption process, which has previously been argued by Dutton et al. (1987). The results of this study, which are different from prior studies (particularly that of Wei, 2001), also support this proposition. However, since the study by Wei (2001) was conducted over a decade ago, the have-nots in that study may today be a part of a different category, that is, late adopters, whereas in the current study they may belong to the group of individuals who completely reject the technology.
In order to provide a more detailed explanation of the dynamic relationship between these two variables, age and income, and mobile non-usage, a graphical description technique as proposed by King et al. (2000) is used. The result is shown in the figures.
According to Figure 1, individuals aged over 55 have a considerably higher probability of being mobile phone service have-nots compared to others ages. This tendency is continuous over time with a significant decreasing trend. When it comes to income, Figure 2 shows that individuals with an annual household income of less than 200,000 SEK show a considerably higher tendency of being have-nots compared to others. The risk is even higher for those individuals aged 60, a group exceeding 10 per cent of the population. This suggests that the combined effect of age and income is most severe for individuals with the least socio-economic power, that is, elderly people with low income.
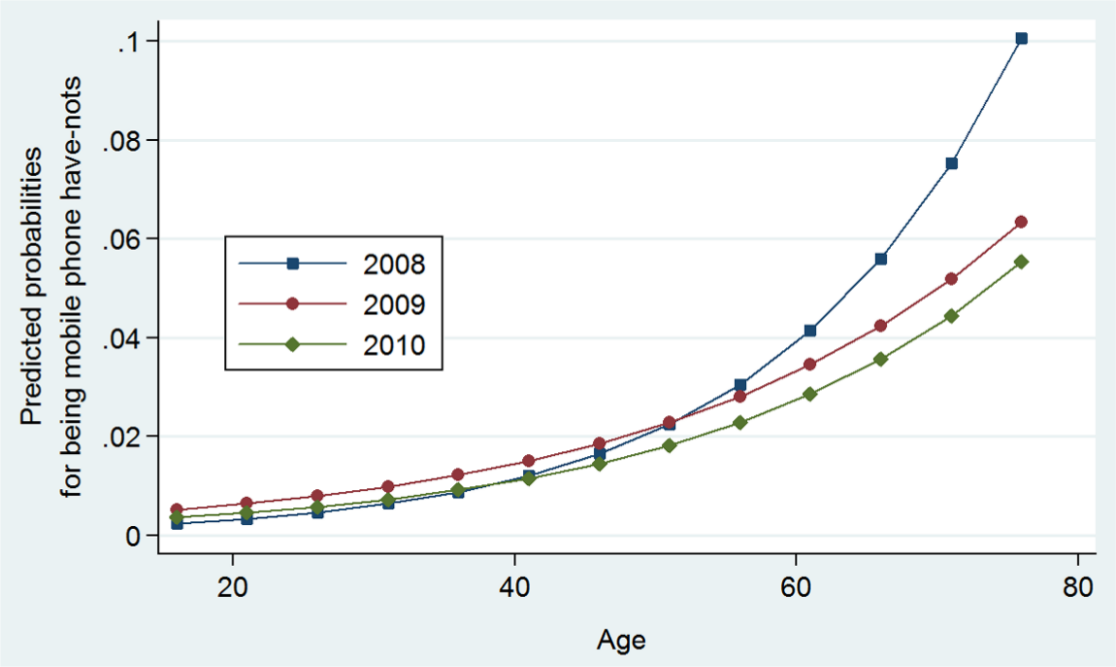
Dynamic predicted probabilities of being have-nots of mobile phones and services across age over time based on pooled samples (2008–2010).

Interaction effect between have-nots status with age and income based on pooled samples.
From a social construction perspective, users play an important role in the construction of technology (Pinch and Bijker, 1987). Therefore, in this context, elderly people with low income may give mobile phones and services a certain meaning, that is, ‘expensive, useless’ (due to a limited social network to communicate within), and ‘complicated device’, which might result in the decision of not owning a mobile phone. In this case, however, the current study has a limitation since it only focuses on the passive attributes of individuals in relation to their mobile non-usage. In fact, as discussed by Wyatt (2003), a decision to not use a technology can be passive but can also be an active choice of the individual. This suggests that non-usage is not necessarily a result of financial constraints or lack of access to technology. Being a have-not should also not be seen as a right or wrong decision, rather it should be seen as a preference of the individual, which then may result in that they become understood as and labelled rejecters, excluded or expelled. As suggested by Bruland (1995: 144) ‘[non-use] could thus be seen as a positive part of a social selection process, not an obstacle to the inevitable march of technological progress’. This could be further investigated and understood by studying have-nots more qualitatively, by conducting interviews with have-nots, something which, however, is not within the scope of this study.
In relation to universal service, the results of the current study indicate that the mobile service infrastructure in Sweden may be sufficient when it comes to ensuring access availability for everyone, but that it still cannot prevent some people from being ‘disconnected’, be it by the individual’s own choice or not. This also includes individuals with special needs, that is, disabled and children. Therefore, as suggested by Alleman et al. (2010), a universal service policy should be based on connectivity, that is, the ability of people to access services rather than defining a particular technology or service to subsidize. Levin (2010) also emphasizes that it is important to distinguish between the availability of a service and the use of the service when formulating the universal service, since they address different aspects. The service availability measures mainly deal with aspects related to infrastructure development, whereas the use of the service will concern the social constraints, including technology literacy. Therefore, if mobile services are considered a tool to provide a universal service, the focus should be on enabling everyone to use mobile services, disregarded their social and physical capabilities, even though coping with the former is often more complex than the latter. This can be achieved by understanding the technological frame sharing – the interpretation of the technology shared by members of a relevant social group, that is, users and service providers, and elaborated by the regulator through relevant formulation of a universal service policy.
Conclusions
This study found that the majority of the socio-economic factors are no longer relevant when trying to develop access and use of mobile phone services in Sweden. This finding supports the argument that socio-economic factors are transient during different stages of the innovation adoption process. What was significant a decade ago may no longer be significant today, something which indicates that society both shapes and is shaped by mobile technologies. Such a change has been rapid as the result of a fast technological advancement in the field of mobile phones. A multiple time series observations, therefore, is preferable in order to be able to propose a comprehensive view of user dynamics and the evolving process, particularly when it comes to studies on have-nots and non-adopters.
This current study also concluded that the existence of have-nots of mobile phones and services may not reflect socio-economic inequalities of the society in general but individual preferences of users trying to manage certain individual constraints, that is, old age. Further studies, preferably qualitative, micro-level investigations, are yet needed in order to bring forward insights concerning attitudes towards access to and use of mobile technologies, attitudes that may be highly significant in relation to the decision of becoming a non-user.
In relation to the universal service issue, the results of the current study show that access availability still cannot prevent some people from being ‘disconnected’ as it can equally well be an active preference of the individual as an individual constraint. This study therefore supports the argument that a universal service policy should focus on connectivity, that is, people’s access rather than defining a particular technology or service to subsidize. Consequently, if mobile services are considered as a part of the universal service, the focus should be on making sure that everyone will be able to use mobile phones and services disregarded their individual attributes and possibilities. The policy should also consider technological frame sharing – the interpretation of a technology shared by members of a relevant social group, that is, users, service providers and regulators – to bring a more socially constructed technology that can protect individuals with less socio
Footnotes
Acknowledgements
The authors would like to thank the Swedish Post and Telecom Agency (PTS) for helpful data support.
Funding
This research received no specific grant from any funding agency in the public, commercial or not-for-profit sectors.