



Abstract
To study the causal impact of smartphone use on academic performance, we collected – for the first time worldwide – longitudinal data on students’ smartphone use and educational performance. For three consecutive years, we surveyed all students attending classes in 11 different study programmes at two Belgian universities on general smartphone use and other drivers of academic achievement. These survey data were merged with the exam scores of these students. We analysed the resulting data by means of panel data random-effects estimation controlling for unobserved individual characteristics. A 1 SD increase in overall smartphone use results in a decrease of 0.349 points (out of 20) and a decrease of 2.616 percentage points in the fraction of exams passed.
Introduction
One of the election promises Emmanuel Macron made during the presidential campaign of 2017 in France was to ban smartphones from secondary schools. After he was elected, Macron kept this promise and implemented a law prohibiting smartphones at school (Willsher, 2017). Recently, this same policy option has been discussed in multiple countries all over the world (McGreevy, 2019). Moreover, a survey in the United Kingdom shows that about 49% of parents are in favour of such a smartphone prohibition (BBC, 2019). By implementing a smartphone ban, governments aim to reduce the negative consequences of smartphone use on adolescents’ educational performance. However, the main question persists of whether this measure is appropriate and supported by scientific evidence.
Indeed, several theoretical arguments in the scientific literature posit a negative impact of smartphone use on educational performance. 1 First, there is a time trade-off (Becker, 1965) between smartphone use and study activities. Time spent on the smartphone is time that students cannot use to study. Second, the presence of smartphones might hamper study-related activities due to multitasking behaviour that has been related to reduced academic performance (see, for example, Junco, 2012). This cyberslacking behaviour (i.e. the use of smartphones by students for non-class-related activities (Rana et al., 2019) might be caused by (1) visual and auditory notifications attracting students’ attention (Junco and Cotten, 2012), (2) the desire to not miss out on what is happening online (Chen and Yan, 2016) and (3) lack of academic motivation (Hawi and Samaha, 2016). Finally, smartphone use might have an indirect effect on academic performance through its impact on students’ health. Recently, technology use has been associated with negative health consequences such as (1) sleep quality (Amez et al., 2020; Christensen et al., 2016), (2) mental health (Li et al., 2015), (3) attention-deficit disorders (Ra et al., 2018) and (4) physical fitness (Lepp et al., 2014). Those health parameters have in turn been associated with reduced academic performance (see, for example, Baert et al., 2015; Galambos et al., 2013). On the contrary, smartphone use might help students with their academic tasks in at least two ways. First, the mobile nature of a cell phone allows students to look for course-related information anywhere and anytime (Lepp et al., 2014). Second, smartphones enable new and fast ways of communication that facilitate collaboration between students (Chen and Ji, 2015).
However, the number of empirical studies investigating whether the negative mechanisms are dominant – and thus justifying a smartphone ban – is rather limited (Amez and Baert, 2019). We are aware of only one study that looks into the relationship between smartphone use and educational performance in a secondary education setting. Beland and Murphy (2016) measure how high school students score on tests after introducing smartphone restrictions in schools in four different cities in the United Kingdom. They find that test scores improve following the implementation of a smartphone ban. With respect to tertiary education, the scientific literature on the relationship between smartphone use and exam scores is somewhat larger. Amez and Baert (2019) systematically review 23 empirical studies, of which 17 report a significant negative association between students’ smartphone use and educational outcomes. For instance, in the United States, Rosen et al. (2018) find a negative association between logged phone use 2 and actual course grades. 3
Despite the dominance of studies reporting a negative association in tertiary education settings, the empirical findings in the literature to date – with the exception of Baert et al. (2020) – cannot be interpreted in a causal way. These studies rely on observational, cross-sectional data that are exploited by means of correlational and/or (linear) regression analyses (Amez and Baert, 2019). As a consequence, it is possible that the measured negative association reflects a variation in unmeasured characteristics that have an impact on both smartphone use and academic performance such as ability and discipline (Baert et al., 2020). Baert et al. (2020) also exploit observational, cross-sectional data but apply an instrumental variable approach to claim a causal negative impact of smartphone use on exam scores. However, their causality claim depends entirely on the validity of the exogenous instruments they use to predict overall smartphone use.
Nevertheless, identifying a causal relationship between smartphone use and academic performance is crucial to support smartphone policies in higher education institutions. When the observed negative association is just reflecting variation in other (unobserved) characteristics, implementing a policy on smartphone use in educational settings is useless and might even be harmful. In this respect, Chen and Yan (2016) argue that systematic and longitudinal research programmes are needed to fully understand the relationship between smartphone use and academic performance.
To fill this gap, we collected – for the first time worldwide – longitudinal data specifically on variables concerning both smartphone use and academic performance. Our panel data random-effects approach exploits this longitudinal data in two ways. First, the empirical finding can be interpreted in a causal way under certain conditions (see infra) because we control for unobserved individual heterogeneity. Second, panel data random-effects estimations take into account the variation in smartphone use both between- and within-individuals more efficiently than standard pooled linear. In robustness analyses, we relax the assumptions underlying the identification of the effect by (1) combining random-effects estimations with instrumental variable techniques and (2) fixed-effects estimations that take only within-individual variation into account.
Data
Research population
For three consecutive years, we surveyed all students attending classes in 11 different study programmes at two major Belgian universities, Ghent University and University of Antwerp. The first year, we surveyed only freshmen students at both universities. During the second year, both freshmen students and students who participated before were targeted. In the final year of data collection, we aimed to include all students who had participated before as well as the freshmen students. At both universities, a similar set-up was used to collect the survey responses. The principal researcher entered a main course of the students’ curriculum during the last week of the semester before the Christmas break and asked the students to fill in a paper-and-pen questionnaire. Typically, students use the Christmas break to prepare for their upcoming exams. As part of the questionnaire, students were asked for consent to combine their answers on the questionnaires with their exam results of this forthcoming exam period. When students did consent, their exam results were provided by the faculty administration to an independent third party, who merged these results with the survey data provided by the researcher. This procedure was followed in December 2016 4 and 2017 at Ghent University. At the University of Antwerp, we additionally collected data in December 2018.
Initially, 2060 paper-and-pen questionnaires were collected during the data collection in December 2016, 2017 and 2018. 5 For 104 survey observations, no exam scores were observed by the faculty administration, indicating that the respective students dropped out before the exam period. Next, we had to exclude 25 observations of students who indicated that they did not own a smartphone (see infra). Finally, 48 observations contained incomplete or inconsistent information and were dropped from the sample. Therefore, our final sample consists of 1883 observations with complete information spread over 1637 unique individuals, which is remarkably larger than most previous studies in the literature.
Measures
The paper-and-pen questionnaires consisted of two main sections. In the first section, students were asked about their smartphone use. In the second section, students were asked about general socioeconomic characteristics.
The students started the questionnaire by answering the question ‘Do you own a smartphone (i.e. a mobile phone which enables more computer capabilities than sending text messages and making calls)?’ Next, smartphone use was surveyed in three different ways. First, students answered the Smartphone Usage Subscale of Rosen et al. (2013), which asked them to indicate how frequently they use their smartphone for nine different activities (e.g. listening to music or taking pictures). Rosen et al. (2013) collected an initial list of (smartphone) activities based on organised focus groups. Next, this initial list of items was subject to a factor analysis yielding the final list of nine activities as presented in Figure 1 of Appendix 1. The participants’ frequency of these activities was then rated on a 10-point scale (ranging from ‘never’ to ‘all the time’). Next to the empirical investigation of Rosen et al. (2013), we additionally tested the factor validity of the construct in our sample. All nine items included were subjected to an exploratory factor analysis. Using an eigenvalue cut-off of 1.000, this analysis resulted in one single factor, including all nine items. Moreover, this analysis showed moderate to high factor loadings for all these activities. 6 Therefore, the different items were then averaged yielding one score between 1 and 10. Higher scores imply a higher frequency of smartphone use. The Cronbach’s alpha of this scale in our sample was .740. In the remainder of this article, we refer to this measure as ‘overall smartphone use’.
Second, following Rosen et al. (2016), students were asked about their smartphone use while attending class with the question: ‘During a typical class period, how often do you check your smartphone for something other than the time?’ This question was scored on a 7-point scale ranging from ‘never’ to ‘more than eight times’. Finally, we surveyed the students about their smartphone use during study activities in a similar way by the question: ‘During a typical hour of studying, how often do you check your smartphone for something other than the time?’ By analogy with Rosen et al. (2016), this question was scored at a 7-point frequency scale. We refer to these scores as ‘smartphone use while attending class’ and ‘smartphone use while studying’, respectively. 7 Panel A of Table 1 presents the average scores 8 for those three measures for smartphone use. The mean score on the Smartphone Usage Subscale (Rosen et al., 2013) was 5.745, while the average score for smartphone use while attending class and while studying was 4.457 (i.e. between three and five times per class) and 3.214 (i.e. close to two times per hour), respectively.
Summary statistics.

See section ‘Measures’ for a description of the data. T-tests (continuous variables) and χ2-tests (discrete variables) are performed to test whether the differences presented in Column (4) are significantly different from 0.
***, ** and * indicate significance at the 1%, 5% and 10% significance level.
Next, we collected information on variables that were important for our empirical approach, namely potential predictors of smartphone use that were assumed to be independent of exam scores. Based on the rationale of Baert et al. (2020), these potential instruments were (1) whether the students had 4G technology on their smartphone; (2) six dummy variables capturing characteristics of the respondents’ smartphone contract (i.e. the monthly download volume in the contract exceeding 1 GB and indicators of the operator being Proximus, Orange, Base, Telenet, or another provider); (3) how the students perceived the quality of the Wi-Fi in their classrooms (scored on a 5-point scale ranging from 1 (very bad) to 5 (very good); and (4) a binary variable capturing whether the students paid the smartphone costs themselves. In Panel B of Table 1, we present the students’ average scores on these instrumental variables both for the full sample (Column (1)) and for the subsamples of participants with a below-average (2) versus above-average score (3) on the overall smartphone use scale. The instruments with respect to 4G technology and the perceived quality of Wi-Fi in the classrooms show the strongest correlation with overall smartphone use.
In addition, we surveyed the students with respect to variables that might be correlated with both academic performance and smartphone use. We distinguished these control variables based on how they change over time: (1) time-invariant control variables, (2) predetermined time-varying control variables and (3) time-varying control variables. First, we asked the participants about time-invariant socioeconomic predictors of academic performance as proposed by Baert et al. (2015): gender, foreign origin, language spoken at home, parental education, household composition, and educational achievement prior to university. Panel C of Table 1 shows that the subsample of students with an above-average overall smartphone use consisted of more students (1) with a migration background, (2) not speaking Dutch at home and (3) with worse prior educational attainment. Since these variables are likely to interfere with academic performance, we should control for them in our analysis aimed at identifying the impact of smartphone use on educational performance.
Next, we gathered information on variables that can change over time but are – in principle – determined at the beginning of the academic year. With respect to household composition, we constructed binary variables that indicate (1) whether the students’ parents were divorced and (2) whether at least one of the parents had passed away. In addition, we generated a binary variable indicating whether students were living in a student room. Furthermore, we captured students’ curriculum background by binary variables indicating their academic programme at the time of data collection. Next, we captured how many European Credit Transfer and Accumulation System-credits the students aimed to obtain in the observed semester. In addition, a binary variable was constructed indicating whether students were retaking at least one of the exams.
Furthermore, students were surveyed on the time-varying control variables. As such, the paper-and-pen questionnaire included the College Version of the Academic Motivation Scale of Vallerand et al. (1992). This scale consists of 28 items that are scored on a 7-point scale, resulting in an average academic motivation scale between 1 and 7. Higher scores indicate higher academic motivation. Based on the question ‘How would you describe your current health status?’, we constructed binary variables indicating whether students perceived their general health as (1) (fairly) bad, (2) fairly good, or (3) very good. The last control variable was a binary variable that had the value of 1 if the student indicated that he or she was currently involved in a (romantic) relationship.
Finally, Panel F of Table 1 presents the participants’ average scores on the two outcome variables constructed based on the students’ exam scores received by the faculty administration. Our benchmark variable (‘average score: completed exams’) was the respondent’s average score (graded between 0 and 20) over all the exams he or she took in the observed semester. An alternative outcome variable (‘fractions of exams passed’) was constructed by dividing the number of exams the student passed (by obtaining at least 50%, i.e. 10/20) by the total number of exams taken. As expected – based on the scientific literature cited in the introduction – both educational performance indicators are significantly worse in the subsample of students with above-average overall smartphone use. However, this correlational analysis does not take into account potential confounders, either observable – listed in Panels C, D, and E of Table 1 – or unobservable characteristics. The panel data random-effects approach we discuss in the next section takes these potential confounding factors into account.
Method
Using models based on longitudinal data yields two major advantages. First, the use of a longitudinal dataset results in more efficient estimators than those based on cross-sectional data only, since we are able to exploit both within- and between-individuals variation (Bell et al., 2019). In addition, in contrast with cross-sectional data, the longitudinal data allow us to control for unobserved individual characteristics (Verbeek, 2012).
Although the Sargan–Hansen statistic (59.425) suggested a fixed-effects estimator is preferred, we opted – in our benchmark analyses – for a random-effects approach to identify the relationship between smartphone use and academic performance for three reasons. First, we cannot rely on the fixed-effects estimator, due to insufficient within-individual variability in the data with respect to our independent variable over time. 9 Second, we aim to make an inference with respect to the student population characteristics. Therefore, we are not interested in every specific individual effect. Third, the random-effects estimator exploiting both the within- and between-individual variation is more efficient than the fixed-effects estimator that only takes within-individual variation into account. Specifically, our model can be written as

where
Under certain assumptions, the random-effects estimator allows us to identify a causal relationship between smartphone use and academic performance. More concretely, the estimator assumes that all factors affecting academic performance that have not been included as control variables in the regression can be summarised by a random error term. This implies that those factors are independently and identically distributed over all students. In addition, this approach assumes that our variables on smartphone use are strictly exogenous and are uncorrelated with the individual specific effect (Verbeek, 2012). Later, in robustness analyses we relax these assumptions underlying the random-effects estimator. First, we control for time-varying unobserved heterogeneity by combining our main random-effects approach with instrumental variables techniques. Second, we allow the individual effects
Results
Benchmark analysis
Table 2 provides the main estimation results of our benchmark analysis. First, in Model (1), students’ average exam scores are regressed on overall smartphone use taking random individual effects into account but without including any additional control variable. In Model (2), we control for the time-invariant control variables, that is, gender, foreign origin, language spoken at home, paternal education, number of siblings and prior educational attainment. Then, in Model (3), we introduce control variables that are – in principle – determined at the start of the academic year, namely academic programme characteristics, whether the student lives in a student room, whether one of the parents has died and whether the respondents’ parents are divorced. Finally, in Model (4), we additionally control for the remaining time-varying control variables: academic motivation, general health, and relationship status. In Models (5) and (6), we include all control variables and regress the participants’ average exam scores on smartphone use while attending class and smartphone use while studying, respectively.
Estimation results: benchmark analysis.
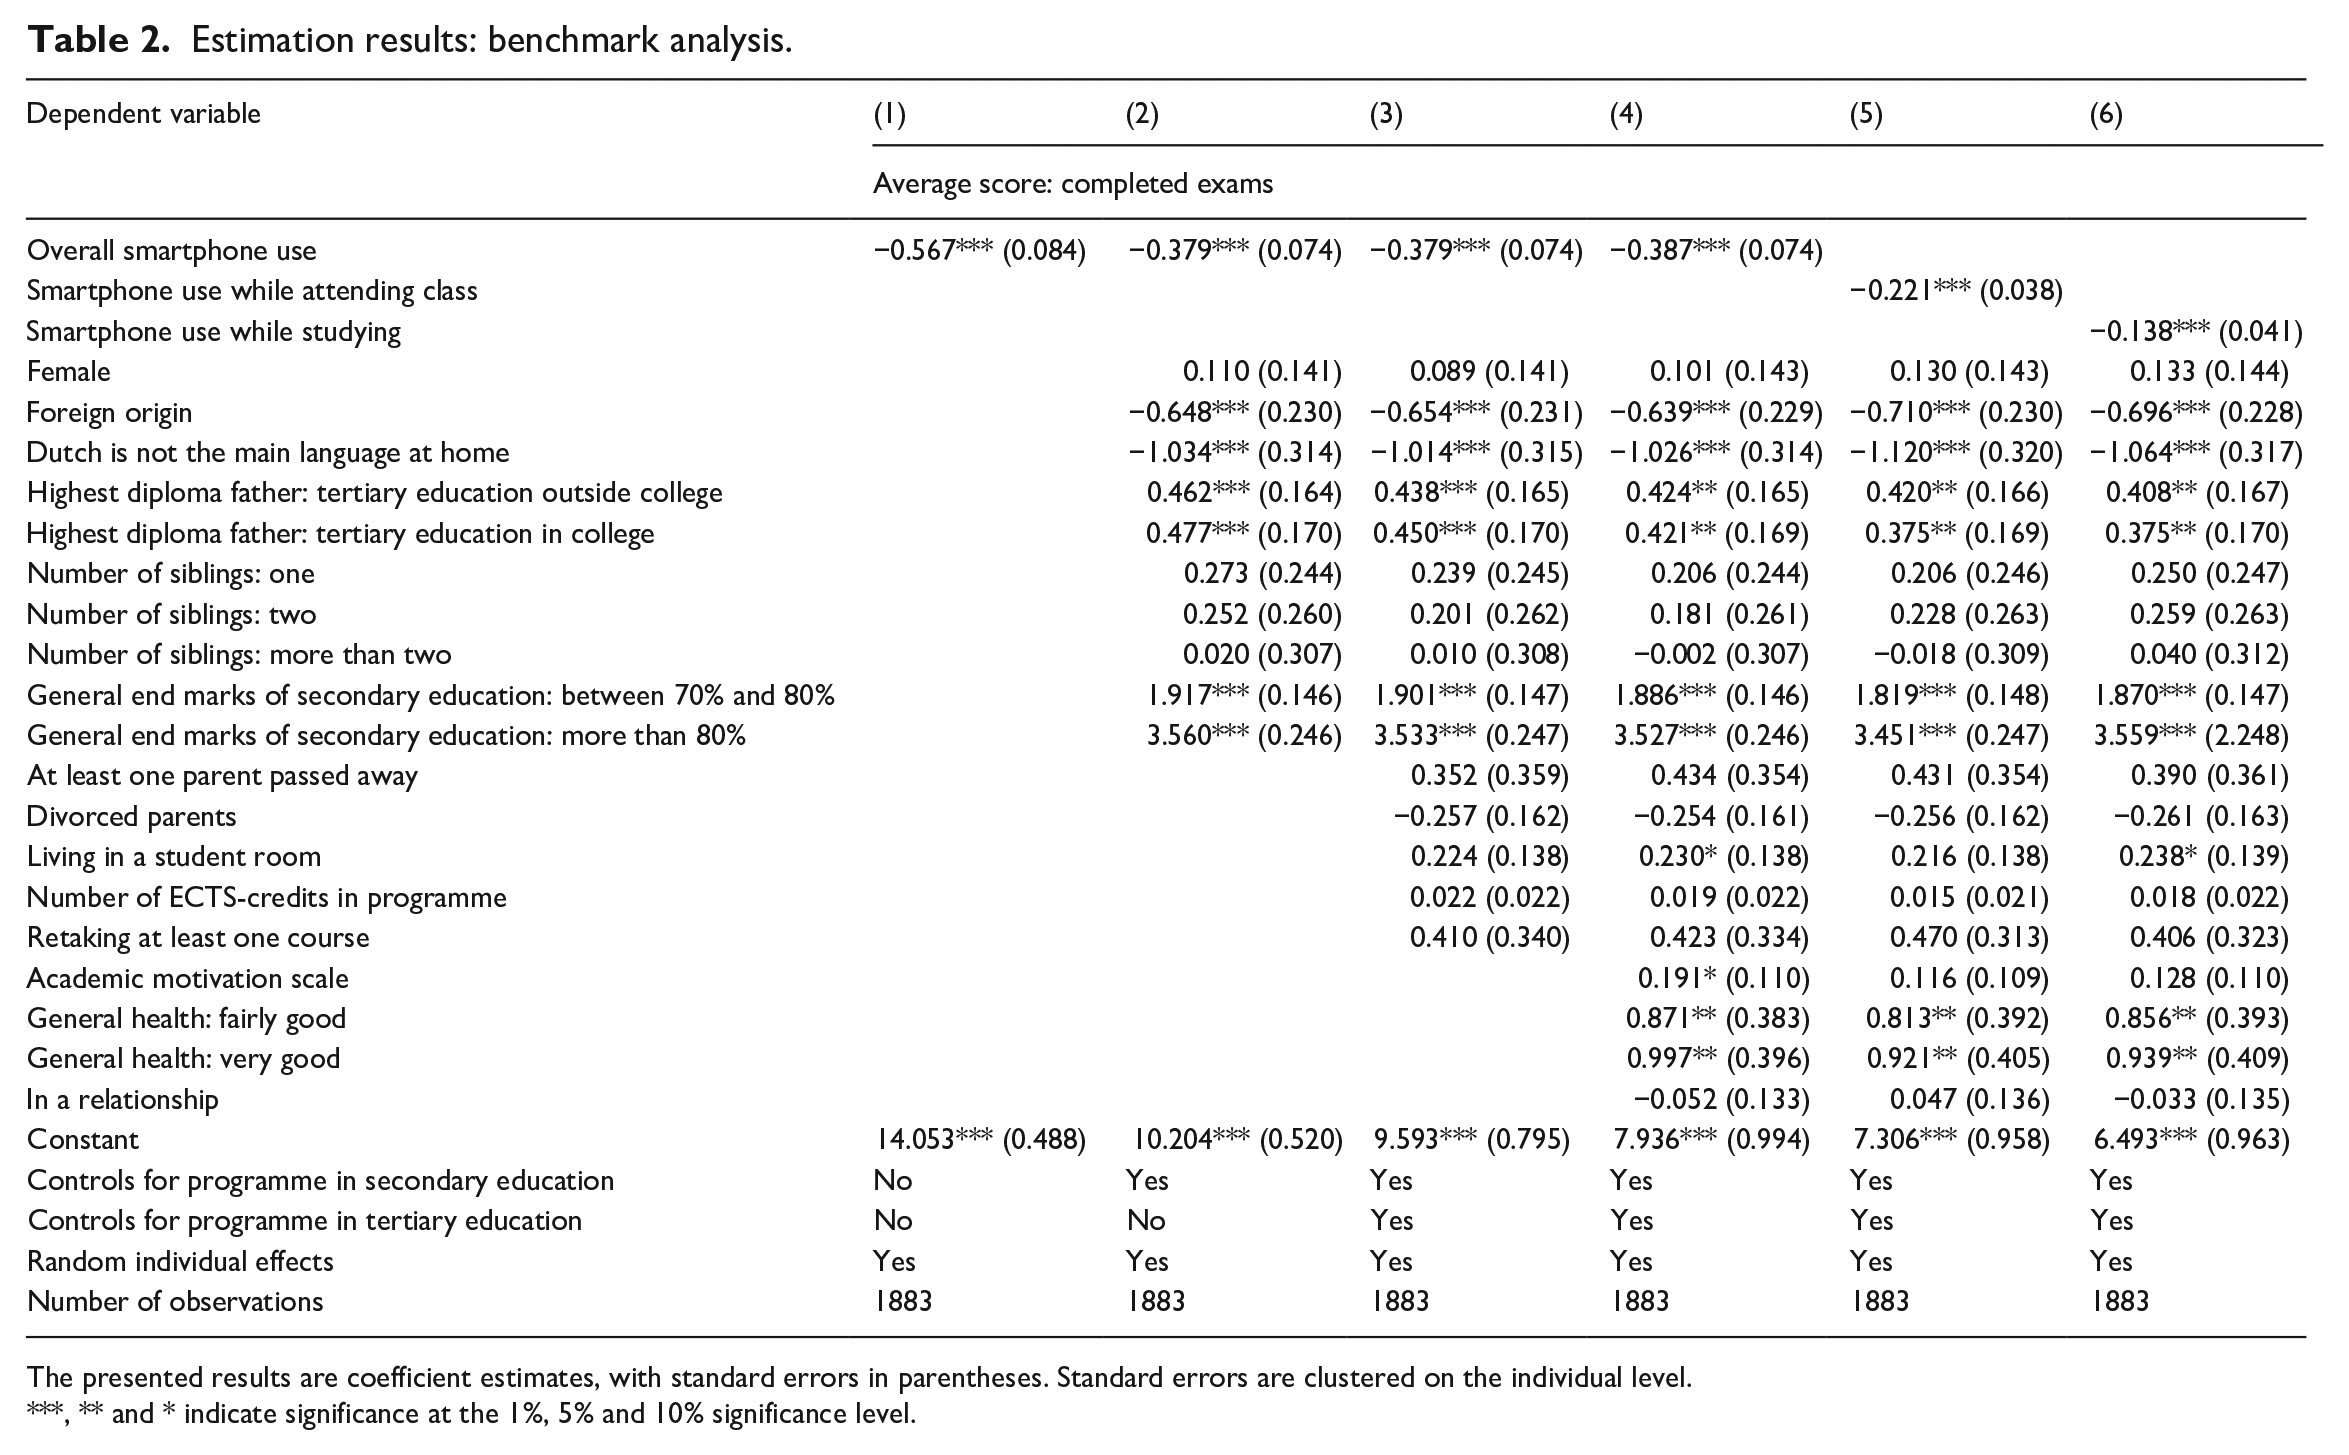
The presented results are coefficient estimates, with standard errors in parentheses. Standard errors are clustered on the individual level.
, ** and * indicate significance at the 1%, 5% and 10% significance level.
Regardless of the measure for smartphone use adopted, we find negative coefficient estimates for these variables, which are statistically different from 0 at the 1% significance level. When we do not control for potential confounding variables (Model (1)), we find a statistically significant coefficient estimate of −0.567. After including all control variables (Model (4)), we find a significant coefficient of overall smartphone use on the average exam scores of about −0.380. Stated otherwise, a 1 SD (i.e. 0.902) increase in overall smartphone use yields a decrease in the average exam score of 0.349 points (out of 20). Similar results are found with respect to the alternative indicators for smartphone use. A 1 SD increase in smartphone use while attending class (while studying) reduces the average exam score by 0.375 (0.216) points. The direction and significance of these effects are completely in line with the current correlational literature as discussed in Amez and Baert (2019). Our empirical findings suggest that those associations capture a causal relationship instead of an association through other confounding factors.
Discussion
First, we compare our main findings with the estimation results of a naïve pooled (linear) regression estimator, which inefficiently exploits both the between- and within-individual dimension of our data and thus does not account for unobserved individual heterogeneity. The estimated coefficients shown in Table 5 of Appendix 1 are very similar to the results of our benchmark analyses. With respect to the magnitude of the coefficient of smartphone use, the linear regression coefficients are slightly more negative. This might suggest that university students with a higher smartphone use are a somewhat positively selected subpopulation – positively selected with respect to unobserved predictors of academic success – of the overall population of university students.
Next, we relax the assumption of the exogeneity of our explanatory variable with respect to factors not captured in the individual random effects. To that end, we combine our random-effects approach with instrumental variables techniques. As discussed by Baert et al. (2020), the instrumental variables presented in Panel B of Table 1 are all very likely to be relevant as they put limits on students’ Internet access which is required for many smartphone applications. Table 3 shows empirical support that the used instruments are significant predictors of our smartphone use indicators – the F-tests of joint significance are consistently significant. In the first stage, we predict our indicator for smartphone use based on these instrumental variables. In the second stage, we use this exogenous prediction of smartphone use in our random-effects model. One might suspect that at least one of the instruments, that is, whether students pay for their smartphone costs themselves, is directly associated with academic performance through household wealth. However, studies on the relationship between socioeconomic background and smartphone use show that smartphone availability is unrelated to this background (Rahmati et al., 2012). Moreover, in our empirical analyses, we control for variables related to household wealth such as paternal education and indicators capturing whether students’ parents were still alive. The exogeneity of our instruments is also supported empirically by means of overidentification tests which are never significant.
Estimation results: random effects combined with instrumental variables.

See ‘Measures’ for a description of the data. The presented results are coefficient estimates, with standard errors in parentheses. Standard errors are clustered on the individual level.
, ** and * indicate significance at the 1%, 5% and 10% significance level. All instrumental variables are presented in Panel B of Table 1.
The estimation results presented in Table 3 show that we consistently find a significant negative impact of smartphone use on academic performance. However, combining random effects with instrumental variables yields an impact that is doubled in magnitude compared to our benchmark analysis. Concretely, we now find that a one standard deviation increase in overall smartphone use induces a 0.752 points decrease on students’ average exam scores. This stronger impact might be explained by the fact that our instrumental variables estimations only isolate a local average treatment effect (LATE; Angrist and Pischke, 2008). Stated otherwise, the impact of smartphone use on academic performance is identified only on those students whose overall smartphone use was affected by the instrumental variables. However, our negative impact of smartphone use on academic performance is independent of the particular set of instruments used in the analysis. We test the sensitivity of our findings including alternative sets of instruments into our model. We re-estimate Models (4)–(6) of Table 3 with two alternative sets of instruments. Table 6 of Appendix 1 presents the respective estimation result. In a first set – used in Models (1)–(3) – we combine the strongest instrument, that is, having 4G technology on the smartphone, with having a download volume of at least 1 GB, the second strongest instrument. The second set of instrumental variables (Models (4)–(6)) consists of having 4G technology and a binary variable for having Orange as the operator, the third strongest instrument. The empirical results show that our findings are independent of the sets of instruments we used.
Furthermore, we relax the assumption that all random individual effects are not correlated with the explanatory variables by performing individual fixed-effects estimations. Although this approach relaxes the error assumptions of the random effects model, it comes at an efficiency cost. Concretely, the fixed-effects estimator only takes the within-individual variation into account when our benchmark model also considers the between-individual variation. The estimation results presented in Table 7 of Appendix 1 seem to be less convincing with respect to the negative impact of smartphone use on academic performance. We only find a significant negative coefficient for smartphone use while attending class on students’ average exam scores, while the effects of overall smartphone use and smartphone use while studying have become insignificant. This might be the result of the fact that we only observe a rather small number of students (N = 220) multiple times in the data which reduces the statistical power to identify significant effects.
Subsequently, we test whether our benchmark results were robust with respect to the outcome variable. Therefore, we used our alternative outcome variable ‘fraction of exams passed’ and regressed this on overall smartphone use and smartphone use while studying and while attending class. By analogy with our benchmark analyses, we ran different regressions with random effects and an increasing set of control variables. These results presented in Table 8 of Appendix 1 confirm the significant negative impact of smartphone use on academic performance. A 1 SD increase in overall smartphone use results in passing around 2.616 percentage points fewer exams. With respect to smartphone use while attending class (studying), a 1 SD increase in smartphone use yields a decrease of passed exams with 3.055 (1.718) percentage points.
Finally, we re-estimated our benchmark model after excluding the smaller subsample of students enrolled at University of Antwerp. The estimation results shown in Table 9 of Appendix 1 are completely in line with our findings for the complete subsample. By analogy, we re-estimated the model for only that somewhat smaller subsample of students enrolled at University of Antwerp. The estimation results provided in Table 10 of Appendix 1 show that we find a consistent significant negative effect of overall smartphone use and smartphone use while attending classes while we do not find a significant impact on academic performance for smartphone use while studying. Since our findings do not seem to hinge on the university in which our sample is enrolled, these results provide evidence of external validity and suggest that the negative relationship between smartphone use and academic performance could be generalised to the overall student population in Flanders (Belgium).
Conclusion
With this study, we contributed to the growing literature on the relationship between smartphone use and academic performance. For the first time, worldwide, we exploited specifically collected longitudinal data. For 3 years, all students attending classes in 11 different study programmes at two major Belgian universities were surveyed on their smartphone use and socioeconomic variables. These survey data were merged with exam scores provided by the faculty administration. We analysed these longitudinal data on, in total, 1673 university students by means of a random-effects approach. This allowed us to (1) exploit both between- and within-individual variation and (2) control for unobserved individual heterogeneity. As such, under certain assumptions, our empirical results could be interpreted in a causal way. These assumptions were relaxed in multiple robustness analyses.
We found that increasing their overall smartphone use results in a decrease of the surveyed students’ average exam scores by 0.349 points (out of 20). Similar impacts on academic performance were found due to smartphone use only while studying and only while attending class. These negative effects remain valid when correcting for the endogeneity of smartphone use by means of instrumental variable estimations. When exclusively exploiting the within-individual dimension of our data by means of fixed-effects analyses, only the significant negative effect of smartphone use during class on exam results remains. We end this article by acknowledging its main limitations. First, we used well-established measures of students’ smartphone use. However, Boase and Ling (2013) pointed out that the correlation between self-reported smartphone use and actual logged smartphone use is rather limited. Although there have been a few studies exploiting logging data on smartphone use (see, for example, Kim et al., 2019), this has always been in a cross-sectional set-up. Therefore, we encourage further studies exploiting longitudinal tracked data with respect to the impact of smartphone use on academic performance.
A second limitation concerns a limited number of observations per student in our dataset. Although our unique data collection covered three consecutive academic years, only a limited number of students are captured multiple times. Furthermore, we only have information on three different moments in time, which is rather limited. As a result, we have reduced statistical power to identify significant effects using a fixed-effects estimator, compared with the benchmark random-effects estimation results. Therefore, future research should aim to collect longitudinal data with sufficient within-individual variability over time to reproduce our main findings by means of a fixed-effects estimator.
Finally, although we identified – under certain assumptions – the negative causal relationship between smartphone use and academic performance, our empirical findings do not provide evidence with respect to the mechanisms underlying this negative relationship. Further research should investigate which mechanisms are responsible for this relationship because this is crucial to successfully implement policy measures. More concretely, for instance, the importance of the time trade-off between smartphone use and studying might be investigated by including cyberslacking in the analysis. Next, students’ tendency to multitask due to fear-of-missing-out (‘FOMO’) could be measured and included in the empirical framework as a moderator in the relationship between smartphone use and academic performance. As such, future research could explore the potential mediating role of sleep quality, depression or attention-deficit disorders.
When it comes to policy responses, as discussed in the introduction, European governments have discussed and even implemented general smartphone bans in secondary schools (Willsher, 2017). By implementing a smartphone ban, governments aim to reduce the negative consequences of smartphone use on adolescents’ educational performance. Although the current study provides evidence on the negative causal relationship between smartphone use and academic performance, it is not clear whether such general bans are the most desirable response at the university level. Related to the aforementioned limitation, future research should empirically reveal the mechanisms underlying this negative impact. As such, accurate and targeted policy measures could be implemented to reduce the negative consequences on academic performance while retaining its (potential) benefits.
Footnotes
Appendix 1
Acknowledgements
The authors thank Thomas Daman, Pieter Soffers, Matteo Claeskens, Arno Maeckelberghe and Vjačeslav Bondarčuk for their excellent research assistance.
Funding
The author(s) received no financial support for the research, authorship and/or publication of this article.
