
Abstract
Citizens often attempt to interact with government through online modes of communication such as email and social media. Using an audit study, we examine when and how American municipalities with populations of over 50,000 respond to online requests for information. We develop baselines for municipal responsiveness, including the average rate, time, and quality of responses, and examine whether these response attributes vary based on the mode of communication or the tone of the request. Overall, municipalities responded to 54% of email requests and 38% of Twitter requests. A majority of responses were received on the same business day. Responses are slightly faster on Twitter, but of higher quality on email. Governments are more likely to respond to frustrated constituents on email, but respond faster to frustrated queries on Twitter, though with lower quality responses. These findings contribute to our understanding of local government responsiveness and have significant implications for democratic accountability and resident compliance with and the effectiveness of local government policies. Furthermore, our scholarly understanding of local government communications with residents, and particularly the promise of social media as a tool of two-way communication, may be underdeveloped.
Introduction
Within the American political system, municipal governments play a large role in the day-to-day lives of Americans. In terms of activities that citizens engage in on a regular basis—remodeling homes, paying parking tickets, utilizing public spaces, disposing of waste, watering the lawn—local governments are more regularly involved with citizens than are state or federal governments. Accordingly, citizens may occasionally reach out to local government officials to gather more information about a municipal service or to ask a question about how to comply with municipal policies. For example, citizens may ask for help understanding permitting requirements when renovating structures, waste collection schedules, or how to access parks and recreation programs.
Ensuring that citizens have access to services to which they are entitled and that they comply with local policies partly depends on local government officials quickly and accurately responding to citizen requests for information. This is important for at least two reasons: (1) responsiveness is a key part of accountability (Philp, 2009; Romzek and Dubnick, 1987) and (2) citizen cooperation with local codes can have important consequences for public health and safety. For example, the more structures that are properly built to code, the better a town and its residents fare during major natural disasters like hurricanes or earthquakes (Czajkowski and Simmons, 2014; Simmons et al., 2015). However, local building codes, like many other local policies, are complex and vary from one municipality to another. Citizens may only comply to the extent that they are able to understand the local code and what it requires. Yet, scholars know little about how local governments respond to different types of citizen requests for information and what factors impact local government response rate, quality, and speed.
The important task of studying local government responses to citizen inquiries is complicated by at least two factors: (1) how they are contacted and (2) the tone of the inquiry. We consider the numerous channels of communication through which citizens may contact local government officials. Given that most municipalities have physical locations (e.g. city hall), phone lines, email accounts, and several social media accounts (Connolly et al., 2018), there are numerous ways that a resident may seek to contact their local government for information.
Relatively new digital technologies allow a psychological distance that creates opportunity for ruder interactions, whether it be flame wars on a message board, Twitter trolls, cyber-bullying, or an impatient email to a local government (Dery, 1994; Wakefield, 2015). We therefore test whether the tone with which people communicate with their local governments impacts the quality and speed of the response they receive. On one hand, it is possible that local government officials would respond more quickly to friendly messages because they feel more inclined to want to help polite residents. 1 On the other hand, local government officials may respond more quickly to angry messages because they feel a need to address the concerns of a frustrated constituent to placate them. Despite existing research on the impact of tone on communications on various messaging platforms (e.g. Anderson et al., 2014), scholars have not examined the impact of tone on communications with residents seeking information from local governments. Are local officials systematically responding more slowly or less frequently to resident inquiries based on the tone of the inquiry? Does the “squeaky wheel” get the grease?
To be clear, local government responsiveness in the era of email and social media is more complicated than it was when in-person and phone interactions were the only options for residents to interact with their local government, yet it is no less important. Digital tools offer more varied options for residents to submit inquiries to their local governments, and offer more physical and psychological distance which can affect how those inquiries are sent. To understand the impact of these changes, this study aims to evaluate how these factors affect government responsiveness. Understanding the impact of when and how local governments respond to citizen inquiries as a function of how they are contacted helps us to better assess the citizenry’s ability to gather information from the public officials—a vital requirement for ensuring both accountability and responsiveness of public officials, and policy compliance by the public.
To pursue these goals, we conduct an audit study of American local governments to evaluate their responses to online citizen requests for information about local services and policies. Specifically, we seek to understand when and how American local government officials respond to citizen inquiries about everyday services and policies, and we seek to understand whether the tone or mode of communication impacts government responses. We test these questions on three outcomes: the response rate, the response time, and the response quality. Put more formally, we explore the following three research questions:
RQ1. Overall, to what degree do local governments respond to online citizen requests for information in terms of (a) response rate, (b) quality, and (c) speed?
RQ2. How does form of contact (Twitter versus email) impact response in terms of (a) response rate, (b) quality, and (c) speed?
RQ3. How does the tone of the question (friendly, neutral, frustrated) impact local government response in terms of (a) response rate, (b) quality, and (c) speed?
Government responses to citizen inquiries
Although extensive research documents the “responsiveness” of government agencies at a variety of levels and in a variety of countries, “responsiveness” is often defined as the extent to which governments enact policies that reflect the concerns and wishes of a majority of their constituents (Besley and Burgess, 2002; Binzer, Hobolt, and Klemmensen, 2008; Rourke, 1992; Speer, 2012). In the case of American local government, multiple studies focus on the degree to which local government policymaking is in line with the preferences of the city’s residents (Tausanovitch and Warshaw, 2013; Yilmaz, Beris, and Serrano Berthet, 2010).
Although there is some literature on the degree to which local policymakers respond to citizen preferences for particular policies or expenditure levels, 2 local governments also provide numerous services to residents, and few studies examine how responsive local governments are to the citizen as a client of a service provider, rather than as a voter with policy preferences. We seek to understand the relationship between the local government official as an administrator and the citizen as a client seeking information or access to services, rather than policy change. In the context of American municipal government, many citizens have come to view their municipality through the “vending machine” model of local government whereby residents pay property taxes and other fees to their local government and expect to receive a variety of services in return (Morse, 2017).
When governments provide public services, it is important to understand not only the service provision itself but also government responsiveness to citizen requests for information about those services as an important aspect of democratic accountability, distinct from policy responsiveness. A core tenet of democratic accountability is that public officials should act in the interest of and be responsive to those they represent (Pitkin, 1967). Examining whether local public officials are meeting this goal requires looking not only at the policies they put in place, but also at how public officials respond to constituents seeking information about how to comply with a policy or how to access government services. It may be difficult to judge whether local public officials are acting in the interest of their constituents when they enact a certain policy or expand a particular program, for it may benefit one group of constituents at the expense of another (Philp, 2009). However, when viewing local public officials as service providers, the explicit expectation is that to act in the best interest of your constituents is to respond to their requests for information about public programs, regulations, and services. In this regard, it is relatively easy to measure whether a local public official is acting in the interest of the public—a local public official ignoring a request for information is never in the citizen’s best interest. Although the crafting of policy is often the focus of studies of responsiveness, we argue that local government responsiveness and accountability can and should be measured in many ways including policy implementation and interactions with residents. After all, a policy or program is unlikely to achieve its intended goals if the public cannot effectively gather information about it.
The work of government, including the quantity and content of public policies, is increasingly complex. It is only natural that the average citizen may seek advice on the meaning of a policy or the specific actions one needs to take to comply with a policy. For example, residents regularly hire professional tax preparers like TurboTax and H&R Block to ensure compliance with complex IRS codes. However, with over 19,000 local governments in the United States, there is no online software to help a resident navigate compliance with local ordinances ranging from complicated building codes to detailed public safety ordinances. Where does a citizen who needs information about these local ordinances go when seeking clarification or additional information? One option is to go directly to the source, by contacting the local government and seeking information, and citizens may do so using a variety of communication modes, such as email and social media.
A citizenry that seeks but does not receive information about local ordinances from their public officials suffers from a lack of accountability—indeed, responsiveness is one of the four types of relationships identified in a framework of accountability (Romzek and Dubnick, 1987: 230). Furthermore, if citizens seek information about local services or policies but do not receive timely and useful responses, it is difficult for those citizens to fully access services to which they are entitled or comply with local rules, even if they so desire.
The complexity of responsiveness is well documented in the public administration context (Dubnick, 2005; Saltzstein, 1992; Bryer, 2009; Yang and Pandey, 2007). There are two primary models used to explore responsiveness: the expertise-driven model and the citizen-driven model (Liao, 2018). The expertise driven model unsurprisingly centers the expertise of public administrators who act with more knowledge of governance and policy, using public demand as merely one aspect directing action (Liao, 2018). The expertise-driven perspective maintains that professional expertise holds the key to achieving public responsiveness, even though responses may be independent of, or even contrary to, original citizen preferences (Liao, 2018; Schumaker and Loomis, 1979).
The citizen-driven perspective of public responsiveness, on the contrary, argues that public administrators should fulfill their democratic responsibilities by carrying out citizen demands (Liao, 2018). Scholars have long explored the roles of correspondence between the decisions of administrators and the preferences of citizens or officeholders (Fried, 1976; Rourke, 1969). Others have described responsiveness as a relationship between citizens and government, in which the citizen articulates certain preferences and/or applies pressure on the government and the government in turn—if it is responsive—attempts to satisfy these preferences (Verba and Nie, 1987). Some have even gone so far as to suggest that the citizen-driven model highlights that administrators’ role is subordinate to citizens’ and their elected officials (Wheeland, 2000). In practice there is no direct line drawn between citizen demand and public administrators’ actions, often for pragmatic, political, or economic reasons (Williamson and Fung, 2004; Yang and Pandey, 2007). This article builds on this citizen-centered literature, but explores local governments as service providers to citizens, not merely organizations to create and apply policies.
Public administration scholars often consider two facets of responsiveness: “the speed and accuracy with which a service provider responds to a request for action or information” (Vigoda, 2002: 529). While speed, or the time elapsed between a citizen request and the government response, is relatively straightforward, accuracy is more difficult to define and measure. According to Vigoda (2002), “accuracy means the extent to which the provider’s response meets the needs or wishes of the service user” (p. 529). West (2004) considers responsiveness as speed, specifically the number of business days required for an agency to respond to a citizen email; however, local governments were not included in this analysis. While citizens value timeliness, they also value a direct and personal response to an issue (Costa, 2020). However, while some recent studies examine government responsiveness to digital communication from citizens (Gauld et al., 2016; Gauld et al., 2009; Su and Meng, 2016), none of the studies we are aware of examine this question in the context of American municipal government. This study aims to measure the responsiveness of local governments across the United States to citizen demands for information, while maintaining the centrality of the citizen in our analysis of responsiveness.
Social media and email
As e-government has matured, many have deliberated on the potential for increased government responsiveness as a result of new web-based communication tools (Musso et al., 2000, Layne and Lee, 2001; Moon, 2002; Reddick, 2004a, 2004b; Seifert and Chung, 2009; Tolbert and Mossberger, 2006; Welch and Fulla, 2005; Welch et al., 2004; West, 2004; Yildiz, 2007). Just as phone calls once opened new avenues for interactions between citizens and their government, the Internet, email, and social media have further reduced communication barriers between citizens and public officials, at least for those willing to engage (Panagiotopoulos et al., 2013; Unsworth and Townes, 2012). Yet municipalities have not universally adopted e-government services, nor used them in consistent ways. Although local governments have, over time, employed more interactive e-government tools, this has been far more gradual and incremental than once predicted, with unidirectional information dissemination still the most common e-government tool used by American municipalities (Connolly et al., 2018).
Social media has been widely embraced as a communication tool, specifically a means for organizations to build relationships with patrons. As of February 2019, 69% of all American adults were on Facebook and 22% used Twitter (Pew Research Center, 2019). While Facebook is more widely adopted, Twitter, is particularly nimble and easily accessed. In fact, as of 2019, 96% of Fortune 500 companies had a presence on Twitter, a 1% higher rate than those on Facebook (Barnes et al., 2020). In this project, we find that the percentage of US cities with a presence on Twitter is nearly as high, at 93% of cities with populations of 50,000 or more.
Social media tools like Twitter and Facebook have received growing attention for how they impact political communication and the relationship between the citizens and the political process. In particular, substantial research has focused on how political campaigns have deployed them, and their perceived or measured impact on electoral success (Baldwin-Philippi, 2015; Bode, 2012; Bode and Lassen, 2016; Chadwick and Stromer-Galley, 2016; Epstein, 2018; Kreiss, 2016; Stier et al., 2018; Stromer -Galley, 2014; Williams and Gulati, 2007, 2009). Recent research has explored how companies interact with customers on social media, primarily from a marketing or public relations perspective (Einwiller and Steilen, 2015; Ma et al., 2015), and the degree to which citizen demand impacts politicians’ engagement with members of the public on social media (Tromble, 2018). Research on local government use of e-government tools and social media has primarily focused on the adoption of services by municipal governments, rather than the responsiveness of local governments to citizen requests made via e-government tools or online platforms (Connolly et al., 2018; Evans-Cowley and Conroy, 2006; Gao and Lee, 2017; Moon, 2002; Norris and Reddick, 2013).
Social media platforms are powerful, but they are not currently used at the same rates as email. Email remains one of the most consistently used and effective communication mediums between governments and their citizens (Andersen et al., 2011). 3 In 2011, 92% of online users regularly used email and that number has remained steady since. That email is in no way considered “innovative” is what establishes it as a “mundane communication tool,” even as it continues to play a central role in web-based communication (Nielsen, 2011; Purcell, 2011). Over 94% of the cities in our sample had an identifiable email address or website email form, easily found on the city website.
Communication tone
Scholarship on customer service in private sector organizations has identified that many service roles require extensive emotional labor (Hochschild, 1983), meaning that the customer service agent has to exert effort and control to express positive or friendly emotions during interpersonal interactions with customers (Morris and Felman, 1996). Emotional labor can take a toll on front-line employees who deal directly with customers, leading to negative emotional consequences such as dissatisfaction with the job, lack of empathy, role overload, and feelings of burnout and rejecting customers (Hoschschild, 1983; Wharton and Erickson 1993; Rafaeli, 1989).
While most of the empirical work on this topic comes from the literature on private sector organizations, local government officials must also regularly manage their emotions during interactions with citizens. And in general, negatively toned communication tends to beget more negative communication (e.g. Anderson et al., 2014). Considering both of these findings together, it is therefore possible that when a local government official receives a request or question from a citizen that is angry in tone, the local government official may react more negatively to that individual due to the strain that such emotional labor places on the employee. On the contrary, organizations that provide a service directly to customers (or in our case, citizens) are typically concerned with customer satisfaction; they seek to provide the customer with a level of service during the interaction that leads to an overall positive evaluation of service quality (Liljander and Strandvik, 1997). As such, it is also possible that when a front-line worker receives an angry email or question, that he or she will seek to respond even more quickly than usual and with useful information so as to placate that customer and ensure a positive evaluation of service quality.
When we describe an angry or negative tone, we are referring to what many studies have labeled incivility. Incivility includes rude, condescending, and/or ostracizing acts that violate norms of respect but otherwise might appear mundane (Chen, 2017; Cortina et al., 2017). Two important lines of research relate directly to the current study: online incivility and incivility in the workplace. Online incivility, or cyber incivility, is a rude, condescending, or harassing action transmitted through computer mediated means. This is widespread (Anderson et al., 2014) and can be found everywhere from email (Giumetti et al., 2013) to social media (Antoci et al., 2016) to comment sections (Coe et al., 2014) and every digital option in between. Many scholars have also explored the causes and effects of incivility in the workplace and particularly between customers or clients and employees (Cortina et al., 2001; Wilson and Holmvall, 2013). Even mild forms of rudeness and incivility can have an effect on workers’ effectiveness, responsiveness, and mental and emotional well-being (Giumetti et al., 2013; Kabat-Farr et al. 2018). In fact, the relatively low intensity of the incivility is one of the fundamental components of workplace incivility (Pearson et al., 2005; Schilpzand et al., 2016).
Taken together, this prior research suggests that local governments do have some incentive to respond to citizen requests for information and further, that the tone of those requests may affect how they respond. If a citizen asks for clarification on a policy or service and receives no response, this makes it more difficult for the citizen to comply with a policy or fully utilize a service to which he or she is entitled. However, the people tasked with fielding and responding to citizen requests for information are individuals that may be balancing multiple modes of communication, including more than one social media channel, and who likely experience the full range of emotions that come with working in a customer-facing service-oriented role. The relationship between mode of communication, tone of communication, and the responses of local government officials has not been examined in the local government context. We examine the rate, speed, and quality of local government responses to citizen requests for information, to better understand how often local governments respond to online citizen requests, and to determine whether tone and/or mode of communication influence local government responses to online citizen inquiries.
Experimental design
In order to determine the extent to which the mode and tone of citizen inquiries affect local government responsiveness, we use an audit study experimental design, varying what platform is used for communication, and the general tone of the inquiry. Audit studies are a type of field experiment which randomizes one or more characteristics about either real or hypothetical individuals and sends these individuals out into the field to test the effect of those characteristics on an outcome (Gaddis, 2018). In our study, we use a random assignment strategy, meaning that each city included in our sample is randomly assigned to a treatment. This experimental design with random treatment assignment allows for us to test the impact of our key treatments (tone and communication) on responsiveness because each city is randomly assigned to a treatment and we have no reason to believe that the cities in one treatment group are significantly different than cities in another treatment group. There have been a growing number of experiments that use such a random assignment design to measure the responsiveness of public officials to their constituents, since Butler and Broockman’s (2011) influential audit study of constituent communication. In our case we used a correspondence audit study, instead of in-person, which has become increasingly common and is particularly well-suited for studies of social media (Costa, 2017).
First, we vary the platform we use to send our inquiries to local government officials—either email or Twitter. We consider these two platforms because they are commonly used by local governments (93% use Twitter and 94% use email), and because they are both publicly accessible—that is, citizens can easily contact local governments through either platform without any additional information, or needing to sign up, subscribe, or follow them. It is worth noting that there are several meaningful differences between the two. Twitter has a length constraint (280 characters), which may limit the type of response local governments are able to offer. Email obviously does not have this length limitation. In addition, as noted above, people are much more likely to use email (92%, Purcell, 2011) compared to Twitter (22%, Pew Research Center, 2019). Email allows for auto-reply, whereas Twitter does not. 4
Second, because we were interested in whether the tone of an interaction may impact response time and quality, we vary the tone of the inquiry—either neutral, friendly, or frustrated. Friendly requests included greetings and exclamation points (to signal a pleasant demeanor), whereas frustrated queries began with a complaint about the local government’s information availability (to signal irritation) before posing the question (see Appendix 1 for complete wording of inquiries). Our variation in tone is designed to fit the low-intensity characteristic that often is associated with customer incivility (Cortina et al., 2017; Pearson et al., 2005; Schilpzand et al., 2016; Wilson and Holmvall, 2013).
To increase the validity of our experimental design and replicate our results, ensuring that any results are not limited to the question posed, we developed two different questions to use as the basis of our inquiries. The first question asks whether a resident is required to install a fan in a bathroom as part of a renovation if the bathroom has a window. The second question asks whether space can be reserved at public parks for a birthday party and if inflatable bounce houses are allowed. We selected these two questions because they are non-partisan, non-controversial, straightforward, and could apply to any municipality around the nation. However, both questions are sufficiently detailed enough to allow for variation in quality of response. The two questions also relate to frequently accessed aspects of local government—building codes and parks and recreation. For full question text and all versions of the question wording, see Appendix 1.
Our study population consists of all United States municipalities with a population of 50,000 or more, per 2010 US Census population estimates. Cities of this size are more likely to have the financial, technical, and human resources to offer extensive digital services and communication, and they also represent the places where many Americans live. As of 2013, 60.6% of Americans who live in an incorporated municipality live in one with 50,000 or more people (Cohen et al., 2015). Given time and resource constraints with regard to data collection for a project of this nature, we chose to limit the scope of our research to municipalities of 50,000 or more people as this accounts for the majority Americans living in an incorporated municipality.
All said, there are 758 American cities with a population of over 50,000, per 2010 census estimates. We contacted every city in this population with an identifiable email address (94%, n = 712) or Twitter account (93%, n = 704). 5 We sent each email and tweet during normal business hours for each city’s time zone on a weekday from 15 August to 8 December 2017 (for full details on how we identified municipal email and Twitter accounts, see Appendix 2). Conditions were randomized for all cities (for full question wordings for each manipulation, see Appendix 1), but we ensured that no city received the same inquiry via both platforms. We recorded the time and date when the message was sent, as well as the time and date of the response (if there was one).
We sent all questions using one of 27 email accounts (26 Gmail accounts and 1 Yahoo account) or one of 23 Twitter accounts created exclusively for this study. 6 All Twitter accounts were made to appear authentic; they included pictures, a short and vague bio, and a few other tweets sent out before those directed toward local governments. Although the use of bots and automated Twitter accounts is becoming more salient, there was no indication from any contacted city that there were doubts or concerns about the authenticity of the Twitter accounts.
We assigned all email and Twitter accounts 1 of 27 male names to avoid introducing any gender bias. We developed male names using the 40 most popular surnames in the United States in 1990 and the most popular male first names for births from 1916 to 2015 (per the U.S. Social Security Administration). We excluded 6 of the 40 most common surnames because they are putative Hispanic surnames (Gonzalez, Lopez, Hernandez, Rodriguez, Martinez, and Garcia), in order to prevent any racial or ethnic bias, as research has shown depressed responsiveness to Hispanic last names (White et al., 2015).
We sent one email and one tweet to each municipality in our study. In the body of each email and tweet, we included the text of the question (parks or bathroom) that we had randomly assigned to that city (with either the friendly, neutral, or frustrated tone). We sent each email without a subject, such that the receiving government official would simply see “No Subject” in the subject line when they received the email inquiry, and we signed each email with only the first and last name of the sender (Frank Johnson, John Nelson, etc.) but with no closing statement (thank you, sincerely, best, etc.). This was intentional so as to keep the message content sent via Twitter and email as similar as possible, and to ensure any differences we observed between email and Twitter were due to the platform and not to message differences. Similar guidelines were used for filling out online email contact forms. 7 Once we sent each email or tweet, we tracked whether the city responded to the email with a simple yes/no (1 = yes, 0 = no) measure, and tabulated the number of business days it took to respond. We recorded responses for a minimum of 60 days to avoid missing any late responses.
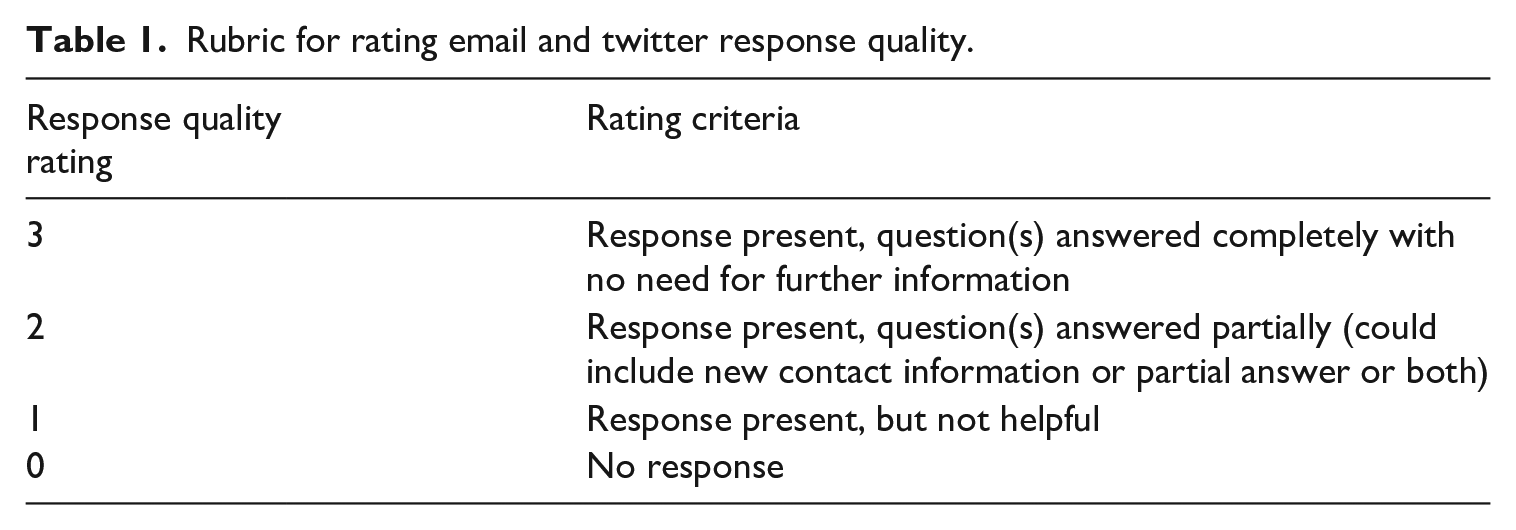
Finally, for all responses received, two coders rated the quality of each response received on a scale of 1–3, where 3 is the highest quality response, and 1 is the lowest quality response, with 0 recorded for cities that never responded (see Table 1 for the response quality coding scheme). The response quality measure takes into account whether the city’s response included enough information to completely satisfy the request (coded a 3), an incomplete response, either partially answering the question, directing the citizen to another person or department, or both (coded a 2), an unhelpful response (coded a 1), or no response at all (coded a 0). Overall, the two coders had good intercoder reliability (email Cohen’s kappa = .82, Twitter Cohen’s kappa = .84), and any inconsistencies in ratings were then settled by a third coder.
Rubric for rating email and twitter response quality.
Analysis and results
Response by mode
Our research questions aimed to test the impact of question mode and tone on the response rate, speed, and quality of responses. We follow the method Butler and Broockman (2011) use in their audit study of congressional response to citizen emails, calculating effect sizes by analyzing treatment differentials. The overall response rate to our inquiries varied based on medium used, with 53.8% of email inquiries garnering a response, compared to 37.8% of Twitter inquiries, a difference that is significant at the p < .05 level (t = 6.12). If only about half of all email inquiries and fewer than 4 in 10 Twitter inquiries sent to municipal governments are receiving a response, this suggests that many residents may be experiencing difficulty in receiving information from their municipal government via online tools.
Speed of response by mode
How does the form of contact affect the speed of the responses that were received? Table 2 presents the results by communication mode (email vs Twitter). Although the response rates were lower than anticipated, those cities that did reply usually did so promptly. Among responses, 54.7% of email responses and 72.9% of Twitter responses were sent on the same business day as the original inquiry, a statistically significant difference (p < .05, t = 4.61). In other words, while inquiries via Twitter received lower response rates overall, those that did respond generally responded faster, often within just a few hours. Overall, email responses were received in an average of 1.07 business days compared to Twitter responses received in an average of 0.53 business days, a difference that is statistically significant at the p < .05 level (t = 2.34). 8
Response time and quality by mode: do emails receive faster or higher quality responses than tweets?
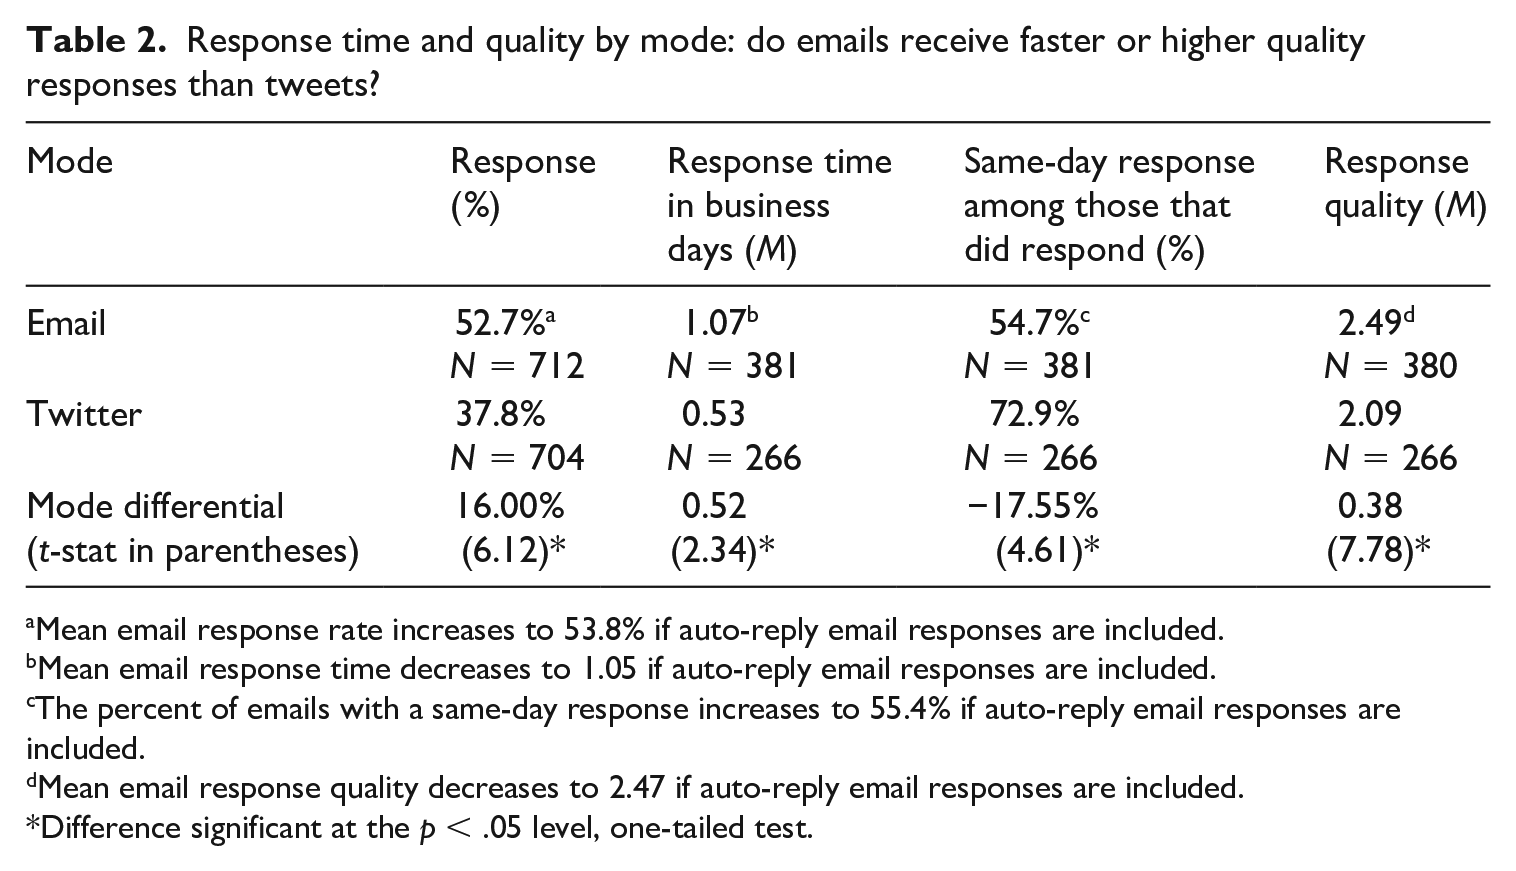
Mean email response rate increases to 53.8% if auto-reply email responses are included.
Mean email response time decreases to 1.05 if auto-reply email responses are included.
The percent of emails with a same-day response increases to 55.4% if auto-reply email responses are included.
Mean email response quality decreases to 2.47 if auto-reply email responses are included.
Difference significant at the p < .05 level, one-tailed test.
Quality of response by mode
The form of contact also affects the quality of response. Specifically, the responses received by email were of a higher quality on average than Twitter responses. In terms of quality, emails received in response to an email inquiry had a mean quality rating of 2.49 (on a scale of 1–3, with 3 being a complete answer), while tweets received in response to a Twitter inquiry had a mean quality rating of 2.09, a significant difference (p < .05 level, t = 7.78).
Response by tone
We also consider whether the tone of a message impacts local government responsiveness and the speed and quality of responses. Table 3 presents the results by question tone (neutral, friendly, or frustrated). In the case of email inquiries, we find that frustrated emails were significantly more likely to receive a response (58.1%) than friendly emails (49.6%) (t = 1.85, p < .05). There is no significant difference in the response rates to neutral emails and friendly emails or between the response rates to neutral emails and frustrated emails. In the case of tweets, we find that there is no significant difference between response rates for tweets by tone.
Response time and quality by tone: do frustrated inquiries receive faster or higher quality responses?

Difference significant at the p < .05 level, one-tailed test.
Speed of response by tone
We find that there is a significant difference in response time by tone on Twitter, though not on email (see Figure 1). On Twitter, local government officials responded to frustrated tweets, on average, in 0.31 business days, while they responded to neutral tweets, on average, in 0.56 business days, and they responded to polite tweets, on average, in 0.70 business days. The difference in mean Twitter response times between neutral and frustrated tweets and between friendly and frustrated tweets is significant in both cases at the p < .05 level (t = 1.80 and t = 2.00, respectively). While there appears to be a big difference in response time for email, with friendly emails again receiving the slowest response, none of these differences were statistically significant (see Figure 2). These results suggest that when the interaction is more public, as is the case on Twitter, local government officials respond faster to frustration. However, when the interaction is private, as is the case with email, local government official response speed is not related to the tone of the original inquiry. Perhaps the old adage that the “squeaky wheel gets the grease” is more accurate when others may be watching (on Twitter) than when communications are private (on email). However, given that we only have one mode of public communication and one mode of private communication, we cannot draw any broader conclusions of how publicness affects local government responses.

Response time by tone on Twitter.
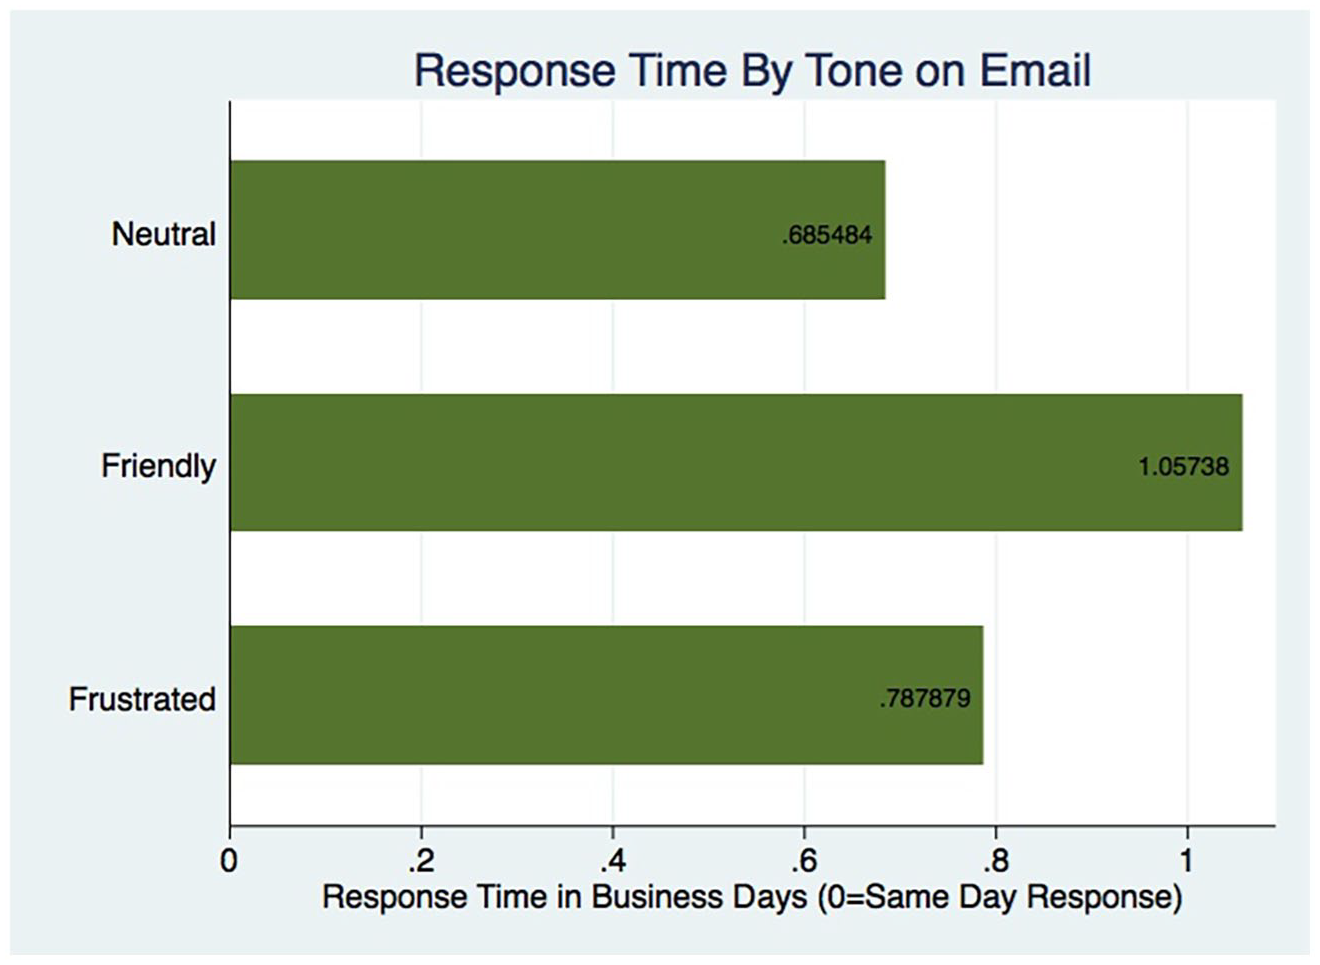
Response time by tone on Email.
Quality of response by tone
As for the quality of responses to inquiries with different tones, we find that there is no significant relationship between the tone of the original inquiry and the response quality ranking for emails. The email response quality ratings were 2.46 for neutral, 2.48 for friendly, and 2.47 for frustrated inquiries. The Twitter response quality ratings were 2.15 for neutral, 2.21 for friendly, and 1.92 for frustrated inquiries. The difference in mean Twitter response quality between neutral and frustrated tweets and between friendly and frustrated tweets is significant in both cases at the p < .05 level (t = 2.84 and t = 3.83, respectively). These results suggest that while Twitter responses were the fastest for frustrated tweets, those same tweets also received the lowest quality responses. While the squeaky wheel may “get the grease” on twitter, it may be lower quality grease.
Discussion and conclusions
Our findings have important implications for understanding democratic responsiveness at the municipal level in the United States—citizen requests for information are one important aspect of democratic accountability (Romzek and Dubnick, 1987). Local public officials should act in the interest of their constituents, and failing to respond to a citizen inquiry for information about a policy or program is a failure of democratic representation. For this reason, our study focused on developing a baseline understanding of local government responsiveness to citizen requests, further examining how tone and mode of communication impact that responsiveness.
Our results show that there is not a simple answer to the question of whether American municipalities are broadly responsive to citizen requests sent via email and Twitter. While, on one hand, fewer than half of our inquiries received a response at all, suggesting low levels of responsiveness, the cities that did respond provided relatively fast and high-quality responses. Despite the widespread use of Twitter and email by cities with 50,000 or more residents, there is certainly room for improvement in terms of the overall responsiveness of these municipal governments to inquiries from their citizens seeking out information. It is problematic for democratic governance that more than half of our email and Twitter inquiries received no response at all. It might be said that the stakes were low in our case—the questions posed are not life threatening or world changing, and questions that are more serious or urgent might well receive different answers than those we observed. However, in a real-world scenario, citizens need an effective and efficient way to seek and receive basic information from their local governments in order to access services to which they are entitled, or to comply with municipal policies to which they are subject. Although permitting requirements and parks and recreation services may not be controversial or hotly debated, they are also not trivial to the residents who use them. Democratic accountability relies on public officials being responsive to citizens regardless of the topic or issue the citizen raises.
In terms of tone, angry emails were more likely to receive a response than neutral or friendly emails, and angry tweets received faster responses than neutral or friendly tweets, suggesting that angry citizens may have a slight edge over their friendlier counterparts in getting a response. However, local government officials do not appear to be systematically providing better responses to angry citizens. These findings suggest that the tone a citizen takes in interacting with their municipal government officials could have some impact on whether they receive a response and how quickly they receive a response, though less of an impact on how helpful that response is. Despite these findings, we certainly would not encourage citizens to purposefully take on an angry tone in their communications with local government officials.
The publicness of this finding is also interesting to consider. In our questions, we put the handle of the city (e.g. @city) at the beginning of the tweet. This makes the tweet visible only to those people who follow both accounts, which means that our inquiries were only semi-public. However, the perception of publicness may matter more than how many people are actually able to view it (Marwick and Boyd, 2011). Future research might experiment with comparing this placement to tagging a city in the middle of a tweet, or incorporating a hashtag, which would generate greater visibility of the tweet. If publicness is the causal mechanism for generating a faster reply in general, and faster replies to more frustrated questioners specifically, the placement of the city’s handle might also matter.
Alternatively, the mechanism may not be about public versus private communication at all. Rather, it is worth noting that the audiences—or the perceived audiences (Marwick and Boyd, 2011)—are different for Twitter and for email. Twitter users are only about 22% of the American population, and tend to be younger and more educated than the general population (Pew Research Center, 2019). On the contrary, at least 92% of Americans use email (Purcell, 2011), representing a much broader swath of the population. The small user base of Twitter may also mean that, in general, local governments receive fewer tweets than they receive emails, allowing them to respond faster as a result.
In addition, since email has been around longer than social media, it is possible that local governments have better developed systems for monitoring email and may even have internal policies in place regarding responding to emails, which they have not yet developed for social media communications. It is also possible that the type of local government employee responsible for monitoring email is systematically different from the one responsible for monitoring social media. If a longtime municipal employee handles the email account while a student intern handles the social media accounts, this could impact the degree to which the responses are helpful, as the longtime employee likely has acquired more knowledge about the municipality and its policies. There may also be embedded organizational norms that treat email as a more formal mode of communication requiring a response. For example, it is possible that people working in large organizations feel some degree of professional responsibility to responding to emails from clients, though less pressure to actively post or respond on social media, which has not traditionally been a formal mode of communication for business purposes.
In terms of practical implications, our results suggest that petitioners might choose a medium depending on their goals—Twitter if speed is prized, and email if quality is prioritized. On the whole, though, email appears to be the better communication medium. While email responses were slightly slower than Twitter responses, the average email inquiry still received a response within 1 business day, and 55.4% of email inquiries received a response on the same day. The email responses were of a higher quality and the response quality and speed were not dependent upon the tone of the original inquiry. While local governments were marginally faster to reply to Twitter inquiries, it appears that there is still room for improvement as Twitter replies were of a lower quality on the whole and were dependent upon the tone of the original inquiry. From the perspective of the local government administrator, it may be that local governments are using Twitter primarily as a mechanism to push out information to citizens (Connolly et al., 2018), but that they have not (yet) built up the capacity to use Twitter as an effective means of two-way communication with citizens. Local governments seeking to better serve their residents should consider this when deciding when and how to make use of social media platforms.
The results of this study also have implications for public policy at the local level. Public policies are inherently complex, and there are more than 19,000 municipal governments in the United States, each with their own set of policies. With 10% of US households moving in any given year (United States Census Bureau, 2019), people often move from one city to the next, meaning that the municipal policies to which they are subject may change periodically. It may be difficult for average citizens to stay abreast of all policies within their municipality, and, as such, we expect that from time to time, citizens might reach out to their local governments to seek clarification on exactly the types of issues we included in our experiment—what are the requirements for renovating a bathroom? What can a person bring to a public park when hosting a birthday party? Democratic accountability at the local level relies on public officials responding to their constituents’ concerns or questions. Further, citizens are better able to comply with local policies when they understand them, and when they have the ability to get timely and helpful clarification from their local officials. The results of our study suggest that, to the extent local governments should be accountable to their constituents, and to the extent local governments want citizens to comply with all municipal policies, they have room for improvement when responding to citizen requests for clarification or additional information.
Our findings are an important contribution to the literature on government responsiveness at the local level and may be useful for local governments and citizens alike. Specifically, we build on the strong theoretical foundation regarding the citizen-driven perspective of public responsiveness. Although prior research has examined local government responsiveness to citizen policy preferences, we build on this literature by examining how quickly and accurately local government officials respond to citizen requests for information. We argue that democratic accountability is not only about public officials crafting policy that responds to citizen preferences, but also implementing those policies in a way that includes relatively timely and helpful responses to citizen inquiries about how to comply with or access services provided for in those polices. This study will allow researchers and city officials to measure themselves against an established baseline and to identify when their responsiveness to citizen inquiries is below average. Determining whether local government email and Twitter responsiveness is dependent on the tone of the citizen inquiry allows scholars to better understand whether local public administrators are responding to all citizen requests equally or are allowing social factors to impact the way they provide services to citizens.
This study offers valuable new insights into how cities across the United States respond to different inquiries offered through different platforms in various ways. However, it is not without limitations, many of which should be addressed in future related research.
First, although an experiment was the best way for us to isolate the effects of tone and communication medium, there are other aspects of citizen–government communication we did not study. It is likely, for instance, that some municipal characteristics such as size, form of government, resources, or region, could impact local government responsiveness. Prior research, for example, shows that council-manager cities and those with more resources are more likely to adopt e-government services (Connolly et al., 2018). We might also expect that local governments for smaller cities—who likely have fewer resources but also experience less citizen demand—may respond differently than the relatively large (50,000 residents or more) cities we included in our investigation.
Second, we only examined two modes of communication—email and Twitter. There are many other channels through which citizens may seek to interact with their local government officials, including other social media channels, phone, and in person. In fact, several of the replies we received included a name and a phone number to call for more information. It is possible that local government responses to phone calls or in-person visits would be systematically different than responses to email or Twitter. Although Facebook is also regularly used by local governments, it is more difficult (and against Facebook’s real name policy, Facebook, 2020) for researchers conducting an audit study to create realistic Facebook profiles to use for such a study as compared to creating realistic Twitter profiles. Given our limited resources as researchers, we limited our study to two commonly used modes of communication—email and Twitter—but given additional resources, a similar study of Facebook, phone, or in-person responsiveness would be informative and useful.
Third, the range of tone in the emails and tweets sent in this study was relatively small. We were motivated to keep responses as realistic as possible, and a consistent length across conditions. However, we believe that the difference in response time and quality observed in this study based on question tone are actually more notable precisely because the frustrated tone was mild compared to some of the vitriol commonly sent through email and especially social media (Chen, 2017). Increasing the level of frustration or friendliness presented in email and Twitter interactions in future studies may be more representative of true email and Twitter requests, and we might expect that angrier messages may receive even faster responses.
Fourth, the perceived authenticity of Twitter accounts must be taken into account. We made every attempt to make our Twitter accounts appear authentic. However, each was created relatively shortly before they reached out to local governments and had limited other communication. While there was no indication that this publicly available information affected responsiveness, it is something to be aware of and should be a consideration for future studies that create and use Twitter accounts.
Fifth, we collected the data for this study in 2017, and some notable social media changes have occurred since then. For example, shortly after our data collection Twitter expanded their allowed character count from 140 to 280 characters (Tsukayama, 2017). This might affect the quality of responses offered on Twitter, in particular, since accounts now have more space with which to respond. While many of the conclusions from this study will likely hold with changes in social media platforms and their use, some may not. We specifically encourage researchers to continue examining such research questions over time so that the literature will reflect findings from a variety of points in time, with different social media affordances.
Finally, the presumed characteristics of the citizen seeking information may impact response rates, speed, and quality. Past studies have indicated that customer service varies based on the perceived race and gender of the customer, and many scholars have found that people of color receive slower and lower quality service, especially when the support requested is lengthier, more difficult, or perceived to be riskier (Saucier et al., 2005; Ainscough and Motley, 2000; Bennett et al., 2015; Butler, 2014). We intentionally used racially neutral male names in order to avoid any of these effects, but future studies may want to vary the assumed gender and race or ethnicity of the citizens to determine the extent to which the speed and quality of responses are impacted, and especially how they interact with tone. An angry email may produce different responses coming from those perceived to be different races or genders, for example.
Our results suggest several policy implications. Our study shows that local governments have room to make significant improvements in terms of whether they respond to email and Twitter requests at all, and the quality of responses when they do. We encourage local governments to consider the quality of the response they can offer, not just the quantity of communication channels they can provide.
Local government administrators should consider developing methods of tracking citizen requests and measuring how quickly and how often local public officials respond to these requests. Each individual city needs to know how well they are doing in this regard in order to implement and evaluate strategies for improvement. These strategies might involve hiring additional staff to monitor social media, devoting more resources to public outreach, developing new training initiatives for local government staff, or if resources are stretched, restricting the number of communication platforms they use in order to prioritize responsiveness in those they do employ. After all, a communication channel is not useful if it is not actually used for communication.
Local officials should aim to respond to all citizen requests or inquiries in an equitable and timely manner. Local governments do not need to offer every possible method of interaction, but they should aim for the maximum response rate, speed, and quality in those that they do offer.
Footnotes
Appendix 1
Appendix 2
Funding
The author(s) received no financial support for the research, authorship, and/or publication of this article.