
Abstract
The rapid deployment and adoption of Low-Earth Orbital (LEO) satellite systems present new opportunities – and challenges – for rural/remote communities, which have until recently lacked access to high-speed, reliable Internet services. Such impacts are pronounced in small-population Indigenous communities seeking to balance cultural and language resurgence while navigating engagement with settler states and extractivist economies. However, there are limited primary data available regarding the cultural and socioeconomic implications of LEO services in these unique communities, or assessing how end-users experience Internet speed, affordability, and reliability. In this context, we present the outcomes of community-engaged, longitudinal research investigating the adoption of LEO services by Indigenous residents of a remote, fly-in community in Nunatsiaq/Denendeh (commonly known as the Northwest Territories/NWT, Canada). Our findings illustrate emerging tensions regarding perceived positive and negative outcomes: while LEO systems have resolved technical access, respondents simultaneously report growing concerns associated with online harms. These findings contribute to digital divide theory and practice, necessitating increased attention to third-level divides related to patterns and outcomes of use.
Introduction
In recent years, digital divide research has explored how patterns of social inclusion and exclusion emerge alongside increasing levels of Internet access, adoption, skills, and use. Critical scholars are identifying how interventions focused on the design, deployment, and adoption of digital technologies may introduce new forms of discrimination and marginalization, as shaped by factors including class, race/ethnicity, gender, age, (dis)ability, geographic location, and education level (e.g. Robinson et al., 2020). Researchers highlight how dynamic cycles of digital inequality can perpetuate even after people gain access to the Internet. For example, Richard Heeks’ (2022) concept of adverse digital incorporation suggests that digital inclusion can provide a means for more-advantaged groups to extract disproportionate value from the work or resources of less-advantaged groups, thereby threatening new forms of exploitation.
These debates are emerging as newly launched Low-Earth Orbital (LEO) satellite Internet services quickly come online, offering a means for previously unserved and underserved regions and communities to connect (Ahmmed et al., 2022; Graydon and Parks, 2020; Song, 2023). For example, following the COVID-19 pandemic and risks to public safety during emergencies like fires and floods, increasing attention is paid to using these technologies to bridge rural/remote digital divides (Council of Canadian Academies, 2021; CRTC, 2024). However, communities and end-users are also raising concerns about the potentially negative implications of this sudden arrival of unlimited, high-speed Internet access. Reflecting critical histories of corporate telecommunications networks, this positions digital infrastructures as new tools of imperialist expansion and capitalist value extraction (Mejias and Couldry, 2019; Smythe, 1981; Winseck and Pike, 2007). These tensions illustrate how the rapid deployment and adoption of LEO satellite systems offer new opportunities – and challenges – to understandings of digital inclusion often focused on addressing first- and second-level digital divides.
At present, there is limited primary research available regarding the adoption of LEO Internet services in rural/remote, Northern, and Indigenous regions seeking to balance cultural and language resurgence while navigating engagement with settler states and extractivist economies (Betasamosake Simpson, 2017; Borrows and Tully, 2018). Available studies indicate that the impacts of rapid Internet adoption are pronounced in small-population, geographically rural/remote, and Indigenous communities that historically experienced high costs and slow, unreliable services (Correa and Pavez, 2016; Hudson, 2015; Young, 2019). Previous research that we conducted in two remote communities found that LEO (Starlink) users demonstrated a greater propensity to access online public services compared to those who subscribed to the incumbent Internet service provider (McMahon et al., 2025a). Starlink users in these communities also reported more engagement in online business activities, including e-commerce and remote work. However, we also learned that having a higher-quality Internet connection is not always beneficial, as users reported they now experienced increased access to anti-social content and problematic online behaviours such as online bullying and gambling. These findings echo past research on community-level concerns regarding the sudden influx of new communications technologies, from satellite television (Mander, 1992; Valaskakis, 1992) to social media (Kral, 2014; Young, 2019).
These observations led to this current study. Through a longitudinal analysis, we compare baseline surveys conducted in a remote, fly-in Dene community with follow-up surveys conducted in the same community 1 year after LEO Internet services became available. Existing research notes that the evaluation of rapid adoption of Internet services through longitudinal studies in general is lacking, especially in the context of rural/remote and/or Indigenous communities (Pukdeewut and Setthasuravich, 2024). Shaengchart and Bhumpenpein (2025) suggest that longitudinal studies can provide deeper insights into how Internet adoption behaviours evolve over time.
As we discuss in detail below, our findings illustrate several emerging tensions. While LEO systems seem to have resolved many technical and access issues, respondents are also reporting increasing experiences of online harms. Taking a holistic approach to digital inclusion/equity research (Reisdorf and Rhinesmith, 2020), our study incorporates multiple layers of digital divide theory, moving from considerations of access and skills to include usage patterns and outcomes of use (Helsper, 2021; van Deursen and van Dijk, 2013; van Dijk, 2020). We end with observations on how these findings might contribute to digital inclusion theory and practice.
Context: Digital connectivity in Denendeh/Nunatsiaq (the Northwest Territories), Canada
Our study is grounded in the experiences of Indigenous (Dene) residents of a small-population, fly-in community located in the Western Arctic region of Denendeh/Nunatsiaq – also known as the Northwest Territories (NWT), Canada. Over time, the land-based, migratory groups of Dene, Inuvialuit and Métis Peoples who are Indigenous to these regions settled into permanent communities that included European/settler colonial institutions such as government offices, church missions, and resource extraction companies. Today, the 45,668 residents of these territories live in 33 geographically dispersed towns and villages, 29 of which are primarily Indigenous communities that range in size from a few dozen to a few hundred households (Statistics Canada, 2023). Many are only reachable by airplane, seasonal ice road, or boat, and rely on diesel-fired power plants (although innovations in renewable power sources are underway). The diverse groups living in these villages – including Dehcho, Tłı̨chǫ, Kátł’odeeche got’ine, Gwich’in/Dinjii Zhu, Inuvialuit, Sahtu Dene, and other First Peoples – engage in vibrant artistic and cultural activities, and many continue to speak their ancestral languages. Alongside seasonal activities like hunting, camping, and fishing, they are busy running community radio stations and co-ops alongside many other local and regional economic initiatives, including involvement in resource development projects and the delivery of public and government services.
With respect to Internet infrastructure, some communities are connected to terrestrial networks (fixed wireless or fibre optic), while others remain dependent on satellite services, which until recently were expensive, slow, unreliable, and subject to restrictive and expensive data caps. Historically, telecommunications corporations based in Southern Canada limited investments in Northern areas and populations that did not generate adequate profits, resulting in increasingly concentrated spaces of digital exclusion (McMahon and Akçayır, 2022). The recent availability of relatively low-cost, reliable, fast, and low-latency LEO satellite systems has disrupted years of reliance on a single incumbent service provider. This sudden access to unlimited, high-quality residential Internet services provides an opportunity to work with Northern residents to understand how they experience the outcomes of these rapid changes.
It is important to stress that while the extension of LEO satellite systems provides Northerners with access to higher-quality Internet services, their operational model can reinforce dependencies on corporate telecommunications systems (Graydon and Parks, 2020). Direct-to-home satellite deployment undermines the potential of locally operated infrastructure in these regions, many of which have limited employment opportunities. In the broader context of platform capitalism, these infrastructures contribute to the extraction of digitalized Indigenous Knowledge (Christen, 2015; Taylor and Kukutai, 2016; Wemigwans, 2018) alongside increasing state surveillance, bureaucratic control, and online harms, compounding barriers of distance, trust, and connection arising from a history of state and corporate expropriations of Indigenous lands, lack of recognition of Aboriginal and treaty rights, and the diminishment of local economies and ways of being (Coulthard, 2014; Irlbacher‑Fox, 2014).
Indigenous interventions in digital inclusion
Despite these challenges, diverse Indigenous Peoples living in rural/remote areas have long asserted their sovereignty over the development and operations of community-owned and operated telecommunications networks, from high-frequency “bush radios” (Hudson, 1974) to satellite and fibre optic infrastructures. There is a growing body of research focused on Indigenous community (or shared) networks, as documented in examples from Mexico (Rosa, 2023), the United States (Duarte, 2017), Aotearoa/New Zealand (Joyce, 2020), Australia (Marshall, 2024), Canada (Budka, 2019; McMahon, 2014), and elsewhere. Such projects are enabled through policy and regulatory frameworks shaped by organizations including the Indigenous Connectivity Institute, Native Public Media, and the First Mile Connectivity Consortium, as well as through on-the-ground efforts by communities to build and operate networks (Hudson et al., 2023).
In Nunagat/Denedeh, the collective orientation of such processes is expressed in a long history of communal freezers, co-operative stores, and land-based cultural camps (Freeland Ballantyne, 2014; Tulugak and Murdoch, 2007). When describing Internet services, such initiatives orient infrastructural design, deployment, and operations towards local and regional benefits, such as through investing and circulating revenues locally and seeking input from residents on how best to mitigate risks and utilize opportunities that come from enhanced connectivity. In Northern Canada projects are expressed in examples from Jean Marie River First Nation’s fixed wireless network (Katlotech, n.d.) to regional systems such as the Eeyou Communication Network (Toso and Forward, 2023) and K-Net’s hybrid satellite/fibre system (Beaton and Campbell, 2014).
Methodology
Research design
Designing appropriate digital inclusion interventions in rural/remote and Indigenous communities requires trusting, reciprocal relationships that recognize solutions must be context-specific and locally driven. Indigenous Peoples have always engaged with and made use of appropriate technologies to further their community aims. Simply providing and ensuring access to technologies has drawn criticism for the emptiness of its rhetoric and its paternalistic tone. Embedded in this rhetoric lies an entrenched belief that Indigenous Peoples have always been “late” to catch onto technological developments, leaving external agencies to take the lead on servicing Indigenous needs rather than enabling communities to lead these initiatives themselves (Carpenter et al., 2021; Philpot et al., 2014).
In contrast, Guenther et al. (2020) suggest relationality as an important contextual factor driving digital inclusion. They point to the example of InDigiMOB, a program designed with Indigenous Peoples in northern Australia that provides technical, training, and infrastructure support and digital literacy workshops (p. 155). Relationships between inDigiMOB staff and participants played a significant role in engaging people in digital inclusion activities that resulted in a greater sense of personal empowerment, confidence, and community self-determination (p. 167). Similar community-driven and Indigenous-led digital inclusion projects are reflected in projects in the U.S. (Duarte et al., 2021), Mexico (Baca-Feldman, 2021; Hinojosa and Baca-Feldman, 2021; Rosa, 2023), Canada (Carpenter, 2010), Argentina (Lithgow et al., 2022), and Sarawak, Malaysia (Harris et al., 2018), among other sites. Guided by community‑engaged and Indigenous research protocols, such projects seek to provide tangible community benefits, such as local employment and the protection of local knowledge (Beaton et al., 2017). Best/wise practices include conducting early, extensive consultations with participants and organizations, and ensuring relationships reflect mutual learning and respect (Gaudry, 2015; Henri et al., 2020; Tuhiwai Smith, 1999). Such community‑based participatory action research seeks to redress the underrepresentation of disadvantaged or marginalized communities in research, and include outcomes that support the desired goals of involved communities, such as policy change or curriculum development, alongside traditional academic outputs (Menzies, 2004; Quarry and Ramirez, 2009).
This study adopts this community-centred approach to digital inclusion by prioritizing the perspectives and leadership of engaged Northern organizations and communities. It draws on a foundation established through a 3-year (2019–2022) project that worked with community members across Nunatsiaq/Denendeh (NWT) to co-create and deliver free, openly-licensed digital literacy courses (McMahon et al., 2025b). Developed through a partnership between university‑based and community-based researchers, educators, and communicators, both Indigenous and non‑Indigenous, the project involved advocating for equitable digital connectivity policy/regulation; researching digital barriers, hopes, and concerns of Northerners; celebrating NWT‑based digital innovators; and sharing capacity around digital inclusion (DigitalNWT, n.d.).
Project activities were strongly informed by literature and practices from communications for development and Indigenous research methodologies. During the project, participants highlighted their concerns about being exploited by researchers and their desire for local control over technical infrastructure. In addition to the significance of collaboration, they stressed the importance of land-based activities, local contexts, Indigenous knowledge protocols, and a recognition of data colonialism (Meijas and Couldry, 2019) and extractivism (Greer, 2019).
Building on these insights, our project positions community members as co-researchers and educators who help university-based researchers understand and interpret the impacts of the rapid introduction of LEO satellite services (Starlink). This work was part of a multi-year (2023-2026) partnership between the Native Women’s Association of the NWT (NWA-NWT), Smart Communities Society NWT/Computers for Schools NWT, and the University of Alberta. Funded by Indigenous Services Canada, the Indigenous Families Connections Project provided participating low-income households in rural/remote Nunatsiaq/Denendeh communities with Starlink equipment and monthly connectivity fees, as well as a refurbished computer. We note that these connectivity subsidies will end, and hope that our research contributes to efforts to transition the project into a new phase, particularly as policymakers are considering whether to implement consumer subsidies in the Far North (CRTC, 2025).
In this context the University of Alberta is conducting an impact assessment of digital inclusion/equity through surveys and interviews. This responds to requests from involved communities to learn how the sudden influx of Internet connectivity is impacting local economies and access to public services, as well as social relations and cultural practices. The work is guided by research protocols established by Northern Indigenous organizations and community members (Gwich’in Tribal Council, 2011).
To conduct this research, we implemented a multistage sampling technique to understand the experiences of end-users of LEO satellite services. All research activities, tools, and instruments were approved by representatives of Northern organizations, the research licensing office of the Government of the NWT, and the research ethics board at the University of Alberta. All survey respondents provided consent for their participation in this study and received a small honorarium ($50 gift card) or an option to enter a prize draw. No respondents withdrew from the study.
Data collection procedure
We collected quantitative and qualitative data through two rounds of household surveys conducted in the participating Dene community. We purposely selected this community because of its dependence on satellite Internet services, due to its remote location and the unavailability of alternative connectivity options. This is a community of 130 households with 333 persons according to the 2021 Statistics Canada population census (Government of Canada, 2022). Every household is qualified to participate in the study, and participating households were randomly selected (convenience sample). Responses are restricted to the head of household to ensure that only one representative per household completes the survey.
We adopted a longitudinal method comparing the results of two sets of household surveys. Two points in time were chosen: when LEO satellite services first became widely available, and after approximately 1 year of Starlink adoption. The first surveys (October and December 2023) provide a baseline encompassing technical challenges, issues of concern, and community expectations regarding Internet services prior to the widespread adoption of Starlink. The second round of surveys (December 2024 and February 2024) revisited these questions using an identical questionnaire. Both surveys consisted of 45 questions that collected both quantitative and qualitative data.
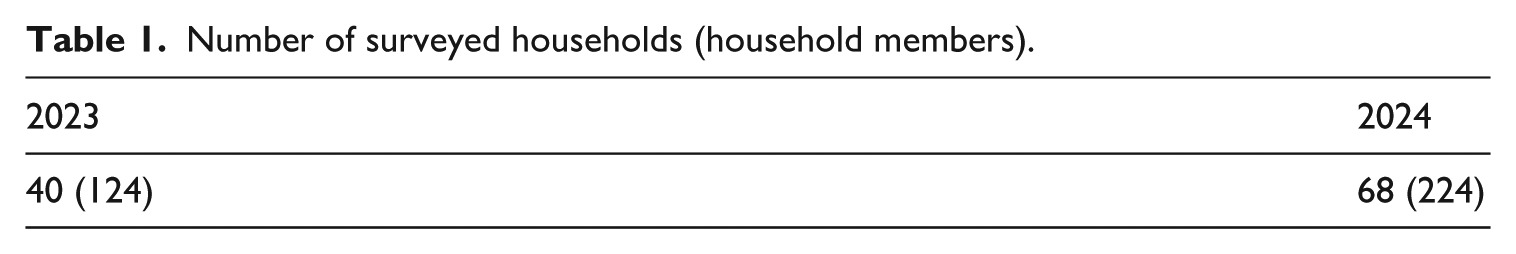
The sample strength is 40 households (representing 124 individuals) in 2023, and 68 households (representing 224 individuals) in 2024/2025 (see Table 1). This implies that between one-third to one-half of the total households in the community are represented in the study (some households participated in both rounds of surveys). Data were not nested because the study allows for independent sample collection to reflect possible homogeneous outcomes of the interventions.
Number of surveyed households (household members).
Both years employed community-engaged data collection, as suggested by our Northern partners. In 2023, we trained and hired local researchers, who signed confidentiality agreements. To further protect the privacy of respondents, we did not ask demographic questions related to age, gender, socioeconomic status, race/ethnicity, or education level. Data were collected using Android tablets equipped with an offline survey data collection app (Open Data Kit); local researchers used the app to securely upload all survey results to university-based researchers for sorting and analysis.
In 2024/2025, university researchers travelled to the community with project staff from Northern partner organizations to host a local event to conduct surveys, distribute laptops, and meet with residents. University researchers set up 20 laptops pre-loaded with online surveys; they were available to assist and answer questions as required. All survey data were automatically uploaded to university servers through the survey application. Following the initial review of data, the research team hired a local researcher to conduct an additional round of surveys in February 2025, which resulted in 18 additional responses for a total of 68 household surveys in 2024/2025. Following these surveys, we also worked with a Northern researcher to conduct interviews; we briefly note findings from these 28 interviews, which will be discussed in a subsequent article.
The study measured several indicators associated with first-, second- and third-level digital divides. First, we inquired about the number of devices in each household and asked about a series of technical challenges, as well as about Internet connectivity factors like access, reliability, affordability, and speed. To assess second-level digital divides, we asked respondents to identify their perceived level of digital literacy (from beginner to expert). Finally, we explored third-level digital divides (outcomes of use) in two ways. We gathered information about online activities by asking how respondents access seven common services (either online, in-person, or both). The list of services included: education, cultural activities, government services, political engagement, social engagement, healthcare services, and work. We also examined perceptions of online harms by asking Likert-type-scale questions about how concerned members of the community are about the impacts of the Internet on factors including: cyberbullying, mental health concerns, land-based activities, impacts on language and culture, misinformation, online gambling, online pornography/explicit content, online scams, inadequate physical activities, and too much screen time for youth.
Data analysis
Data were analysed using SPSS 24 and interpreted using descriptive and inferential statistics. Responses in descriptive statistics were presented in simple percentages, mean, and standard deviation, which allows for a direct comparison of results. The degree of change in the percentage was also calculated to show either positive or negative changes. Inferential analysis involved running a t
Limitations
This study focuses on data collected from a single small-population community in Denedeh/Nunatsiaq (NWT) and so may not be generalizable beyond this population. We also note that the reliability and validity of the data collected may be affected by the local researchers’ lack of formal post-secondary training in survey methods. Finally, surveys asked a series of closed questions about Internet activities and online harms, and so may not reflect the full spectrum of potential responses.
Results
Taking a holistic approach to studying digital divides, our analysis considers both benefits and risks associated with the rapid adoption of LEO satellite services in this context. We consider all three levels of the digital divide: first-level divides (access, speed, reliability, affordability); second-level divides (self-reported levels of digital literacy); and third-level divides (outcomes of Internet use). First-level divides consider differentiated levels of access, availability, affordability, and adoption, including between and inside geographic contexts. Second-level divides are associated with skills and attitudes (Hargittai, 2002).
Third-level divides highlight how offline socioeconomic inequalities are associated with beneficial or adverse outcomes of Internet use, highlighting how personal and positional categories help explain patterns of access and use (Helsper, 2021). As Anrijs et al. (2023) note, studying access or digital literacy levels do not tell us how individuals actually use the Internet, and whether someone can derive life-enhancing outcomes from it, such as finding a job, diagnosing a health issue, or maintaining social connections. In another example, Bansal and Choudhary (2024) found that differentiated Internet use outcomes are associated with age, gender, education, and occupation – as well as individual life paths. Worldwide, Indigenous populations tend to experience overlapping social and economic disadvantages, worsening both first-level and third-level digital divide outcomes (Campbell-Meier et al., 2020). Moreover, even when communities have online access, low English literacy rates, and lack of formal identification act as barriers to the use of online services (Featherstone et al., 2024).
Emerging research suggests that prosocial outcomes of Internet use are associated with digital inclusion initiatives that take into consideration all three layers of the digital divide. Such initiatives situate access, adoption, and use in relation to community ties and differentiated usage patterns. For example, Horn and Gifford’s (2022) research on rural communities in Malaysia found people were motivated to take up digital devices when friends and family members supported one another by supplying devices and helping each other learn how to use them (p. 737). Access and adoption of ICTs in this context led to positive development outcomes, as people used their new devices for locally-specific forms of e-commerce. Young (2019) similarly found that Inuit communities in Northern Canada shaped their Facebook use in ways that connected to broader strategies of social resilience, leading to patterns of Internet usage that supported culturally specific food-based practices like hunting or sharing food. Research involving rural/remote and urban communities in Chile further highlighted the role that relational factors like social connections, values, and emotions play in supporting community-specific forms of digital inclusion (Correa et al., 2019; Pavez et al., 2023). There are many examples of initiatives that work to ameliorate digital divides through the active efforts of individuals, groups, and communities to appropriate Internet technologies in culturally and locally specific ways (Reisdorf and Rhinesmith, 2020).
While we recognize the importance of these strengths-based initiatives, fewer studies discuss the adverse impacts accompanying the rapid adoption of digital connectivity. As noted above, Heeks (2022) warns about the potential of “adverse digital incorporation” in well-meaning digital inclusion projects. In their case study of the mobile e-commerce platform Paytm in India found that while e-commerce enables more accessible digital payment options and reduced transaction costs for marginalized populations, these benefits must be weighed against the coercive effects of de-monetization that benefit platform owners rather than everyday people. Priyadharma’s (2024) study of digital inclusion of marginalized groups in 10 rural communities in Indonesia found that female teenagers with low literacy levels were more likely to become victims of cyber and digital grooming, highlighting how such projects may amplify pre-existing social inequalities.
These and other studies lead us to focus here on investigating the balance between positive and negative outcomes of Internet use in the context of rapid adoption of LEO satellite Internet services. There is a need for researchers to critically examine how well-meaning discourses, practices, and policies of digital inclusion may connect marginalized individuals, groups, and territories without adequately attending to the unequal social relations shaping their engagement with the Internet. This study contributes to this emerging literature through an empirical examination of the outcomes of efforts to bridge digital divides in rural, remote, Northern and Indigenous regions.
First-level digital divide: Device ownership
Our analysis of first-level digital divides is organized in two sections: Device ownership and Internet connectivity. Table 2 presents the t-test comparing device ownership in 2023 and 2024, which showed a significant increase in the number of devices available in the community. With the mean rising from 25.6 in 2023 to 45.1 in 2024 (t= -11.13, p <.001), we can observe a noticeable, statistically significant increase in the number of available digital devices in the community.
Independent t-test score comparing household devices in 2023 and 2024.
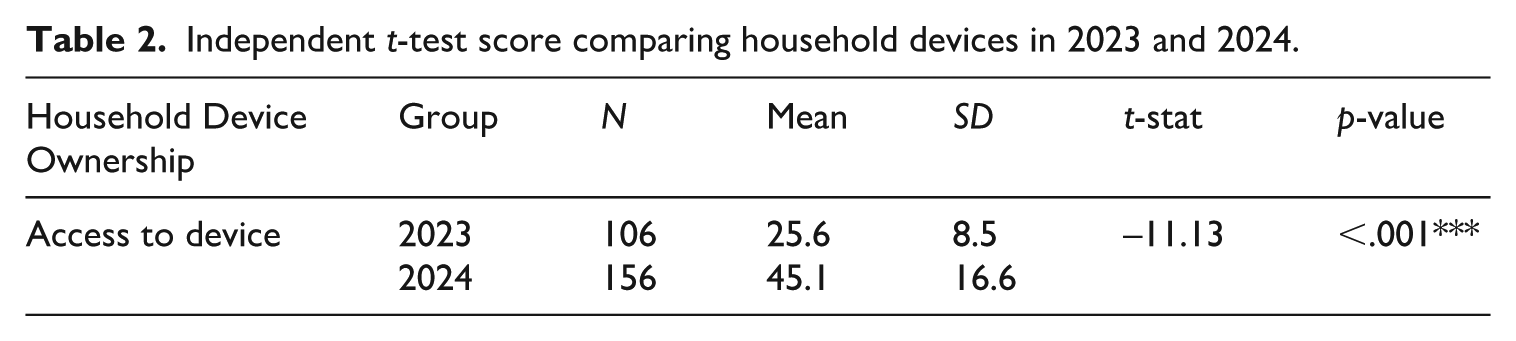
Table 3 presents the t-test comparing the levels of reported technical challenges related to digital devices. The comparison was done by accessing the mean of baseline responses against that of 2024/2025 responses. Findings demonstrate a statistically significant improvement in several indicators related to digital devices following the introduction of LEO satellite Internet.
Technical challenges: Digital devices.
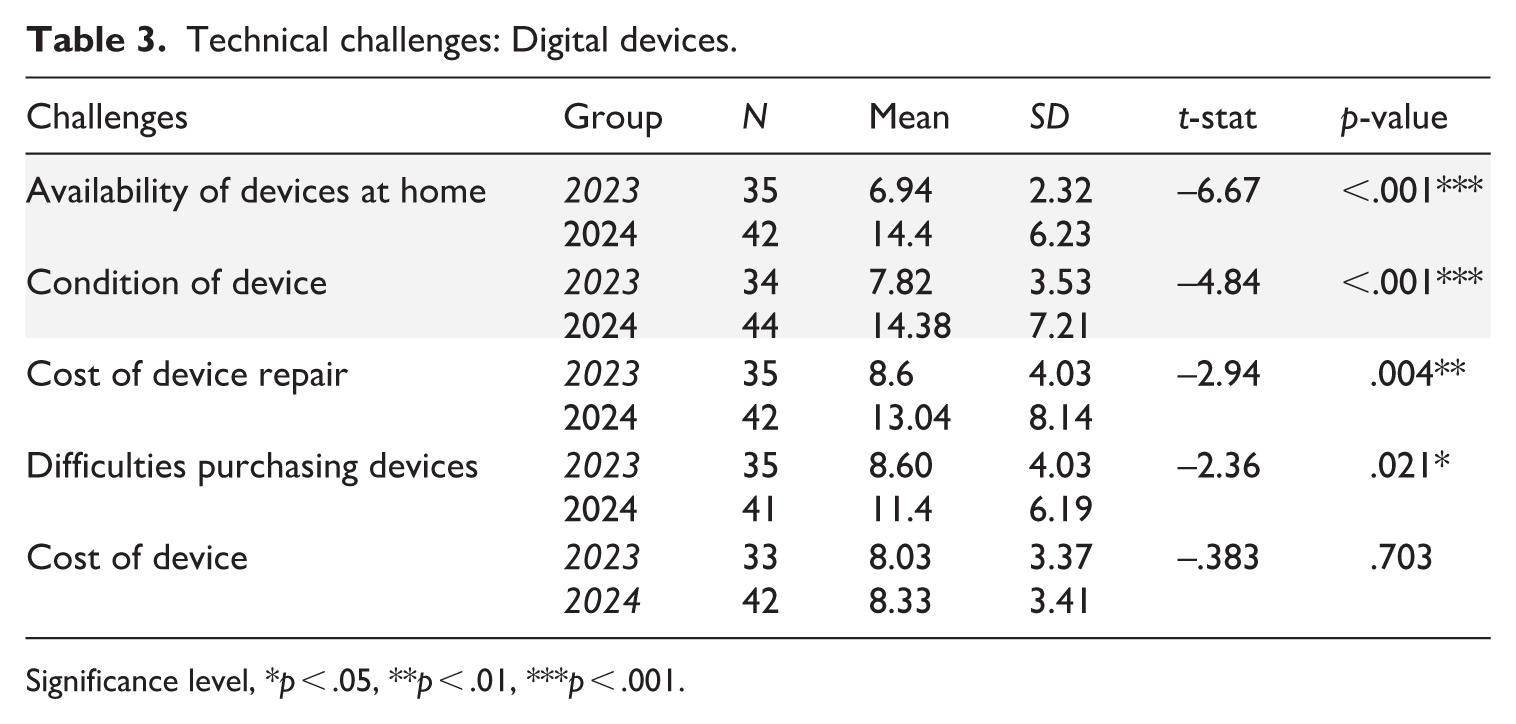
Significance level, *p < .05, **p < .01, ***p < .001.
Specifically, a significant improvement occurred in household device availability, increasing from a mean of 6.94 to 14.4 (t = -6.67, p < .001). This signifies a major stride towards household-level digital readiness. Device condition also improved markedly, with the mean score rising from 7.82 to 14.38 (t = -4.84, p < .001). This suggests that not only did more households have devices, but the devices were also newer or better functioning. This is significant as outdated or malfunctioning devices can be just as limiting as not owning a device.
Despite these gains, the cost of obtaining a device showed minimal change, and the difference was not statistically significant (t = -0.383, p = .703). This suggests that the affordability of digital hardware remains a persistent challenge. Future strategies need to target device-specific financial assistance. That said, we can observe a statistically significant reduction in the cost burden of device repair, as shown by the increase in mean score from 8.6 to 13.04 (t = -2.94, p = .004). Finally, the difficulty in purchasing digital resources declined, as shown by a statistically significant improvement (M = 8.60 in 2023; M = 11.4 in 2024; t = -2.36, p = .021). This finding may reflect improved access to device retailers, online marketplaces, and/or financing programs.
First-level digital divide: Internet connectivity
Next, we asked several questions about Internet access and related challenges. At baseline, only one-quarter of respondents (30%; N = 12) stated that they had home Internet access, due to the cost of service and availability of service. At that time, surveyed individuals represented one of the lowest rates of home Internet among all communities we had surveyed. One year later, only one-quarter (N = 19, 27.9%) of respondents stated they did not have home Internet, while almost three-quarters (N = 49, 72.1%) indicated they subscribed to home Internet. This indicates a significant increase in household Internet access in 2024/2025 compared to baseline.
We also asked respondents if they subscribed to an unlimited Internet plan. At baseline (2023), nine of the 33 people who responded to this question had unlimited data, while 24 (63%) reported they did not. All available household Internet plans offered by the incumbent had monthly usage limits, which suggests those nine individuals may have been early Starlink subscribers. In 2024/2025, the majority of respondents (95.6%) did not respond to this question; of the three people who did, only one did not subscribe to an unlimited Internet plan (two people were unsure). Therefore, we can infer that in 2024/2025, almost everyone in the community who subscribed to home Internet services had an unlimited data plan.
We also see a significant increase in self-reported Starlink Internet subscriptions. Almost everyone who answered this question in 2024/2025 stated they subscribe to Starlink, compared to just six people in 2023. The majority of Starlink users (33 respondents) stated they began using Starlink around the summer of 2023, which establishes that most respondents began when we conducted baseline surveys.
Table 4 presents the t-test comparing experiences with technical challenges associated with Internet services. As above, this comparison assessed the 2023 baseline against 2024/2025 survey responses. Findings demonstrate that there is a statistically significant improvement in perceptions of many technical challenges.
Technical challenges: Digital connectivity.
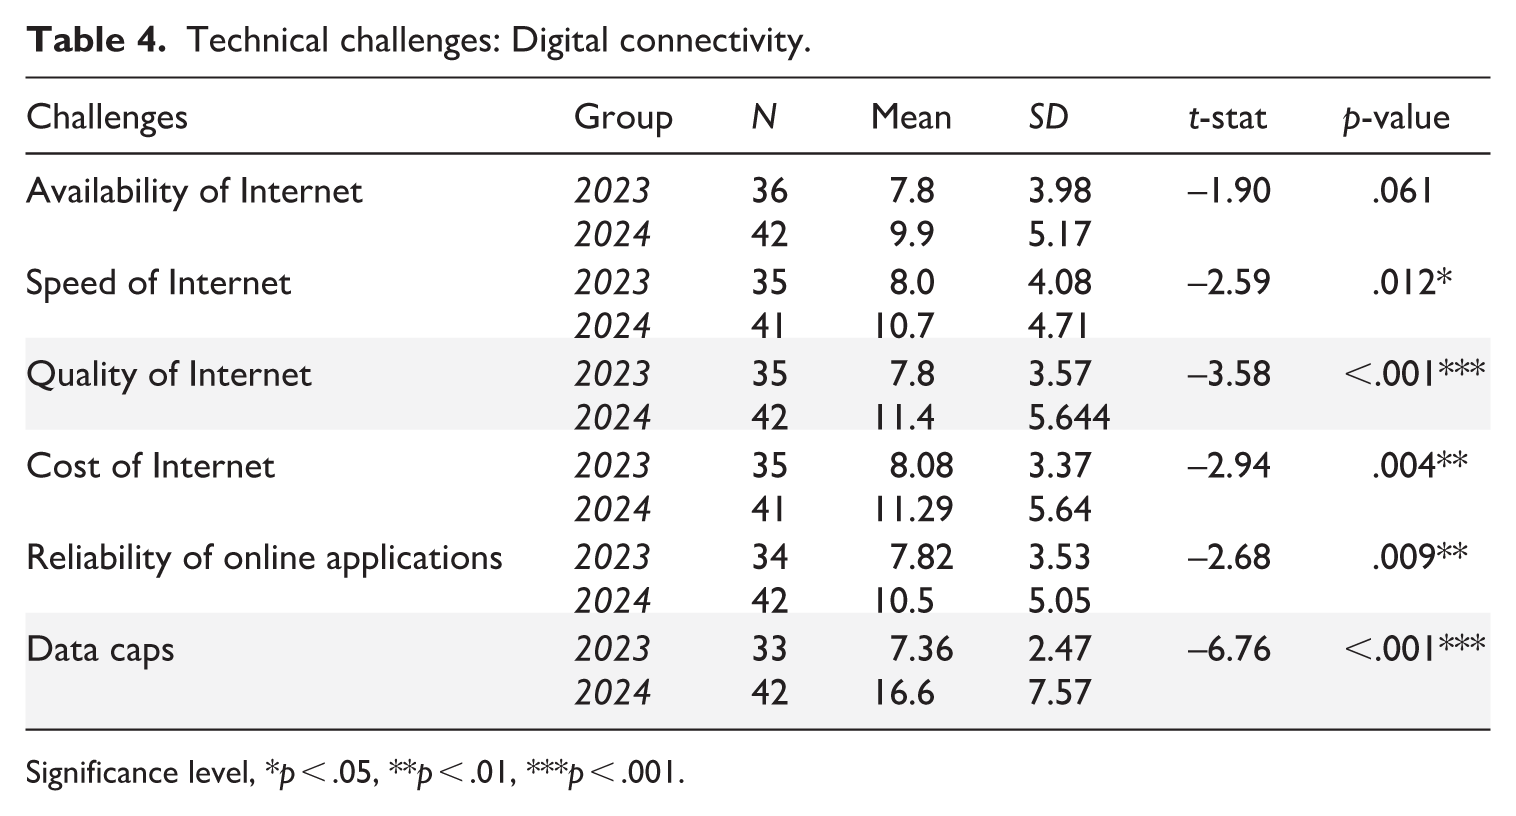
Significance level, *p < .05, **p < .01, ***p < .001.
During the year, the mean score for Internet availability rose from 7.8 in 2023 to 9.9 in 2024/2025, indicating a positive trend in accessibility. However, the result did not reach conventional statistical significance (t = -1.90, p = .061). This suggests that while the adoption of LEO satellite Internet may have led to some improvement, the change was not uniform or large enough to be confidently distinguished from random variation. The lack of statistical significance may be due to sample variability or insufficient reach of the infrastructure expansion efforts.
There was a significant improvement in perceptions of Internet speeds from 2023 (M = 8.0) to 2024/2025 (M = 10.7), with a statistically significant t-value (t = -2.59, p = .012). This suggests that respondents hold strong perceptions of enhanced connectivity speeds delivered by LEO services. The increase in mean score implies that they experienced faster Internet, likely due to upgraded broadband provided by LEO services. This improvement is crucial for supporting digital inclusion through better access to real-time applications, remote education, and telehealth services. We intend to measure these perceptions against available speed test data.
A highly significant increase was also recorded in the perceived quality of Internet services, from a mean of 7.8 in 2023 to 11.4 in 2024/2025 (t = -3.58, p < .001). This robust statistical result indicates that not only did user perceptions of access improve, but the consistency and user experience associated with Internet connectivity also improved substantially. This likely reflects technical improvements such as fewer outages, higher bandwidth capacity, or enhanced service reliability, critical for sustaining long-term digital engagement.
The mean score of perceptions of the cost of the Internet also increased from 8.08 to 11.29 (t = -2.94, p = .004), showing a statistically significant improvement in user perceptions of the affordability of Internet services. This higher score may reflect respondents perceiving the cost as less burdensome due to free Internet provided by the partner for the intervention or the monthly fixed price of Starlink, which offers a reduced price and no overage cost. This is particularly relevant in communities where financial barriers have traditionally restricted digital participation.
As noted above, data caps became non-existent for many respondents in 2024/2025. The t-test showed that this category exhibited the most dramatic shift in user perception, with the mean soaring from 7.36 to 16.6 and a highly significant p-value (t = -6.76, p < .001). Such a substantial jump suggests that LEO services have drastically reduced or eliminated restrictive data usage limits, enabling broader participation in data-intensive activities like video streaming, e-learning, and remote work. This also indicates a move towards more equitable data provision between rural/remote and urban communities in Canada.
Finally, there was a significant improvement in perceptions about the reliability of online applications, with the mean increasing from 7.82 to 10.5 (t = -2.68, p = .009). This suggests that enhancements in satellite Internet connectivity are reflected in better application performance. This factor is essential for sustained digital engagement, particularly for educational and governmental platforms.
Second-level digital divide: Digital literacy self-assessment
Next, we consider whether the widespread adoption of LEO satellite services correlated with the second-level digital divide (skills and education). This survey question asked respondents to assess their digital literacy by categorizing themselves as either “Beginner,” “Neutral,” “Strong,” or “Expert.” In the survey, digital literacy was defined as the “ability to use digital technologies such as computers, mobile phones, and the Internet.”
Responses to this question are similar between the 2023 baseline and the 2024/2025 surveys. At baseline, 35 households answered this question (92% response rate), with the majority of respondents indicating that they possessed either a “Beginner” (34%) or “Neutral” (34%) level of digital literacy, with 26% identifying themselves as “Strong.” Only a small percentage of respondents considered themselves to be “Experts” (6%).
In 2024/2025, 66 households answered this question (97.1% response rate). The majority indicated that they possessed either a “Strong” (32.4%) or “Neutral” (29.4%) level of digital literacy. Only a small percentage of respondents considered themselves to be “Experts” (7.4%).
Third-level digital divides: Patterns of Internet usage
Finally, we asked how respondents use and perceive Internet services. We note that this is a fly-in community; return plane tickets to/from Yellowknife cost approximately $600 CAD. While the community is not connected by ice road, people can travel to/from Yellowknife by boat or snowmobile.
The majority of respondents in both sets of survey responses reported that they visit urban centres relatively infrequently to access services, with people reporting that they visit urban centres slightly less frequently in 2024/2025 than in 2023. The question asking how respondents access public services and participate in economic activities (online, in-person, both, neither) had a high response rate in both years. In both years, respondents typically use both online and in-person methods to access these services, suggesting a blended approach. In 2024/2025, we observed increased adoption of online-only services in the areas of social interaction and politics, and a slight decrease in work. Figure 1 illustrates the top three activities that most significantly changed in form of access between Phase 1 and 2.
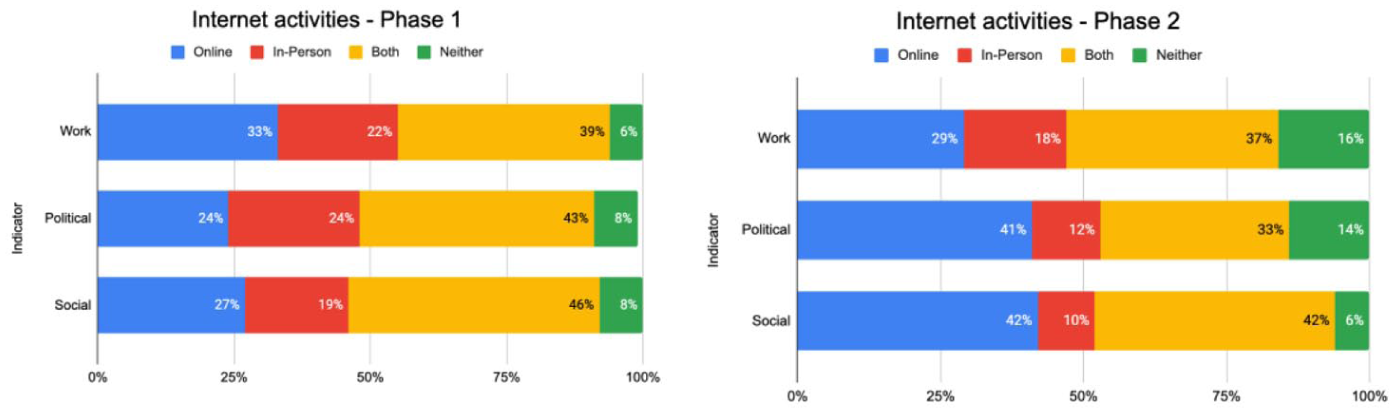
Divergence between anticipated and actual uses of online applications.
Table 5 presents the t-test result confirming these Internet usage patterns. The t-test results reveal significant changes in self-reported patterns of Internet usage in political engagement and social engagement following the increased adoption of LEO services. A pronounced improvement was observed in political engagement, where the mean score increased from 12.1 to 15.1 (t = -2.69, p = 0.008). This highly significant result points to a growing use of digital tools for civic participation, such as accessing political information, engaging in online activism, or participating in electoral processes. Similarly, Internet usage for social engagement experienced a dramatic and highly significant increase, with the mean rising from 12.7 to 17.4 (t = -3.77, p = 0.001). This finding underscores the role of improved connectivity in fostering social inclusion, reducing isolation, and enhancing communication.
t-test score comparing Internet usage in 2023 to 2024/2025.
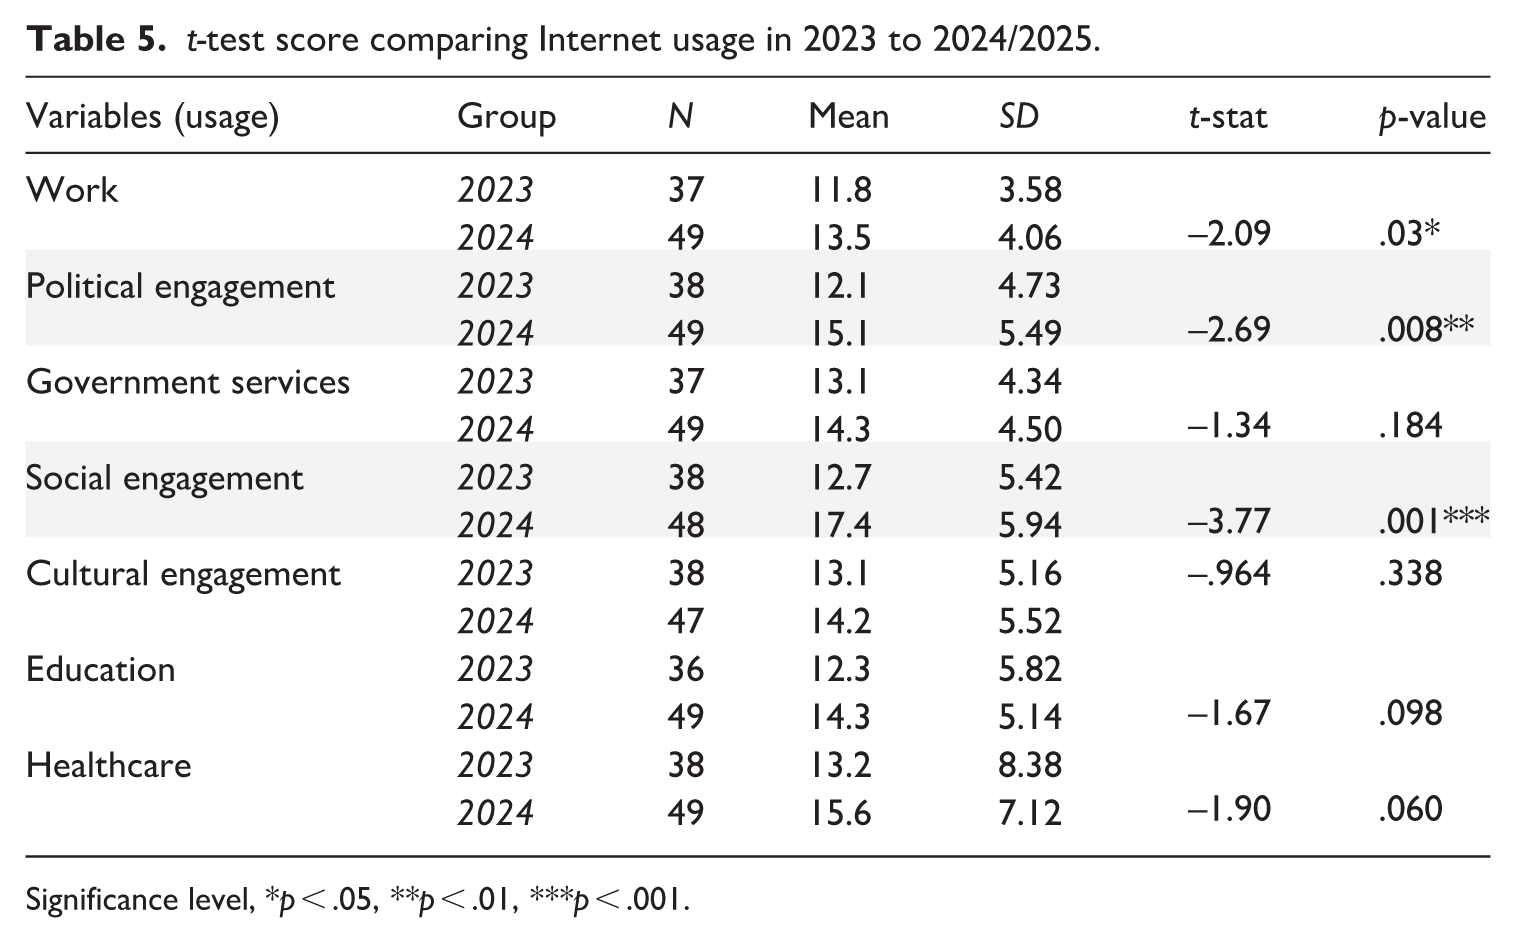
Significance level, *p < .05, **p < .01, ***p < .001.
In contrast, the increase in Internet use for accessing government services, though present (mean increased from 13.1 to 14.3), was not statistically significant (t = -1.34, p = 0.184). This suggests that despite better connectivity, other factors such as low awareness or limited service usability may have hindered effective engagement with digital government platforms. A similar trend was found in the cultural domain, where Internet usage rose slightly from 13.1 to 14.2 but without statistical significance (t = -0.964, p = 0.338). This indicates that Indigenous cultural expression and participation online remain an underdeveloped area, potentially due to a lack of localized content or relevant digital initiatives.
While educational use of the Internet increased from 12.3 to 14.3, the result was marginal (t = -1.67, p = 0.098), hinting at positive change that may reach significance with sustained efforts. Similarly, healthcare-related Internet usage showed an upward but non-statistically significant change from 13.2 to 15.6 (t = -1.90, p = 0.060). These findings point to emerging but fragile gains in these sectors, possibly reflecting initial adaptation to telehealth and e-learning systems that require further investment and support to achieve equitable digital integration.
Interestingly, while people reported they generally used many “online” public services at roughly the same rate as in 2023, available data point to a lower perceived value of online public services in 2024/2025 compared to 2023. For example, in 2023, the majority of the respondents (85%) rated the importance of online public services as 5 or above (on a scale of 1–10). We asked more detailed questions in 2024/2025 and learned that some individuals reported accessing online healthcare and educational services. However, when we directly asked if they are likely to access telehealth (online healthcare services) from home, most were not likely to do so. We also see noticeable drops in the number of people stating that they accessed online education or healthcare in 2024/2025 compared to 2023. Interviews (discussed below) suggested that some people are concerned that they may lose access to in-person healthcare/educational services due to a shift to online service delivery, which may help explain this finding.
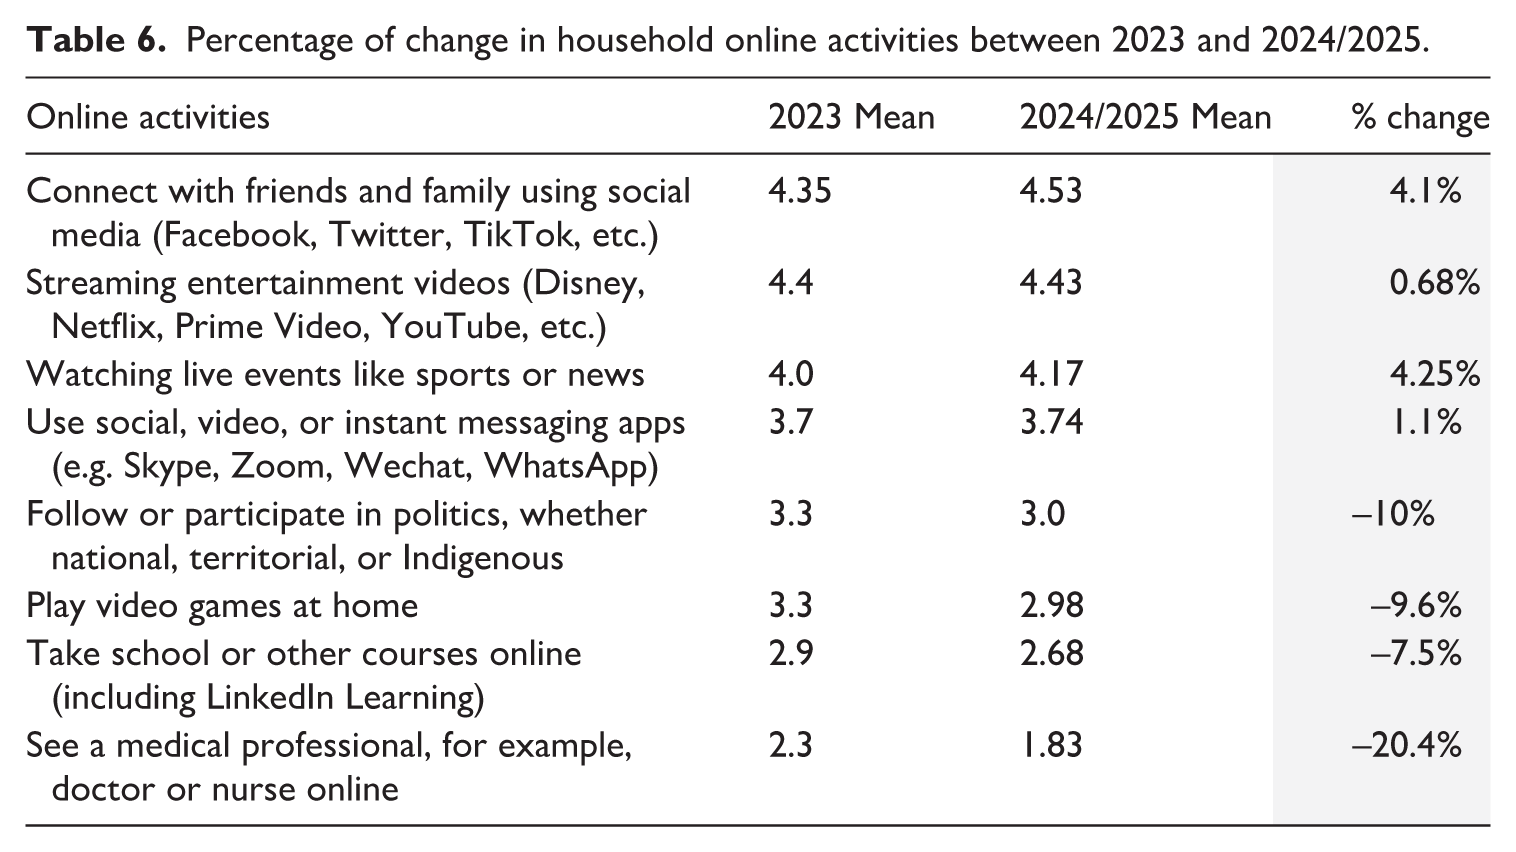
These observations are largely validated by responses to a second set of survey questions that asked what activities people in their household used the Internet for (see Table 6). We presented a list of indicators associated with either entertainment activities (e.g. using social media and messaging apps, streaming entertainment videos, watching live events, playing video games) or non-entertainment activities (e.g. following and participating in politics, taking online courses, or accessing online healthcare). As presented in Table 6, compared to baseline, respondents tended towards increasing levels of entertainment activities and decreasing levels of non-entertainment activities. For example, they expressed an approximate 4% increase in social media usage and watching live events alongside a decrease of 20% and 7.5% in online education and healthcare usage, respectively. This may point to more of a “consumer” mindset among Internet users in 2024/2025 compared to 2023.
Percentage of change in household online activities between 2023 and 2024/2025.
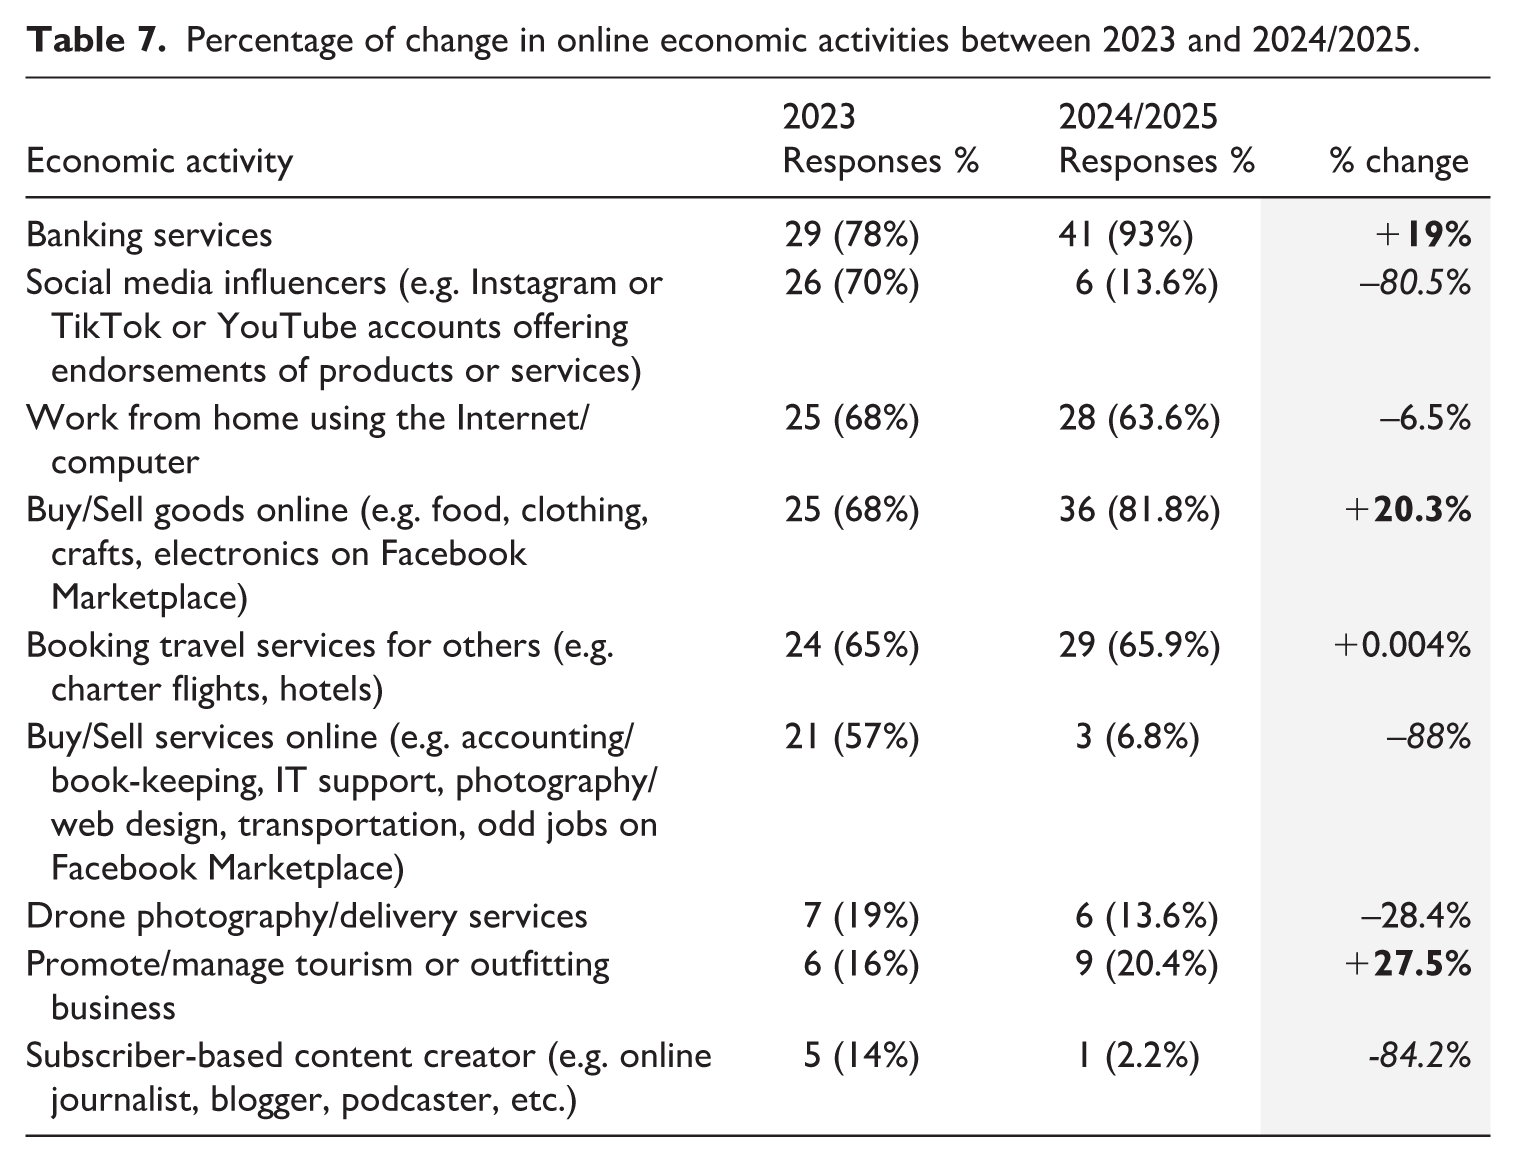
A third set of questions focused on online economic activities, where we can observe quite significant changes between anticipated and actual uses of online services. As illustrated in Table 7 (which presents key findings in bold font), at baseline, many respondents expected to work as social media influencers, buying/selling services online, or creator subscriber-based content. By 2024/2025, we see drastic reductions of more than 80% in all three of these economic activities. Conversely, after 1 year of improved connectivity, respondents are more likely to report they are using online banking services (+19%), buying/selling goods online (+20.3%), or promoting/managing a tourism or outfitting business (+27.5%). These findings provide useful information when designing digital inclusion initiatives focused on supporting locally relevant economic activities.
Percentage of change in online economic activities between 2023 and 2024/2025.
In summary, we suggest that these findings point to a divergence between how respondents anticipated to use newly available online applications (such as for education, healthcare and work) and how they actually use them following 1 year of improved Internet access. The available data regarding outcomes of Internet use demonstrate that the rapid adoption of LEO services made statistically meaningful improvements in Internet usage for social and political engagement. However, gaps remain in domains such as government services, culture, education, and healthcare, where increased access has not yet fully translated into significant usage. Furthermore, online economic activities express similar distinctions between anticipated and actual uses, indicating evolving ways that respondents are utilizing improved Internet connections to support their livelihoods. These findings emphasize the importance of coupling infrastructure development with targeted digital literacy, culturally relevant content, and user-friendly service design.
Third-level digital divides: Concerns regarding online harms
Finally, we consider respondents’ concerns regarding the outcomes of increased Internet usage, providing insights into their perceptions of online harms. Notably, concerns about almost all issues have significantly increased from 2023 to 2024/2025, with more people indicating they are “very concerned” or “somewhat concerned” about online harms in 2024/2025 when compared to the baseline. In particular, respondents seem most concerned about cyberbullying, risks to youth (mental health, physical activity), and financial harms (e.g. scams).
Table 8 presents the independent t-test results, which reveal a statistically significant increase in reported concerns across all measured variables, indicating that while digital access has improved, it has also introduced or amplified community anxieties.
Independent t-test results comparing Internet concerns in 2023 to 2024/2025.
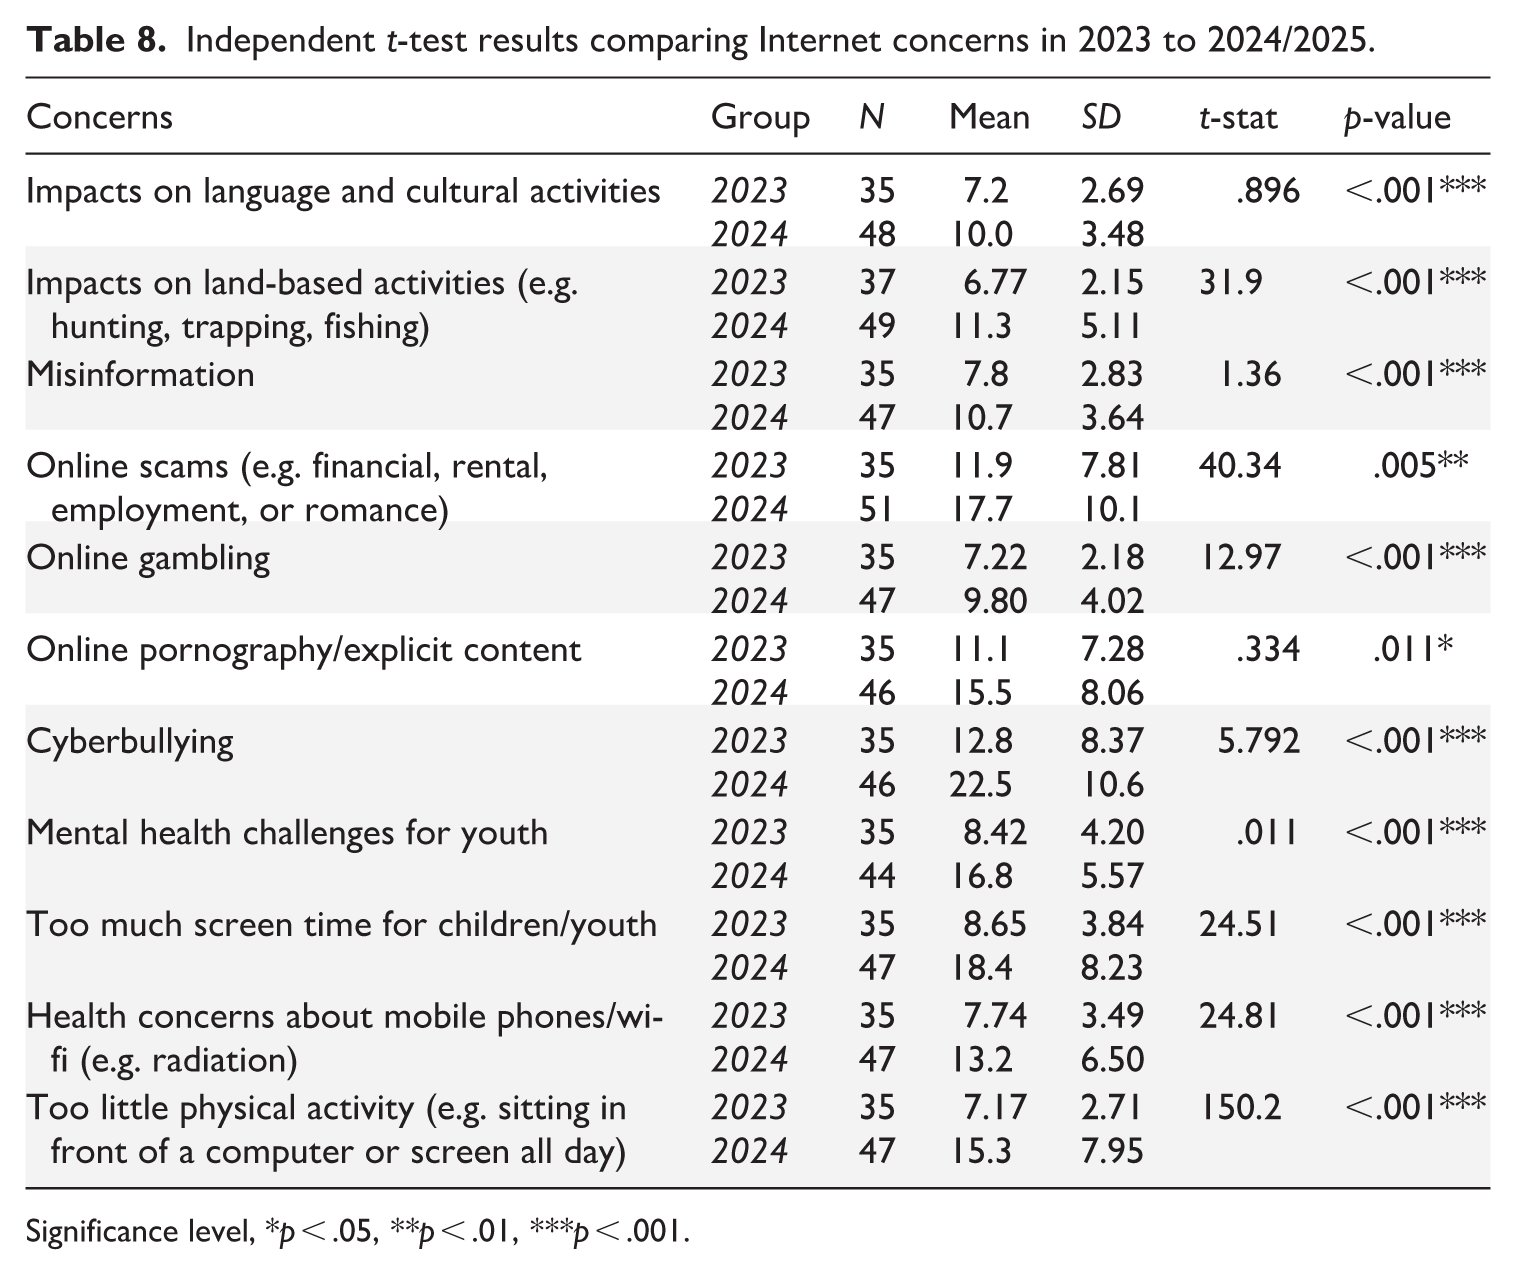
Significance level, *p < .05, **p < .01, ***p < .001.
One of the most significant changes was observed in concerns over the impacts of the Internet on language and cultural activities, where mean scores rose from 7.2 in 2023 to 10.0 in 2024/2025 (t = -3.85, p < .001). This suggests heightened awareness or apprehension regarding how online practices may interfere with cultural practices. Similarly, concerns about disruption of land-based activities significantly increased from a mean of 6.77 to 11.3 (t = -4.91, p < .001), suggesting potential tensions between increased Internet access and the preservation of Indigenous and rural land-based livelihoods.
A notable rise in misinformation concerns was also reported, with mean scores increasing from 7.8 to 10.7 (t = -3.67, p < .001). This signals that while access to information has broadened, the quality and credibility of digital content are now pressing issues, especially in communities that may lack media literacy training. The risk of online scams also emerged more strongly in 2024/2025 (mean rose from 11.9 to 17.7; t = -2.85, p = 0.005), likely due to increased exposure to unfamiliar digital platforms without parallel increases in cybersecurity awareness.
Concerns over online gambling and pornography both increased significantly, from 7.22 to 9.80 (t = -3.43, p < .001) and 11.1 to 15.5 (t = -2.59, p = 0.011), respectively. The surge in cyberbullying concerns is particularly dramatic, with the mean jumping from 12.8 in 2023 to 22.5 in 2024/2025 (t = -4.38, p < .001), revealing serious worries over youth safety, online harassment, and the psychological risks of increased online interactions.
Indeed, this leads to one of the most critical findings of this study: the profound rise in mental health concerns related to Internet usage, which nearly doubled from 8.42 to 16.8 (t = -7.37, p < .001). Similarly, concern over excessive screen time rose sharply from 8.65 to 18.4 (t = -6.49, p < .001). Likewise, general health concerns tied to Internet use rose from 7.74 to 13.2 (t = -4.54, p < .001), perhaps pointing to fears over sedentary lifestyles, eye strain, and other physical consequences. Finally, the increase in concerns over too little physical activity (7.17–15.3; t = -3.79, p < .001) rounds out a consistent narrative that suggests that increased digital access, while beneficial in some areas of Internet use, simultaneously creates unanticipated social and health side effects.
While not reported in detail here, we note that many of these findings are further validated by interviews conducted in Summer 2025. Interview participants (N = 28) confirmed observations that LEO services have solved “first-level” digital divides. They also pointed out the divergence between “anticipated” and “actual” uses of improved Internet services, and provided additional evidence of increasing concerns around online harms. Participants expressed concerns that people are bringing Starlink dishes to events such as the community’s annual spiritual gathering (P309) or youth-oriented on-the-land programs (P364), and confirmed a growing awareness of harms such as deep fakes and misinformation. As one participant stated: “Yeah, the gambling and the online gaming . . . I know lots of kids here, that’s all they do. Like every day and every night. You don’t even see them for weeks.” (P358)
However, interviews also revealed additional nuances in how people are experiencing newly available LEO services. For example, interview participants told us that despite increasing online harms, online platforms are also spaces where culture, humor, and relationships are expressed. For example, one young community member felt that gaming was misunderstood by adults, and stressed that online gaming supports connection and community, and should not be dismissed. Finally, participants stressed the importance of workshops to accompany the deployment of LEO services. Parents and Elders stressed the importance of setting parental controls and developing usage rules, while youth and adults requested access to training on online education and employment opportunities. We are currently analysing these interview responses and will present our findings in a future article.
Altogether, our analysis of online harms in this context illustrates how rapid adoption of LEO services effectively addressed digital inequality by boosting Internet access, but also amplified a range of issues regarding the outcomes of Internet use. These findings point to the double-edged nature of increased Internet access: while access is vital, communities also need accompanying supports in areas such as appropriate digital literacy training, cyber-safety education, mental health resources, and culturally sensitive frameworks. This reinforces an approach to digital inclusion that foregrounds how bridging the digital divide is not just about connectivity, but must also prioritize community-engaged forms of safe, informed, and locally responsive Internet usage.
Conclusion
The longitudinal data analysed in this study suggest that following adoption of LEO services, the first-level digital divide in remote fly-in Indigenous communities is meaningfully narrowed. Statistically significant improvements were observed in Internet speed, quality, cost, data caps, and access to and condition of digital devices. Compared to the 2023 baseline, respondents indicated that the first-level digital divide (access, affordability, speed, reliability) has largely been addressed.
The findings also suggest that alongside increased access comes new challenges and ambivalence, potentially highlighting the emergence of third-level divides in outcomes of Internet use. The longitudinal data suggest gaps between “anticipated” and “actual” online activities. After 1 year of improved access, people tend to engage in different economic activities than anticipated. Compared to baseline, people are also less likely to view and use Internet services as a means to access online public services. Fewer people indicated that they are utilizing the Internet for educational or healthcare, while more people are going online to access entertainment and to socialize.
Significantly, our study also found that alongside increased access comes new challenges. Compared to baseline, respondents indicated higher awareness of and concerns over online harms such as cyberbullying, online scams, and risks to youth. Respondents also indicated ambivalence between the positive and negative effects of the Internet on their social and cultural practices, and indicated stronger feelings that the Internet controls too much of our world today. More analysis of follow-up interviews will help reveal the nuances in these observations.
To address these concerns, research indicates that contextually specific training programs can help newly connected people secure relevant benefits from improved Internet connectivity (Katz and Gonzalez, 2016). For example, Bansal and Choudhary (2024) suggest that information about online activities should be integrated into collaborative digital literacy training programs, thus connecting second- and third-level digital divides. Specifically, their study of the government of India’s digital literacy training programs in rural areas of Rajasthan revealed that participants found such programs helped them experience the socioeconomic benefits of connectivity. We suggest that a similarly structured, comprehensive, community-led digital inclusion program may be beneficial to include alongside the deployment of LEO Internet services in rural/remote and Indigenous communities.
Overall, our findings indicate an emerging shift in concerns from first-level digital divides (access, affordability, reliability, etc.) to third-level digital divides (outcomes and impacts of Internet use). This aligns with Heeks’ concept of adverse digital incorporation, which stresses that as Internet access becomes increasingly ubiquitous, researchers and policymakers must consider emerging challenges that arise alongside connectivity. Our study found that many people retain a predominantly positive outlook on the Internet’s role in supporting traditional and cultural practices, language learning, and local information-sharing. However, after 1 year of LEO Internet services, people are also expressing more concerns about online harms, as well as lowered expectations regarding access to online public services and economic activities. 1 This highlights the importance of digital inclusion programs that are designed in ways that recognize and reflect community goals of culture and language resurgence, as well as nurture digital solidarity economies; otherwise, increased access threatens to reproduce previous patterns of extraction and disenfranchisement.
We stress the importance of conducting longitudinal studies that move beyond data collected during the “honeymoon” period when connectivity is first available; our research found that initial expectations and patterns of use may differ or change over time. In short, “solving” first-level access divides may in fact generate new, third-level digital divides. In Canada, the telecommunications regulator recently concluded public proceedings that consider whether consumers in rural/remote Northern regions of the country should receive subsidies (CRTC, 2025). As the regulator and policymakers decide on the outcomes of these proceedings, we stress that comprehensive, community-led digital inclusion programs are needed to accompany the deployment of LEO Internet services, particularly in regions lacking adequate connectivity. Longitudinal, community-engaged research can track impacts as well as strategies to mitigate risks, and help ensure that residents of rural/remote, Northern and Indigenous communities, can fully participate in digital societies and economies while safeguarding their well-being and cultural heritage.
Footnotes
Acknowledgements
The authors thank everyone living and working in the communities that we learned from during this project, including Janine Johnson (Principal of Moose Kerr School) and Billy Archie (Inuvialuit Elder and community research coordinator), whose contributions supported our work across participating communities. We also think the anonymous reviewers for their constructive comments.
Ethical considerations
This study was reviewed and approved by the institutional Research Ethics Board at the University of Alberta. It also received a Scientific Research License from the Government of the NWT. All study participants provided written informed consent.
Funding
The authors disclosed receipt of the following financial support for the research, authorship, and/or publication of this article: This work was supported through the Indigenous Family Connections NWT project, which received funding through Indigenous Services Canada’s Pathways to Safe Indigenous Communities Initiative (grant number: 2122-NR-000751-0003).
Declaration of conflicting interests
The authors declared no potential conflicts of interest with respect to the research, authorship, and/or publication of this article.
Data availability statement
The data that support the findings of this study are not publicly available due to their containing information that could compromise the privacy of research participants. The participating Indigenous community has also requested that the data remain confidential.
Permission to reproduce material from other sources
N/A.