
Abstract
This article takes a historical approach to the analysis of changes in the gathering and display of documents and data by journalists. It stands as an attempt to tease out the underlying epistemological changes implied by these transformations. The transition from the 19th to the 20th century would see the rise of the so-called survey movement, itself tied to the emergence of the progressive movement and concomitant with the growth of new techniques for collecting and visualizing social data. Alongside the emergence of the social survey, and oddly related to it in a number of intriguing ways, this time period would also see the invention of public relations as a technique of press management. To this end, this article chronicles the social movement known as the ‘Men and Religion Forward Movement’, discussing its pioneering combination of data collection, information display, and aggressive publicity strategies in service of the cause of social reform. The article examines the materiality of the Men and Religion Forward Movement’s information collection procedures, its charts, graphs, and other display devices, and the processes by which these ‘representations of the collective’ did or did not manifest themselves in newspaper coverage of the movement.
Introduction
Over the past several years, the practices of ‘data journalism’ have gained increasing prominence in professional journalism as well as journalism schools. Empirical papers (e.g. De Maeyer et al., 2015; Fink and Anderson, 2014; Lewis and Usher, 2013) and even entire special issues of academic journals (Lewis, 2015) have been published to analyze the phenomenon of what Coddington calls: ‘journalism based on data analysis and the presentation of such analysis’ (Coddington, 2015: 334). For the purposes of this article, we can usefully see data journalism as a hybrid form of journalistic practice, one that fuses previously separate professional identities and empirical techniques such as quantitative analysis, social science methodology, and information visualization. With a few exceptions, however (Anderson, 2015; Parasie and Dagiral, 2013), there has been little recent attention paid to the history of data journalism or the manner in which that journalism might interact with larger scientific and political trends in American history. The pages that follow propose that scholars concerned with the role of data and other ‘data-like’ objects in journalistic reporting need to adopt what we might call a ‘genealogical approach’ to understanding the role of quantitative evidence in news reports. In other words, alongside a focus on current techniques of data gathering and visualization in the news, we can also focus on the longer arc of epistemological journalistic practices, looking at how they have been shaped over time. This article, then, focuses on one of the earliest developments in 20th century quantitative information gathering and display – the techniques that emerged in the context of the American ‘social survey movement’ lasting roughly from 1908 through the early 1920s. This species of activism and communication was deeply hybridized, I will argue, hovering somewhere between a kind of public relations, social science, traditional journalism, and progressive muckraking. I call the material products of this hybrid movement ‘social survey reportage’.
I focus on this time period because the early 20th century marks the moment in which the professional boundary categories that have dominated the gathering, production, and reception of empirical evidence about social events (between journalism, sociology, and political activism, for instance) first emerged in a form we take for granted today. By returning to the moment, certain evidentiary techniques emerged and were adopted by professional communicators (Carey, 1965); we might gain a deeper insight into how those naturalized boundaries are, in turn, breaking down today. The genealogical analysis of this journalistic moment, in other words, is more than simply an exercise of antiquarian interest; studying the relationship between journalism, evidence gathering, ideas of social reform, and press-public relations from an earlier era can help us answer some important questions relevant to present debates. First, how did the reporters and editors of an earlier era understand what counted as properly journalistic evidence, and how did these reporters distinguish what was ‘proper data’ in a journalistic sense from data generated and analyzed by other knowledge-producing institutions? Second, how did evolving technologies – defined here rather expansively as techne or the practical, material application of abstract knowledge – affect the way journalists used data and other forms of evidence. Third, how do these shifts in knowledge production draw and redraw the professional boundaries that lie between journalism and other forms of knowing (science, social science, activist praxis, anthropology, etc.)? Fourth, what are the larger cultural, economic, and political environments in which these changes are embedded?
These four questions culminate in a final and overarching concern: how do all of these developments affect journalism’s ability to report ‘the whole’ of a particular situation and relate it to the reporting of individual events that are the mandate of modern news production? My investigation into the use of data is ultimately concerned with this final relationship between a ‘journalism of occurrences’ and a ‘journalism of patterns’, both in the present day and over the course of history. I want to argue that the use of particular types of data, embedded within different narrative structures, leads journalists to emphasize the context in which events occur in different ways, and that these differences are meaningful for what they say about our modern age.
The Social Survey Movement in context
This article focuses on the cluster of early 20th century techniques, technologies, and political commitments that made up social survey reportage. To place these techniques, technologies, and commitments in context, I conducted research in a variety of archives between 2013 and 2015, including the Charles Stelzle Collected Papers at Columbia University and the Russell Sage Foundation archives housed at the Rockefeller Foundation Archives in Tarrytown, NY, USA. Important primary source documents contained in these archives included Messages of the Men and Religion Forward Movement, Volume VII: The Church and the Press, the Sociological and Religious Survey of Seventy American Cities (1912), produced by the Bureau of Social Service of the Presbyterian Church in the United States, and The ABC of Exhibit Planning (1918 by the Russell Sage Foundation. I also drew heavily on the large amount of already published secondary literature on the history of social science, sociology, and the so-called ‘knowledge professions’ in the early 20th century United States and United Kingdom. I found The Social Survey in Historical Perspective (1991, edited by K Bales et al.) Pittsburgh Surveyed (1996, edited by MW Greenwald and MJ Anderson), and Sociology in America: A History (2007, edited by Craig Calhoun) to be particularly valuable in providing an overall historical structure through which I could interrogate my specific findings on data production and journalistic production.
Social survey reportage, as we will see, is a phenomenon that stands at the crossroads of a variety of important epistemological paths: a progressive and ameliorative thrust in segments of the larger political culture, a belief in the importance of collecting on the ground empirical evidence, and an obsession with counting and with the power of numbers to illuminate important truths. At the moment social survey reportage emerged, the boundaries of a variety of knowledge generating occupations were also in flux, with ‘the professions’ as we understand today only beginning to take shape. For several decades, in other words, the dividing lines between journalism, social reform, data gathering, and social science were far less solid than they were for most of the later 20th century. Consequently, aspects of survey reportage were scattered across many fields and disciplines in ways that often make little sense to our modern eyes. To the degree they clustered at all, social survey reportage was focused around particular journals, such as the Survey Graphic, as well as around social movements, like the Men and Religion Forward Movement (MRFM), rather than particular fields or occupations. The Social Survey Movement in general, and the MRFM in particular, (1) believed in the inherent and unproblematic truth of quantitative data, (2) understood the visual power of the graphical representation of statistics, (3) thought that these graphics and data needed to be placed in a popular format in order to reach the people, (4) believed that journalism had become the most powerful moral voice in society, and (5) saw no contradiction between social science, public relations, journalism, and social reform.
Where did the Survey Movement come from, and how did it spawn the MRFM and social survey reportage? We might begin by considering the following seemingly simple question: how many people in 1880s London lived in poverty? To answer this question today, we might search Google, or go on Wikipedia; a few decades ago, we might have used an atlas or consulted news reports for the answer. But the most interesting aspect of this query is simply that, in the 1880s themselves, very few people could do anything more than guess at a possible reply. While the regular decennial census of the United Kingdom contained figures about employment and the distribution of workers into a variety of occupational categories, the quality of the data on work and poverty was, in general, quite mediocre.
Thus, without an answer to even the most basic of questions – how many people in London were poor? – answers to the far more socially and politically vexed questions of why some people were poor and what could be done about it were unanswerable through empirical methods. And answering these questions was of vital social and political importance, particularly to an English middle-class which had come of age in the 19th century and was now watching the Victorian economic and social ideals which formed the background nexus to its general worldview challenged on a number of fronts (McGerr, 2005). In addition to the noticeable consequences of the industrial revolution, an additional impulse ‘that first drove people to measure economic phenomena was an ethical impulse to understand rapidly evolving modern societies … a moral curiosity to more fully understand the world unfolding around them’ (Bateman, 2001: 57). The attempt to answer these questions about the incidence poverty would combine with a publicizing impulse that aimed to generate popular understanding and support to create a particular hybrid form of journalism I am calling social survey reportage.
Out of this curious mixture of middle-class guilt, unquantified but troubling urban poverty, heightened class conflict, and a general turn toward empiricism stepped the unlikely figure of Charles Booth. A wealthy industrialist, ship owner, and cautious social reformer, Booth was initially attracted to the question of how to measure poverty via a dispute with British socialist leader H.M. Hyndman, who claimed in 1885 that 25 percent of all Londoners were impoverished. Familiar with statistics showing that barely 3 percent of the population received government relief under the Poor Laws, Booth (among many others) argued strenuously that this could not be the case. But the data, as we have already noted, were faulty and unreliable (Fried and Ellman, 1969: xxviii). Out of this seemingly simple question about the most basic of economic facts was born Booth’s 17-volume The Life and Labour of the People of London, and with it, the Social Survey Movement.
The basic idea behind Life and Labour seems so obvious to us today that it is important to keep in mind that Booth was seen as an innovator by researchers and reformers who agreed with his results and as a controversial figure by those that did not. How to know how many people lived in poverty in London? Count them, either through first-hand observation and interviews or through conversations with people who conducted these first-hand observations themselves. There would be no ‘sampling’ used in Life and Labor; rather, volunteers and employees would gather as much granular data as possible before venturing basic hypotheses about the presence or absence of poverty.
A second innovation pioneered by these early surveys was the use of color-coded maps showing income levels on a block-by-block or even house-by-house basis (Figure 1). This use of visualization was common in studies that considered themselves part of the Social Survey Movement, despite variations in their exact data-gathering methodology.
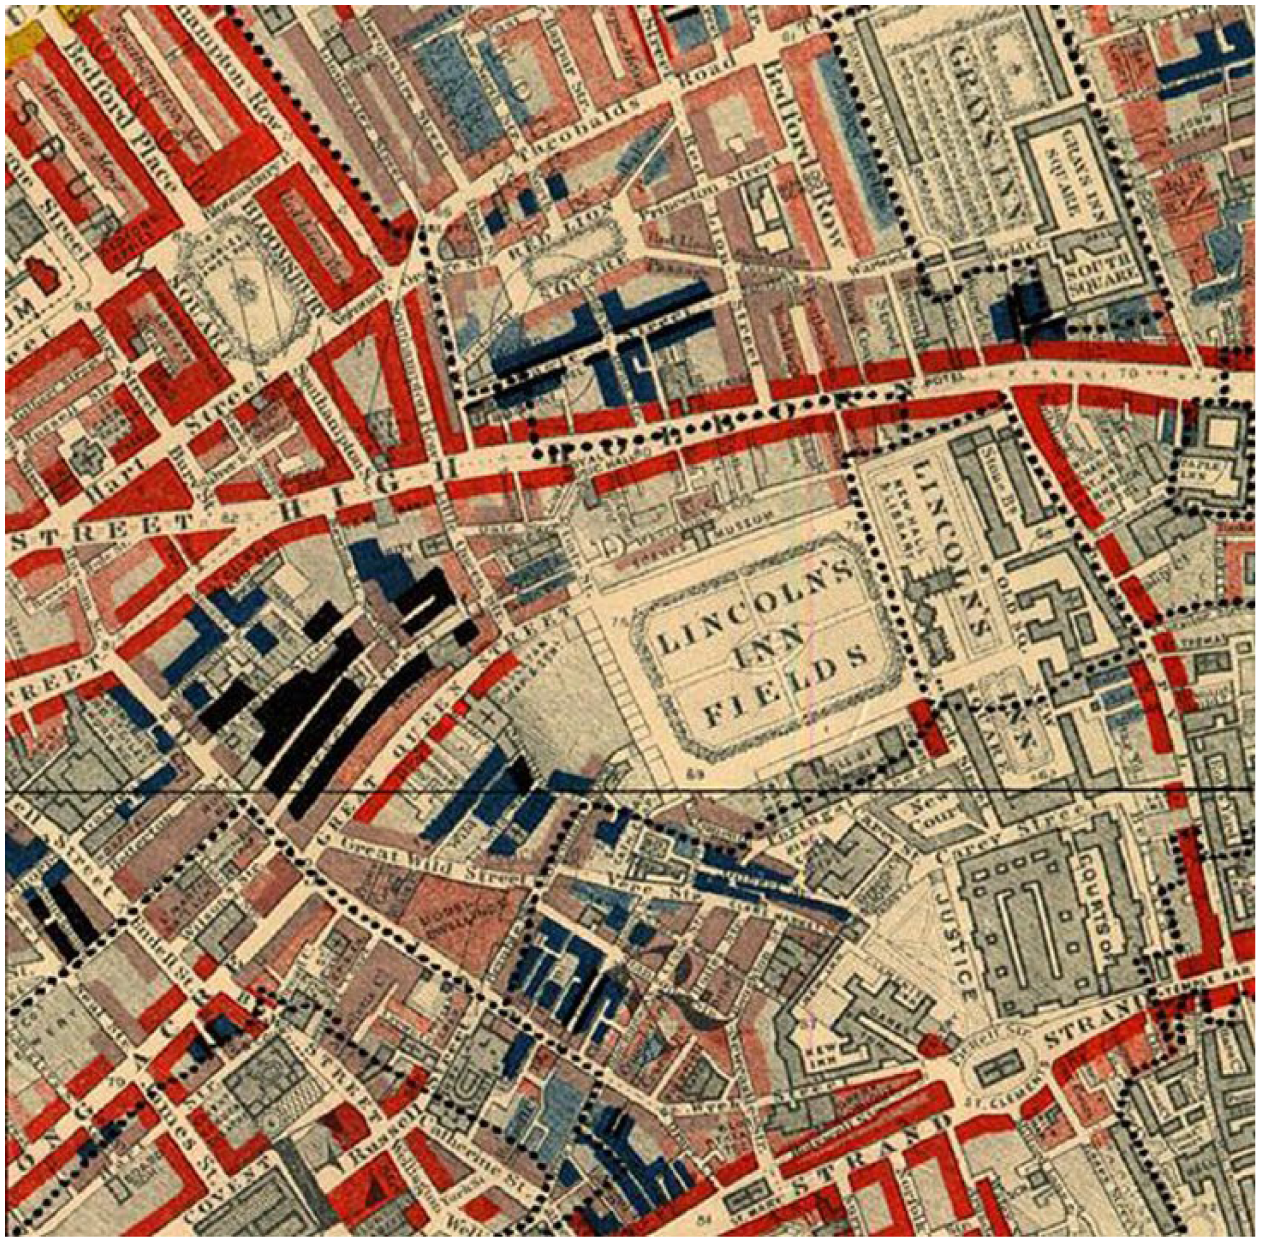
Map from Booth’s Life and Labour of the People of London.
Booth’s Life and Labour would inaugurate a mania for gathering data about urban living conditions, an obsession that intersected with a deep belief that quantifying the existence of poverty would provide reformers with the tools to end it. Historians of science label the wave of empirical projects launched after Booth’s original survey ‘the social survey movement’. Most of this research, carried out in the first three decades of the 20th century in Europe, the United Kingdom, and the United States, was united by at least a few overlapping methodological characteristics, as described by Bulmer et al. (1991). Social surveys
Involved field work and the collection of information first-hand, rather than relying on second-hand information contained in government reports or other already-existing data;
Obtained, or at least attempted to obtain, complete information, rather than either data samples or information gathered in a haphazard way;
Were usually confined to a single city or town (necessary, in part, because of the desire to gather comprehensive information at a granular level);
Used individuals, not aggregates, as the level of analysis;
Were quantitative (involved counting);
Were deeply concerned with the policy outcomes that might be generated by the research and were explicitly normative and reformist in aim.
In essence, to understand the survey, we need to keep in mind that the professional divisions between reform-oriented political movements, empirical social science, muckraking journalism, and state-oriented policy analysis that we take for granted in the early 21st century were far less sharp in the early 20th century. We live in an occupational world that these progressive reformers created, particularly in their drive to organize a class of experts under the banner of professionalism. In the early 1900s, however, these distinctions were far from clear. ‘The survey’, wrote Shelby Harrison of the Russell Sage Foundation in 1930, ‘is not scientific research alone, nor journalism alone, nor social planning alone, nor any one other type of social or civic endeavor; it is a combination of a number of these’ (Harrison, 1930: xxv).
Although largely forgotten, the social surveys pioneered in England by Booth and his followers had a major impact, both on what would later become ‘academic’ sociology as well as on the progressive movement in general. In part, they served as a negative example, within a Whiggish epistemological framework, of the kind of ‘primitive’ social research long since transcended by ‘real’ empirical sociology. But they also influenced a more general public discourse about poverty and statistics. These surveys, in short, launched a methodological movement. They became a fad. And their biggest impact would turn out to be on the religiously based, efficiency-obsessed factions of Progressive-era America – factions that included a particularly interesting, journalism focused social movement known as the MRFM. The MRFM would move the Social Survey Movement in the direction of conducting a particular form of social survey reportage.
From social surveys to social survey reportage
What, then, was the MRFM, and how did it come to concern itself with the kind of empirical study of social problems symbolized by the social survey? And why did it push for a closer relationship with journalistic practice? The church was becoming emasculated – weakened by the Victorian cult of domesticity and the increasing valorization of spiritually limp ‘women’s work’. Such, at least, was the fear expressed by a group of progressive era reformers acting as the advocates of what was quickly termed ‘muscular Christianity’ (Putney, 2003). As a discourse which emerged, in part, out of a period of deep uncertainty about the proper relations between the sexes (McGerr, 2005), proponents of muscular Christianity argued that a particularly masculine version of physical fitness could be linked to an authentically Christian moral health, and thus to the health of American institutions, in general. Despite decades of outreach and missionary work, along with the founding of men and boys’ organizations like the Boy Scouts (in 1910) and the Young Men’s Christian Association (YMCA) (in 1844), church attendance in 1910 was still running female by a ratio of 2:1 (Putney, 2003). For a great many men at the turn of the century, this would not do. ‘One of the marvels of the Christian religion is the beauty of its womanly virtues’, proclaimed Fred B. Smith, the director of the Religious Work Department for the YMCA, ‘but Christianity is also essentially masculine, militant, and warlike, and if these elements are not made manifest, men and boys will not be found in increasing numbers as participants in the life of the church’ (Smith, 1913). Harry Arnold, the secretary of the Maine YMCA, agreed with those sentiments, and in 1910, he went to Smith with a plan to launch a ‘forward crusade’, or massive evangelical effort, to convert recommit men and boys to the Protestant Church.
What became known as the ‘Men and Religion Forward’ movement lasted from 1911 to 1912. According to its own reports, it sponsored more than 7000 meetings involving more than 1.4 million participants. The MRFM was both locally organized and centrally controlled. Meetings took place in more than 70 American cities, but the primary impetus for the forward crusade lay with a small group of full-time religious organizers, including Smith, Charles Stelzle, and Raymond B. Robbins, who would travel the country to ensure that the local planning went off without a hitch. Despite the participation of Stelzle, who was an active columnist for the labor press and who had, in some quarters, gained a reputation as a radical, the MRFM rested on what Gary Scott Smith called a ‘broad evangelical consensus’ and often aroused the hostility of organized labor (Smith, 2000: 338). Yet even with these widely trumpeted meetings and seemingly impressive attendance figures, most historians (and even many contemporary observers) have argued that the MRFM was a dismal failure (Smith, 2000: 345). Increases in church attendance were fleeting, the number of men involved in church work continued to decline, and indeed, the entire ‘social gospel’ philosophy upon which the MRFM rested would become outmoded and forgotten as the Progressive Era drew to an exhausted close in the aftermath of the First World War. What makes the MRFM interesting for journalism scholars, in other words, is certainly not its success; what makes it interesting is the manner in which it can be seen as pushing for the emergence of social survey reportage, itself an early example of quantitative journalism.
The Church and the Press: Social survey reportage and information visualization as public relations
The most interesting volume of the Men and Religion Forward publication series has little analog with anything produced by Booth and the Life and Labor survey. It was entitled Volume 7, The Church and the Press. This volume, which today we might read as a public relations handbook, is probably the most truly innovative aspect of the MRFM: It was by no means unusual for a revival to be well organized … But the Men and Religion Forward Movement had special features that no previous revival had employed. One of these was an explicit effort to use the press as a means of promoting the event. The Committee of 100 in each city was to have a Publicity Committee, whose work was of ‘the utmost importance’, but whose duties were ‘not to be limited to advertising’. Thus, while the Committee was to prepare traditional advertising for such venues as laundry lists, hotel menus, billboards, street-cars, and stationery, it was also to ‘furnish varied and live copy’ (10–11) each week to the local newspapers to insure maximal exposure for the Movement. As the actual event approached, the articles fed to the press were to increase and the Committee was to arrange for daily press coverage during the eight days of the revival. (Bateman, 2001: 59)
The drive to fully integrate press relations into the program of the MRFM most certainly stems from Stelzle, who was relentless in his push for more and better copy about church and labor activities. Indeed, in his autobiography Son of the Bowery, Stelzle relates his first meeting with Ivy Lee, the founder of American public relations, describing it as a life-changing experience. But while we can attribute much of the MRFM’s understanding of church-press relations to Stelzle individually, this new way of thinking about the relationship between the church and journalism must also be understood in relationship to larger cultural changes in American society as a whole. The church, long used to seeing itself as the primary national agent of ‘education and moral uplift’, began in the early 20th century to come to terms with the fact that that role was being usurped by the mass media (Rodgers, 2010). Although careful to frame its thinking in terms of the equivalent power of the church and the press (messages of the MRFM), even to grant the press equal say in the shape of American morals and public opinion was a major retreat by the clergy: A most remarkable developing and readjusting of intellectual attitudes and subtle human forces is proceeding under the inspiration and leadership of the press … the everyday man is aware of new mental attitudes and conscious of new forces shaping his thinking. The press more than any other one force has wrought these atmospheric changes in modern life … The church sees this plainer than ever. (MRFM, 1912: 23, 33)
Given that, the volume concludes, Religious workers must aid in a very practical way in the gathering and presenting to newspapers of materials of positive news value out of the life of the church. No wise newspaperman discounts the value of much that transpires in the religious world. He simply avows his inability to cover the field. He must therefore have efficient help. Not the abstracts of sermons necessarily, but things in the religious world with human interest woven into them; news items that advertise of a community progress and other reading features out of church life … This kind of cooperation is cordially welcomed by newspaper managers, with the understanding that the reporting minister must take his chance with the rest of the staff on his copy meeting the ordinary vicissitudes of the manager’s office. An easy door of efficient publicity service is here opened to the religious worker. (MRFM 1912: 33, emphasis in the original)
The door is opened, in short, to public relations in the service of social reform.
What techniques can best serve the church in their attempts to help newspapermen ‘cover the field’? The Church and the Press helpfully lists several: emphasize and publicize foreign missionary work, which is always spiced with exoticism and danger (MRFM, 1912: 52); make better use of photographs (MRFM, 1912: 53); highlight large and unusual gatherings of important men, such as the ‘dinner of a thousand men’ promoted by the MRFM – dinners which not only include illustrious names but are also attended by potential future journalistic sources (MRFM, 1912: 51, 54). And tremendous emphasis is placed on the ‘power of charts’: Another phase of the Men and Religion Forward Movement that caught the interest and approval of the city editor quickly was the social survey and the summarizing of its findings by means of charts. This is the kind of matter live editors like to go after themselves, and to be scooped by a religious investigator and artists is an experience so unexpected that it is fascinating. Whenever the church comes upon a civic or social festering place and addresses itself promptly and rationally to the eradication of the evil, it can count upon the cooperation of an unshackled press. Its purposes, its performances in that direction make welcome copy, for it is a field in which an unafraid newspaper is operating on its own account generally, and is glad to get help. (MRFM 1912: 51, emphasis added)
And herein lies the hinge between public enlightenment and public relations, one possible answer to why a movement would embrace and emphasize its social service work and its distributed data gathering. In a country newly obsessed with empiricism and facts, where the social survey had become a fad, social surveys made good copy. And not just any data, but data turned into documents in the style of compelling visualizations.
The social survey, after all, was not simply one thing, as Shelby Harrison has already noted. In his description of the illustrious Pittsburgh Survey, touted by the organizer of that survey Paul Kellogg as a model for what a large, well-funded survey ought to look like, Stephen Turner (in Greenwald and Anderson, 1996: 43) argues that the survey commended itself as a method of publicity that emblazons [the needs of the urban worker] upon the public consciousness without the occurrence of a catastrophe [like the Triangle Shirtwaist fire]. The journalistic means of bringing these real needs to human terms was the case study method.
It is not surprising, in short, that a publicity savvy reform movement like the MRFM would embrace data and documentary visualization as a way to reach the press. Ultimately, the MRFM had a dual goal: to map the social world using empirical investigatory techniques and carefully assembled documents and to convey that social assemblage to the public through the press. In both cases, these tasks were happily subordinated to the ultimate goal of social reform. Between empirical science and good publicity, there need be no contradiction.
Extensive data gathering thus occurred during the social service portion of the Men and Religion Forward revival, with volunteers and paid employees questioning local officials and knowledgeable townspeople as to the state of community affairs. Most often, this knowledge was stored in paper form, and when it was not immediately available, Stelzle encouraged groups of volunteers to venture into the community, conduct a house by house survey, and gather these data for themselves. The data entry forms and the model block maps used for collection were thus extremely important tools in the MRFM’s social survey reportage. In the last instance, the gathered information would be displayed graphically as charts and maps, whose striking visuals would go a long way toward securing needed publicity for the movement.
Our best window into what these charts looked like in 1912 comes from a pamphlet, ‘Sociological and Religious Survey of Seventy American Cities’, published by the Bureau of Social Service of the Presbyterian Church in the United States. Given the provenance of this pamphlet, we can be fairly sure it was authored by Stelzle, though his name never appears anywhere in the document. The document makes full use of a wide panoply of information display devices common at the time – primarily bar graphs, line graphs, and pie graphs (Figure 2).
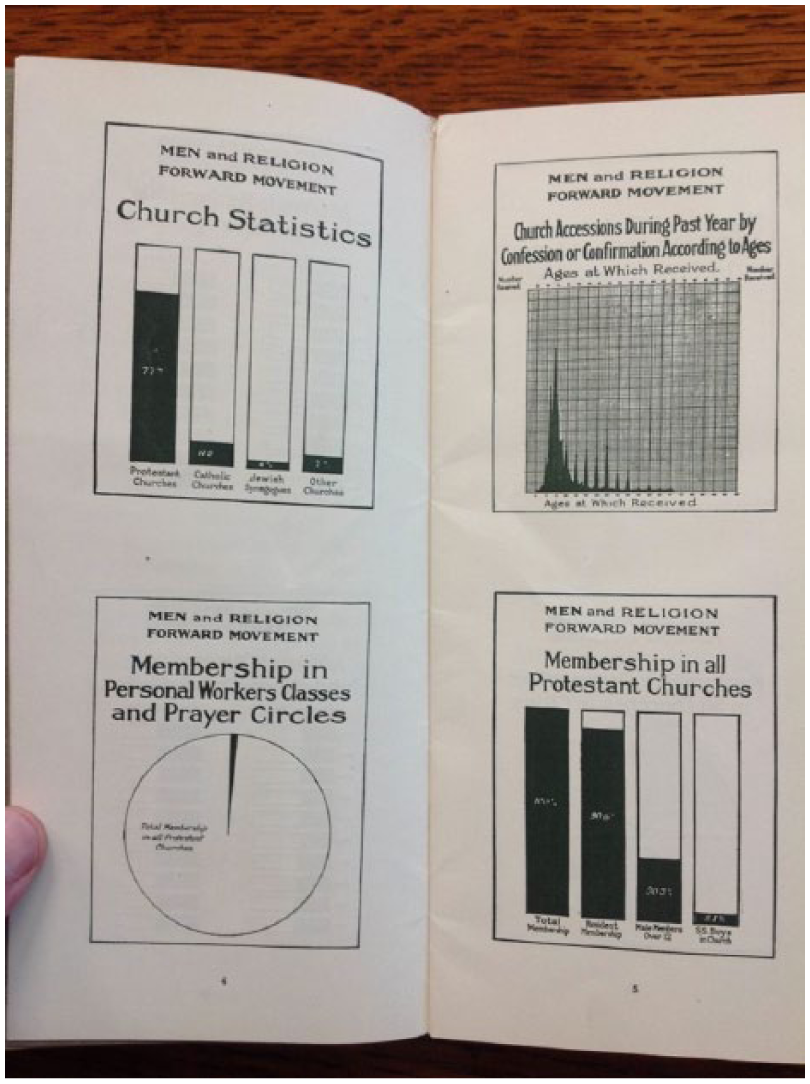
Charts used by the Men and Religion Forward Movement.
Judging from a 21st-century perspective with regard to both the quality and the public value of information displayed, the charts range from interesting to somewhat misleading to entirely unhelpful. In the ‘interesting’ category we might include this example, ‘Nationalities of Parents of Boys Tried in Juvenile Court During the Past Year’, a pie chart showing that ‘Americans’ (by which I suspect we should assume is meant second generation White Anglo-Saxon Protestants) account for 52.3 percent of all trials in juvenile court (Figure 3).

MRFM pie chart ‘Nationalities of Parents of Boys Tried in Juvenile Court During the Past Year’.
When displaying demographic data and the like, these simple pie charts are adequate if not particularly informative. But MRFM information displays seem to have had a harder time when trying to visualize ratios as opposed to percentages, either over time or at a particular moment, as this chart makes clear (Figure 4).
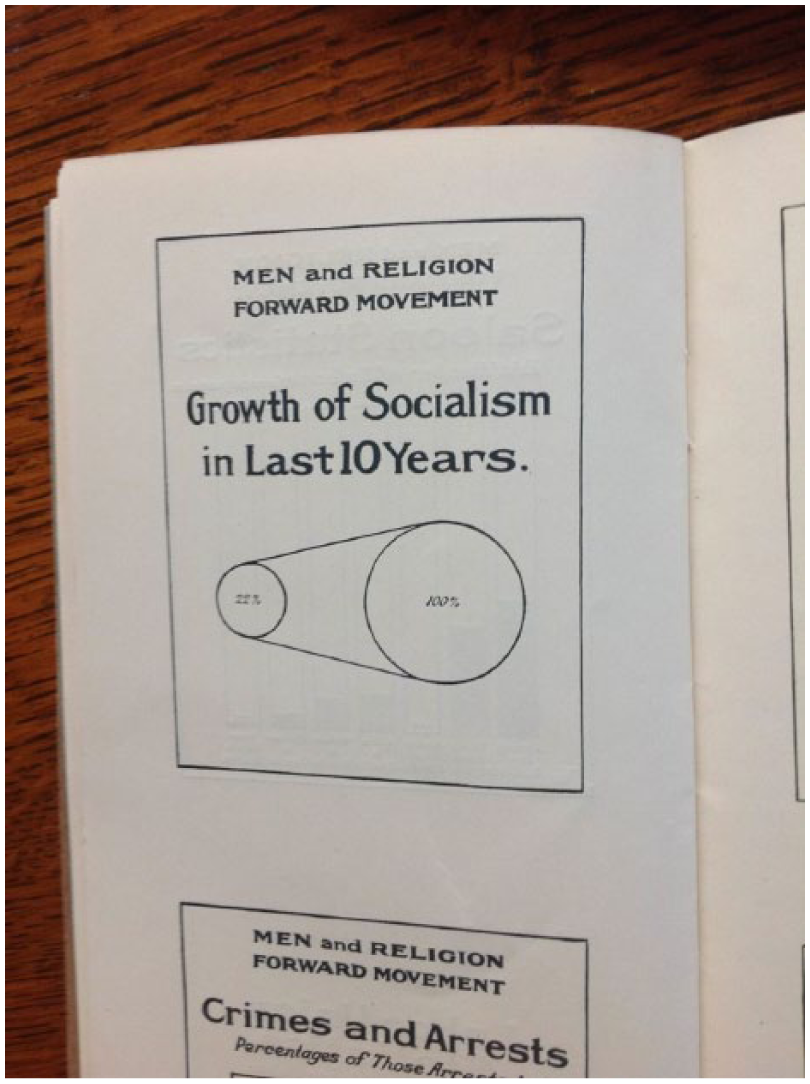
MRFM chart ‘Growth in Socialism’.
A modern reader looking at this chart on socialists might lead one to believe that 100 percent of America is now ‘socialist’. Of course, the first chart means to tell us that for every three saloons, there is a single church, while the second shows that the number of self-described socialists in the United States has increased fivefold in the past decade. A final category of visualization is neither misleading nor interesting but can uncharitably be described as fairly useless, for example, ‘Vital Statistics: Death Per 1000 Children Under One Year of Age’, which appears to show that this number has remained both small and steady for the past decade.
Media coverage of the MRFM
We have shown how important publicity was to members of the MRFM, and the way in which the movement organizers understood that charts and graphs possessed a publicity value as well as a truth value. How, then, did the data generated by the MRFM find its way into the news newspapers of the day, if coverage by those newspapers mattered so much? To answer this question, I went beyond archival work and conducted a qualitative discourse analysis of the newspaper coverage of the MRFM, which involved analyzing 409 articles about the movement contained in the Chronicling America: Historic American Newspapers (http://chroniclingamerica.loc.gov/) project, along with The New York Times coverage of the MRFM during the same time period. Of the 409 articles found which discuss the MRFM, a subset of 132 were further analyzed to tease out larger patterns, themes, and nuances of the news reporting, particularly how the information visualizations and quantitative evidence gathered by the movement were reflected in daily media coverage.
We can draw several conclusions from this discourse analysis. First, the MRFM was widely covered on a local level, although this coverage was highly episodic, scattered, and often consisted of short stories or press releases a few paragraphs long. Nevertheless, the fact that there were over 400 articles about the MRFM printed in less than 2 years would seem to support the later claim of the MRFM that they had collected ‘six scrapbooks’ each ‘three inches thick, filled with Men and Religion Forward clippings’. I found coverage of the MRFM in papers ranging geographically from The New York Times and New York Herald Tribune, to the Washington Herald, the El Paso Herald, and the San Francisco Call. There is no doubt many more articles in papers that have not yet been digitized.
A second finding is that the press was willing to publish MRFM press releases, pamphlets, columns, and other materials verbatim. While there was no way to determine exactly which clippings were directly taken from materials produced by the MRFM publicity committee, it seems likely that the vastly positive coverage (more than 91% of the articles I analyzed were coded positive) was in part related to this wholesale adoption of Men and Religion Forward-produced copy. There were at least several pieces which ran in different papers which were identical (for instance, an Ohio News Herald piece titled ‘Ministers and Laymen United’ is duplicated in at least two papers, right down to the use of a similar picture), meaning they were mostly likely either printed press releases or articles clipped from various newspaper exchanges. A second similar conclusion emerging from the discourse analysis relates to Claussen’s earlier argument that MRFM was the first religious revival to use modern social scientific techniques to research what it wanted to say and how it wanted to help individuals cities, and although it was not the first to use some sort of modern management and marketing techniques, MRFM used them more extensively and more efficiently, and therefore more effectively, than its previous rivals. This means that journalists could easily give the MRFM the benefit of the doubt about what kind of results it would accomplish. Moreover, surely the use of modern theories and methods alone must have impressed journalists. (Claussen, 1998: n.p.)
A third finding concerns the question of how the crude empirical techniques, charts, maps, and other visualizations supplied context to particular forms of news reporting. In general, I concluded that the conduct of the social survey was widely discussed in the daily press, as were the data visualization techniques and products produced by the Movement. There were, however, almost no charts printed in the papers themselves, and the few that were picked up marked the exceptions that prove the rule. The actual results of the survey were discussed, but rarely. In general, the overall coverage was episodic, not thematic. The coverage was almost entirely based on the occurrence of particular events (meetings, presentations, canvass days, etc.), and any sort of numerical visualization almost never accompanied the use of numbers. The context that the MRFM sought to incorporate into discussions of poverty had been shorn away by the time its stories reached the daily press.
Discussions of the social survey occurred in 57 articles about the MRFM or 14 percent of the total. They ranged from casual mentions to more extensive analyses like this one in the 29 July 1911 issue of the Washington Herald: One of the first steps in the social service programme to be taken throughout the ninety cities participating is the ‘survey’. This will be done by local committees, and will supply a mass of information regarding moral, social, and religious life in the great centers of population in North America, which will be put in shape for charts and exhibits. It’s another ‘Know-your-city’ idea, and the promoters of the movement believe that all the facts that may be known in advance will help the cities apply remedies when the dynamic of those eight-day campaigns be felt locally. It is said by the leaders that the survey will be the most complete study of social conditions in American cities yet undertaken, barring only the famous Pittsburgh survey.
A 28 January 1912 article appearing in Washington paper, The Washington Times, provides further discussion of the survey: it defines what the survey is, provides a description of the questions asked (what are amusements of working classes, the housing and labor conditions, the number of telephones, the number of automobiles, and so forth). The article is one of the few to mention that answers will be solicited ‘on blanks provided’. Finally, the article tackles the very purposes of the survey – figures, they argue, ‘have very real value in furnishing data concerning the comparative standard of living’.
Nearly all these discussions of the survey failed to include any charts, however, and the few times Men and Religion Forward charts appeared in the news they largely represented complete failures of data visualization. This article in The New York Sun from 24 March 1912 is typical in its unhelpfulness. The last paragraph attempts to explain the map. Since it is one of the few on-record attempts of a daily newspaper engaging in the translation work necessary to incorporate a statistical graph into a news story, I will quote it at length: Incorporated in this article is a map of the field that has been covered by the Men and Religion Forward Movement up to the present time. The discs indicating the various States when interpreted are: The black space in the discs, according to the census taken by those interested in this movement, indicate the population; the horizontal lines in the discs represent the worshippers in Protestant churches, while the perpendicular lines represent the worshippers in Roman Catholic churches.
We might assume that this article has been entirely provided by the MRFM itself, right down to the map. Far more typical of news coverage of the statistics is a 1 January 1912 article from Washington Times entitled ‘Would Place Blame for Povery and Misery’. ‘Saloons are responsible for much of the poverty and misery of the poor in Washington’, it notes: The committee has prepared charts for exhibition in the eight day campaign. These, according to members of the committee, show a direct connection between the number of saloons and living conditions, and they believe the charts will be a conclusive argument for the regulation of the liquor traffic in the District. Such exhibits, leaders of the movement say, have done much to stir the civic consciousness and lead men to think of means to better their social conditions.
In general, the results of the surveys were rarely discussed at all, and to the degree they were, it was almost always in the context of the survey exhibits I analyzed earlier in the paper. The article quoted above from the Washington Times discusses survey results (i.e. saloons cause poverty), notes that they were contained in chart and map form, and that these charts were on view at the survey exhibition and spends a good amount of time talking about what these charts will do to the ‘public mind’. Nevertheless, the charts themselves are not printed, and the statistical results are never interrogated by the newspaper, they are simply reported (Figure 5).
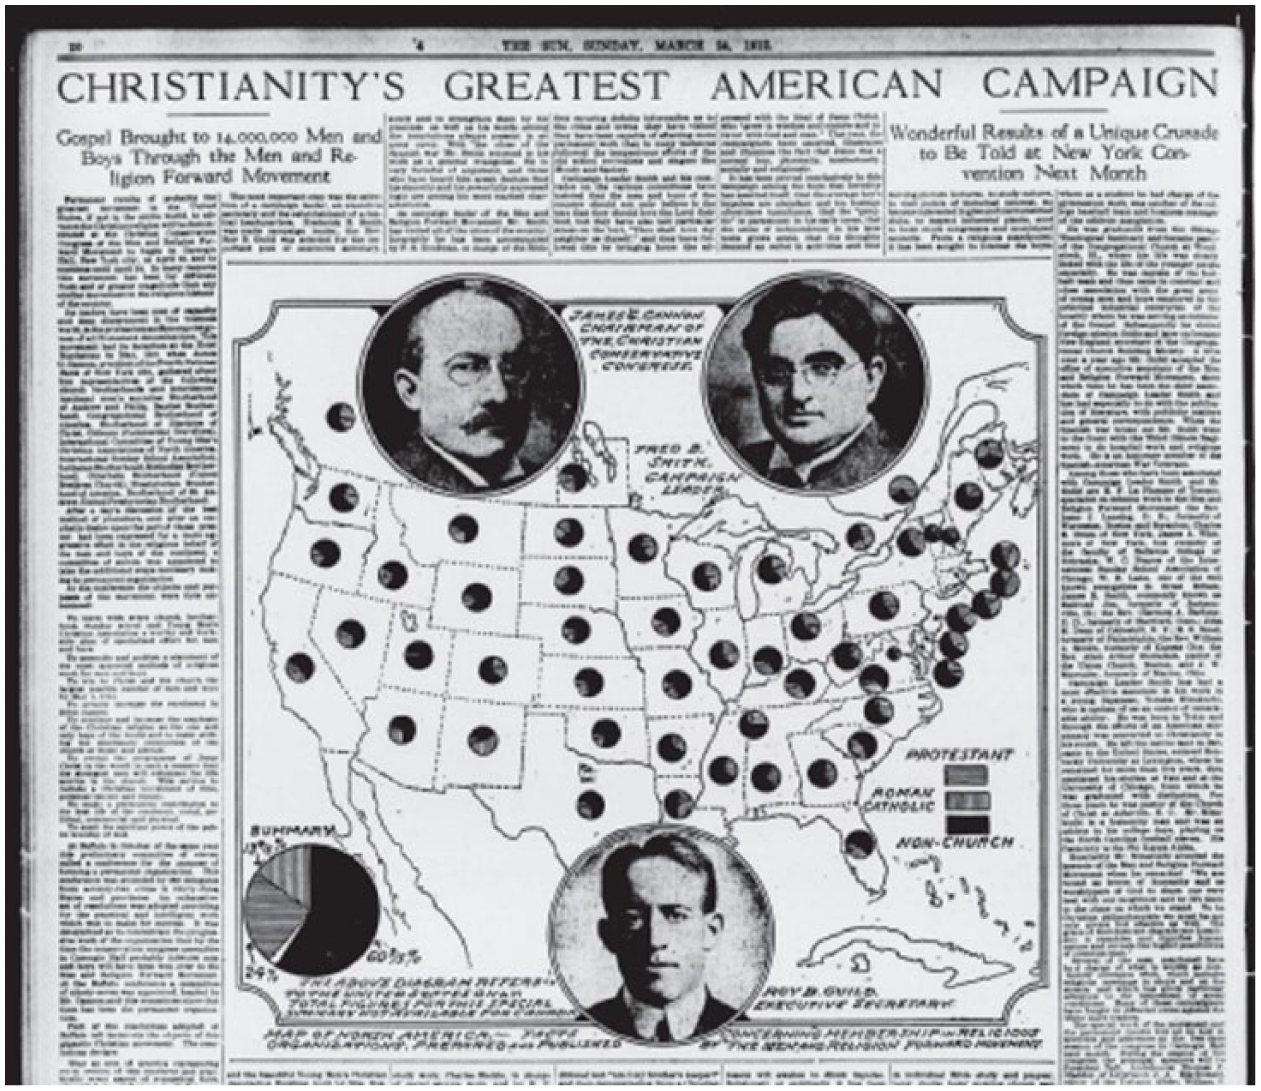
Data visualization in the early 20th century press.
Overall, we should, thus, conclude that the coverage of the MRFM was fairly regular, though scattered, and usually resulted in a few articles in each of the cities they operated in between 1911 and 1912. The coverage was also highly episodic, rarely incorporated contextual information about poverty, and largely tied to the occurrence of particular discrete events such as public presentations, large meetings, canvas days, and so forth. The stories almost never included charts, graphs, maps, or other visual devices, even in articles where there was an extensive discussion of statistics. The papers that printed them, finally, almost never critically analyzed these statistics. In short, the factual objects so carefully and lovingly assembled by the MRFM never truly played the role in mobilizing public opinion that the movement organizers hoped for. The social survey reportage of the MRFM may have caught the attention of reporters, and it may have prompted the occasional, event-oriented piece of newspaper coverage, but the data assemblage constructed by MRFM out of their canvasing, survey blanks, data sheets, charts, and paper placards were never truly adopted or translated by turn of the century daily newspaper journalists. To the degree that they were, they were through the refracting lens of the survey exhibit. It is to a discussion of these exhibitions and their role that I now turn.
From newspapers to exhibits to newspapers again
Perhaps the most interesting finding of this study is that the most important data visualization format of the early 20th century was actually not a publication at all; rather, it was an event, known as an exhibition. ‘While the convention center of the congress will be held in Carnegie Hall’, the El Paso Herald reported on 19 April 1912, there are four auxiliary centers in four of the most prominent churches in New York in which many of the meetings will be held. There will be a series of special exhibits including moving pictures lantern slides and charts illustrating the conditions revealed by the great social survey which has been made in nearly 190 American cities during the past year (emphasis in original). These exhibits show in an indisputable manner evils and abuses of many kinds which religion of a practical kind could largely overcome.
The importance of the social exhibit to the larger social reform movement exemplified by the MRFM is brought home by the fact that a branch of the powerful Russell Sage Foundation geared toward facilitating social survey work was known as the Department of Surveys and Exhibits. In 1918, the Department published a 320-page volume, The ABC of Exhibit Planning, 3 years after printing an earlier pamphlet that discussed the Springfield survey and exhibition as a model to be replicated by other towns doing social survey work. Included in these lengthy, visually nuanced publications (not only is their use of graphics far ahead of many other publications of the time but they also possess a sharp aesthetic sense which would not be out of place in a modern advertising agency) are discussions of the different types of materials that might be included in an exhibit, along with some considerations of the advantages exhibits possessed over other forms of publicity like pamphlets or news articles. While we cannot say for certain that the Men and Religion Forward exhibits resembled any of the models discussed here, it seems likely that they were at least a part of these larger discourses on the public display of visual information. ‘Reportage’, in this example, does not mean physical publishing at all. Rather, it refers to the public display of visual information for the benefit of the public.
One interesting aspect of the Russell Sage discussion of exhibits and proper visual materials is the degree to which they actually downplay the use of pie charts and line graphs, encouraging exhibitors to utilize material which seems far closer to advertising. ‘Statistical charts, spot maps, and other more or less technical forms that are sometimes referred to as “graphic material” are of interest and value to special and limited audiences’, the author of the ABC of Exhibit Planning writes, The showing of percentages by use of colored circles or bars and of comparative statistics by graphs or hills is a favorite device. Diagrams are not equally attractive media of communication to all. To some they represent a disagreeable form of mental effort; one way of making them appear less technical and indeed less dull to such visitors is to invent variations in which the circles or bars or hills have been replaced by successions of concrete items, such as pictures of dollar signs, pictures of human figures, animals, or other appropriate objects. (Routzahn and Routzahn, 1918: 63)
An illustration in the book comparing a simple pie chart with the use of a more arresting ‘dollar coin’ image gives us an idea of the kind if illustrations being advocated by the Russell Sage Foundation (Figure 6).
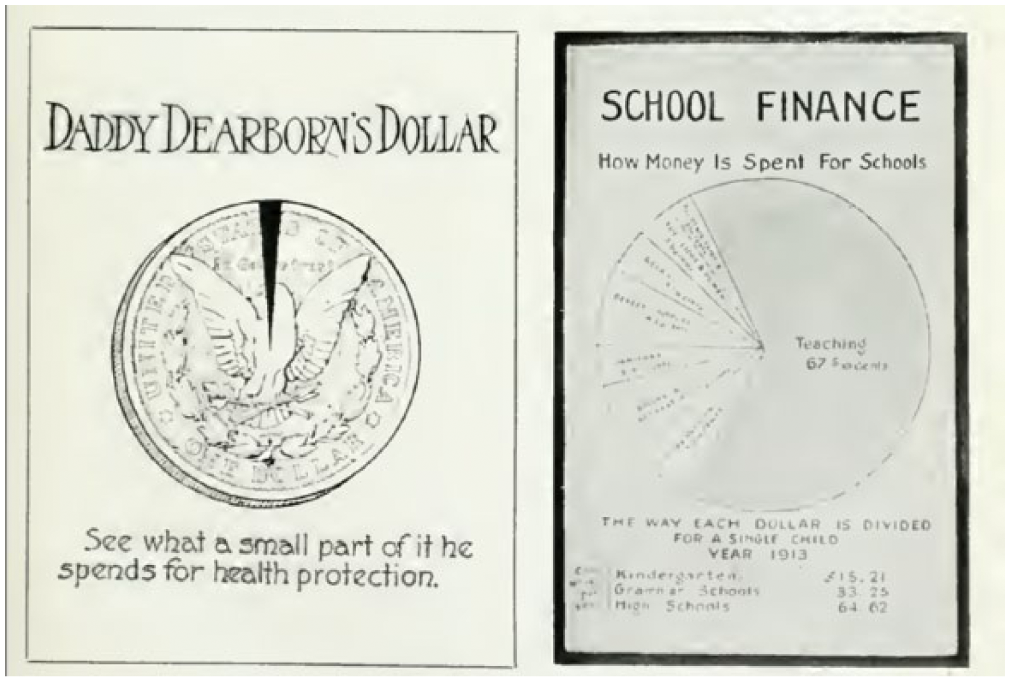
Graphic chart versus statistical graph.
Among the non-chart objects included in the Springfield survey exhibit are three-dimensional models, posters, live ‘morality plays’ (titles include ‘The Imps and the Children’ and ‘When the Gang Broke Up’), a playground, and a motion picture hall. Nevertheless, it seems clear that charts and maps made up a large part of the printed matter used in many social exhibits, which perhaps was why the author of The ABC of Exhibit Planning was too quick to downplay their utility: ‘Even though they are much used in exhibits intended for popular audiences diagrams are more likely to be technical than popular in form’ (Routzahn and Routzahn, 1918: 63). Some photographs of the model exhibit in Springfield show the fairly extensive use of both charts and maps, including one that demonstrates poor sewer conditions on the outskirts of town.
No matter the exact nature of the visual material being used, why bother mounting an exhibit at all? What advantages does the publicity generated through exhibits have over the publicity garnered from newspaper articles and advertisement – which, as we have already seen, formed a large part of the arsenal of the MRFM, and men like Charles Stelzle? The ABC of Exhibit Planning points out several facts: (1) exhibits can attract the attention of people who might not read a newspaper; (2) it is a quick method of information conveyance, and appeals to those people who might only skim the news; (3) an exhibit gains value by the fact that it is presented to multiple people simultaneously: ‘you have created a sort of group attraction, each visitor feeling the interest of his neighbor and being stimulated to an exchange of talk about the things illustrated’ (Routzahn and Routzahn, 1918: 18); (4) exhibitors and social surveyors can do more than vaguely estimate the number of people who are consuming their material, as they are forced to do with newspaper articles; (5) it creates public conversation; (6) exhibitors can answer visitor questions in person; and (7) ‘By means of this new method of telling your story, through pictures, models, objects and other devices, a new life and new force are given to your propaganda’ (Routzahn and Routzahn, 1918: 19).
Exhibits, moreover, nicely complement the tendency of newspapers to focus on single happenings rather than the context in which the MRFM’s statistics about poverty were embedded. By displaying their graphical diagrams as part of an event, the MRFM could tap into newspapers’ natural tendency to engage in episodic event framing about the MRFM. As noted earlier, most newspaper coverage of the MRFM was of meetings, presentations, canvas days, and so on. When these exhibition events featured the statistical representation of poverty information, they could gain a second life in the newspaper press, both through their spectacular nature and through their existence as a ‘one-time’ phenomenon. While newspapers would often not cover the statistics that the MRFM gathered, they would cover an exhibition in which these statistics were presented.
Conclusion
To conclude, what does this trip back in time teach us about the boundaries that went into delimiting aspects of quantitative news reporting in the early 20th century? And what can we learn about the hybrid nature of quantitative journalism in our own time?
First, it should be clear that the excitement around quantitative data – or even the so-called ‘big data’ – is nothing new. More than simply proving the historicity of the big data concept, however, this study of social survey reportage demonstrates that the notion of ‘data’ carried within it a powerful symbolic value by the early 20th century. Data acted as what scholars of science and technology have called a boundary object, in this case a symbolic and material object that mediated between quantitative proof giving and rhetorical persuasion.
Second, both technological affordances and production routines led the early 20th century news organizations to deemphasize the use of data in their news stories. I came across few graphical displays of the statistics and chats so painstakingly generated by the MRFM in the pages of newspapers. In part, this is because few newspapers had the technology to produce or reproduce these statistics in their pages, and even those that did largely lacked the ability to generate these charts when they worked within the rhythm of the daily newspaper production schedule. How do we square this finding that data rarely appeared in newspapers with the argument that quantitative information possessed tremendous publicity value? In part, it was through the analysis of the exhibits and exhibitions discussed above. There were other visual options available to those who wanted to use the visual display of quantitative information for education and reform purposes, options more aligned with the social routines and news production schedules of the time. And stories about these exhibits were also far more likely to run in newspapers than the data sets or the data visualizations themselves.
Third, the nearly exclusive focus of the early 20th century journalism on individuals, interviews, institutions, and events led newspapers to deemphasize the use of ‘data as context’ in their news stories; the lack of data in the news clips we analyzed was as much about journalistic culture as it was about technological capabilities. Interpretive journalism, first discussed in the 1930s, was still several decades away. Newspapers, as Barnhurst and Mutz (1997) have demonstrated, were firmly in the breaking news business in the early 20th century, concerned with reporting on individual events as quickly as possible. The news was there to inform not to explain. Ultimately, this journalistic focus on reporting what happened – without context or larger explanatory theory – would also help fortify the emerging boundary wall between professional journalism and professional social science that solidified in the 1930s, even as that event-oriented focus was first challenged by an emerging form of ‘interpretive journalism’.
Fourth and finally, it is important to keep in mind that all these events occurred prior to the political and intellectual catastrophe that was the First World War. As Schudson (1978) has argued, the emergence of objectivity (as both journalism and social science envision it today) can only be fully understood in the context of the crisis of empirical faith that followed the First World War. The role of public relations in selling that war would foster a growing journalistic hostility toward the public relations profession. At the same time, sociology would drive out the social reformers who were the key to establishing it as an academic discipline in the first place. The easy link between quantitative measurement and reform would prove to be impossible to maintain in the post-war era. Future cultural and ideological debates about the relationship between social science, journalism, quantitative information, and objectivity would, henceforth, take place on radically different terrain. And it is on this new terrain that the uneasily hybrid profession of data journalism continues to sit to this day.
Footnotes
Funding
The author(s) received no financial support for the research, authorship, and/or publication of this article.