



Abstract
In recent years, many of the Commonwealth countries have experienced a reduction in income inequalities due to the development of financial markets and intermediaries. At the same time, widespread corruption among public officials, civil servants, or politicians from these countries have been well documented. A key public policy question is whether the return to financial sector development at the level of massive corruption, exacerbate income inequality, offsetting the benefits of financial development. Using a panel data of 30 Commonwealth countries over the period of 1995–2008, it is found that the high rates of corruption in the Commonwealth countries are crowding out the return to financial development. The return to financial development on income inequality, at the level of higher corruption, are positive for all countries and significantly larger for the low- and middle-income countries compared to high-income countries, which suggest that the complementary nature of policies that simultaneously reduce corruption and promote financial development have a greater impact in reducing income inequality than implementing these policies separately.
Introduction
There is an increasing recognition in the public domain that corruption and other aspects of poor governance have substantial adverse effects on the distribution of income. Corruption has direct and indirect consequences on economic and governance factors, which in turn exacerbate inequality. Much of the literature on corruption and inequality is recent – from the mid-1990s – when major international donor institutions began to focus attention on corruption issues and researchers initiated cross-country measurements of the corruption phenomenon.
While the research over the impact of corruption on inequality has continued, another major issue has emerged on the international development agenda. This is the finance–inequality relationship (Claessens and Perotti, 2007). Although, a large literature suggests that financial development leads to faster average growth (Levine, 2005), researchers have not yet determined whether financial development benefits the entire population equally or whether it disproportionately benefits a certain section of the population. If financial development increases income inequality, this income distribution effect will mitigate or even negate the beneficial effects of financial development on the poor (Ang, 2010; Beck et al., 2007).
The Commonwealth countries 1 span Africa, Asia, the Americas, Europe and the Pacific and are diverse – they are amongst the world’s largest, smallest, richest and poorest countries. Corruption and income inequality pose significant risks in the growth process for a number of Commonwealth countries. A total of 53 Commonwealth countries with 1.8 billion people bear a disproportionate burden of global poverty and income inequality. The Commonwealth is home to one-third of the world’s population, but two-thirds of global HIV/AIDS cases, two-thirds of maternal deaths, two-thirds of children under five suffering from malnutrition, and nearly half the infant deaths in the world. Income inequality is increasing in many low- and middle-income Commonwealth countries and this indicates that gains from economic growth are not necessarily reflected in better health and improved life chances for the poorest. Poverty remains the single greatest killer in the Commonwealth, with differential life chances between rich and poor starkly reflected in maternal mortality statistics.
A total of 19 Commonwealth countries are ranked in the bottom half of Transparency International’s 2007 Corruption Perceptions Index (CPI). Bangladesh, Kenya and Nigeria occupy positions in the bottom 30 of the index. For instance, it is estimated that corruption has cost Nigeria over US$ 400 billion, which is equivalent to approximately two-thirds of the total amount of aid given to Africa since the 1960s (Khemani, 2008). Aware of its crippling effects, Commonwealth Heads of Government continuously emphasize their commitment to tackling corruption. As a part of this process, a number of anti-corruption projects have been initiated in several Commonwealth countries.
In recent years, many fastest-growing economies, such as, Malaysia, India, South Africa, Guyana, Bangladesh, Kenya, Ghana, Zambia, Nigeria and Tanzania have seen expansion of supply of financial services which can be accessed by the poor, thereby, increasing income growth for the poor, and reducing income inequality. Also, at the same time, corruption among public officials, civil servants or politicians of these countries deterring the benefits of financial sector development. We focus our study to Commonwealth countries as many middle- and low-income Commonwealth countries are fastest-growing economies with the improvements in the formal financial sector. The availability of more financial services benefits the poor as they can borrow to invest in human and physical capital.
These transition economies are bank dominated, which mostly lend to government, non-bank financial institutions, or short-term working capital to enterprises. However, capital markets are not sufficiently large and institutional investors or intermediaries such as pension funds or insurance companies that mobilize the savings of individuals and hold capital market instruments are just getting started. Access to international capital markets facilitates the flow of portfolio investments in those countries.
The mobilization of savings is perhaps the most important function of the financial sector development. It enables the poor to transform their savings into productivity-enhancing assets, thus increasing capital accumulation and stimulating investment. Access to credit can reduce the vulnerability of the poor to any income shocks in the absence of savings or insurance. Therefore, access to credit and availability of information is likely to decrease the proportion of low-risk, low-return assets held by poor households, and enable them to invest in potentially higher risk but higher return long-term income enhancing assets (Deaton, 1992).
These facilities reduce the vulnerability, and minimize the negative impact of shocks on long-run income prospects of the poor, thereby, reducing income inequality. As a result, few Commonwealth countries, such as, Malaysia, India and South Africa, which were plagued with institutional backwardness and macroeconomic instability, have crossed the divide to emerging markets economies.
Previous research suggests that both corruption and financial development are separately important determinants of income inequality. However, there has been no attempt in the literature to study whether the return to financial development on income inequality change at the level of higher corruption. This article seeks to address this gap in the literature. The following questions are examined: Do the policies to control corruption and boost financial development serve as complements in reducing inequality? How the return to financial development on income inequality, at the level of higher corruption, vary across low-, middle-, and high-income countries?
The convergence of widespread corruption among public officials and the financial architecture development among the middle- and low-income countries raise fundamental question about how financial development interacts with corruption in influencing income inequality. Corruption is seen as aggravating conditions of inequality in countries which are now experiencing higher economic growth through financial sector development. This study contributes to the literature by trying to bring these two strands together. In particular, it analyzes the distributional impact of corruption and financial development on income inequality using a cross section of 30 Commonwealth countries over the 1995–2008 period.
Literature review
The first section discusses the previous literature on corruption and income inequality, and the second section reviews the past literature about financial development and income inequality.
Corruption—Income inequality nexus
Corruption is the abuse of entrusted power for private gain. It is generally understood as the abuse of government office to extract rent in the provision of public services. It is one of the leading obstacles to political, economic and social development. It undermines the rule of law and weakens the institutional bases of good governance upon which continued growth and development depends. It is the poor in society that are often the hardest hit by the effects of corruption, being the most reliant on public services and the least capable of paying the high price associated with fraud, bribery and other forms of corrupt activity, to attain those services.
The theoretical foundations for the corruption–inequality relationship are derived from the rent theory and draw on the ideas of Rose-Ackerman (1978), Krueger (1974) and Klitgaard (1988), among others. The propositions include:
Corruption may distort the government’s role in resource allocation. The benefits from corruption are likely to accrue more to the better-connected individuals in society, who belong mostly to the high-income groups (Tanzi, 1995). The impact of corruption on income distribution is in part a function of government involvement in allocating and financing scarce goods and services (Gupta et al., 2002). As inequality increases, the rich will also have greater resources that can be used to buy influence, both legally and illegally (Glaeser et al., 2003).
The ‘economic model’ of corruption inequality postulates that corruption impedes economic growth, which, in turn, affects poverty levels. Few channels through which corruption slows down economic growth and aggravates income inequality are discussed in the following.
High corruption can lead to lower economic growth: If corruption increases income inequality, it will slow down the rate of poverty reduction by reducing growth (Alesina and Rodrik, 1994; Ravallion, 1997).
High concentration of asset ownership can influence public policy and increase income inequality: Inequality in ownership of assets will limit the ability of the poor to borrow or invest and will accentuate poverty and income inequality (Birdsall and Londoño, 1997; Li et al., 1998).
Corruption decreases revenue from taxes and fees: Corruption can lead to tax evasion, poor tax administration, disproportionately favour the wealthy population groups and reduce the progressivity of the tax system, resulting in increased income inequality.
Gupta et al. (2002) estimate the models of income inequality and poverty using OLS and instrumental variables (IV) techniques on a cross-section of countries over the 1980–97 period. They find that higher corruption is associated with higher income inequality such that a worsening of a country’s corruption index by one standard deviation (2.52 points on a scale of 0 to 10) corresponds to an increase in the Gini coefficient (worsening inequality) by about 11 points, given the average Gini coefficient value of 39. 2 You and Khagram (2005) find the evidence of reverse causality that income inequality increases the level of corruption through material and normative mechanisms. Gyimah-Brempong (2002) finds that increased corruption is positively correlated with income inequality in African countries. The combined effects of decreased income growth and increased inequality suggest that corruption hurts the poor more than the rich.
In summary, the literature establishes the fact that corruption hinders economic growth and augments income inequalities. The evidence from diagnostic surveys of corruption in several countries suggests that corruption aggravates income inequality because lower income households pay a higher proportion of their income in bribes.
Financial development—Income inequality nexus
Levine (2005: 869), define financial development as:
The costs of acquiring information, enforcing contracts, and making transactions create incentives for the emergence of particular types of financial contracts, markets and intermediaries. Different types and combinations of information, enforcement, and transaction costs in conjunction with different legal, regulatory, and tax systems have motivated distinct financial contracts, markets, and intermediaries across countries and throughout history.
Theory provides conflicting predictions about the impact of financial development on the distribution of income and the incomes of the poor. Some models show that financial development enhances growth and reduces inequality. Financial development may affect the poor through two channels: aggregate growth and changes in the distribution of income (Beck et al., 2007). They find that financial development disproportionately boosts incomes of the poorest quintile and reduces income inequality. About 40 percent of the long-run impact of financial development on the income growth of the poorest quintile is the result of reductions in income inequality, while 60 percent is due to the impact of financial development on aggregate economic growth.
Other models illustrate financial imperfections, such as, information asymmetries and transactions costs, may be especially binding on the poor who lack collateral and credit histories. Thus, strict enforcement of these credit constraints will disproportionately affect the poor. Furthermore, these credit constraints reduce the efficiency of capital allocation and intensify income inequality by impeding the flow of capital to poor individuals (Galor and Moav, 2004). From this perspective, financial development helps the poor both by improving the efficiency of capital allocation and by relaxing credit constraints that more extensively restrain the poor, which, in turn, reduces income inequality.
The theoretical predictions of the effects of financial sector development on income inequality are not unanimous. In the seminal study on the distribution of income, Kuznets (1955) conjectures that there may be an inverted u-shaped relationship between income inequality and economic development. As people move from the low-income agricultural sector to the high-income industrial sector, income inequality initially increases. However, as the agricultural sector shrinks and agricultural wages increase, this trend reverses and income inequality decreases. In addition, the sectoral structure is important for the relation between economic development and income inequality suggests that financial development may reduce inequality to a lesser extent in countries with larger modern sectors (i.e., smaller agricultural sectors).
Building on the Kuznets’ hypothesis, Greenwood and Jovanovic (1990) predict a nonlinear relationship between financial development and income inequality, where it is hypothesized that income inequality first increases with the degree of sophistication in the financial systems, then stabilizes and eventually declines—as more people join financial coalitions (the inverted-U shaped hypothesis).
Bhattacharya (2011) using a numerical simulation finds conflicting evidence on the inverted-U hypothesis relating to income distribution in the context of development of an economy with an informal sector and migration of both low and high skilled workers from the rural to the urban area. He asserts that the Gini coefficient always initially rises and then declines. However, once it starts declining, it need not continuously decline; it may rise, then decline, then rise again and indeed rise above the previous peak before starting to decline again and may well end at the end of the simulation at a higher value than at the start. He argues that the movement of Gini coefficient over time depends crucially on the evolution of the gap between the formal and the informal sector wage.
Contrary to Greenwood and Jovanovic (1990), Banerjee and Newman (1993) and Galor and Zeira (1993) suggest that long-run convergence in the income levels of rich and poor will not necessarily happen in economies with capital market imperfections and indivisibilities in investment in human or physical capital. Taking the financial market frictions as given, these models suggest that public policies that redistribute income from the rich to the poor will alleviate the adverse growth effects of income inequality and therefore boost aggregate growth. Consequently, they predict a negative and linear relationship between financial development and income inequality (the linear hypothesis). 3
Given that theories provide ambiguous predictions regarding the effects of financial development on the distribution of income, it is useful to approach the issue at the empirical level. Using data for 91 countries over the period 1960–95, Clarke et al. (2003) examine the effect of financial development on the level of Gini coefficient. They find that financial intermediary development is associated with lower income inequality. Moreover, consistent with the insight of Kuznets, the relation between the Gini coefficient and financial intermediary development appears to depend upon the sectoral structure of the economy: a larger modern sector is associated with a smaller drop in the Gini coefficient for the same level of financial intermediary development. They find evidence against the inverted-U shape hypothesis—the coefficient on the squared term for the financial intermediary indicators is never statistically significant and, in fact, often has the wrong sign.
Data
The data are collected from a number of different sources. The dependent variable, income inequality, measured by the Gini coefficient, is drawn from the World Development Poverty Indicator, World Bank. Our first key independent variable, corruption is inherently a secretive transaction, and thus difficult to observe and measure. Several organizations, including the World Bank, Transparency International and Pricewaterhouse Coopers Foundations, have attempted to develop corruption indicators; all of which depend on aggregate surveys of citizens, businesses or experts and therefore, based on the perceptions of the corruption as opposed to more objective data. While these measurement approaches have acknowledged reliability and validity problems, they are the best available data (Management Systems International, 2002). Following Gupta et al. (2002) and Gyimah-Brempong (2002), Transparency International’s CPI 4 is used as the measure for corruption. It ranges from zero (most corrupt) to nine (least corrupt).
Two different indicators are used for financial development. Each indicator captures a different aspect of the financial development process. The first indicator is the inverse of the broad-money income velocity, that is, the ratio of M2 to nominal gross domestic product (GDP) and is also known as the monetization ratio. King and Levine (1993) use this monetization ratio to represent the depth (size) of the financial market relative to the overall economy. Increases in monetization ratio indicate further expansion in the financial sector relative to the rest of the economy.
The second indicator of financial development is credit issued by financial institutions to the non-financial private sector as a share of GDP. It reflects the extent to which financial services are provided to the private sector. Denizer et al. (2002) argue that availability of credit to the private sector helps to explain the volatility of consumption and GDP. 5
As in other studies of inequality (e.g., Bourguignon and Morrison, 1998; Gupta et al., 2002; Lundberg and Squire, 2003; Reuveny and Li, 2003; Easterly et al., 2006; and Dobson and Ramlogan-Dobson, 2010) the model also includes the following control variables: GDP growth (annual percentage), primary completion rate (percentage of relevant age group), market capitalization of listed companies (percentage of GDP), real interest rate (percent), openness (percentage in constant prices). Data for these variables are taken from a number of sources—the Worldwide Development Indicators (WDI), World Bank; International Financial Statistics (IFS), International Monetary Fund (IMF); World Bank and OECD national accounts data files; UNESCO Institute for Statistics; Transparency International (TI); Standard & Poor’s, Global Stock Markets Factbook; Penn World Tables, Version 7.0. 6
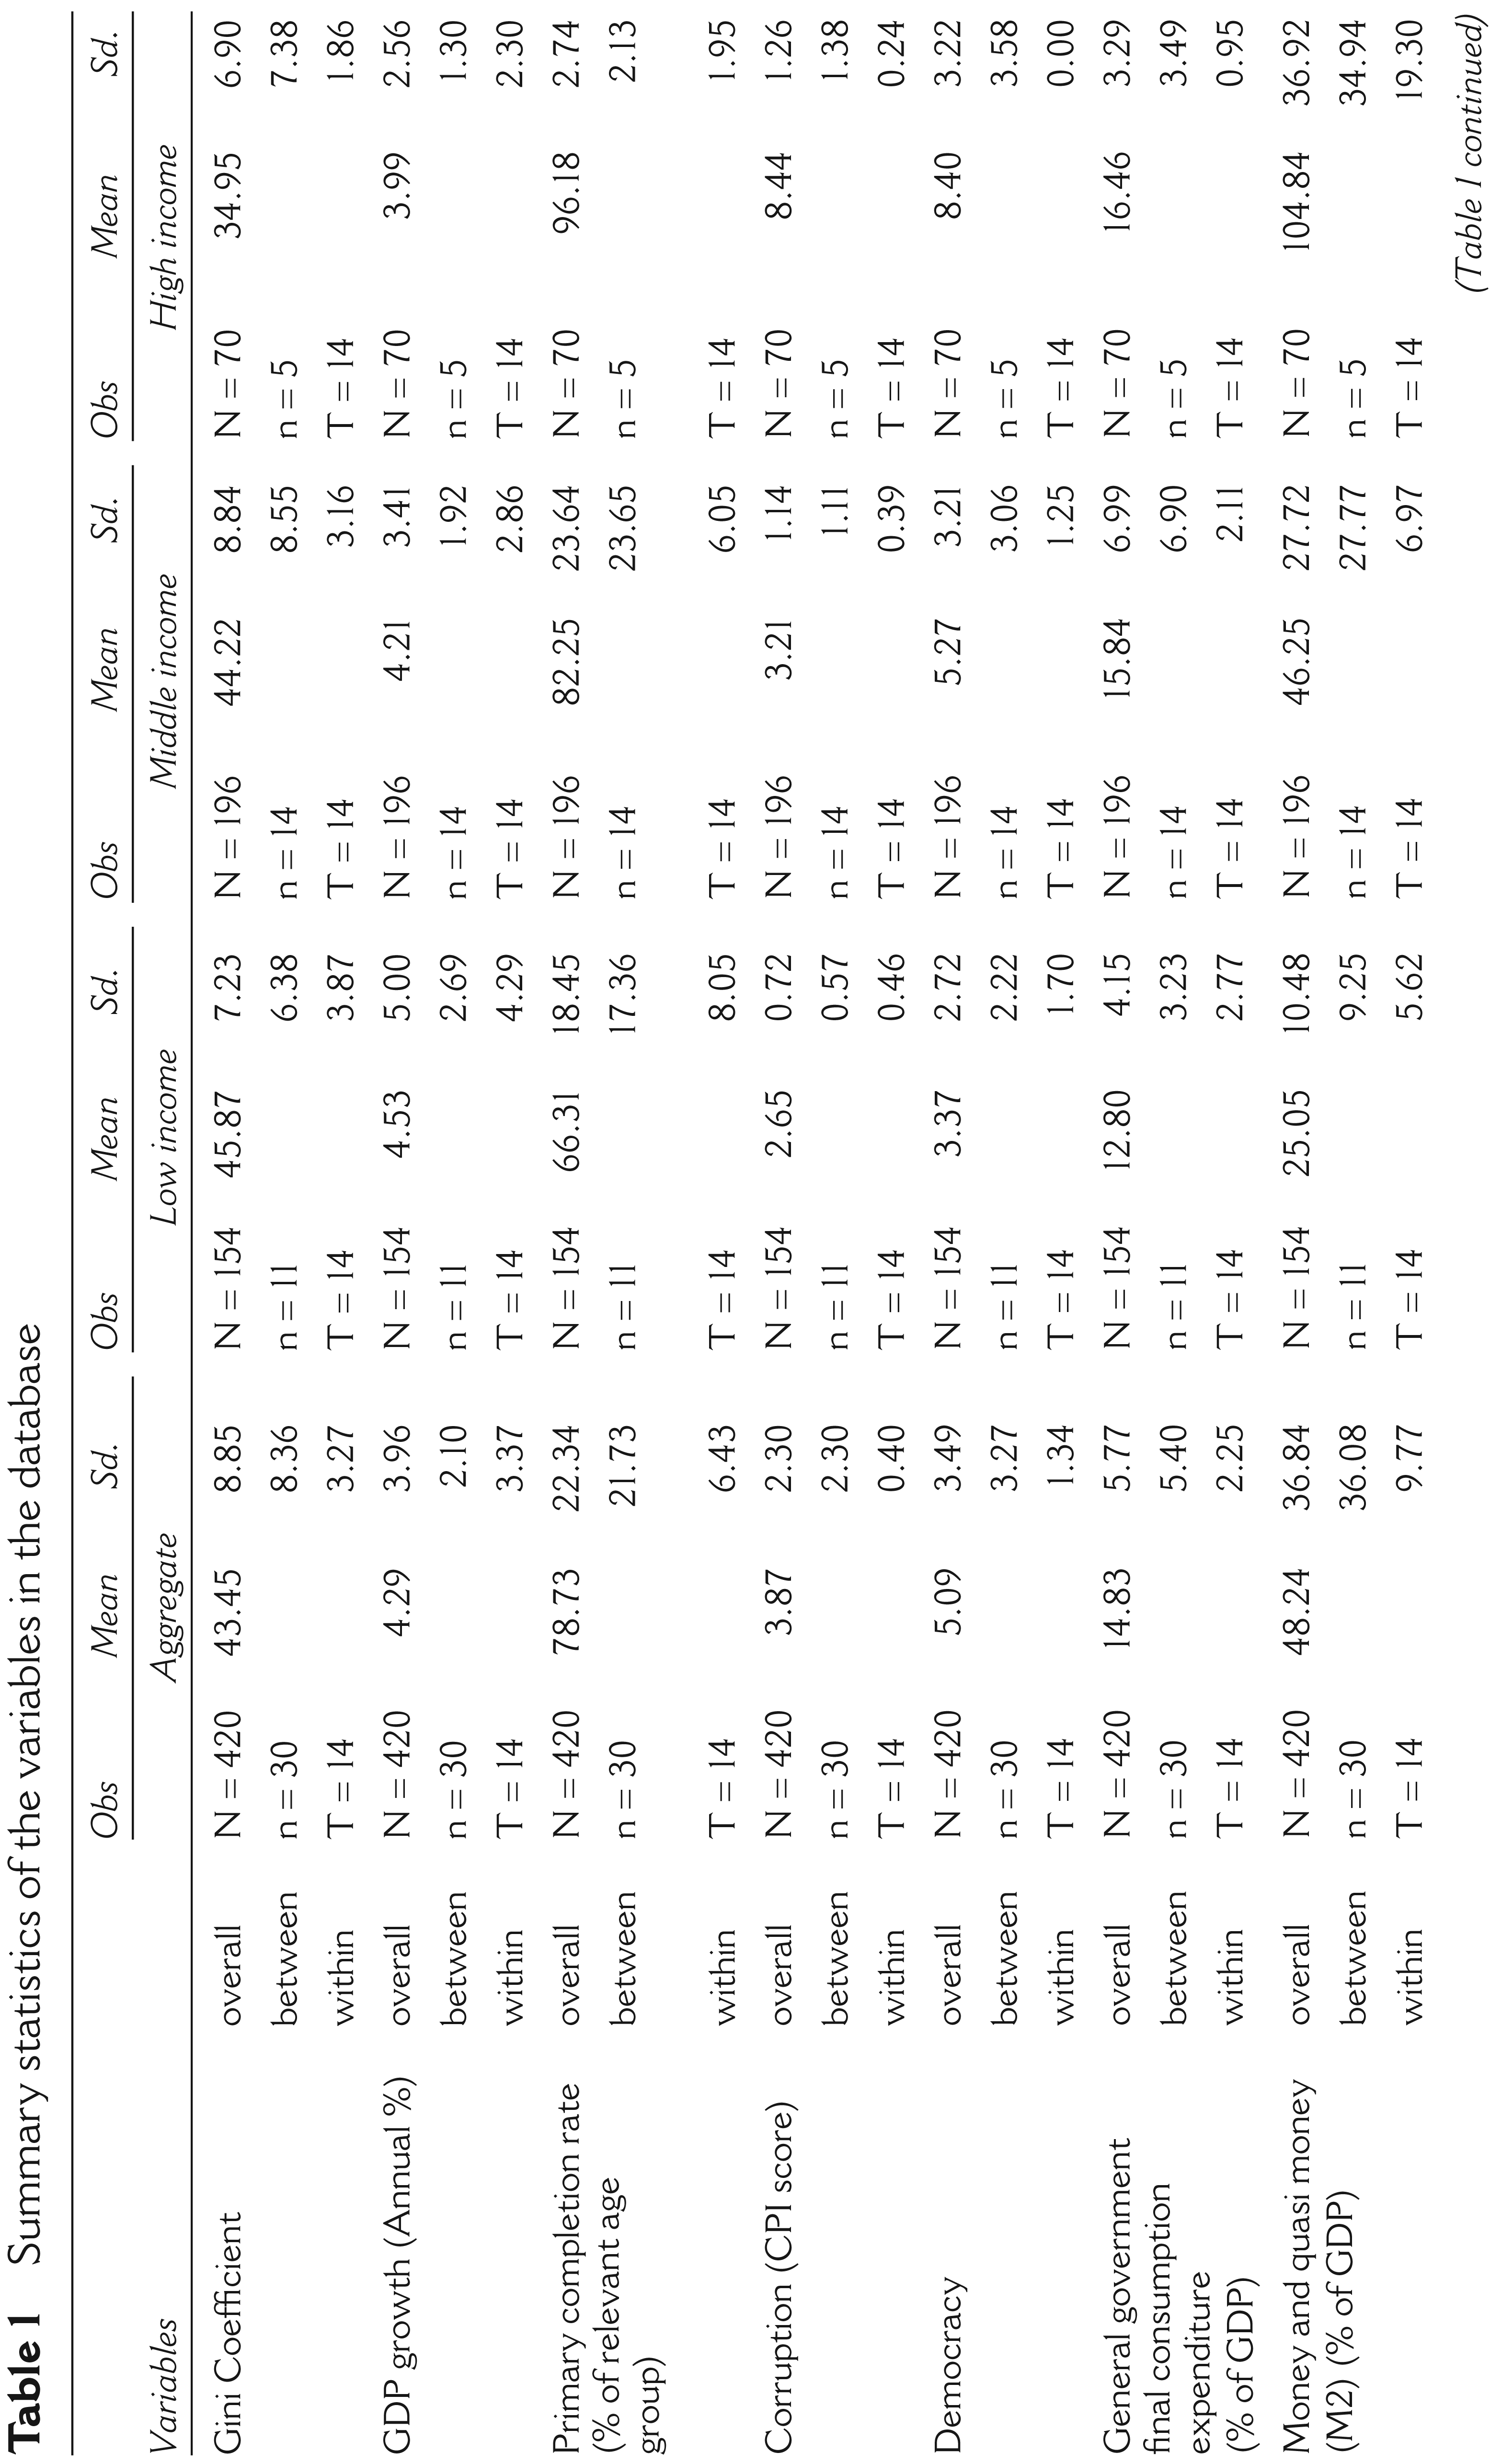
Table 1 shows descriptive statistics of the full sample and by three income categories averaged over the period 1995–2008. As expected, our sample shows the Gini coefficient is lowest for the high-income countries and highest for the low-income countries. 7 It ranges from less than 30 in Cyprus and Australia to more than 52 in Zimbabwe, Swaziland, South Africa, Lesotho and Belize. Consequently, higher inequality is expected in low- or middle-income countries compared to high-income countries.
Summary statistics of the variables in the database
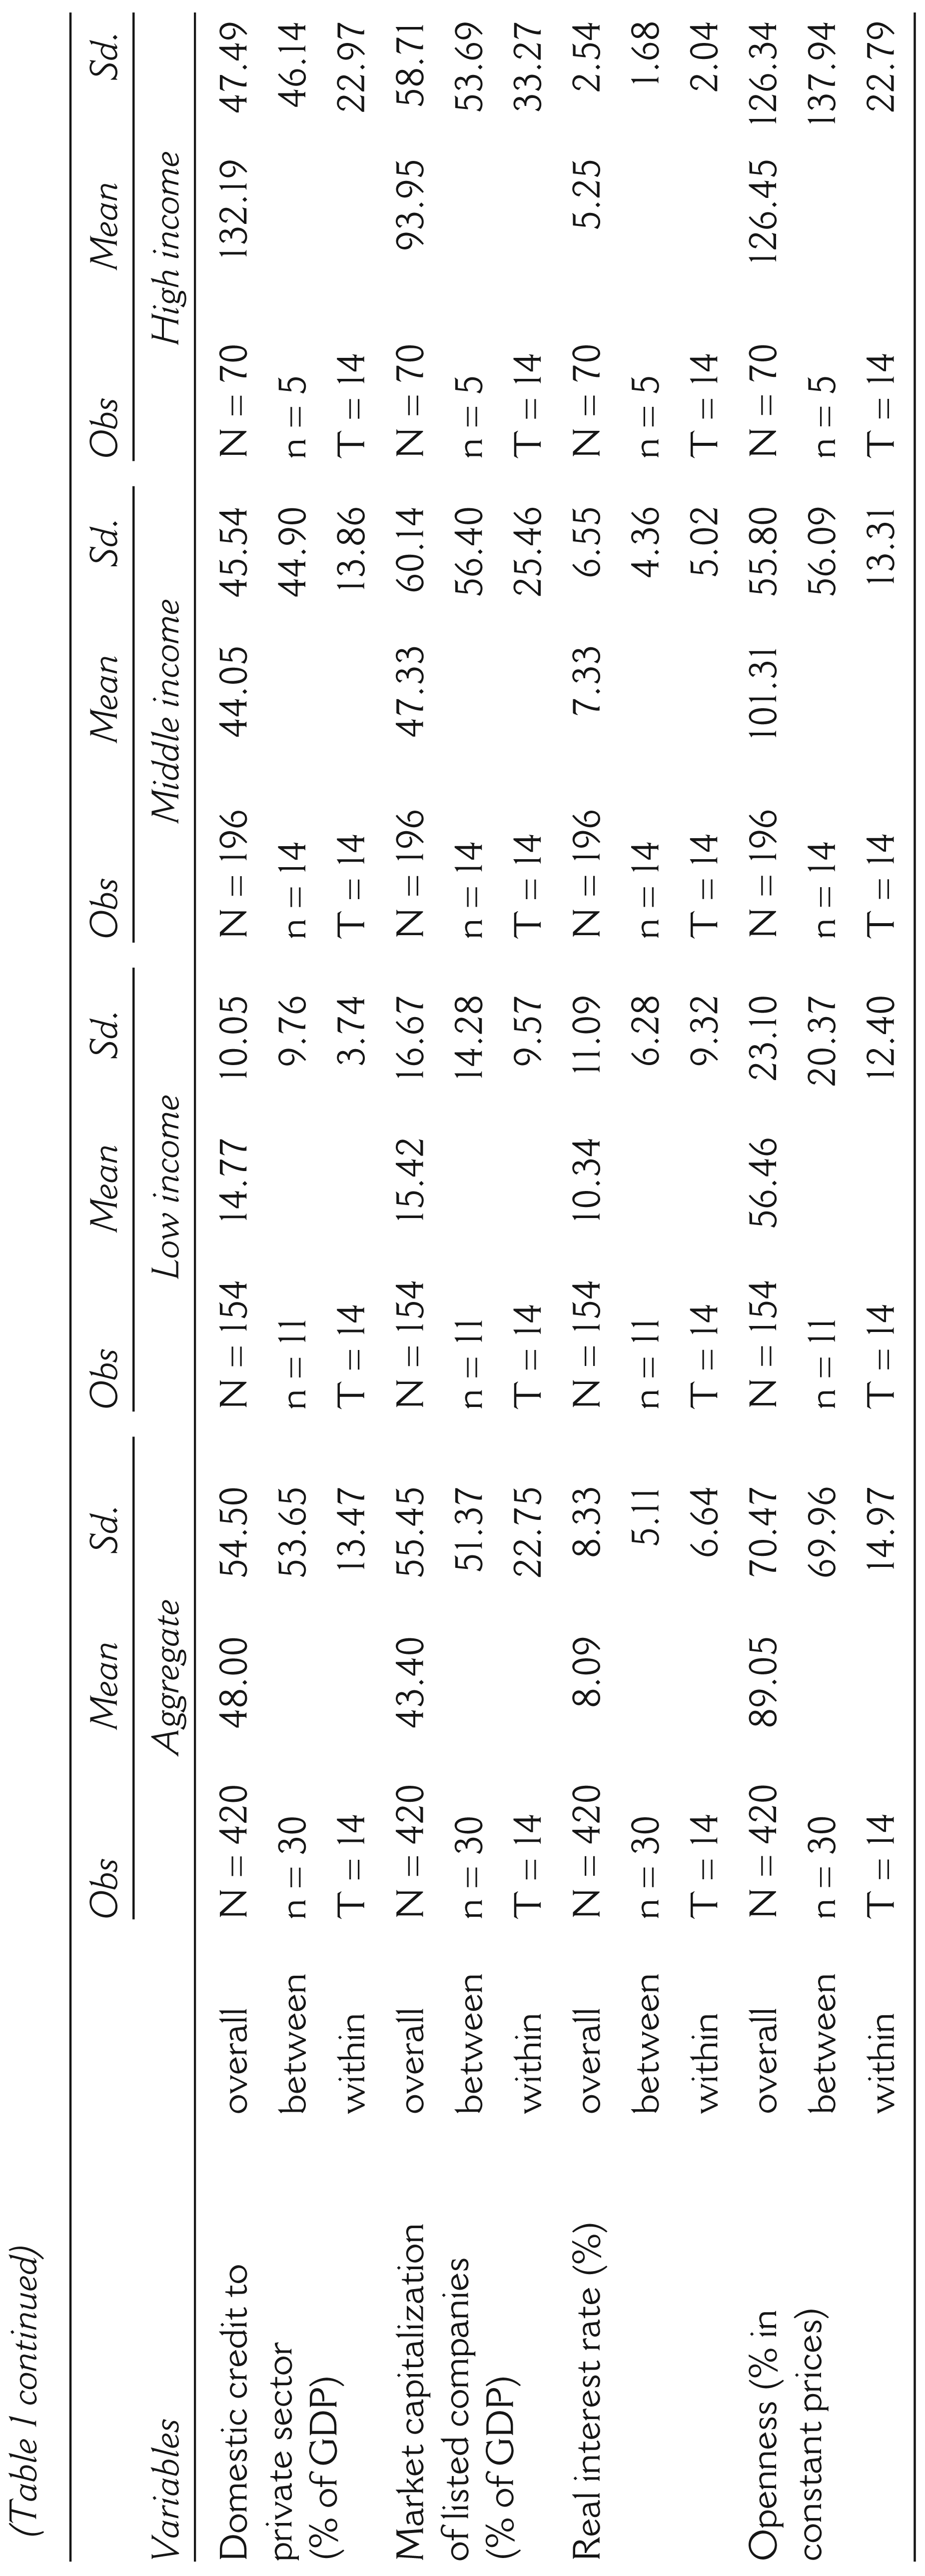
Summary statistics of the variables in the database
There is a wide variation in corruption (CPI), ranging from less than 2 in Bangladesh and Nigeria to more than 8 in Australia, Canada, Singapore and New Zealand for the period 1995–2008. It shows that the high-income countries are going to be less corrupt compared to the low- or middle-income countries and this difference is significantly large.
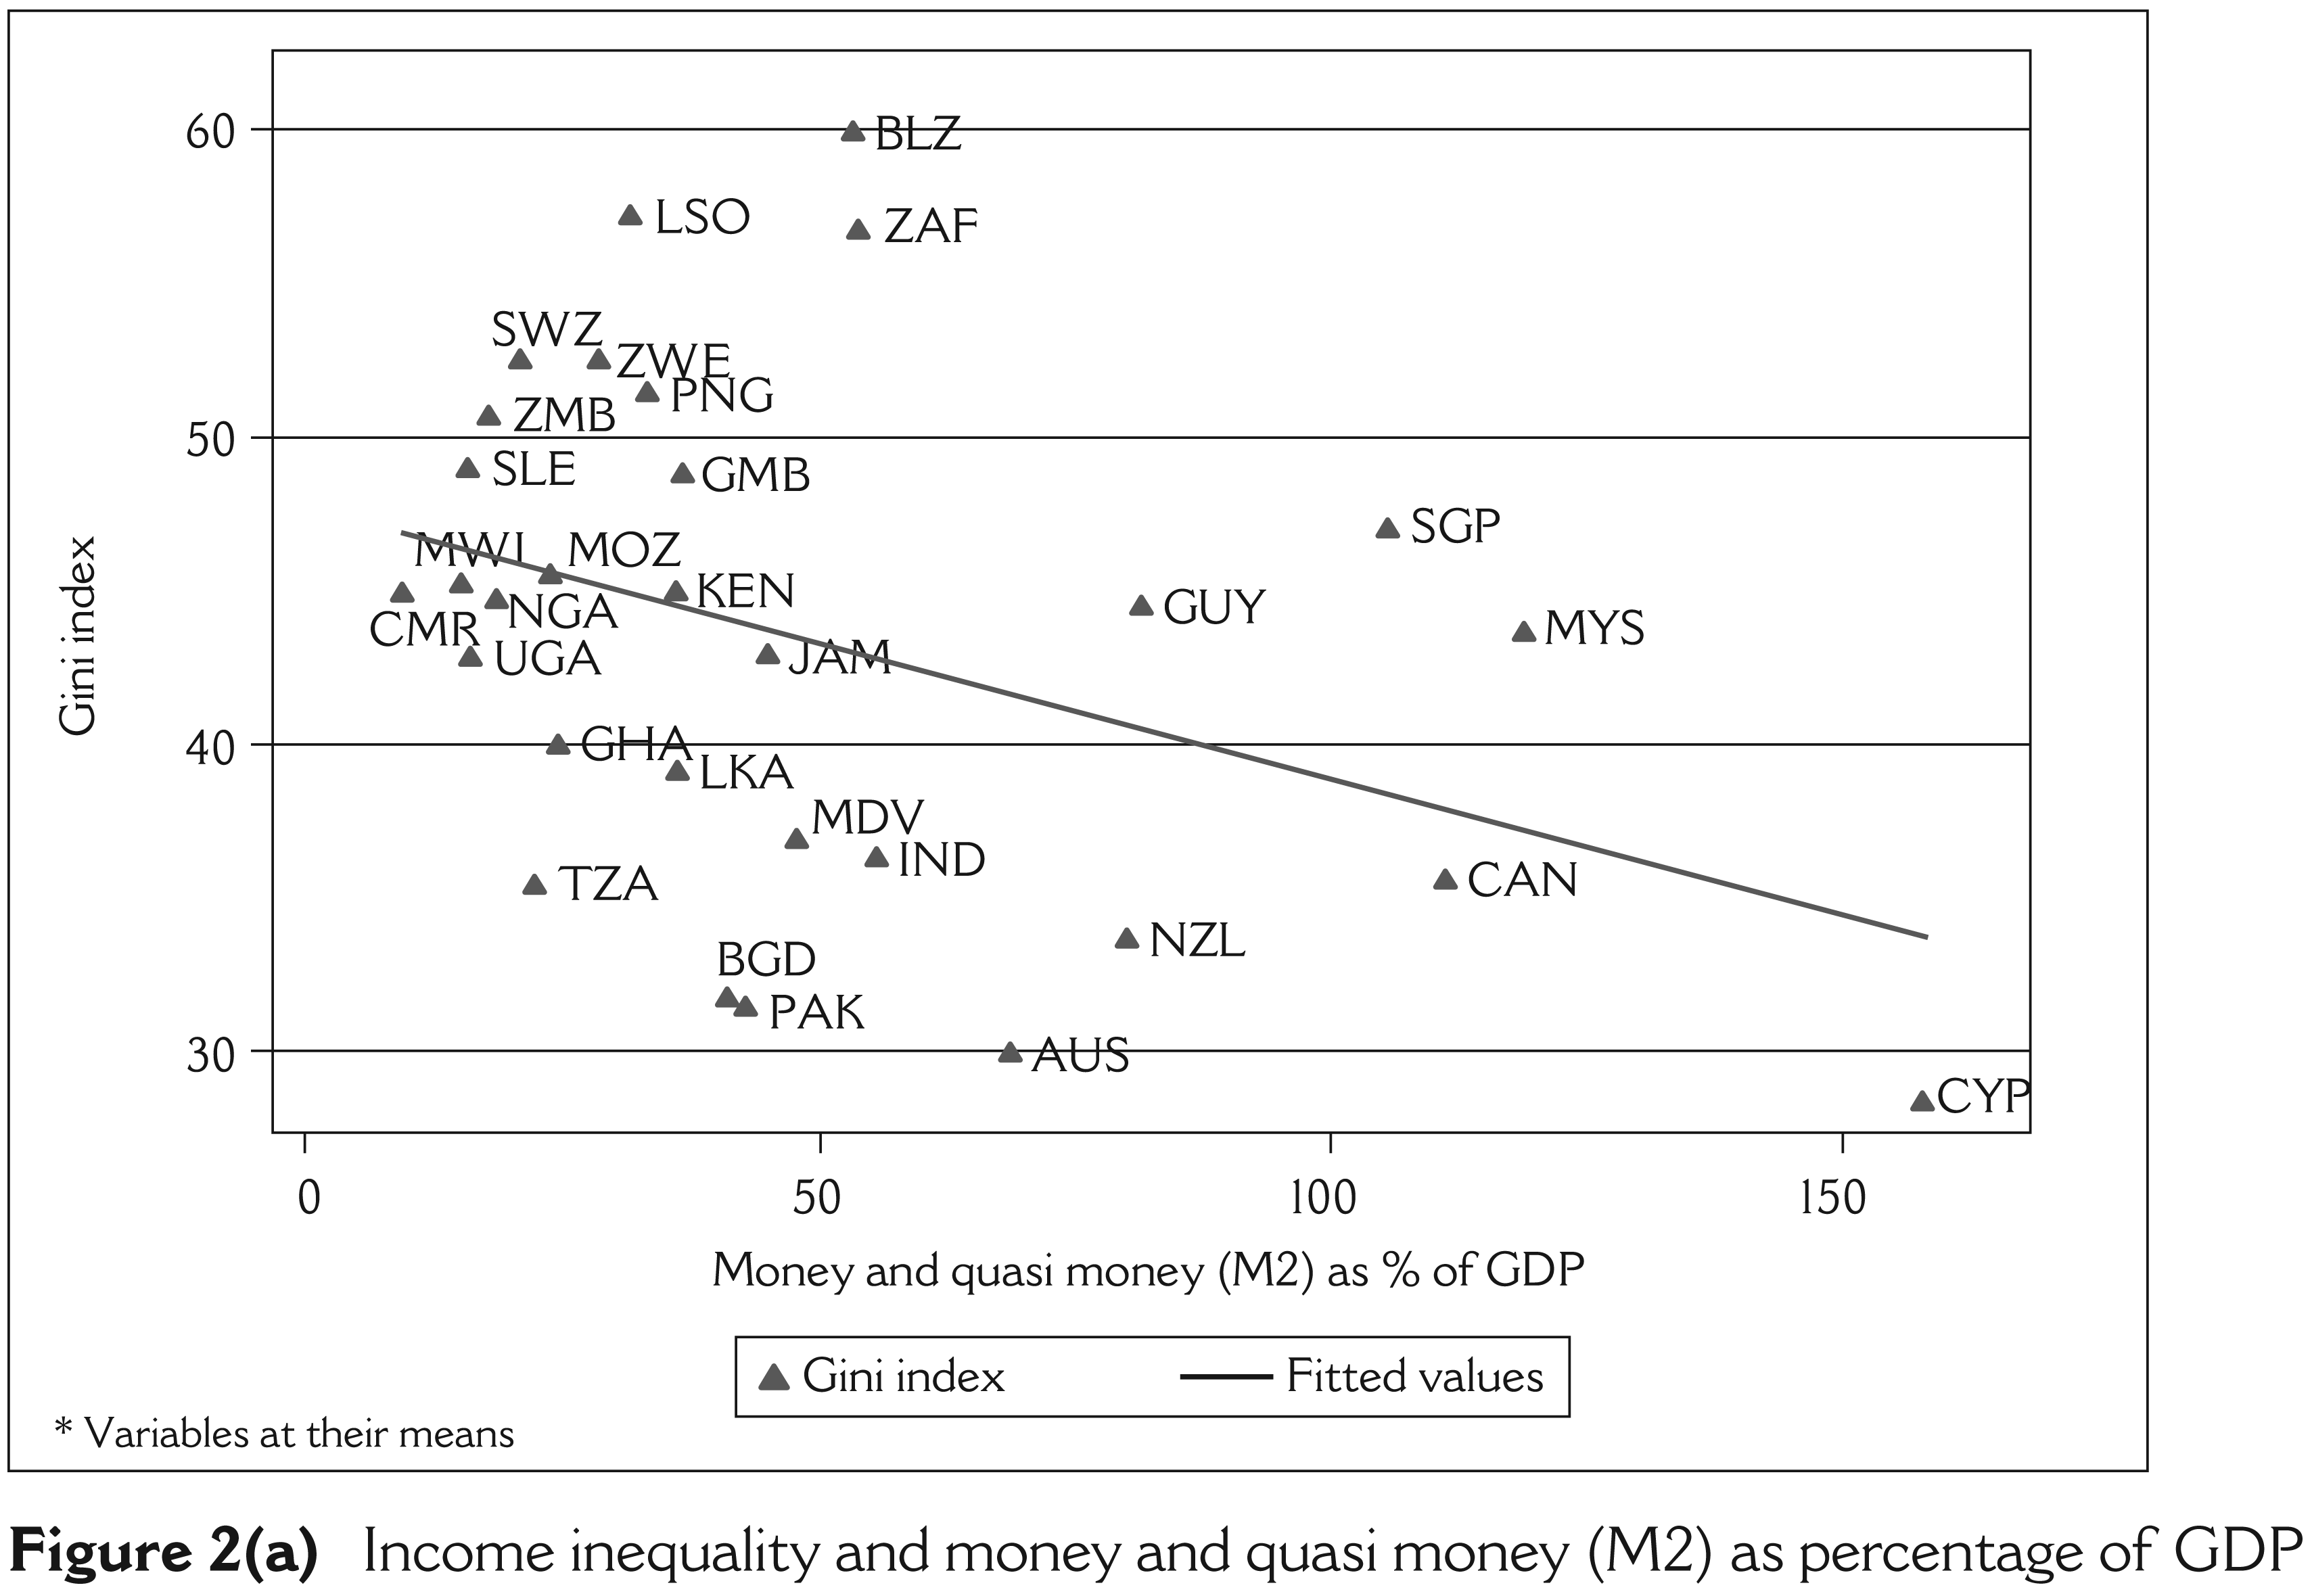
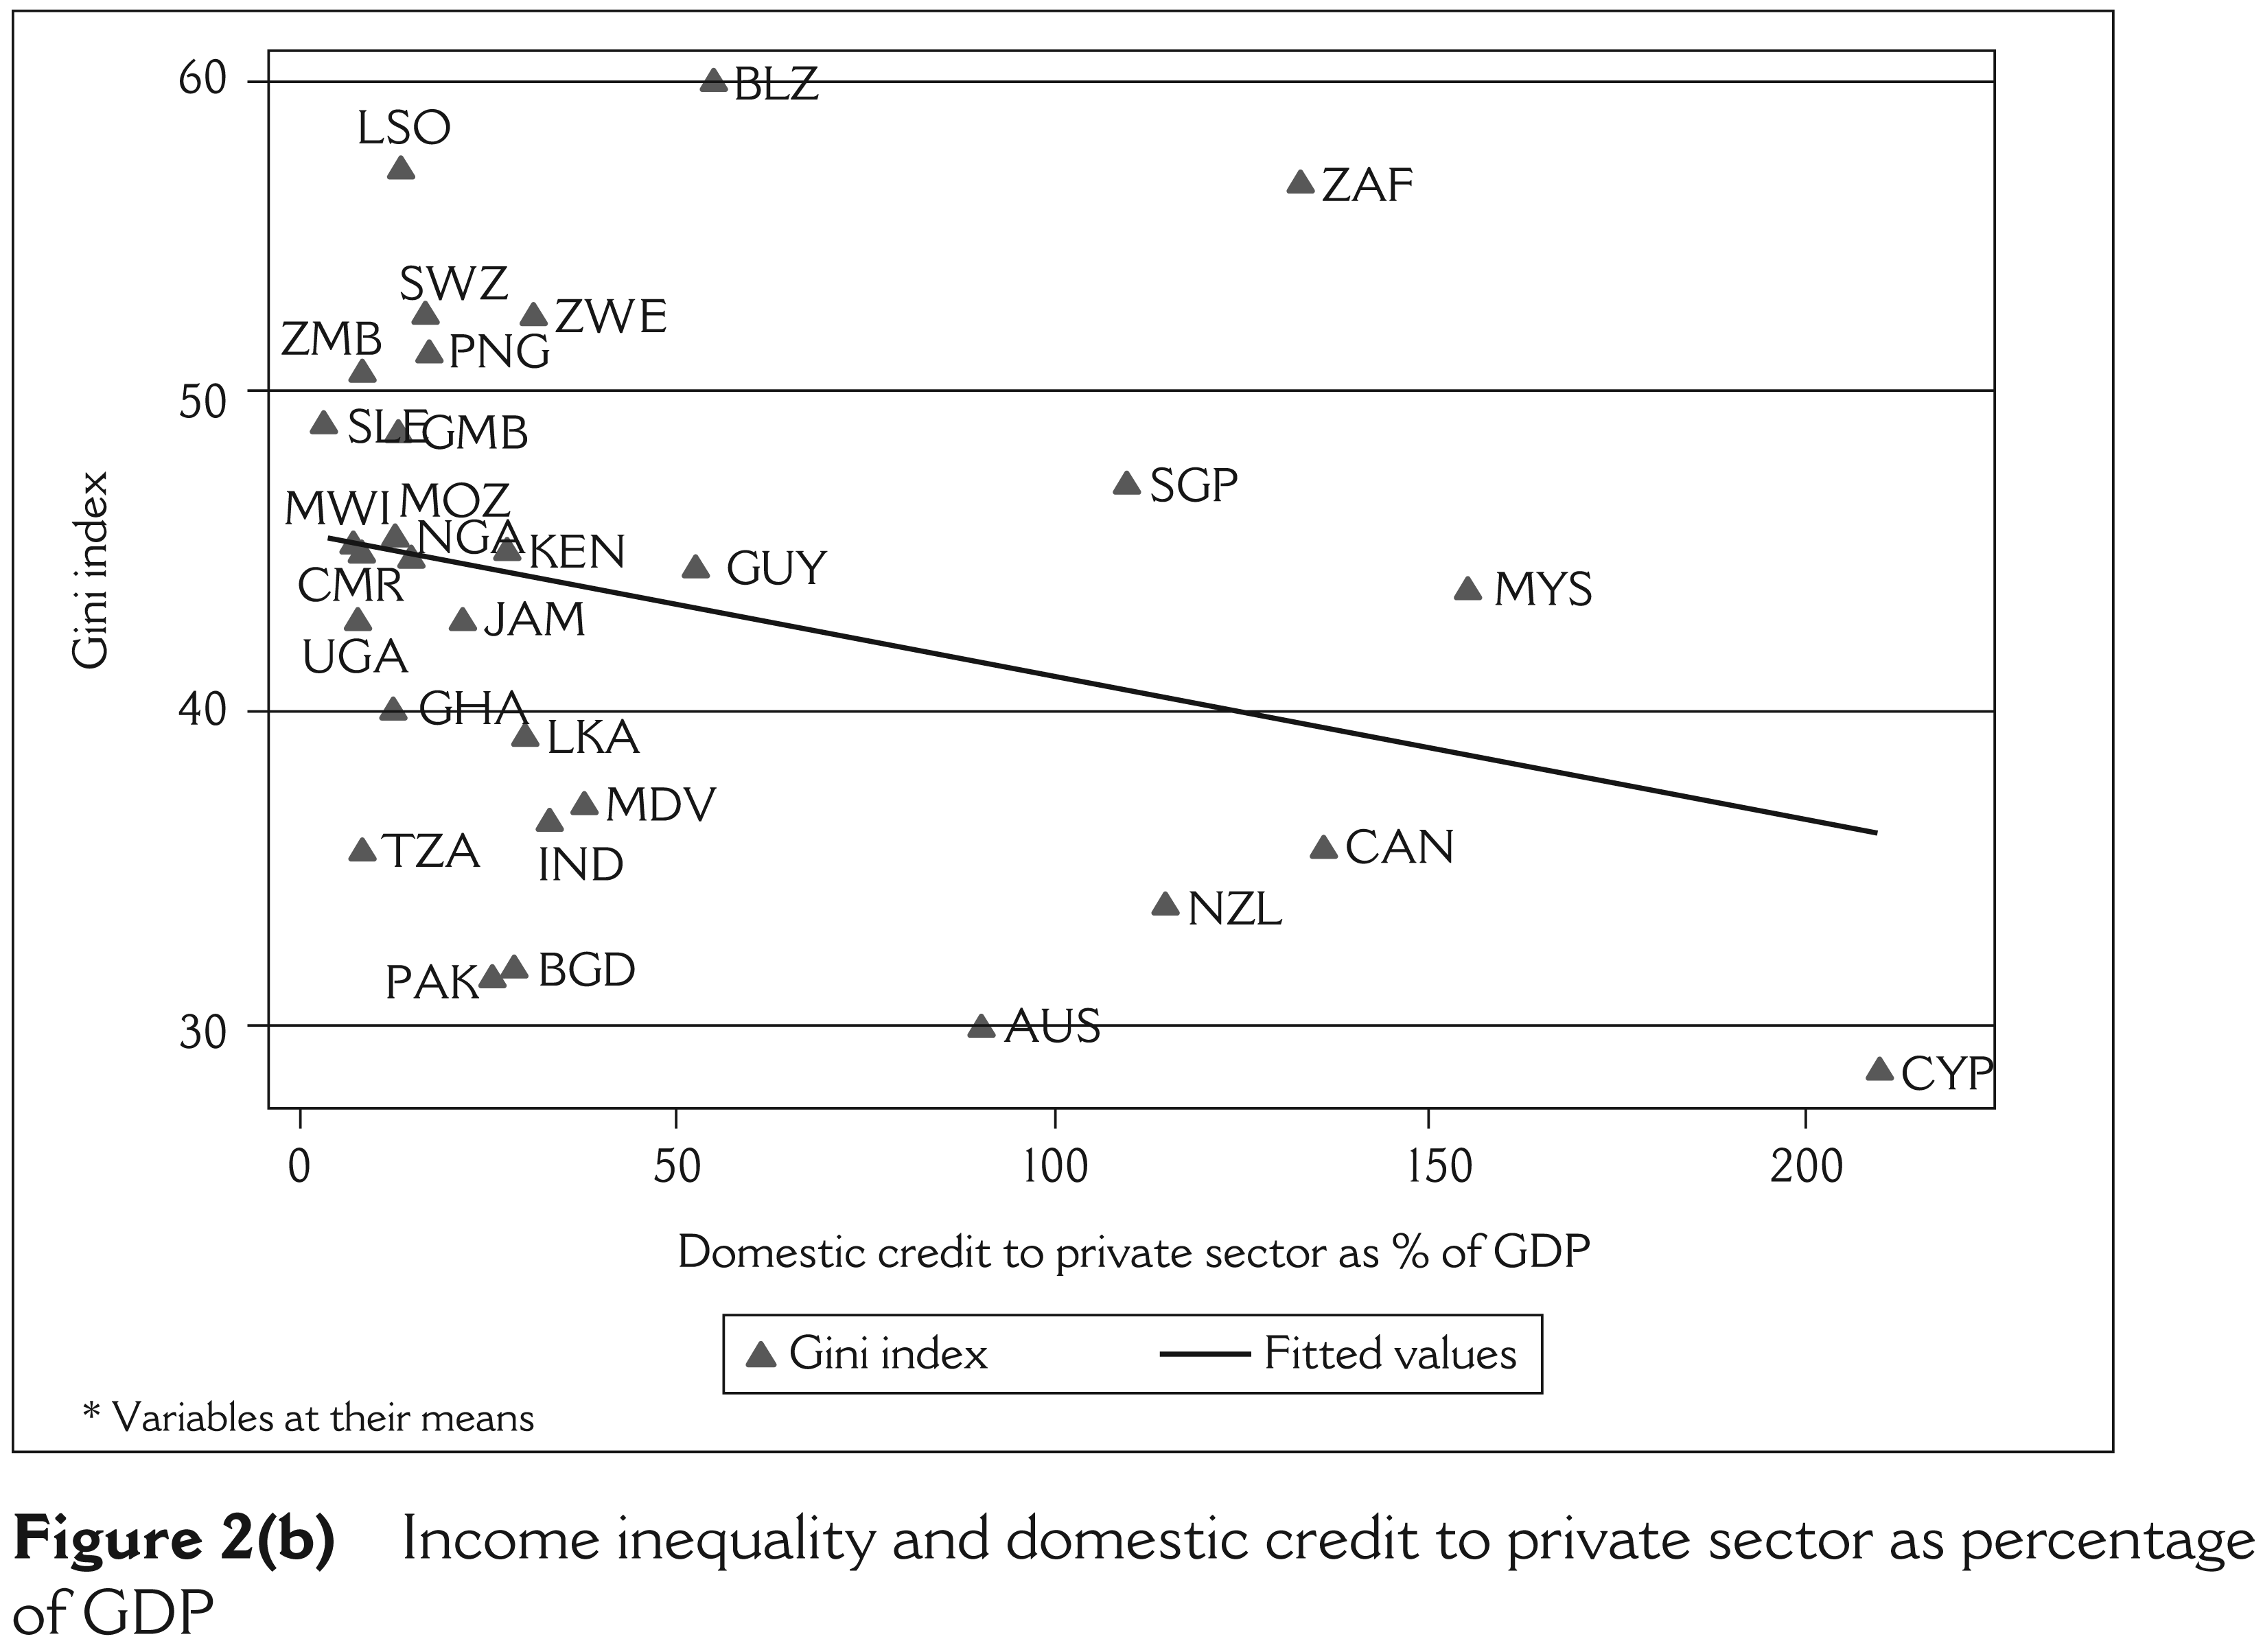
The financial development indicators for the high-income countries have been the highest, and the financial development indicators for the middle-income countries are between the low- and high-income countries. The money and quasi money (M2) is ranging from less than 20 percent of GDP in Cameroon, Malawi, Sierra Leon, Uganda, Zambia and Nigeria to more than 100 percent of GDP in Singapore, Canada, Malaysia and Cyprus. The domestic credit to private sector varies from less than 10 percent of GDP in Sierra Leon, Malawi, Uganda, Tanzania, Cameroon and Zambia to more than 100 percent of GDP in Singapore, New Zealand, South Africa, Canada, Malaysia and Cyprus.
As expected, GDP growth is lowest for the high-income countries. Primary completion rate, market capitalization and openness for the middle-income countries are between the low- and high-income countries. Real interest rate is highest in the low-income countries.
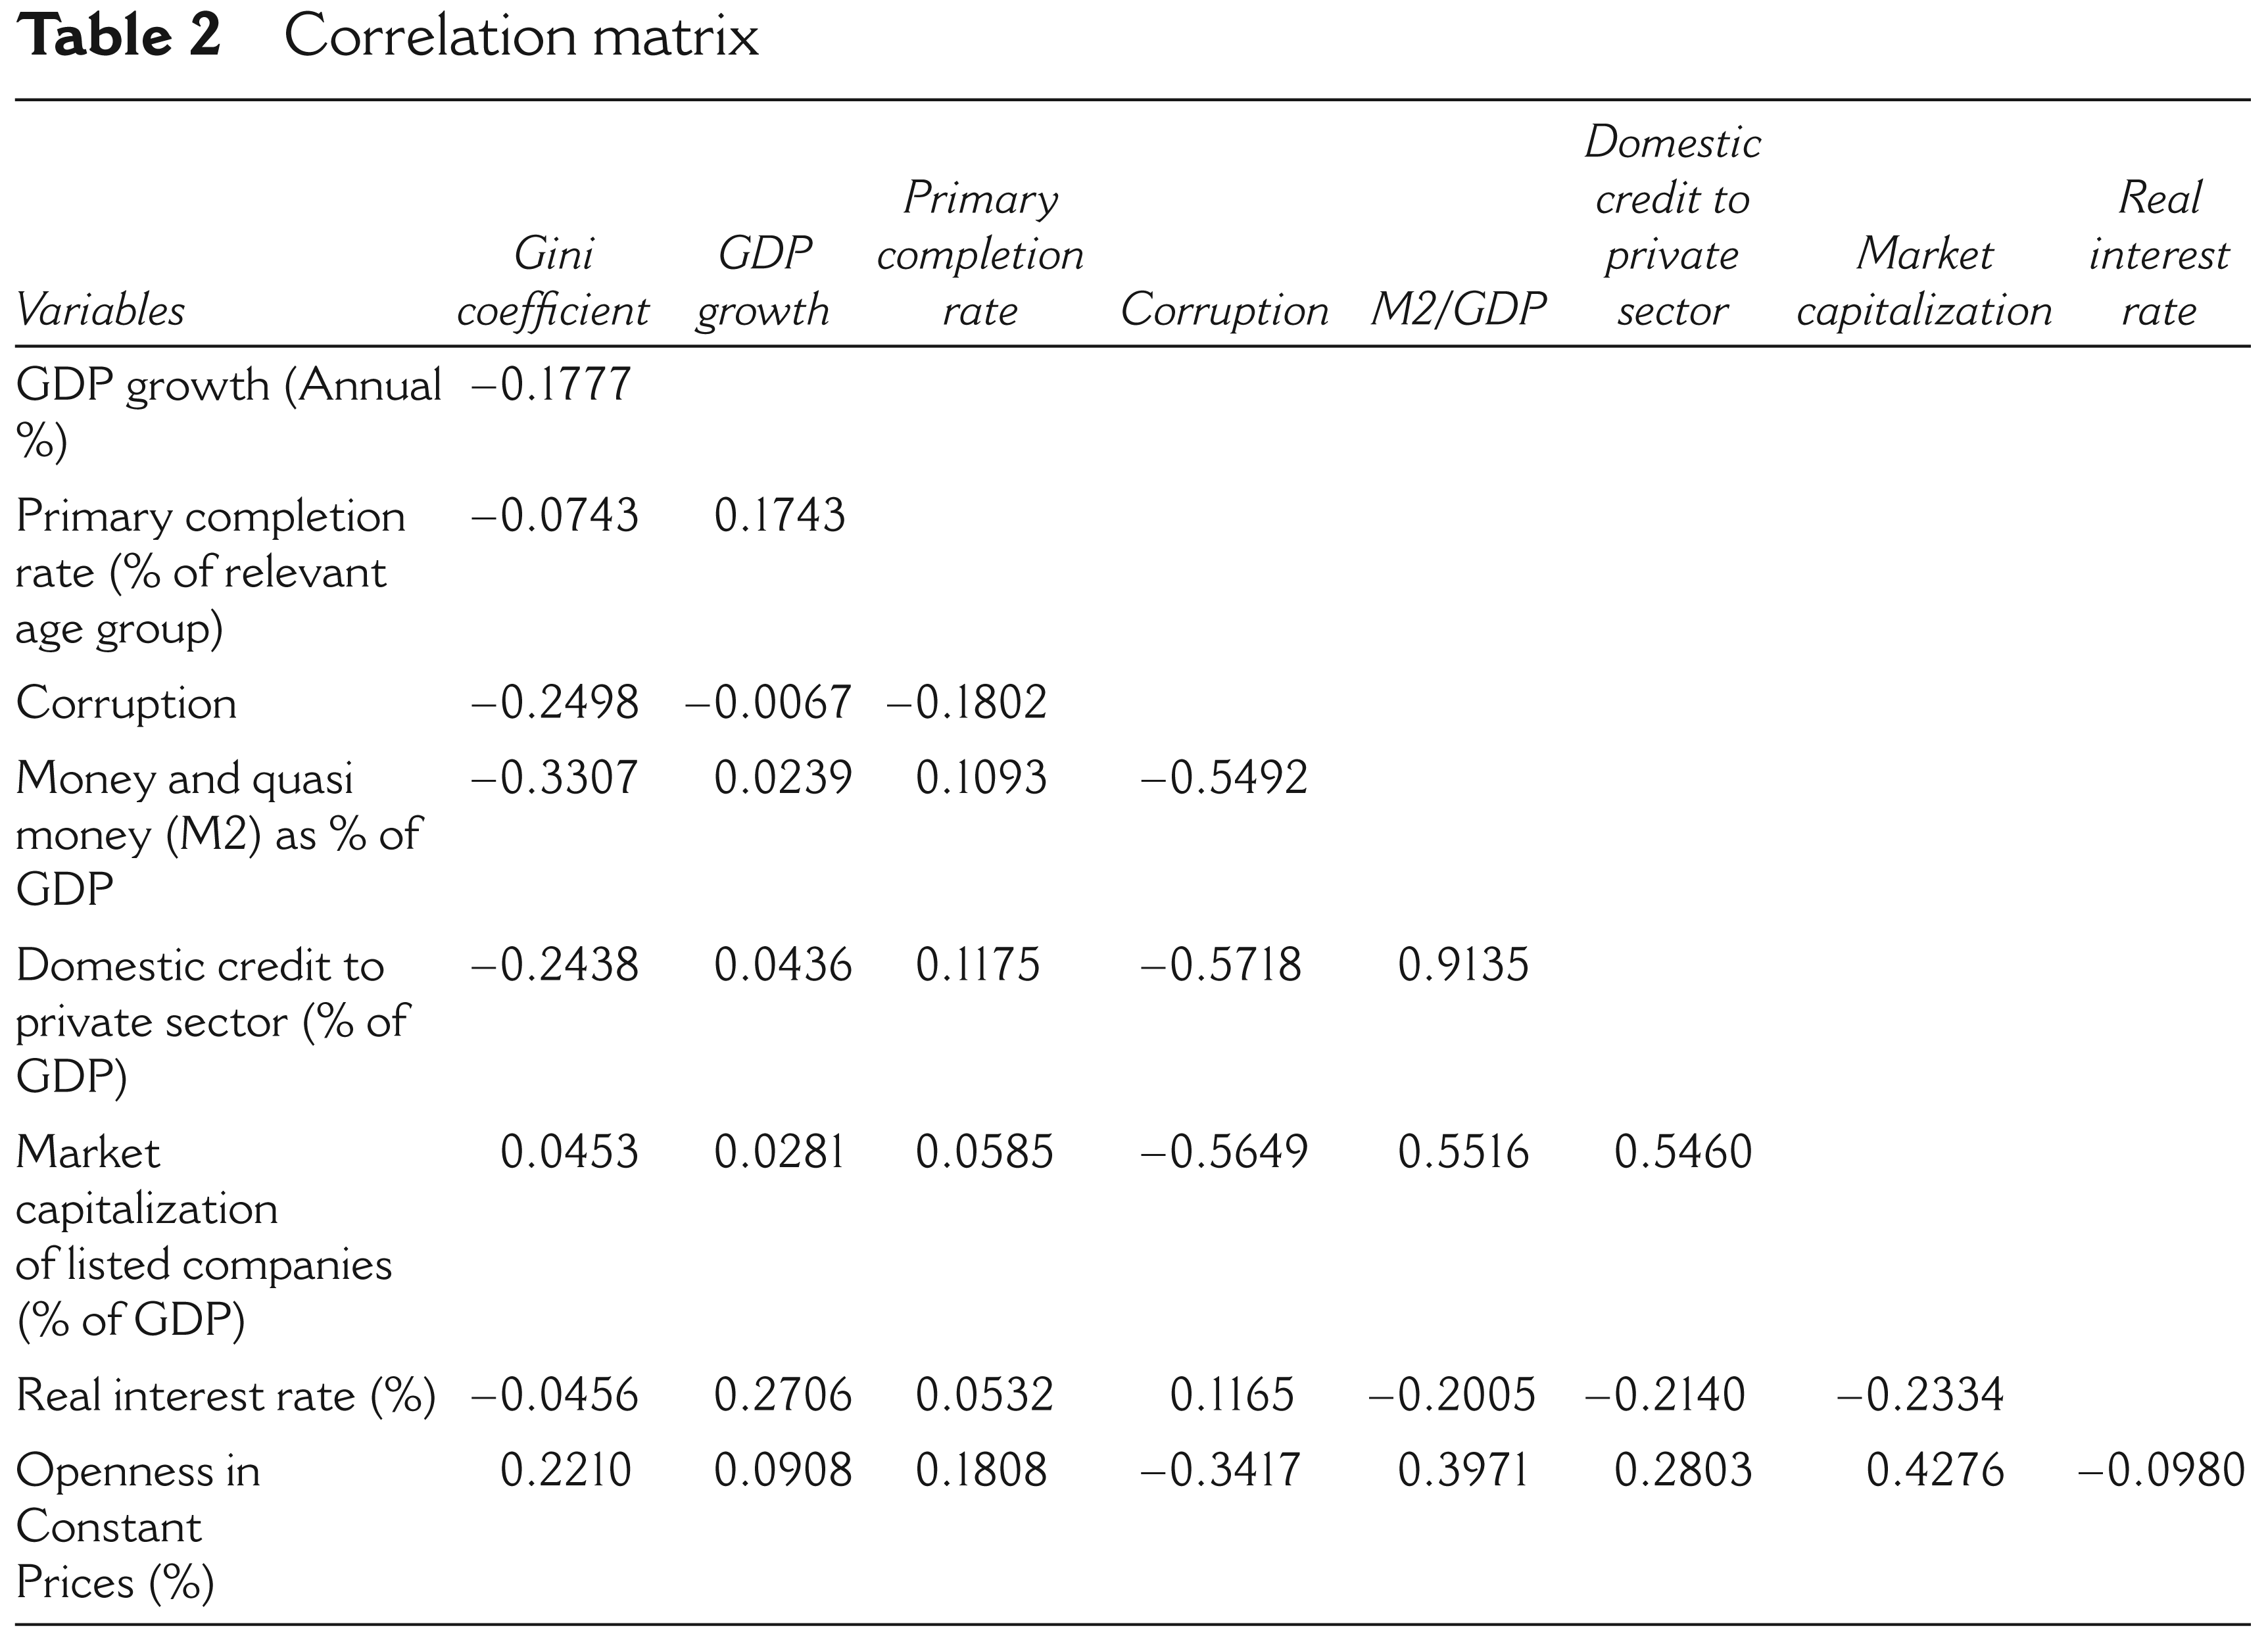
Table 2 shows the correlation matrix of the variables the database. The corruption index is multiplied by −1 so that a high value of the corruption index indicates a high level of corruption. As expected, corruption is positively correlated with income inequality. Both the indicators of financial sector development are negatively correlated with the Gini coefficient. The pairwise correlations indicate that income inequality is lower in countries with deeper financial markets. The two indicators of financial development are positively correlated with each other.
Correlation matrix
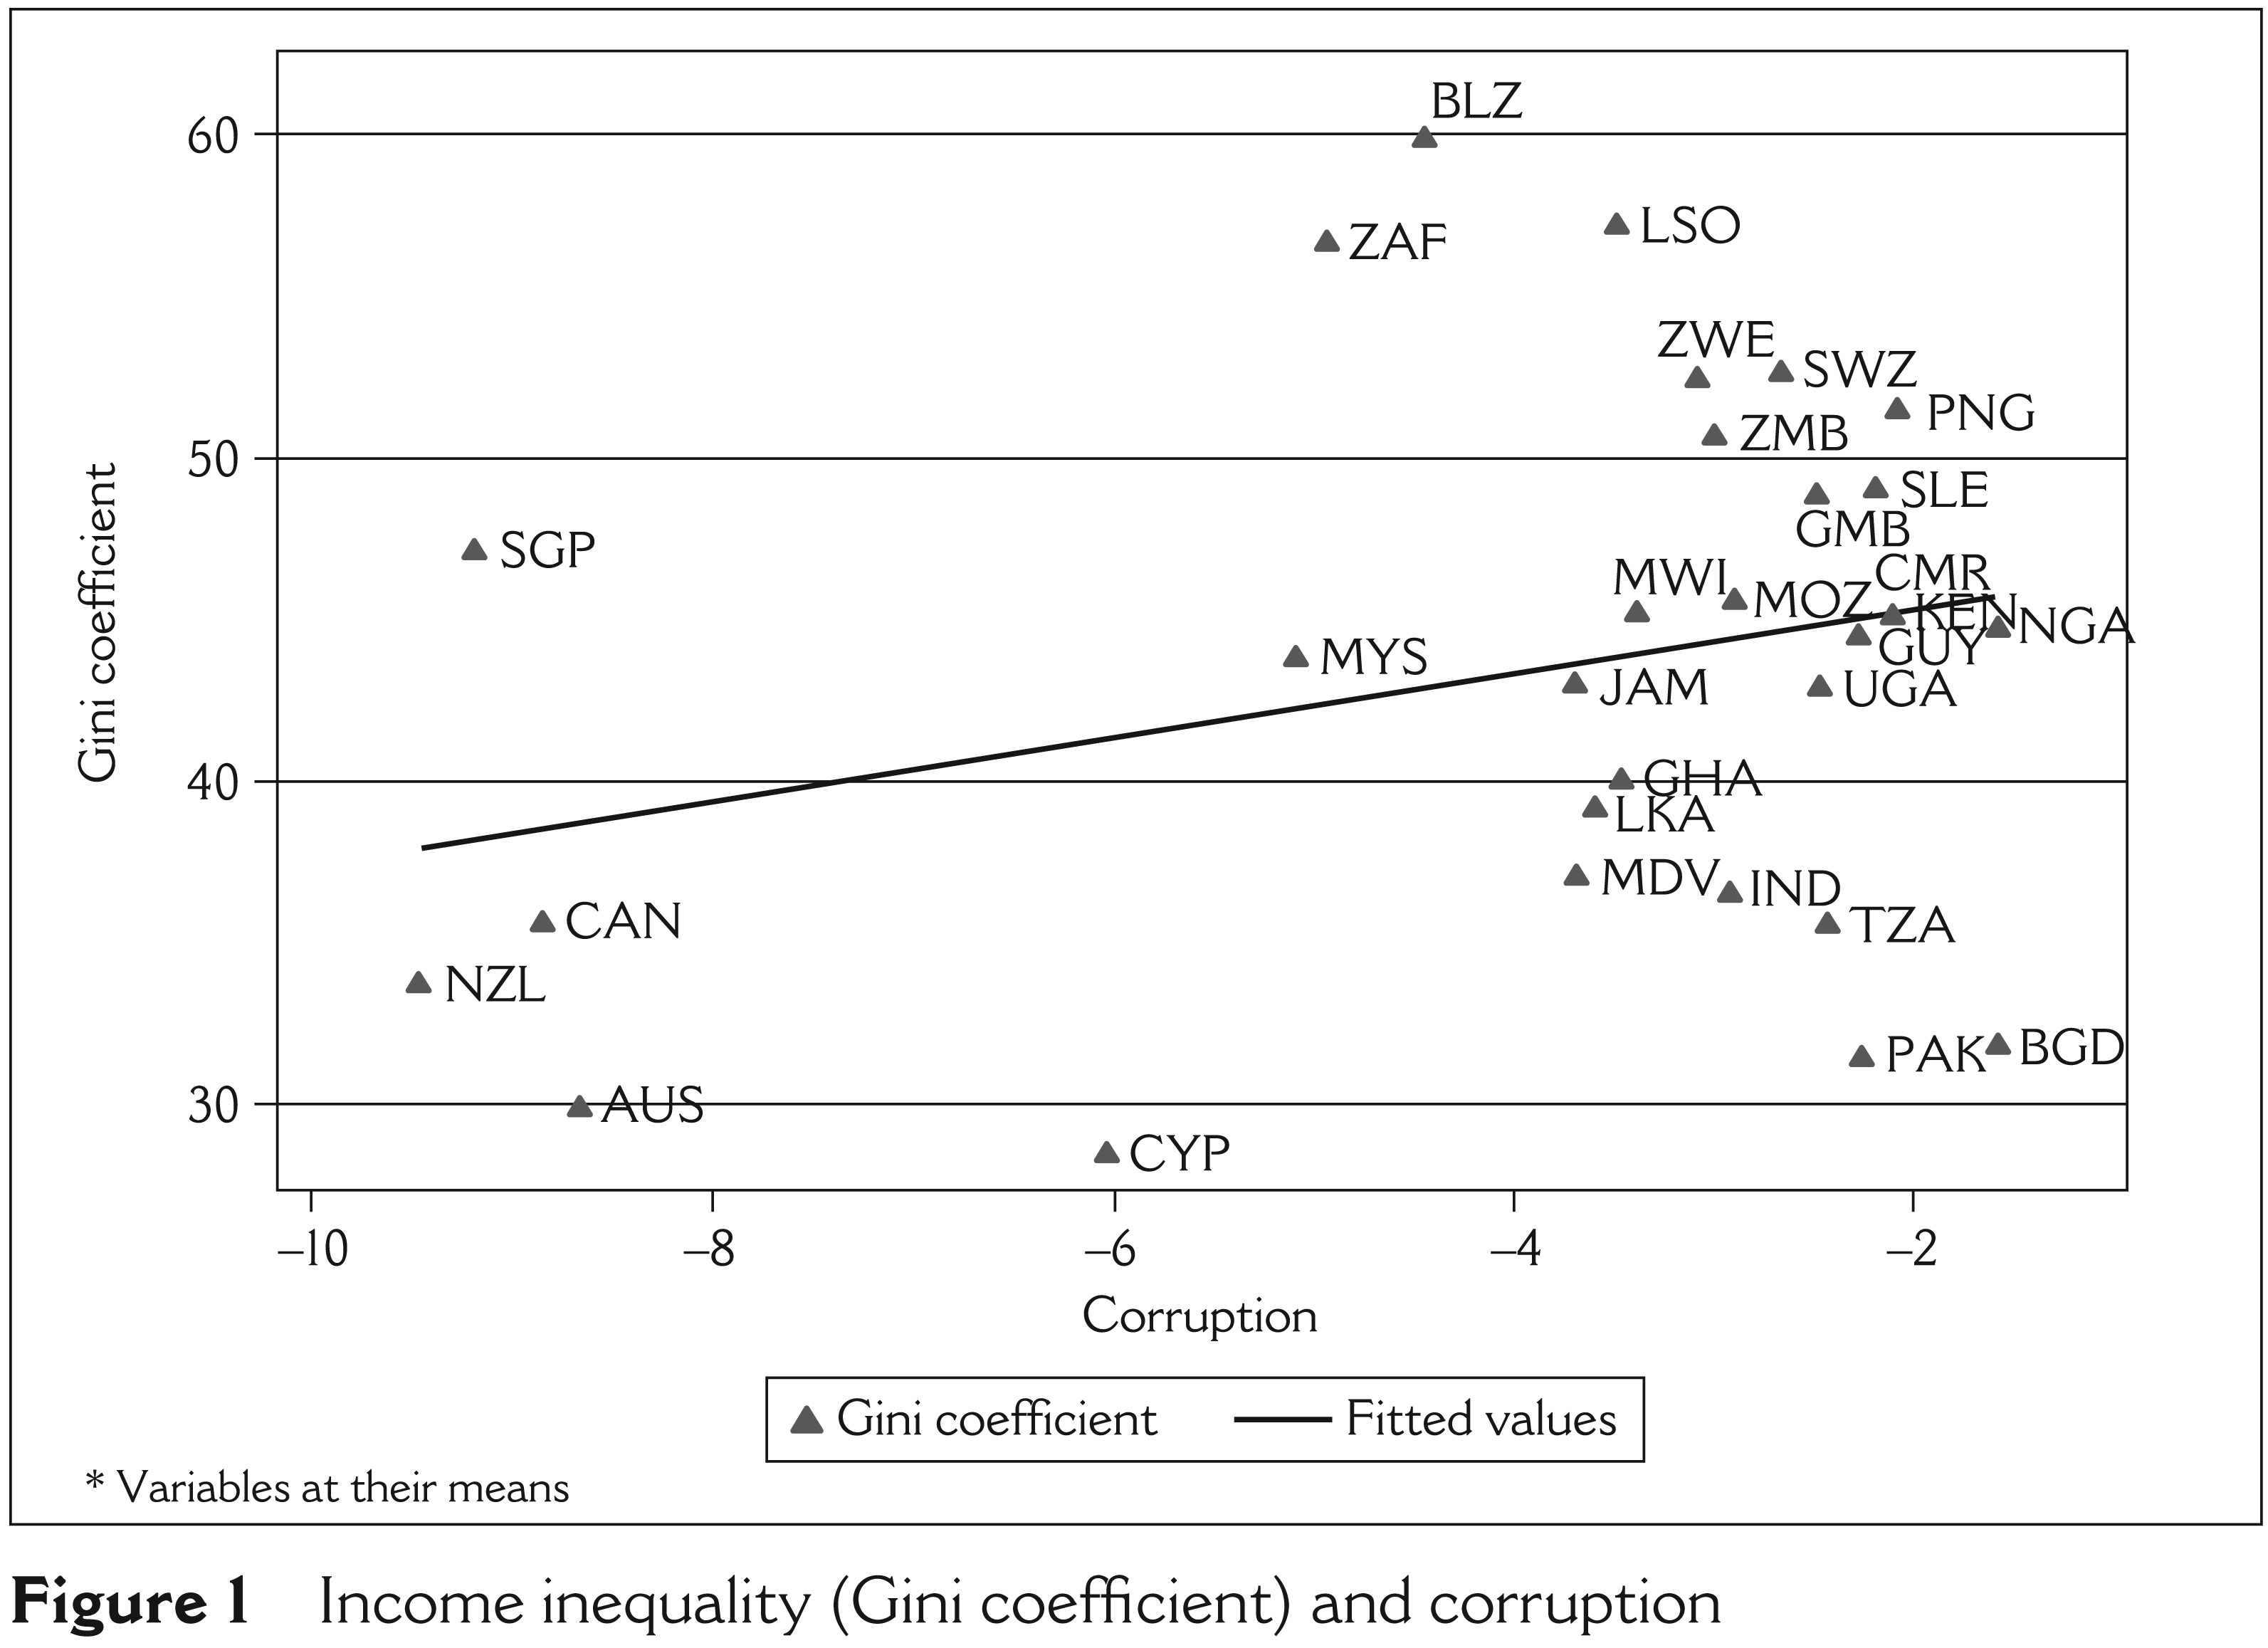
To visualize the relation between the Gini coefficient and corruption, Figure 1 plots the Gini coefficient and the fitted values from the regression of the Gini coefficient on the corruption index against the corruption index. The plot in Figure 1 suggests a positive, and possible linear relationship between corruption and income inequality.
Similarly, Figure 2 suggests a negative, and possible linear relationship between financial development and income inequality.
Income inequality (Gini coefficient) and corruption
Income inequality and money and quasi money (M2) as percentage of GDP
Income inequality and domestic credit to private sector as percentage of GDP
In modelling the relationship among income inequality, corruption and financial development, panel data from the period 1995–2008 are used for 30 Commonwealth countries.
8
The complete list of the countries by income category is given in Appendix B. The dataset is divided into three income categories by Gross National Income (GNI) level using the World Bank Atlas Method. These three income categories are low-, middle-
9
and high-income countries.
10
Following Barro (2000) and Lundberg and Squire (2003) the following specification is estimated:
where Income Inequality, Corruption and Financial Development are measured for country i at time t. Vit is a vector of other control variables for country i at time t. The parameter ni contains constant country-specific variables that are invariant over time and fit is the random error term.
11
The variables in the model are measured by:
Income Inequality: Gini coefficient. Corruption: CPI. Financial Development: (M2) as percentage of GDP; and Domestic credit to private sector (percentage of GDP).
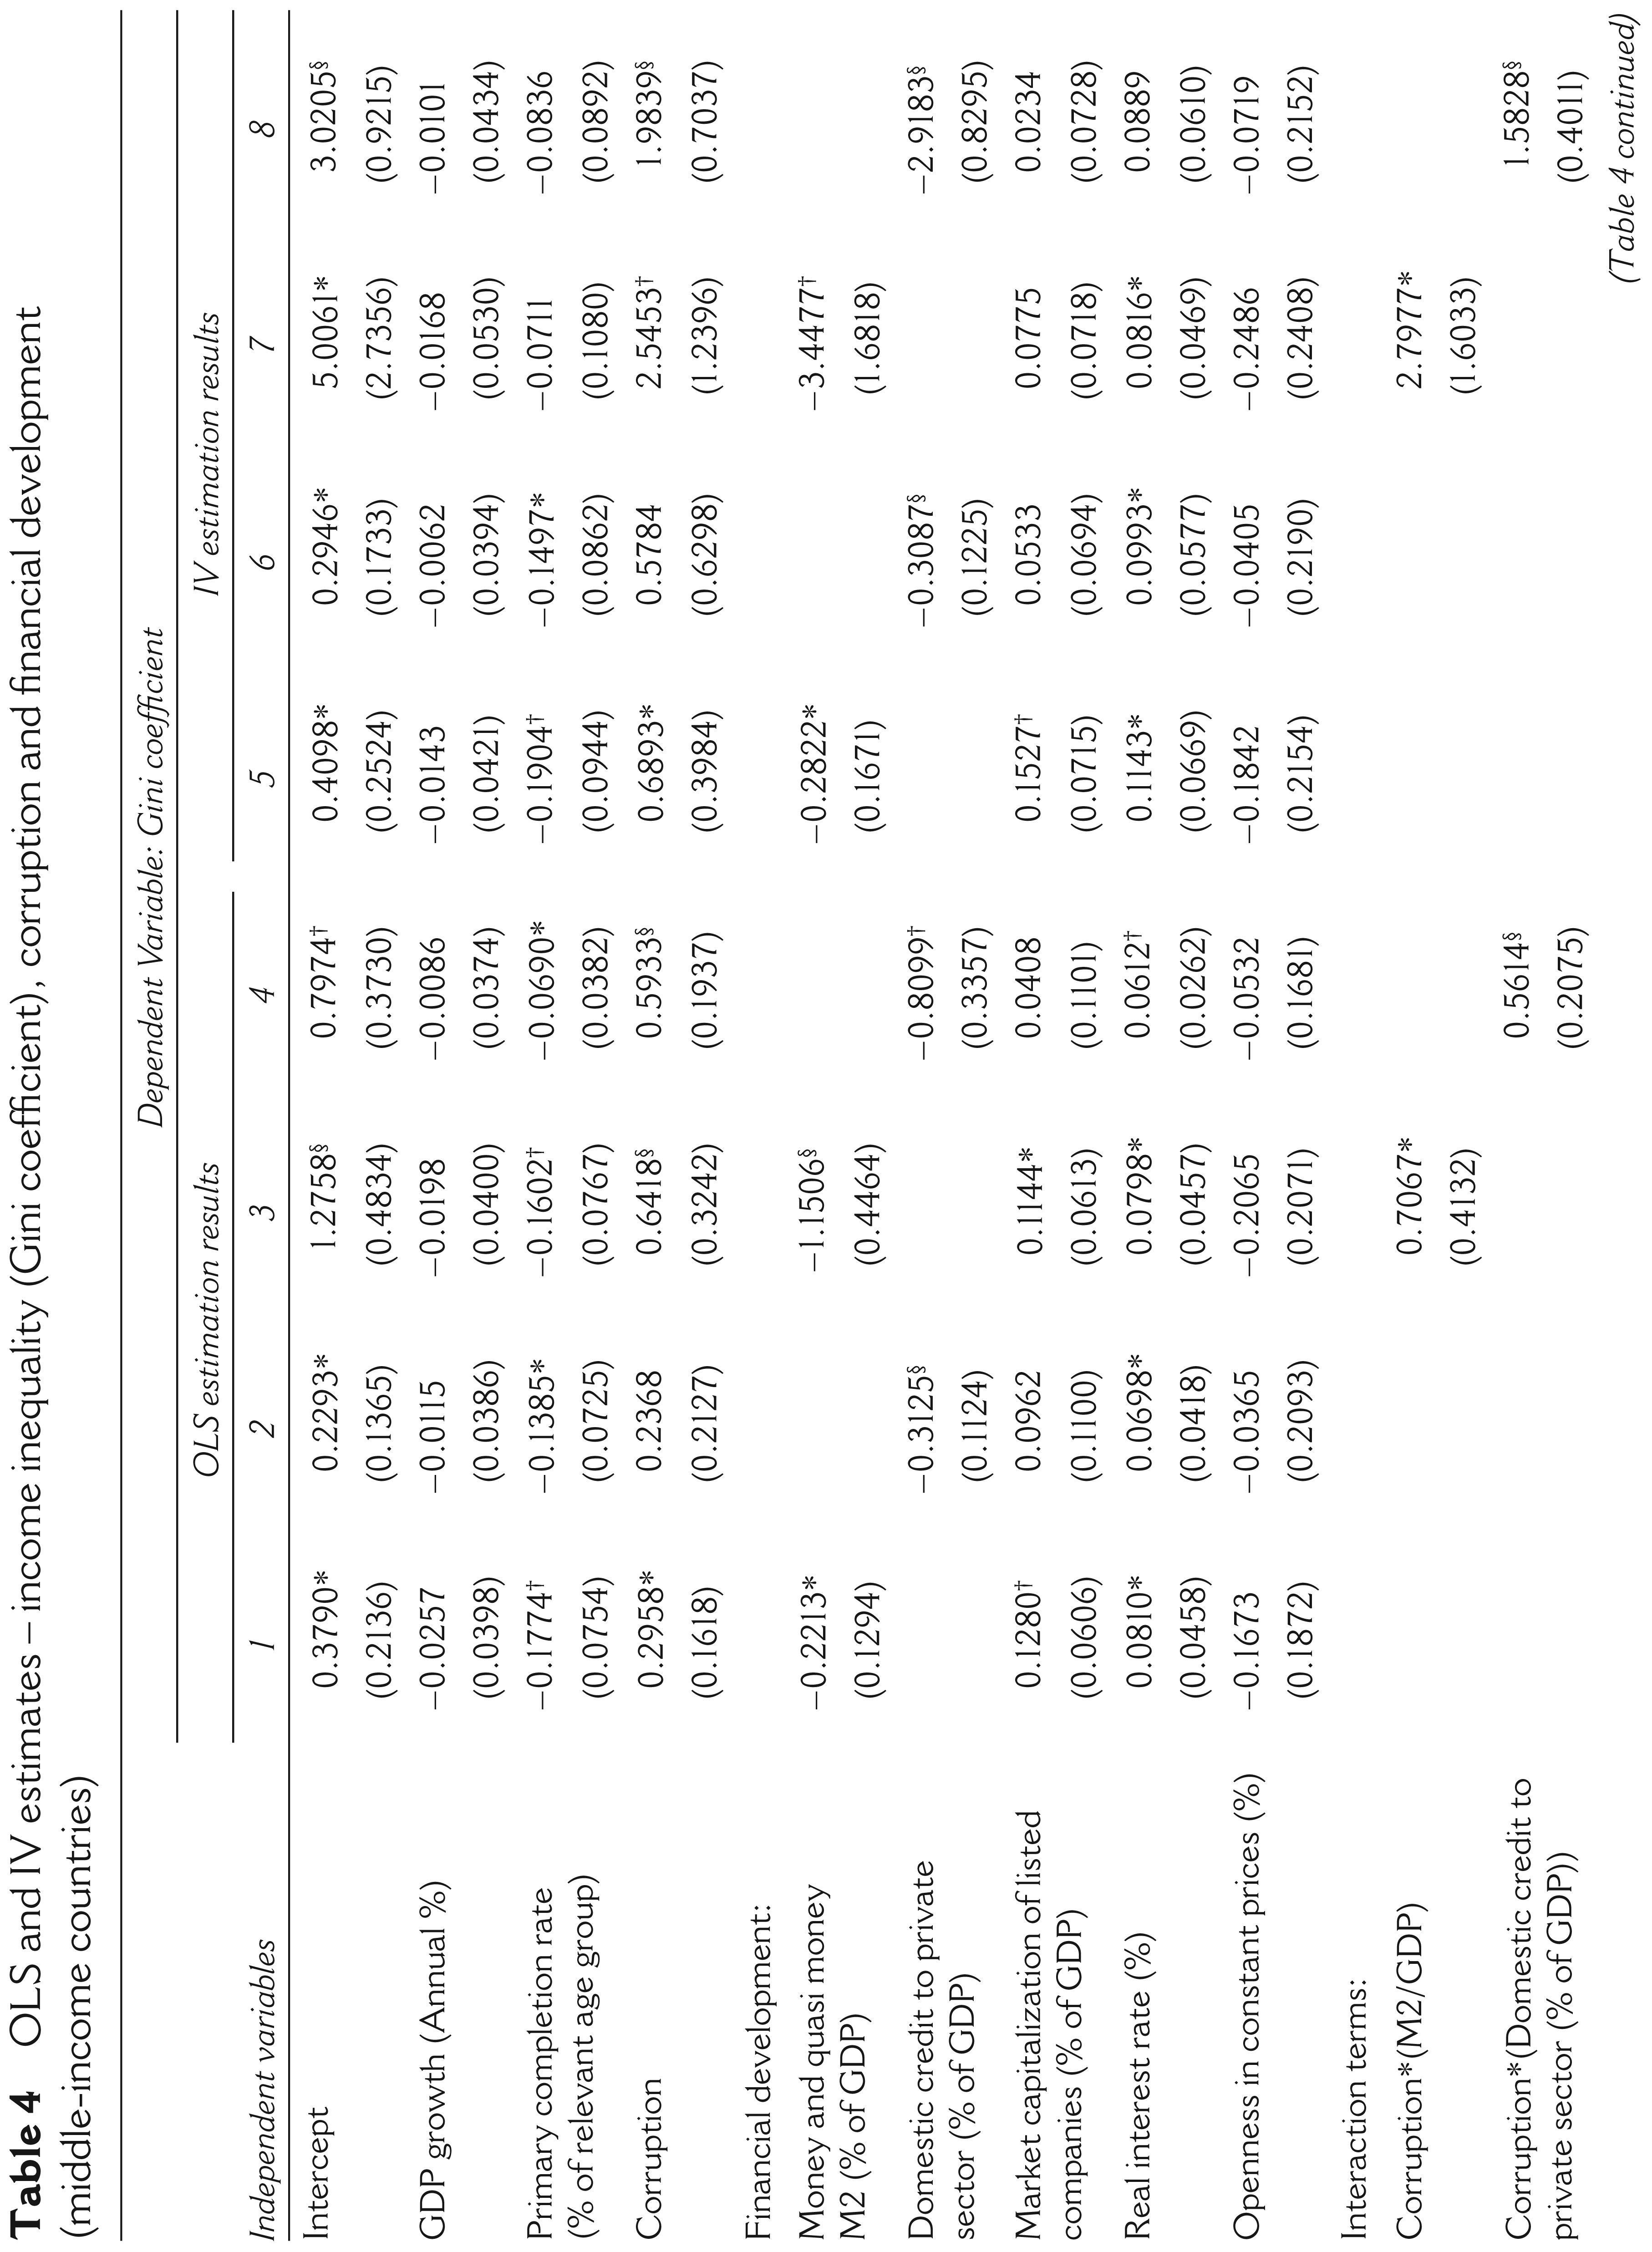
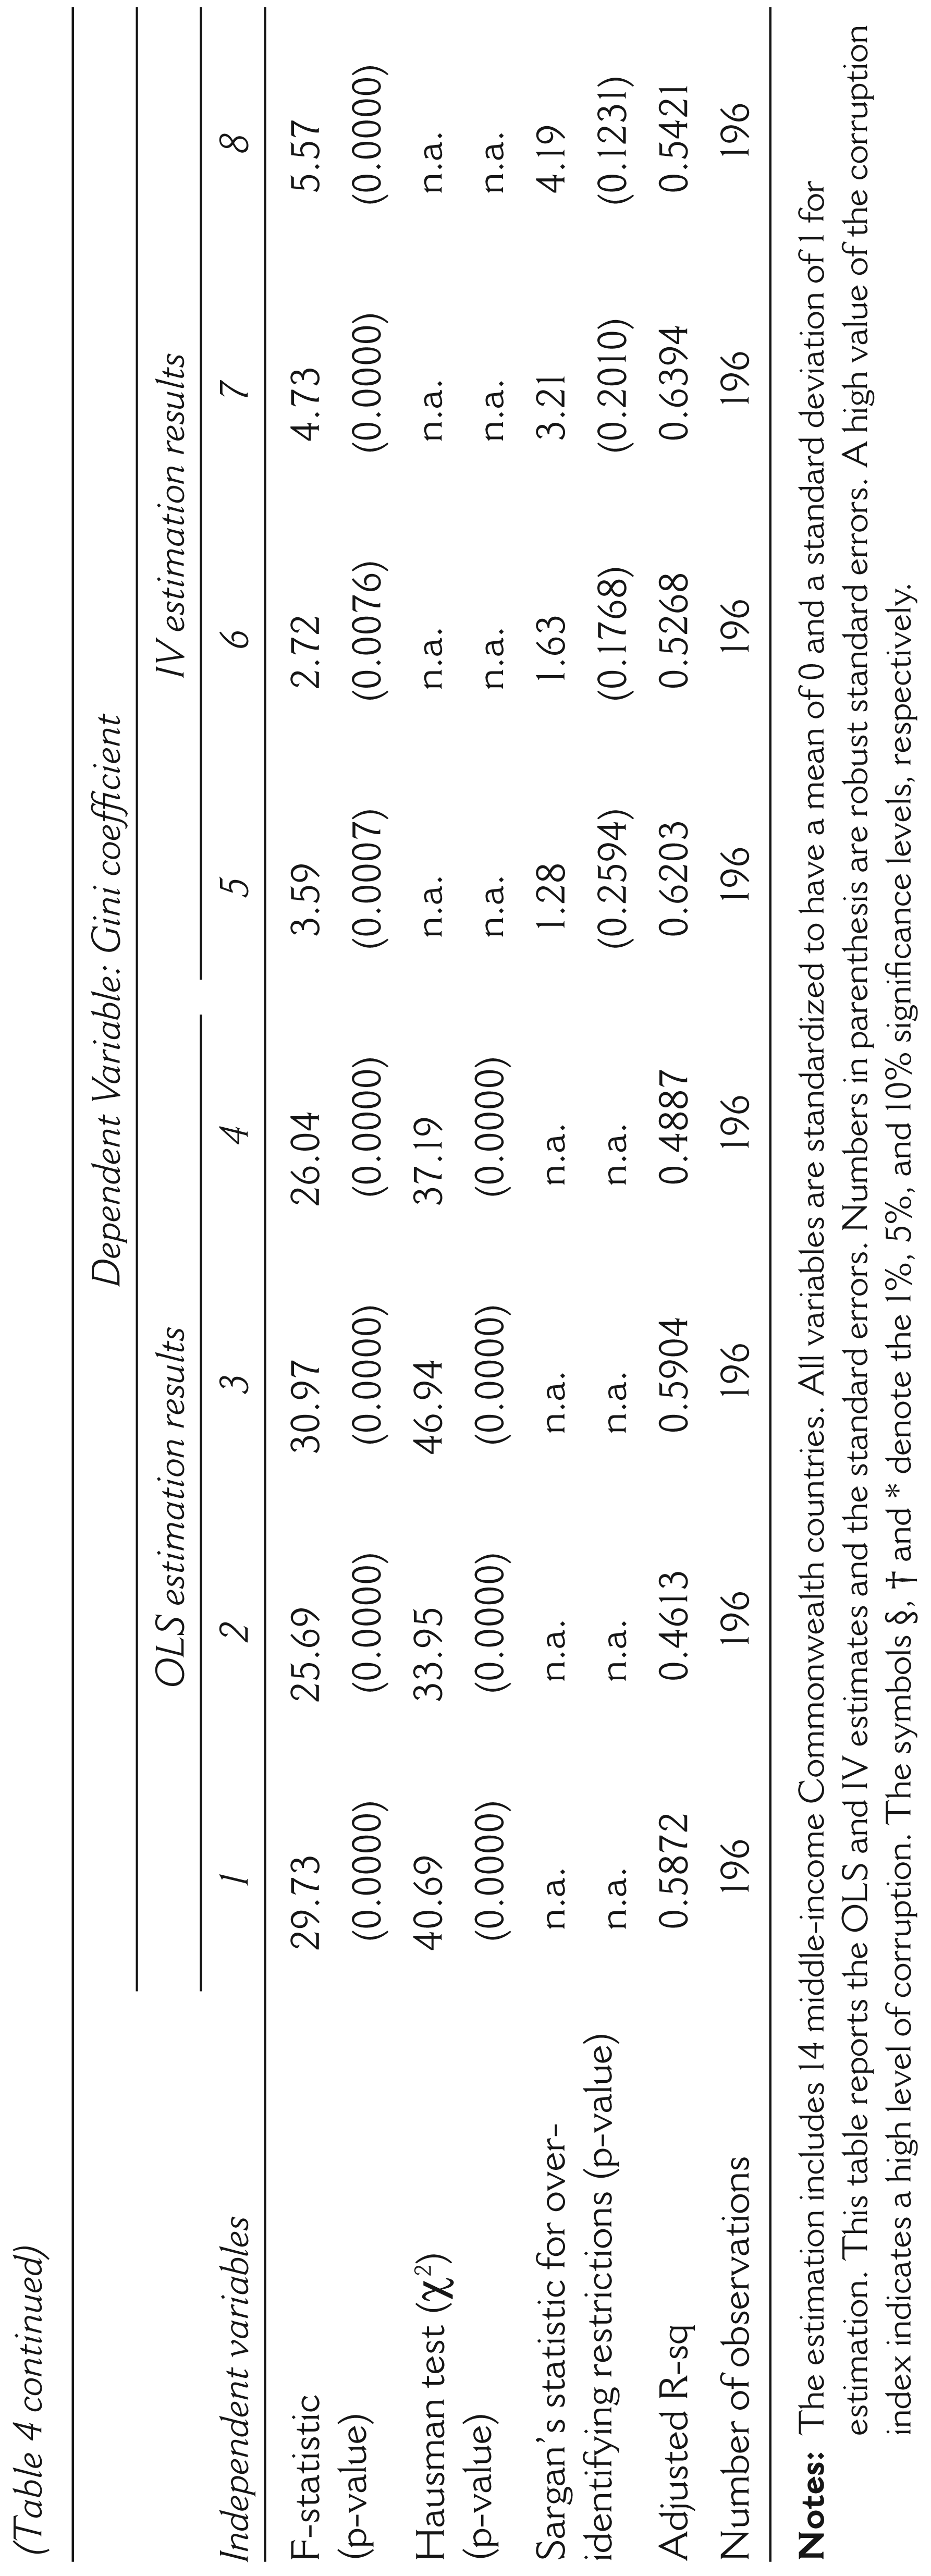
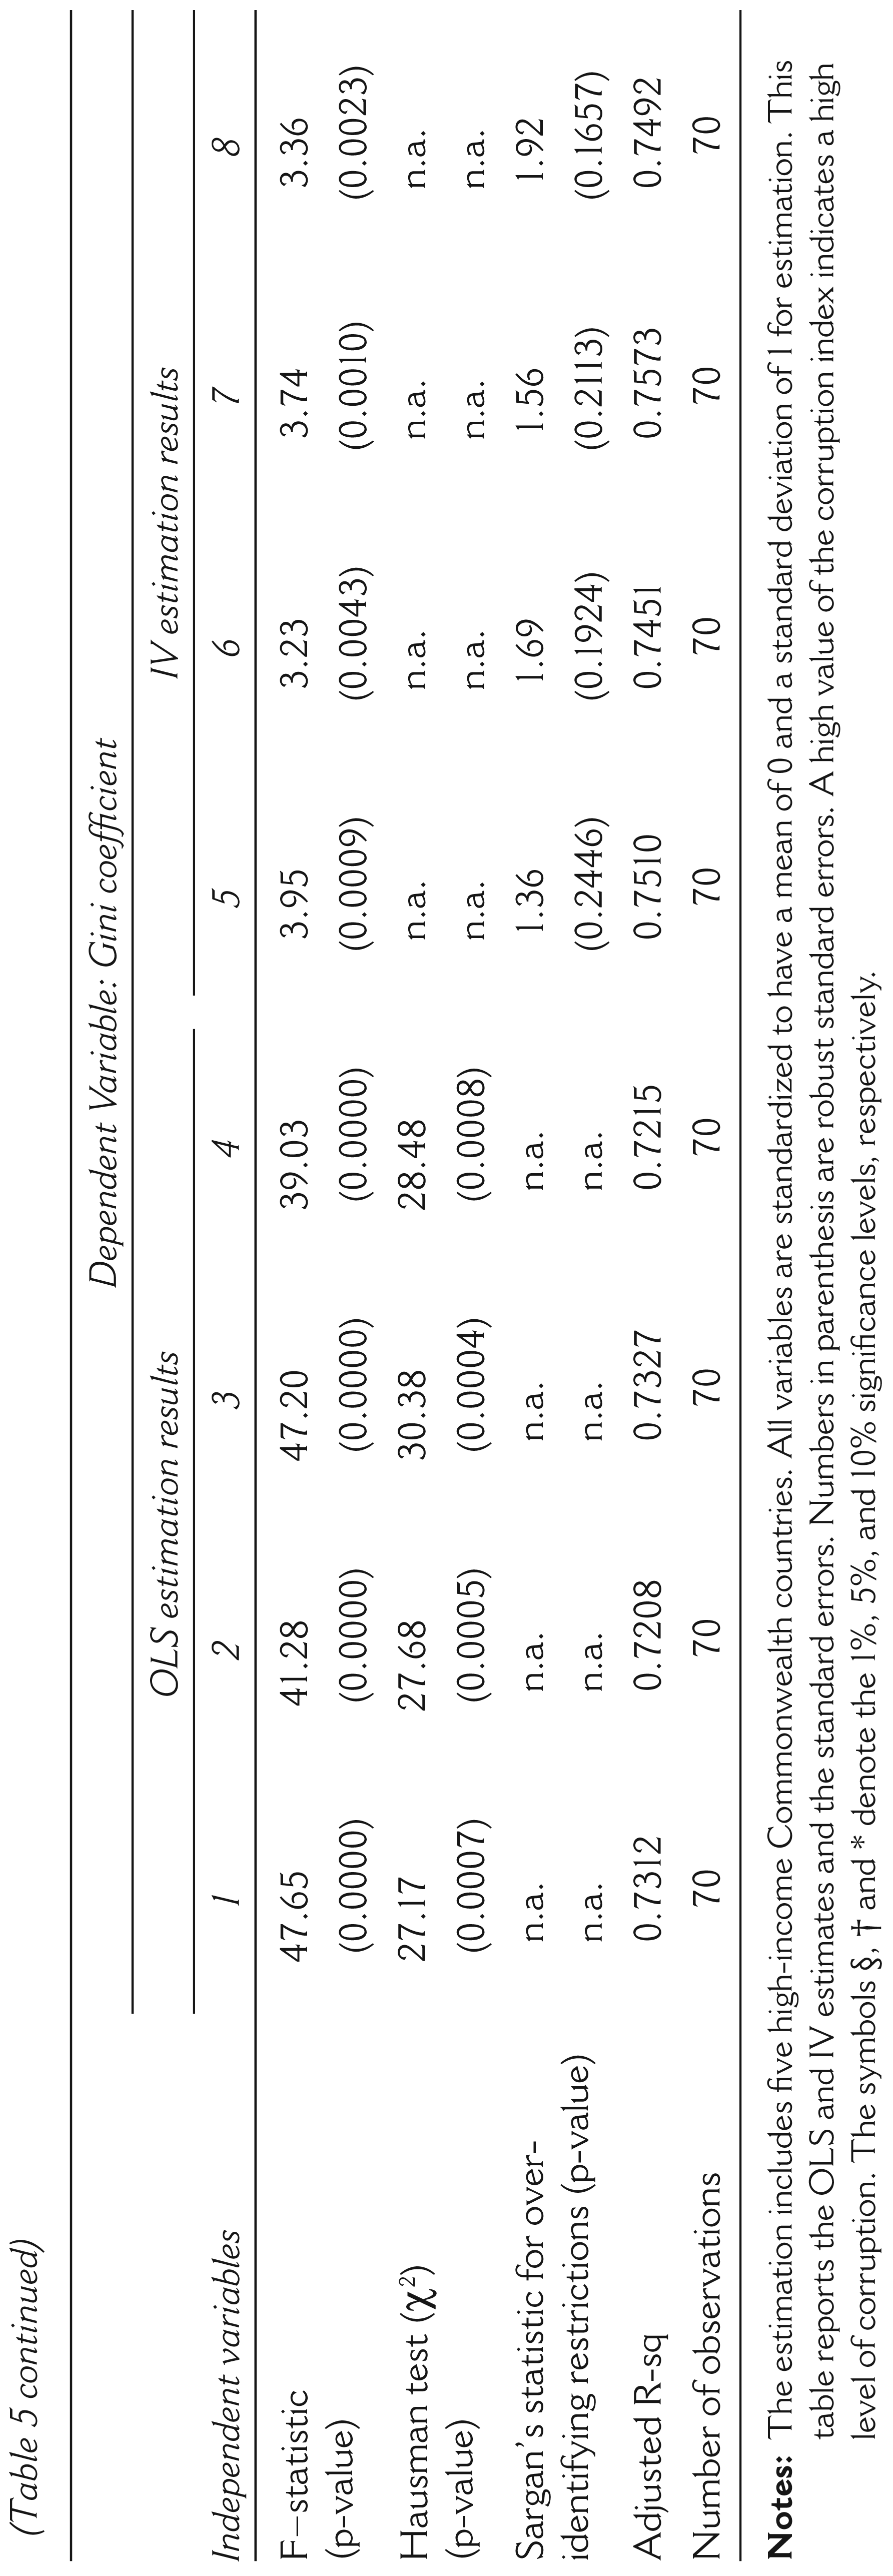
Tables 3–5 report the OLS and IV estimation results with and without interaction terms for corruption and financial development for low-, middle- and high-income countries, respectively. The IV technique addresses the endogeneity of the corruption variable. The income inequality regression is estimated using four specifications. In the first one, the Gini coefficient is regressed on a constant, GDP growth, primary completion rate, corruption index and the ratio of M2 to nominal GDP, market capitalization of listed companies, real interest rate and openness. In the second specification, the ratio of M2 to nominal GDP is replaced with domestic credit to the private sector as a share of GDP. The third specification includes all variables in the first specification plus an interaction term between corruption and the ratio of M2 to nominal GDP. Similarly, the fourth specification includes all variables in the second specification plus an interaction term between corruption and domestic credit to the private sector as a share of GDP.
Tables 3–5 (columns 1–4) report the results for all these four specifications for the OLS technique. The results suggest that countries with low GDP growth and low primary completion rate are associated with high income inequality. The signs of market capitalization of listed companies, real interest rate and openness vary with the income levels of the countries. Higher income inequality tends to be associated with a higher percentage of market capitalization of listed companies as a share of GDP for the middle- and high-income countries whereas just the opposite holds for the low-income countries. The low- and high-income countries with a higher percentage of openness and low real interest rates are associated with higher income inequality, even though coefficients are not significant at the conventional statistical levels in many cases.
As regards the impact of corruption on income inequality, higher corruption is associated with higher income inequality. The coefficients of corruption are always positive and statistically significant in almost all of the specifications. The higher the corruption index, (higher corruption), the higher is the inequality. This result supports the earlier findings of Gupta et al. (2002).
The signs of the two financial development variables are always negative and significant, indicating that the higher the ratio of M2 to nominal GDP or domestic credit to the private sector as a share of GDP, the lower the inequality irrespective of the income level of the countries. Therefore, it is evident from the results that emergence of better-developed financial markets and intermediaries in many middle- and low-income Commonwealth countries, have assisted these countries to reduce income inequalities. These results support the previous findings of Banerjee and Newman (1993), Galor and Zeira (1993) and Clarke et al. (2003).
The results show that financial sector development negatively influences income inequality, though its impacts on inequality are dramatically reversed in the presence of massive corruption by the public officials, civil servants, or politicians in many low- and middle-income countries. For example, greater financial development is associated with significantly lower income inequality, but when corruption intervenes, income inequality is exacerbated, negating the benefits of financial development.
OLS and IV estimates – income inequality (Gini coefficient), corruption and financial development (low-income countries)


OLS and IV estimates – income inequality (Gini coefficient), corruption and financial development (low-income countries)
OLS and IV estimates – income inequality (Gini coefficient), corruption and financial development (middle-income countries)
OLS and IV estimates – income inequality (Gini coefficient), corruption and financial development (high-income countries)

The OLS regression results establish the existence of a statistically significant positive association between corruption and income inequality. However, this association could stem from reverse causation, that is, high income inequality can lead to higher corruption and/or the observed association could be due to other factors affecting both. The IV technique can help to address these problems. Therefore, the choice of the instrument is important. A valid instrument for the corruption should be highly correlated with it, but not correlated with the error term in the income inequality regression or the income inequality itself (the Gini coefficient) other than its impact on the Gini coefficient through the corruption index.
Following Gupta et al. (2002) and Dobson and Ramlogan-Dobson (2010), democracy and ratio of government final consumption expenditure to GDP are used as the instruments for corruption. Treisman (2000) finds a variable measuring length of exposure to democracy to be a robust determinant of corruption. In addition, democracy is not associated with income inequality, as shown by Barro (1999). Therefore, democracy seems to be a good instrument for corruption. The democracy variable used in this article is taken from the Polity IV database of the Center for Systemic Peace (CSP). Countries with high values on the democracy indicator are perceived to be less corrupt. The impact of corruption may also increase with the scale of government intervention in the economy. In this regard, the ratio of government final consumption expenditure to GDP is used as the other instrument of corruption. Data for the ratio of government final consumption expenditure is taken from the World Development Economic Policy & External Debt Indicator of the World Bank.
The results of the IV technique using democracy and ratio of government final consumption expenditure to GDP as the instruments are shown in columns 5–8 of Tables 3–5 for the same specification as in the OLS regression. Results are much stronger than the OLS version: significance and magnitude of the estimated coefficient on corruption, financial development and their joint effects increase in all the specifications.
The point estimates suggest that a worsening in the corruption index of the low- and middle-income countries by one standard deviation (sd) decreases income inequality by about 1.6–2.6 sds (see Tables 3–4, columns 7–8), from the mean value, at the average values of the respective financial development indicators.
Similarly, the point estimates suggest that an improvement in the financial infrastructure development of the low-income countries by one sd, decreases income inequality by about 3 sds (see Table 3, column 7) or 6 sds (see Table 3, column 8) from the mean value, when the average value of the corruption (CPI) is 2.65. An increase of one sd in financial development of the middle-income countries decreases income inequality by about 3 sds (see Table 4, columns 7–8), when the average value of the corruption (CPI) is 3.21.
The individual effects of corruption and financial development on income inequality tend to be the lowest in the high-income countries compared to the low- or middle-income countries. The chosen instruments are valid at the conventional statistical levels in all regressions as judged by Sargan’s test of over-identifying restrictions. 12
Interaction terms
In general, the results indicate that a worsening corruption index or an improvement in the financial infrastructure development separately leads to lower income inequality. When interacted, the results indicate the complementary nature of the relationship between corruption and financial development in influencing income inequality – at the level of higher corruption, the marginal impact of greater financial development exacerbates income inequality rather than reducing it. This finding has significant policy implications for many low- and middle-income countries.
Corruption discourages financial sector development – because bribes, kickbacks and other forms of illicit payments to get financial services increase uncertainty and reduce profitability. Additionally, financial market imperfections, asymmetric information regarding availability of financial services are likely to affect disproportionately the poor more than the rich, especially given that the poor have less diversified sources of income. Rajan and Zingales (2003) argue that improvements in the formal financial sector primarily benefit the rich as the poor may be incapacitated when they do not have access to finance.
The interaction terms of corruption and financial development are all positive and significant irrespective of the income levels of the countries. More specifically, positive interactions terms reveal that return to financial development depend on the level of corruption. Therefore, policies to reduce corruption and boost financial development should be complementary in nature especially for the low- and middle-income countries. This result is more important given the moderate correlation between corruption and financial development, which leaves less variation in estimating the relationship.
For low-income countries with corruption (CPI) 2 sds above the mean, an increase in financial development by one sd, increases income inequality by about 2.5 sds (see Table 3, column 7) or 1 sd (see Table 3, column 8) from the mean value. Similarly, if corruption (CPI) is 2 sds above its mean value, an increase of one sd in financial development of the middle-income countries increases income inequality by about 2.1 sds (see Table 4, column 7) or 0.25 sds (see Table 4, column 8) from the mean value.
The high-income countries with corruption (CPI) 2 sds above the mean, an increase in financial development by one sd, decreases income inequality by about 0.2 sds (see Table 3, column 7) or 0.9 sd (see Table 3, column 8) from the mean value. These high-income countries already have a well-developed financial sector. The financial sector of these countries is dominated by capital market. Therefore, return to financial development, at the level of higher corruption, on income inequality is different in high-income countries compared to low- and middle-income countries. Higher corruption in high-income countries do not crowd out the full benefits of financial development in reducing income inequality in every instance as there are structural differences of the financial sector formulation in high-income countries as opposed to low- and middle-income countries.
These estimates confirm that the return to financial development are higher for those countries with lower corruption. The adverse effects of corruption, in reversing the benefits financial sector development on income inequality, are higher for the low- and middle-income countries compared to the high-income countries. Eradicating corruption is a challenging task, especially because it is a systemic phenomenon that exhibits a strong tendency for hysteresis. The results suggest that in order to realize the benefits from the growthspurring effects of financial sector development in reducing inequality, these countries should establish norms to curb corruption of government officials in the public domain with proper institutional reform, to enforce contracts and property rights, to minimize transaction costs, to simplify tax and tariff schedules, to build strong legal frameworks with independent judiciaries and to cut bureaucratic red tape for efficient decision-making.
Concluding remarks
This article is one of the first attempts to study the interactive effects of corruption and financial development on income inequality in 30 Commonwealth countries over the sample period of 1995–2008. Financial development is measured by the ratio of M2 to nominal GDP and domestic credit to the private sector as a share of GDP. The results from the OLS and IV estimations suggest that lower corruption or greater financial development, individually, leads to lower levels of income inequality. The return to financial development at the level of higher corruption impair income inequality, suggesting that combining policies that simultaneously reduce corruption and promote financial development will have a greater impact in reducing income inequality than implementing these policies separately. For example, effective anti-corruption legislation, especially in the public domain, will ensure that the potential of financial development to improve income equality is fully realized. On the other hand, absence of such measures will partially, if not fully, compromise such potential.
In recent years, many middle- and low-income Commonwealth countries, for example, Malaysia, India, South Africa, Guyana, Bangladesh, Kenya, Ghana, Zambia, Nigeria and Tanzania, have seen improvements in financial sector by establishing stronger institutions. Overall, results in this study suggest that the growth-spurring effects of financial intermediary development are likely to be associated with positive effects on aggregate income distribution. The deterring effect of corruption, however, appears to erode the benefits of financial development in reducing income inequality. Countries with growing financial sectors need to establish checks and balances and the rule of law, among other things, for effective monitoring of corruption, particularly in the public sector.
Appendix
Definitions and sources of the variables in the database
Gini coefficient: The Gini coefficient is a measure of income inequality. It measures the extent to which the distribution of income (or, in some cases, consumption expenditure) among individuals or households within an economy deviates from a perfectly equal distribution. A value of 0 represents perfect equality, while an index of 100 implies perfect inequality.
Source: World Development Indicators, Poverty, World Bank; Trading Economics.
GDP growth (Annual percentage): Annual percentage growth rate of GDP at market prices based on constant local currency. Aggregates are based on constant 2000 US dollars. GDP is the sum of gross value added by all resident producers in the economy plus any product taxes and minus any subsidies not included in the value of the products. It is calculated without making deductions for depreciation of fabricated assets or for depletion and degradation of natural resources.
Source: World Bank national accounts data; and OECD National Accounts data files.
Primary completion rate (percentage of relevant age group): Primary completion rate is the percentage of students completing the last year of primary school. It is calculated by taking the total number of students in the last grade of primary school, minus the number of repeaters in that grade, divided by the total number of children of official graduation age.
Source: United Nations Educational, Scientific and Cultural Organization (UNESCO) Institute for Statistics.
Corruption (CPI score): The Transparency International defines corruption as the abuse of entrusted power for private gain. The CPI is an aggregate indicator that ranks countries in terms of the degree to which corruption is perceived to exist among public officials, civil servants or politicians. It is a composite index, drawing on corruption-related data in expert surveys carried out by a variety of reputable institutions. The CPI ranking run on a scale is from 10 (highly clean) to 0 (highly corrupt).
Source: Transparency International.
Money and quasi money (M2) as percentage of GDP: Money and quasi money comprise the sum of currency outside banks, demand deposits other than those of the central government, and the time, savings and foreign currency deposits of resident sectors other than the central government. This definition of money supply is frequently called M2; it corresponds to lines 34 and 35 in the International Monetary Fund’s (IMF) International Financial Statistics (IFS).
Source: International Monetary Fund, International Financial Statistics and data files; World Bank; and OECD GDP estimates.
Domestic credit to private sector (percentage of GDP): Domestic credit to private sector refers to financial resources provided to the private sector, such as through loans, purchases of non-equity securities, and trade credits and other accounts receivable, that establish a claim for repayment. For some countries these claims include credit to public enterprises.
Source: World Development Indicators and Global Development Finance, World Bank.
Democracy: Institutionalized democracy is conceived as three essential, interdependent elements. One is the presence of institutions and procedures through which citizens can express effective preferences about alternative policies and leaders. Second is the existence of institutionalized constraints on the exercise of power by the executive. Third is the guarantee of civil liberties to all citizens in their daily lives and in acts of political participation. The democracy indicator is an additive eleven-point scale 0 (autocracy)–10 (full democracy).
Source: Polity IV Project, Political Regime Characteristics and Transitions, 1800–2010, Center for Systemic Peace (CSP).
General government final consumption expenditure (percentage of GDP): General government final consumption expenditure includes all government current expenditures for purchases of goods and services (including compensation of employees). It also includes most expenditure on national defence and security, but excludes government military expenditures that are part of government capital formation.
Source: World Development (Economic Policy & External Debt) Indicator, World Bank.
Market capitalization of listed companies (percentage of GDP): Market capitalization (also known as market value) is the share price times the number of shares outstanding. Listed domestic companies are the domestically incorporated companies listed on the country’s stock exchanges at the end of the year. Listed companies do not include investment companies, mutual funds, or other collective investment vehicles.
Source: Standard & Poor’s; Global Stock Markets Factbook; World Bank; and OECD GDP estimates.
Real interest rate (percent): Real interest rate is the lending interest rate adjusted for inflation as measured by the GDP deflator.
Source: International Monetary Fund, International Financial Statistics and data files using World Bank data on the GDP deflator.
Openness in Constant Prices (percentage): The extent to which an economy is open to trade, and sometimes also to inflows and outflows of international investment. Openness is calculated at 2005 constant prices (percentage).
Source: Pen World Table 7.0.
List of countries in the database
Low-income countries: Bangladesh, Gambia, Ghana, Kenya, Malawi, Mozambique, Sierra Leon, Tanzania, Uganda, Zambia and Zimbabwe.
Middle-income countries: Belize, Cameroon, Guyana, India, Jamaica, Lesotho, Malaysia, Maldives, Nigeria, Pakistan, Papua New Guinea, South Africa, Sri Lanka and Swaziland.
High-income countries: Australia, Canada, Cyprus, New Zealand and Singapore.
Footnotes
Acknowledgements
The authors gratefully acknowledge comments by Anthony Pennington-Cross, Keith Bender, James Peoples, the editor, two anonymous referees and the participants of Allied Social Science Associations, Annual Meeting, San Diego, CA, 2013 for their helpful comments.