



Abstract
This article presents a new survey of Members of the European Parliament (MEPs) conducted during 2015, which adds to a time series of MEP surveys carried out by the European Parliament Research Group. The data allow for comparison of MEPs’ views with those of the EU public, European Parliament candidates, and members of national and regional parliaments in Europe. The survey includes questions on topical issues, such as intra-EU migration and the UK–EU relationship. The dataset can be used to address a range of research questions concerning MEPs’ preferences and representation. This article presents details of the 2015 MEP survey and uses the data to assess what explains MEPs’ attitudes to the question of whether all EP plenary sessions should be held in Brussels.
Introduction
This article presents a new survey of Members of the European Parliament (MEPs), which adds to a time series of MEP surveys carried out by the European Parliament Research Group (EPRG). The data from this new survey (available at www.mepsurvey.eu) are comparable with elements of the European Election Voter and Candidate Studies (Schmitt et al., 2015), a major survey of national and regional parliamentarians (Deschouwer and Depauw, 2014) and with large parts of previous EPRG MEP surveys. The survey also includes new questions on topical issues, such as intra-EU migration, the UK’s relationship with the EU and the Spitzenkandidaten process. As a result, the dataset can be used to address a range of research questions concerning MEPs’ preferences and the relationship between these and citizens’ and national legislators’ positions. These questions are of critical importance at a time when the EU is under pressure amid economic crisis, Brexit and declining trust in EU institutions (Hobolt, 2015).
Up-to-date data on MEPs’ attitudes are particularly useful given the significant changes in the European Parliament’s party group system since the 2014 elections. Among other things, the soft Eurosceptic (Taggart and Szczerbiak, 2008) European Conservatives and Reformists (ECR) group pushed the Liberal group (ALDE) out of third place for the first time. In June 2015, the French Front National and several other parties on the radical right formed a new political group, the Europe of Nations and Freedom (ENF). These developments – along with Brexit – open up the possibility of changing patterns of coalition formation in the Parliament. MEPs’ failure to reach a majority on the European Commission’s work programme in January 2015 showed how difficult it may be to maintain the ‘grand coalition’ that appeared to dominate the first six months of the 2014–2019 term, or to form alternative majorities in the remainder of the term, especially as more contentious subjects reach the agenda. Amid growing numbers of Eurosceptic MEPs, it is more important than ever to understand what MEPs think about EU policies and the integration process. Examining the numbers of MEPs from different national parties or using roll-call vote data can only tell us so much about MEPs’ views. Survey data enhance our ability to study MEPs by providing a measure of preferences at the individual level, which is exogenous of parties and particular votes, unlike revealed preferences measured via roll-call votes. Indeed, measures of left-right and European integration self-placement have been among the most widely used of the variables from previous waves of the EPRG MEP surveys in publications citing the data.
MEPs have been surveyed in each term of the European Parliament since the first direct elections in 1979 as follows:
1979–1984 Parliament by Reif and Wildenman (e.g. Bardi, 1989; Westlake, 1994); 1984–1989 Parliament by Hrbek and Schweitzer (Hrbek and Schweitzer, 1989); 1989–1994 Parliament by Bowler and Farrell (Bowler and Farrell, 1993); 1994–1999 Parliament by Wessels (e.g. Katz and Wessels, 1999; Schmitt and Thomassen, 1999); 1999–2004 Parliament by Hix, for EPRG (e.g. Hix, 2002; Scully, 2005); 2004–2009 Parliament by Hix, Farrell and Scully, for EPRG (e.g. Farrell and Scully, 2007); and 2009–2014 Parliament by Hix, Farrell and Scully for EPRG (Hix et al., 2011).
Data from previous waves of the EPRG MEP survey have been requested by researchers and students from over 150 institutions in 29 countries and have been cited in numerous journal articles and books. This article introduces the most recent MEP survey and its value in combination with previous waves and other survey data with which it is comparable. In an example of how the data can be used, we find that practical concerns about travel time help to explain why some MEPs favour holding plenaries only in Brussels more than others. We conclude by summarising the benefits of these new data and the research questions that can be addressed with them.
Survey design and implementation
Our survey builds directly on the previous three EPRG surveys, which gives a data series for the years 2000, 2006, 2010 and 2015. This will allow researchers to examine how the behaviour and attitudes of MEPs have changed in response to changing circumstances, such as the gradual increase in institutional powers of the Parliament, the successive enlargements of the EU, the economic crisis and the increase in public and party-based Euroscepticism.
The 2015 questionnaire, as with previous waves, was translated into official languages of the EU (for details of the translation process, see the Online Appendix). The survey was distributed via a web-based survey provider – Survey Monkey – to all 751 MEPs. All emails were sent out in the MEPs’ native languages. The first respondent completed the survey on 25 April 2015. Email reminders were then sent out monthly from June to December 2015 to all MEPs who had not yet completed the survey.
While the primary mode of data collection for the 2015 survey was internet-based, we also used face-to-face interviews and mailed surveys. This three-pronged strategy was designed with the goal of maximising response rates. The growth in the European Parliament’s legislative role has led to greater interest among researchers. Consequently, MEPs, like many national parliamentarians (Deschouwer et al., 2014: 9), receive a higher number of survey or interview requests. Hence, we used three data collection modes to achieve as many responses as possible. Multi-mode approaches have been employed in similar surveys of elites, such as the 2009 European Election Candidate study (Wessels, 2011), which used mailed questionnaires and a web-based survey. The PartiRep survey of national and regional parliamentarians (Deschouwer and Depauw, 2014) was web-based but also employed mail, telephone and face-to-face interviewing. Data for the Religion at the European Parliament survey (Foret, 2014) were gathered by face-to-face, telephone and online modes.
We used randomised block sampling to select MEPs for the face-to-face interview requests and mailed surveys. Blocks were defined as member state delegations within political groups. We prioritised those blocks that were most under-represented from our online respondents. Random samples were drawn from MEPs within these blocks who had not yet responded to the survey. Where they were used, hard copies of the questionnaire were distributed in MEPs’ native languages. We conducted face-to-face interviews in a subset of languages in which researchers affiliated to the project were fluent. 1
Since survey researchers have long stipulated that each mode of survey implementation has its own set of advantages and drawbacks, the dataset includes a clear indication of how each response was collected. Overall, online responses constitute the bulk of the data, with the mailed and face-to-face responses only comprising a small fraction. Of 227 responses, 25 have been acquired through face-to-face interviews and five through mailed surveys. The remaining 197 responses come from the web-based survey.
EPRG survey samples compared.

Notes: These data are available at www.mepsurvey.eu.
The (Duncan) Index of dissimilarity measures the relationship between the sample of MEPs who responded to the surveys and the population of MEPs at the time of the surveys. Lower values on this measure indicate a greater similarity between the sample and the population (Duncan and Duncan, 1955). The Duncan Index (DI) is calculated as follows:
where pi = the proportion of all seats in the EP allocated to member state or party group i and si = the proportion of respondents in the sample from member state or party group i.
Setting the research agenda
The 2015 survey was carefully designed to generate data comparable with previous MEP surveys as well as other surveys of parliamentarians, MEP candidates and voters, thereby opening up a wide research agenda, which we set out in this section. For clarity, Table A1, in the Online Appendix sets out variables included in each of the four waves of MEP surveys. Further attitudinal questions have been included in the most recent three waves as shown in Table A1. The 2015 survey included a total of 37 questions across four sections: background, career and elections, representation and contacts, legislative behaviour and political attitudes. The entire 2015 questionnaire is reproduced in the Online Appendix.
These new data make a significant contribution by offering researchers an opportunity to examine changes in MEPs’ attitudes over time, as well as the determinants of these views. After a thorough analysis of research employing the EPRG’s MEP surveys, we ensured that the most frequently used questions from previous waves were preserved in the most recent questionnaire. With the 2015 survey, we now have measures at four time points – from 2000 to 2015 – of a wide range of variables, including MEPs’ views of representation, the importance of various aspects of their work, frequency of contact with particular interest groups, sources of vote recommendations, reasons for committee choice, positions on left-right and European integration policy dimensions, as well as attitudes to a range of EU policies and the powers of the European Parliament. This will allow scholars to explore how major external events have shaped the evolution of the European Parliament over a 15-year period. Previous waves of the survey, for example, have generated some of the first systematic assessments of whether and how EU enlargement affected the ideological outlook, decision-making culture and policy views of the European Parliament. After the release of the new wave, researchers can do the same with respect to recent challenges to European integration such as the Eurozone crisis.
The 2015 MEP survey data also allow for comparisons with national parliamentarians, European Parliament candidates and citizens. On the first of these, the 2015 survey includes some of the same questions as appeared on the PartiRep survey of MPs in 15 national parliaments (Deschouwer and Depauw, 2014). 2 This allows for comparisons of national and European parliamentarians’ positions on left-right and European integration dimensions as well as their attitudes to some policies. Differences between MEPs and members of national parliaments on European integration have received limited attention in the past. Previous studies have shown MEPs to be slightly more pro-integration than national MPs (e.g. Katz, 2008: 157–159). However, greater success for Eurosceptic parties in European elections may have pushed mainstream MEPs to a more EU-critical position. Researchers can now test this proposition. Table A2, in the Online Appendix, sets out areas in which the same questions were asked on the MEP 2015 survey as on other surveys.
The question of how well citizens’ views are represented in the European Parliament is central to the debate about the democratic deficit in EU institutions (Føllesdal and Hix, 2006; Farrell and Scully, 2007). It is also critical at a time when support for European integration is declining and Eurosceptic parties (on both the right and the left) are gaining support in many EU member states. Our 2015 MEP survey includes some questions asked on the 2014 European Election Voter Study (EEVS) (Schmitt et al., 2015). Researchers can therefore compare responses to the same questions asked of MEPs and of citizens. Vasilopoulou and Gattermann (2013) assessed voter-MEP congruence on four issues using the 2010 MEP survey and EEVS data. Our 2015 wave builds upon the needs of this growing research agenda on representation and includes a large section on policy and ideological views. For example, with the proliferation of public opinion polls on the refugee crisis, future research can compare those with MEPs’ responses to our question about the desirability of a common EU policy on asylum-seekers.
Comparisons between MEPs and the wider pool of candidates for the 2014 European elections can also be made due to a series of questions from the European Election Candidate Study (EECS) that we asked in the 2015 MEP survey. As shown in Table A2, these overlapping questions include not only attitudes to EU policies and the European Parliament’s powers, but also campaign techniques and aims. This will allow for comparisons of successful and unsuccessful candidates in the 2014 European elections on a range of variables for those countries covered by the EECS. Researchers will be able to build predictive models as to what determines candidate success in EP elections – are institutional, party-level or individual-level factors most important? While institutional and party-level data can be acquired through pre-existing sources, the MEP survey, in combination with the EECS, supplies a vital element in the form of candidate-level data.
The current wave of the survey also contains a series of new questions to account for topical political issues. For example, MEPs were asked for their views on policies towards intra-EU migrants, the Fiscal Compact and the prospective Transatlantic Trade and Investment Partnership treaty (between the EU and the United States). In the light of what was – at the time the surveys went out – a proposed referendum on UK membership of the EU, we asked MEPs for their views on the UK’s future in the EU. We also asked about the process of European political groups nominating candidates for the Commission Presidency in future EU elections (the Spitzenkandidaten process). These questions can be used to compare how MEP’s views on topical issues match their subsequent voting behaviour in the Parliament. Do MEPs vote in line with their preferences or, where there are tensions, in response to party or voter positions? Additionally, in cases where public opinion data are available, research can examine the variation in MEP–citizen policy congruence. Of course, in addition to congruence with individual MEPs, the data allow for creating aggregate position scores where one could examine congruence between citizens and party groups in the EP, or between citizens and member-state delegations in the EP. These can be used to answer the question of how nationality, party loyalty and personal ideology reinforce or contradict each other in shaping the relationship between citizens and their elected representatives in the European Parliament.
Having set out some of the research questions that can be addressed with the MEP 2015 Survey data in combination with others, the next section provides an example analysis – combining all four waves of the survey – assessing MEPs’ preferences on where the EP should hold its plenary meetings.
Using the MEP survey data: Explaining MEPs’ preferences for Brussels compared with Strasbourg
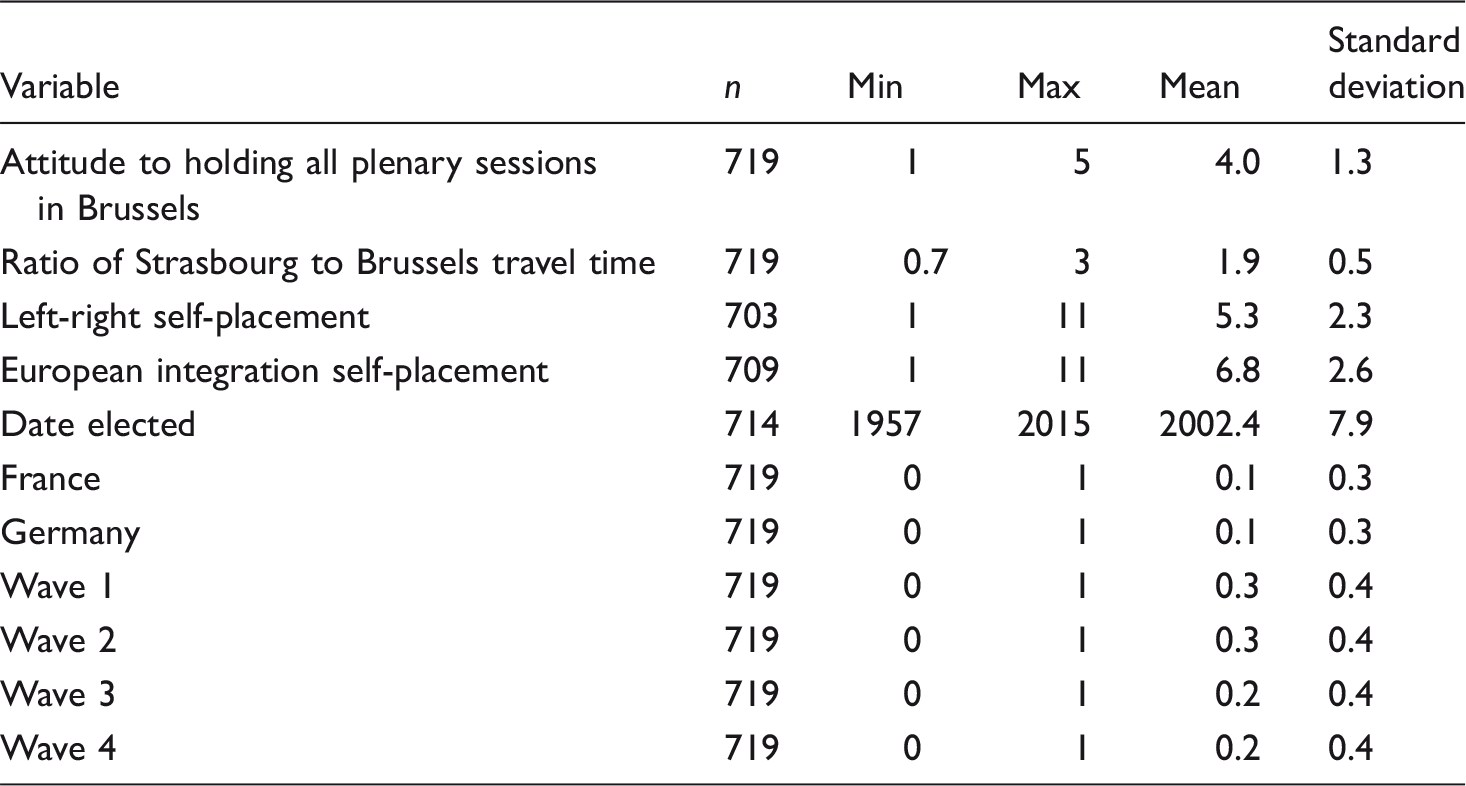
Whether the EP should be allowed to hold all its plenary sessions in Brussels is a divisive issue. For some, the location of the EP in Strasbourg has symbolic importance and should be maintained. For others the cost of transporting legislators and their staff to Strasbourg for 12 plenary sessions each year is wasteful and contributes to a poor public image of the EP (e.g. Mendick, 2014). According to this latter approach, holding all the plenary sessions in Brussels, where party group and committee meetings are normally held, would be far more efficient. In order to assess attitudes to what is often called the ‘single seat’ issue, we use a question included in all four waves of the survey. It asks MEPs to respond on a 5-point scale (running from 5 = strongly agree to 1 = strongly disagree) to the statement ‘The European Parliament should be allowed to hold all its plenary sessions in Brussels.’
Flight times from capital cities to Brussels and Strasbourg (in minutes) and ratios of Strasbourg to Brussels times.

Source: www.google.co.uk/flights.
Note: Times from Luxembourg and Paris to Brussels and Strasbourg are for journeys by train.
Descriptive statistics.
Explaining support for the EP holding all plenary sessions in Brussels (ordinary least squares regressions).
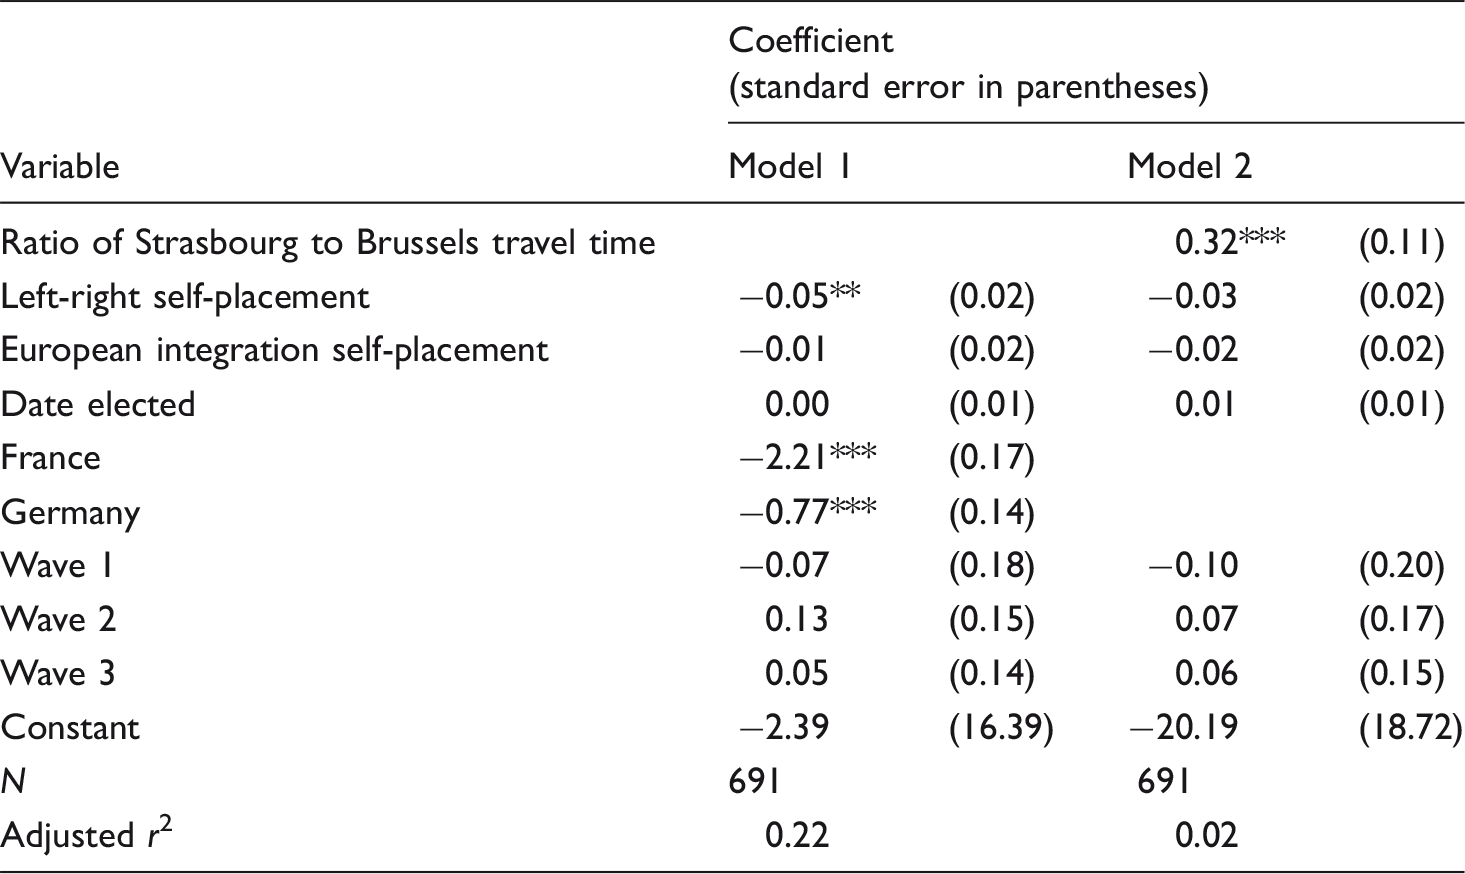
Note: Dependent variable: support for holding all EP plenary sessions in Brussels (question wording ‘To what extent do you agree or disagree with the following statements about the powers of the European Parliament?’ The European Parliament should be allowed to hold all its plenary sessions in Brussels: 1 = disagree strongly, 5 = agree strongly).
p < 0.05, ***p < 0.01.
Model 1 shows that, as expected, French MEPs are much less likely to support a shift away from holding plenaries in Strasbourg. The effect is in the same direction and statistically significant but much smaller for German MEPs. We also find a small effect for being further to the left of the left-right spectrum in this model, indicating that more left-wing positions are associated with lower support for holding all plenaries in Brussels. Model 2 shows that our main independent variable has the expected effect. The higher is the ratio of travel time to Strasbourg compared with Brussels, the higher is support for holding all plenary sessions in the Belgian capital. MEPs’ attitudes to this issue are consistent with a calculation of costs in terms of time. Figure 1 shows this positive relationship graphically and indicates the substantive significance of relative travel time for attitudes. These findings are consistent with a major report on the single seat issue (van Hulten, 2011) based on interviews with MEPs, assistants and EP secretariat staff, which found that monthly travel to Strasbourg induces stress especially when it involves high time costs.
Linear prediction of support for the EP holding all its plenary sessions in Brussels by Strasbourg travel time relative to Brussels (based on model 2).
Our dummy variables for survey waves in both models indicate no statistically significant differences in attitudes on different waves of the survey meaning we cannot infer any changes over time. Our control for date elected also shows no effect in either model so – contrary to our expectations – being an MEP for longer periods does not seem to be associated with higher levels of support for holding all plenaries in Brussels. Rather, attitudes to this issue are explained by national affiliation and a simple measure of the extra time costs incurred in travelling to Strasbourg rather than Brussels. More broadly, these results indicate how the MEP Survey data in combination with other information can be used to address topical questions in the study of the European Union.
Conclusion
In short, our 2015 MEP survey continues a time-series of surveys of MEPs, which now covers four (of the eight) directly elected terms of the European Parliament. This includes periods before and after several major institutional and political developments in the EU, such as the Eastern enlargements in 2004 and 2007, the Lisbon Treaty in 2009, the Eurozone debt crisis in 2009–2013, and the rise of Eurosceptic parties in the European Parliament elections in 2014. With this time series of data, a wide range of questions can be addressed. Also, because we have matched questions in our survey with other datasets, MEPs’ responses on a range of issues can now be compared to the views of the EU public (in the 2014 European Election Voter Study), European Parliament candidates (in the 2014 European Election Candidate Study), and even members of national and regional parliaments in Europe (in the PartiRep survey). This will allow scholars to answer questions about representation, MEPs’ preferences and differences between candidates, members of national parliaments and MEPs on a range of issues
Footnotes
Acknowledgements
The authors are grateful to the journal’s referees and editor for comments on the text.
Funding
The author(s) disclosed receipt of the following financial support for the research, authorship and/or publication of this article: This article draws on research funded by a Leverhulme Research Project Grant, RPG-2014-277.
Notes
References
Supplementary Material
Please find the following supplemental material available below.
For Open Access articles published under a Creative Commons License, all supplemental material carries the same license as the article it is associated with.
For non-Open Access articles published, all supplemental material carries a non-exclusive license, and permission requests for re-use of supplemental material or any part of supplemental material shall be sent directly to the copyright owner as specified in the copyright notice associated with the article.
