
Abstract
Local enterprise partnerships (LEPs) were introduced by the UK government in 2010 to promote local economic development. There is, however, a minimal pre-LEP baseline analysis concerning aspirations of small and medium-sized enterprises (SMEs) in LEP geographies. Employing Federation of Small Businesses 2010 data gathered before LEP policy activities began. This study examines growth and innovation intention of SMEs in LEP-defined areas. The analysis demonstrates how key internal SME strategic focus areas of staffing levels, training investment, research and development and online presence support their growth and innovation intentions. Results from fuzzy-set qualitative comparative analysis demonstrate that SMEs’ growth and innovation intentions and strategic areas that drive these intentions differ substantially between LEP-defined regions. This study contributes to knowledge providing baseline data outlining objectives and strategic foci of SMEs in different LEP areas, allowing LEPs to effectively evaluate programmes aligned with the requirements of their SMEs, potentially informing future policymaking.
Introduction
Small and medium-sized enterprises (SMEs) account for 99.3% of all firms in the private sector in the United Kingdom (Department for Business, Energy & Industrial Strategy, 2016). It is therefore unsurprising that the UK government has developed enterprise policies to support the growth and innovation of SMEs, particularly given their contribution to economic growth, regional development and innovation in both industrialized and developing countries (Arshed et al., 2016).
Research has highlighted that the most significant contributions to economies are achieved by fast-growing ‘gazelle’ firms (Acs, 2008; Brown and Mason, 2012; Cooper et al., 2004; Smallbone and Massey, 2012). This has driven government resources towards high-growth companies, rather than firms remaining intentionally small (Shane, 2009). Additionally, since innovation plays a critical role in enabling business growth and improving performance (Beynon et al., 2015; Dobson et al., 2013; Santos, 2000), government policymakers also encourage innovation activity (Hausman, 2005; Van der Panne et al., 2003).
Although the importance of policy support for SMEs has been acknowledged (Loader, 2005; Pickernell et al., 2008), debate remains regarding how government programmes and policies effectively support and promote growth and innovation-orientated entrepreneurship from a regional perspective (Mason and Brown, 2013). The geographic regions (Chadwick et al., 2013) and the firms therein differ substantially. Regional innovation systems literature suggests successful regions tend to have ‘entrepreneurial’ innovation systems, while peripheral regions have ‘institutional’ ones (Cooke, 2003). Similarly, regional differences in terms of SME growth and innovation intentions, strategic priorities and capabilities may require different regional policies of support (Mason and Brown, 2013).
Of specific relevance to this, in England, local enterprise partnerships (LEPs) were introduced by the Conservative-Liberal Democrat coalition Government in June 2010, replacing the regional development agencies that existed previously (HM Government, 2010). LEPs are defined as ‘joint local authority-business bodies brought forward by groups of local authorities to support local economic development across ‘functional economies’’ (James and Guile, 2014: 181), the rest of the United Kingdom (Northern Ireland, Scotland and Wales) having devolved responsibility for their enterprise policy.
LEPs have great flexibility to focus and implement change (Pugalis et al., 2012), their aim being to empower local communities and businesses to provide the vision, knowledge and strategic leadership to fulfil their potential through effective economic growth and regeneration policy (Mellows-Facer, 2011). Their remit, however, is unclear, being self-determining and likely to include influencing how local authorities act in areas such as transport, housing, economic development and education (Almond et al., 2015).
Harrison (2011) identifies that LEPs can also be regarded as fitting in with another, currently popular economically spatial scale, namely that of the city-region, reinforcing perceptions that city and city-region LEPs were overlapping topical issues with Government. Williams and Vorley (2014) note that entrepreneurship is integral to promoting diversification and capacity building within regional economies. They argue (using Sheffield as an example) that entrepreneurship is critical to the restructuring and adaptation of local (city region) economies. Peck et al. (2013) identify a need for increased place sensitivity in UK industrial policy and greater consideration of the role of LEPs in design, as well as delivery, of regional, national and subnational economic strategies.
Nevertheless, enterprise policy has been criticized for its lack of effectiveness (Arshed et al., 2016; Storey and Greene, 2010). Regarding LEPs, specifically, Pugalis et al. (2012) identified concerns over limited resourcing and integration with enterprise zones (specific geographies given special economic status and advantages regarding business taxation, infrastructure and planning regulations).
Pugalis and Carling (2012) argue for greater integration of local economic assessments with LEPs to inform decision-making. Harrison (2011) identified, however, that most LEPs had political rather than economic starting points. Furthermore, James and Guile (2014) noted that SMEs reported considerable uncertainty regarding the role of the LEPs and were concerned about the loss of resources in terms of supporting programmes and institutional support structures. As Chadwick et al. (2013: 846) noted, ‘in the early stages of the development of the LEPs, very few had been able to provide a clear articulation of exactly what their priorities were, what they were working towards and how they would measure their success.’
Government policy and resource constraints have, however, focused their activity on driving on businesses with high growth (Mason, 2016). Therefore, it is critical to establish pre-LEP baseline data that uncover the objectives and strategic focus of SMEs regarding growth. Such data allow LEPs to evaluate the effectiveness of their consequent business support to SMEs and inform future policymaking. The baseline evidence against which to evaluate LEP policymaking is, however, largely nascent or tangential. Harris and Moffat’s (2015) analysis takes a wider all economy perspective when examining total factor productivity growth in LEP-designated economic geographies between 1997 and 2008. Additionally, despite Evans et al. (2015) and Anyadike-Danes et al. (2013) LEP studies, only limited literature exists that evaluates pre-LEP policy regional geographies on which LEPs are based, particularly in terms of SME growth, but also related innovation activity.
This study represents an initial pre-LEP policy benchmarking activity for LEP geographies, exploring levels of growth and innovation intention of SMEs in LEPs across England, in addition to areas of SME strategic focus in supporting such growth and innovation, which are of potential relevance to LEP policymakers. The first purpose is to analyse growth and innovation intentions of SMEs in LEP-defined regions across England. A second purpose is to explore strategic areas, including staffing levels, staff training investment, research and development (R&D) and online presence, that SMEs focus on to support growth and/or innovation intentions.
This study adopts a similar approach to Pike et al.’s (2015) analysis regarding how LEPs have developed since 2010, providing a starting point for future research. We apply fuzzy-set qualitative comparative analysis (fsQCA), a set-theoretic technique for causal oriented investigation (Ragin, 2000, 2008a). This method offers several advantages in comparison with the traditional regression-based approach. In particular, fsQCA is able to undertake asymmetric conjunctional causation-based analysis of condition variables with respect to an outcome (Andrews et al., 2016; Greckhamer, 2011). For example, it can uncover how the different condition variables impact the outcome in combination (Rihoux and Ragin, 2009). As such, this method fits with our research purpose to identify the strategic areas that SMEs emphasize to foster growth and/or innovation. Furthermore, the fsQCA method can deal with small-n data (Ragin, 2000, 2008a).
The study employs data from the Federation of Small Businesses (FSB) 2010 biannual survey of membership behaviours and attitudes. The FSB is the UK’s largest campaigning pressure group promoting self-employed and SMEs owner/managers with over 200,000 members (FSB, 2010). Using data from 2010, prior to LEP policy activities taking effect, for the 36 English LEP geographic areas where data were available, allows us to generate a pre-LEP evidence base against which subsequent LEP policymaking can be evaluated, contributing to research on LEPs.
Furthermore, this study contributes to research on the growth of SMEs by showing that there is more than one pathway for firms to support growth (e.g. staffing levels/staff training investment combined with R&D). The findings also extend the SME innovation literature by demonstrating that the presence of innovation entails a combination of staffing levels, staff training investment and R&D. That is, emphasizing only one or two of the areas is not sufficient to support innovation. Finally, this study identifies groups of LEPs sharing similar combinations or ‘recipes’ with regard to growth and innovation intentions for SMEs within these geographies. This offers the ability to identify groups of LEPs facing similar initial challenges, to identify opportunities to utilize scarce resources using jointly developed policies that are simultaneously specifically relevant to their economic geographies.
The article is structured as follows. In the next section, the importance of and drivers towards SME growth, innovation and regional development are discussed, in terms of their application to the proposed analysis model. The methodology used is then outlined, in terms of the data set used and fsQCA. Results are outlined, then discussed, with conclusions thereafter reported.
Strategic drivers of SMEs’ growth and innovation
Researchers highlight there is a positive association between growth and innovation in terms of increased employment and/or sales (Ganotakis and Love, 2012; Oke et al., 2007). To effectively support SMEs, it is imperative, however, to understand the factors underlying their growth and innovation intentions (Kohtamäki et al., 2008). For example, SMEs require resources, knowledge and skills to grow, enhance efficiency and operational effectiveness (Jones et al., 2013). Within the strategic and entrepreneurship literature, various factors have been suggested to drive growth and innovation including ‘all assets, capabilities, competencies, organisational processes, firm attributes, information, knowledge and so forth that are controlled by its members and that enable the firm to conceive of and implement strategies that improve its efficiency and effectiveness’ (Barney, 1997: 142–143).
We focus on four important factors, namely staffing levels, investment in staff training, R&D and online presence (Beynon et al., 2018), for several reasons. Employees represent a significant asset and source of potential competitive advantage to any firm (Barney et al., 2001; Penrose, 1959). The value of human resources within the business can also be associated with Becker’s (1964) perspective on human capital in its consideration and recognition of the skills, knowledge and competencies of the individual. SME employees are therefore a key resource in achieving growth (Lin, 1998) and innovation (Halim et al., 2014). Indeed, the ability of SMEs to attract, develop and retain appropriate employees potentially influences whether they are able to achieve a growth-oriented strategy (Barringer and Jones, 2004), an issue specifically identified with regards to LEPs by Sissons and Jones (2016). Therefore, staffing levels and investment in staff training represent firms’ strategic focus to enhance the quantity and quality of their human capital (Hughes et al., 2018).
Additionally, R&D can contribute to the development of firm-level capabilities and has the potential to result in innovative new products (Ahuja et al., 2008; Griffith et al., 2003). The new competences and products from R&D can thus support the growth and innovation of SMEs. Prior research has also highlighted that online presence is related to the growth and innovation of SMEs (Pickernell et al., 2013; Simmons et al., 2011). Taken together, the human capital (Hughes et al., 2018), innovation inputs in terms of R&D (Ahuja et al., 2008) and online presence (Piris et al., 2005) are important drivers of growth and innovation for SMEs. These factors are also relevant from a policymaking perspective because the effectiveness of LEPs’ policy support might depend on whether they are aligned with the strategic focus of SMEs (Brooksbank et al., 2008; Massey, 2006).
Staffing levels
Staffing levels represent one important factor to realize SMEs’ growth and innovation ambition. This is because the availability of human capital allows SMEs to operationalize their intention and potential for growth and innovation. Cravo et al. (2012) identified that the human capital embodied in SMEs may be more important for economic growth than the relative size of the SME sector itself. As such, SMEs need to manage staffing practices with an appropriate mindset (Thakur, 1999). Research suggests, for the United Kingdom and Irish SMEs, staffing levels, innovation and productivity were positively associated (Roper, 1997).
Related to this, Hoffman et al.’s (1998) literature evaluation concludes that inability to recruit (here technical staff) constrains SME growth, but also having a dedicated R&D department is positively related, highlighting links with R&D discussed below. Gilman and Edwards (2008) suggest staff recruitment and training are complementary strategies, and Laforet (2008) notes that larger manufacturing SMEs are more able to invest in staff training. This evidence suggests staffing levels are positively related to growth and innovation outcomes and also interacts with staff training and R&D activities in generating such outcomes, making the importance of these variables in combination an important area for analysis.
Investment in staff training
The training of existing staff is an essential element in realizing SMEs’ growth and innovation intentions. Staff training is accepted as a process enhancing SME performance through improved profitability and productivity (Reid and Harris, 2002), organizational performance and capabilities (Kotey and Folker, 2007), business survival (Ibrahim and Ellis, 2003) and growth (Cosh et al., 2003).
Business training provision has evolved in sophistication and form (Saunders, 2000), being positively related to increased firm size (Storey, 1994). Jones et al. (2013) note that training positively influences business performance through enhanced productivity, quality, financial results and lower labour turnover. Moreover, MacDonald et al. (2007) identify that government links training policy to improving innovation outcomes, while Muscio’s (2007) study identifies complementarity between human capital absorptive resources incumbent in staff and training with SME’s R&D activities, noting a need to further examine these linkages.
There is, however, also inconclusive and contradictory evidence (Aragón-Sánchez et al., 2003; Jayawarna et al., 2007), which potentially discourages policymakers and SMEs from investing in training provision. Foreman-Peck et al.’s (2006) study in Wales found no association between skills/training and growth or profitability. Cosh et al. (2003) found no relationship between productivity growth and training intensity, while MacDonald et al. (2007) failed to establish an association between training and innovation. As a result, the contribution of training investment to growth and product/service innovation in SMEs, both singly and in combination with variables such as staffing levels and R&D activity, remains inconclusive. Potentially, this may also be linked to geographical differences between the studies (among other reasons), suggesting a need for further research taking such aspects into account.
R&D
R&D is likely to contribute to the growth and innovation of SMEs. While typical SMEs do minimal formal R&D or limit it to activities supporting product development or marketing (Rammer et al., 2009), in-house R&D plays a critical role in firm ability to generate knowledge as the basis for proprietary intellectual property (IP) and innovation (Griffith et al., 2003).
Raymond and St. Pierre (2010) identify a link between R&D and product innovation. Hölzl (2009) and Prange (2008) posit a positive relationship between such R&D activity and high firm growth in countries where firms developing the latest technologies were concentrated. R&D was noted to be one of the most important mechanisms, along with development of knowledge and competencies, in determining overall levels of innovation in a given sector/industry (Baldwin and Hanel, 2003). Love et al. (2009) and Roper et al. (2008) in the Northern Ireland and Ireland contexts found R&D capability positively linked to innovation.
Conversely, Ortega-Argilés et al. (2009) notes linking R&D with significant SME growth, but only in high technology environments. Furthermore, neither Oakey et al. (1988) nor Keeble (1993) found a correlation between R&D investment and firm growth, and while Laforet’s (2008) review of the literature highlights the link between R&D and innovation, it also identifies that SMEs cannot always convert their R&D into successful innovation, their analysis focused on manufacturing firms in South Yorkshire.
Given the potential range of factors affecting the relationships between R&D activity, growth and innovation outcomes, including those related to human capital and geography, further research is required. Further, as e-commerce is an innovation linked to increased exporting activities (Daniel et al., 2002), itself often related to growth strategies, this is also a variable of relevance to this study.
Online presence
Pickernell et al. (2013) identified a significant relationship between e-commerce rates in SMEs and innovation in the United Kingdom, as measured by IP protection. Simpson and Docherty (2004) suggest the literature supports the view that innovation and information and communication technology (ICT) adoption are positively related, while Simmons et al. (2011) reported ICT benefits increasing competitiveness and improving performance. Furthermore, recent evidence has shown that the extent of social network usage (i.e. numbers of networks used and the frequency of usage) mediates the positive effect of entrepreneurial orientation on the growth of SMEs (Eggers et al., 2017).
Effective e-commerce deployment provides opportunities to achieve increased profitability and operational efficiency (Piris et al., 2005). Daniel and Grimshaw (2002) claim ICT adoption in the United Kingdom is an imperative for future business success. ICT represents an enabling mechanism for the SME community, potentially improving efficiency of business processes, enhancing communication, and revolutionizing existing business models (Chong, 2004). Drew (2003) identifies that successful e-commerce implementation places demands on human capital enhancement, through training activities for example (in the East of England), highlighting the importance of examining combinations of variables rather than individually.
The discussion suggests staffing levels, investment in training, R&D and online presence are potentially important factors underlying growth and innovation of SMEs, and to realize their growth and innovation intentions, SMEs must focus on these areas. We suspect that, however, SMEs might not be able to focus on all areas at the same time because they are often constrained by limited resources (Radas and Božić, 2009). That is, the different factors can compete for the limited resources within SMEs. Furthermore, the individual factor might not be sufficient to support growth and innovation alone. For instance, increasing levels of R&D might need to be complemented with staff trainings or new staffs (Hoffman et al., 1998; Muscio, 2007), implying the individual factors might work in combination. Hence, this study adopts a configurational perspective by examining the combinations of the individual factors that are related to growth and/or innovation.
The four factors are also potentially affected by government policy (Brooksbank et al., 2008; Massey, 2006). In the United Kingdom, such intervention has typically taken the form of direct government advice services (Michael and Pearce, 2009; Mole, 2002) and government subsidizing existing sources of formal support (such as private consultants or business professionals) (Bennett, 2008). This includes areas such as skills development, product and service design, new technology and computer services, in addition to personnel and recruitment, among others (Bennett and Robson, 2003), highlighting the relevance of the variables included in this study to future policymaking.
The importance of government entrepreneurship policy in providing external resources used by firms in their development strategies is therefore of obvious relevance when examining these issues in the context of potential LEP policy. Thus, there is a need to utilize a method able to examine potential impacts of different combinations of the variables upon SME growth and innovation intention in order to identify, if and where, there are different regional geographical experiences and how this may affect future LEP policy development.
Methodology
This study utilizes the FSB (2010) survey, conducted around the time the LEPs were initiated, but before policy had been enacted. This allows the analysis to provide a baseline of evidence for LEPs to evaluate their previous policies and inform future policymaking, though it also has the drawback of covering a time period following the 2008 economic crisis. Data from previous versions of the FSB survey have been utilized to analyse a range of SME issues (Beynon et al., 2015). The FSB (2010) survey instrument was developed in consultation with FSB members, individual enterprises considered the unit of analysis, with owner/managers asked to complete the questionnaire and the survey data collection process managed by a private sector consultancy. The authors were granted access to the data for academic research purposes after representation to the FSB.
This study focuses on the different LEP regions as the unit of analysis. The values for each condition and outcome variables were derived by aggregating the survey data from the SMEs located within each LEP region. Specifically, using the 2010 FSB survey linked with the associated LEPs, the following outcome variables (survey questions) were employed as measures for growth and innovation. Owner/managers were asked to indicate their growth related objective for the next 12 months based on four options: (1) grow rapidly (over 20%), (2) grow moderately (up to 20%), (3) remain the same size and (4) downsize or consolidate the business. As such, the focus of the outcome questions used was future, rather than previous, objectives focused. These questions more effectively inform LEP policy, the focus being on firm strategy. Each response was coded over a 1 to 4 scale, from 1 = to downsize/consolidate the business up to 4 = to grow rapidly in terms of turnover/sales (more than 20%). Furthermore, they were required to indicate whether they plan to ‘introduce new or improved products/services in the next 12 months’ based on three options: Yes (coded as 1), No (coded as 0) and Don’t Know (not considered in this study).
The four condition variables discussed in the literature were also identified as being available in the survey, again in terms of future strategic intention. Owner/managers were required to specify their plan to increase or decrease staffing levels, investment in staff training, R&D and online presence over the next 12 months based on five options: Increase, Stay the same, Decrease, Don’t know and Not Applicable to my business. For each of the four variables, a 1 to 3 scale domain was employed, specifically, 1 = decrease, 2 = stay the same and 3 = increase (respondents with the responses Don’t know and Not applicable to business were not further considered).
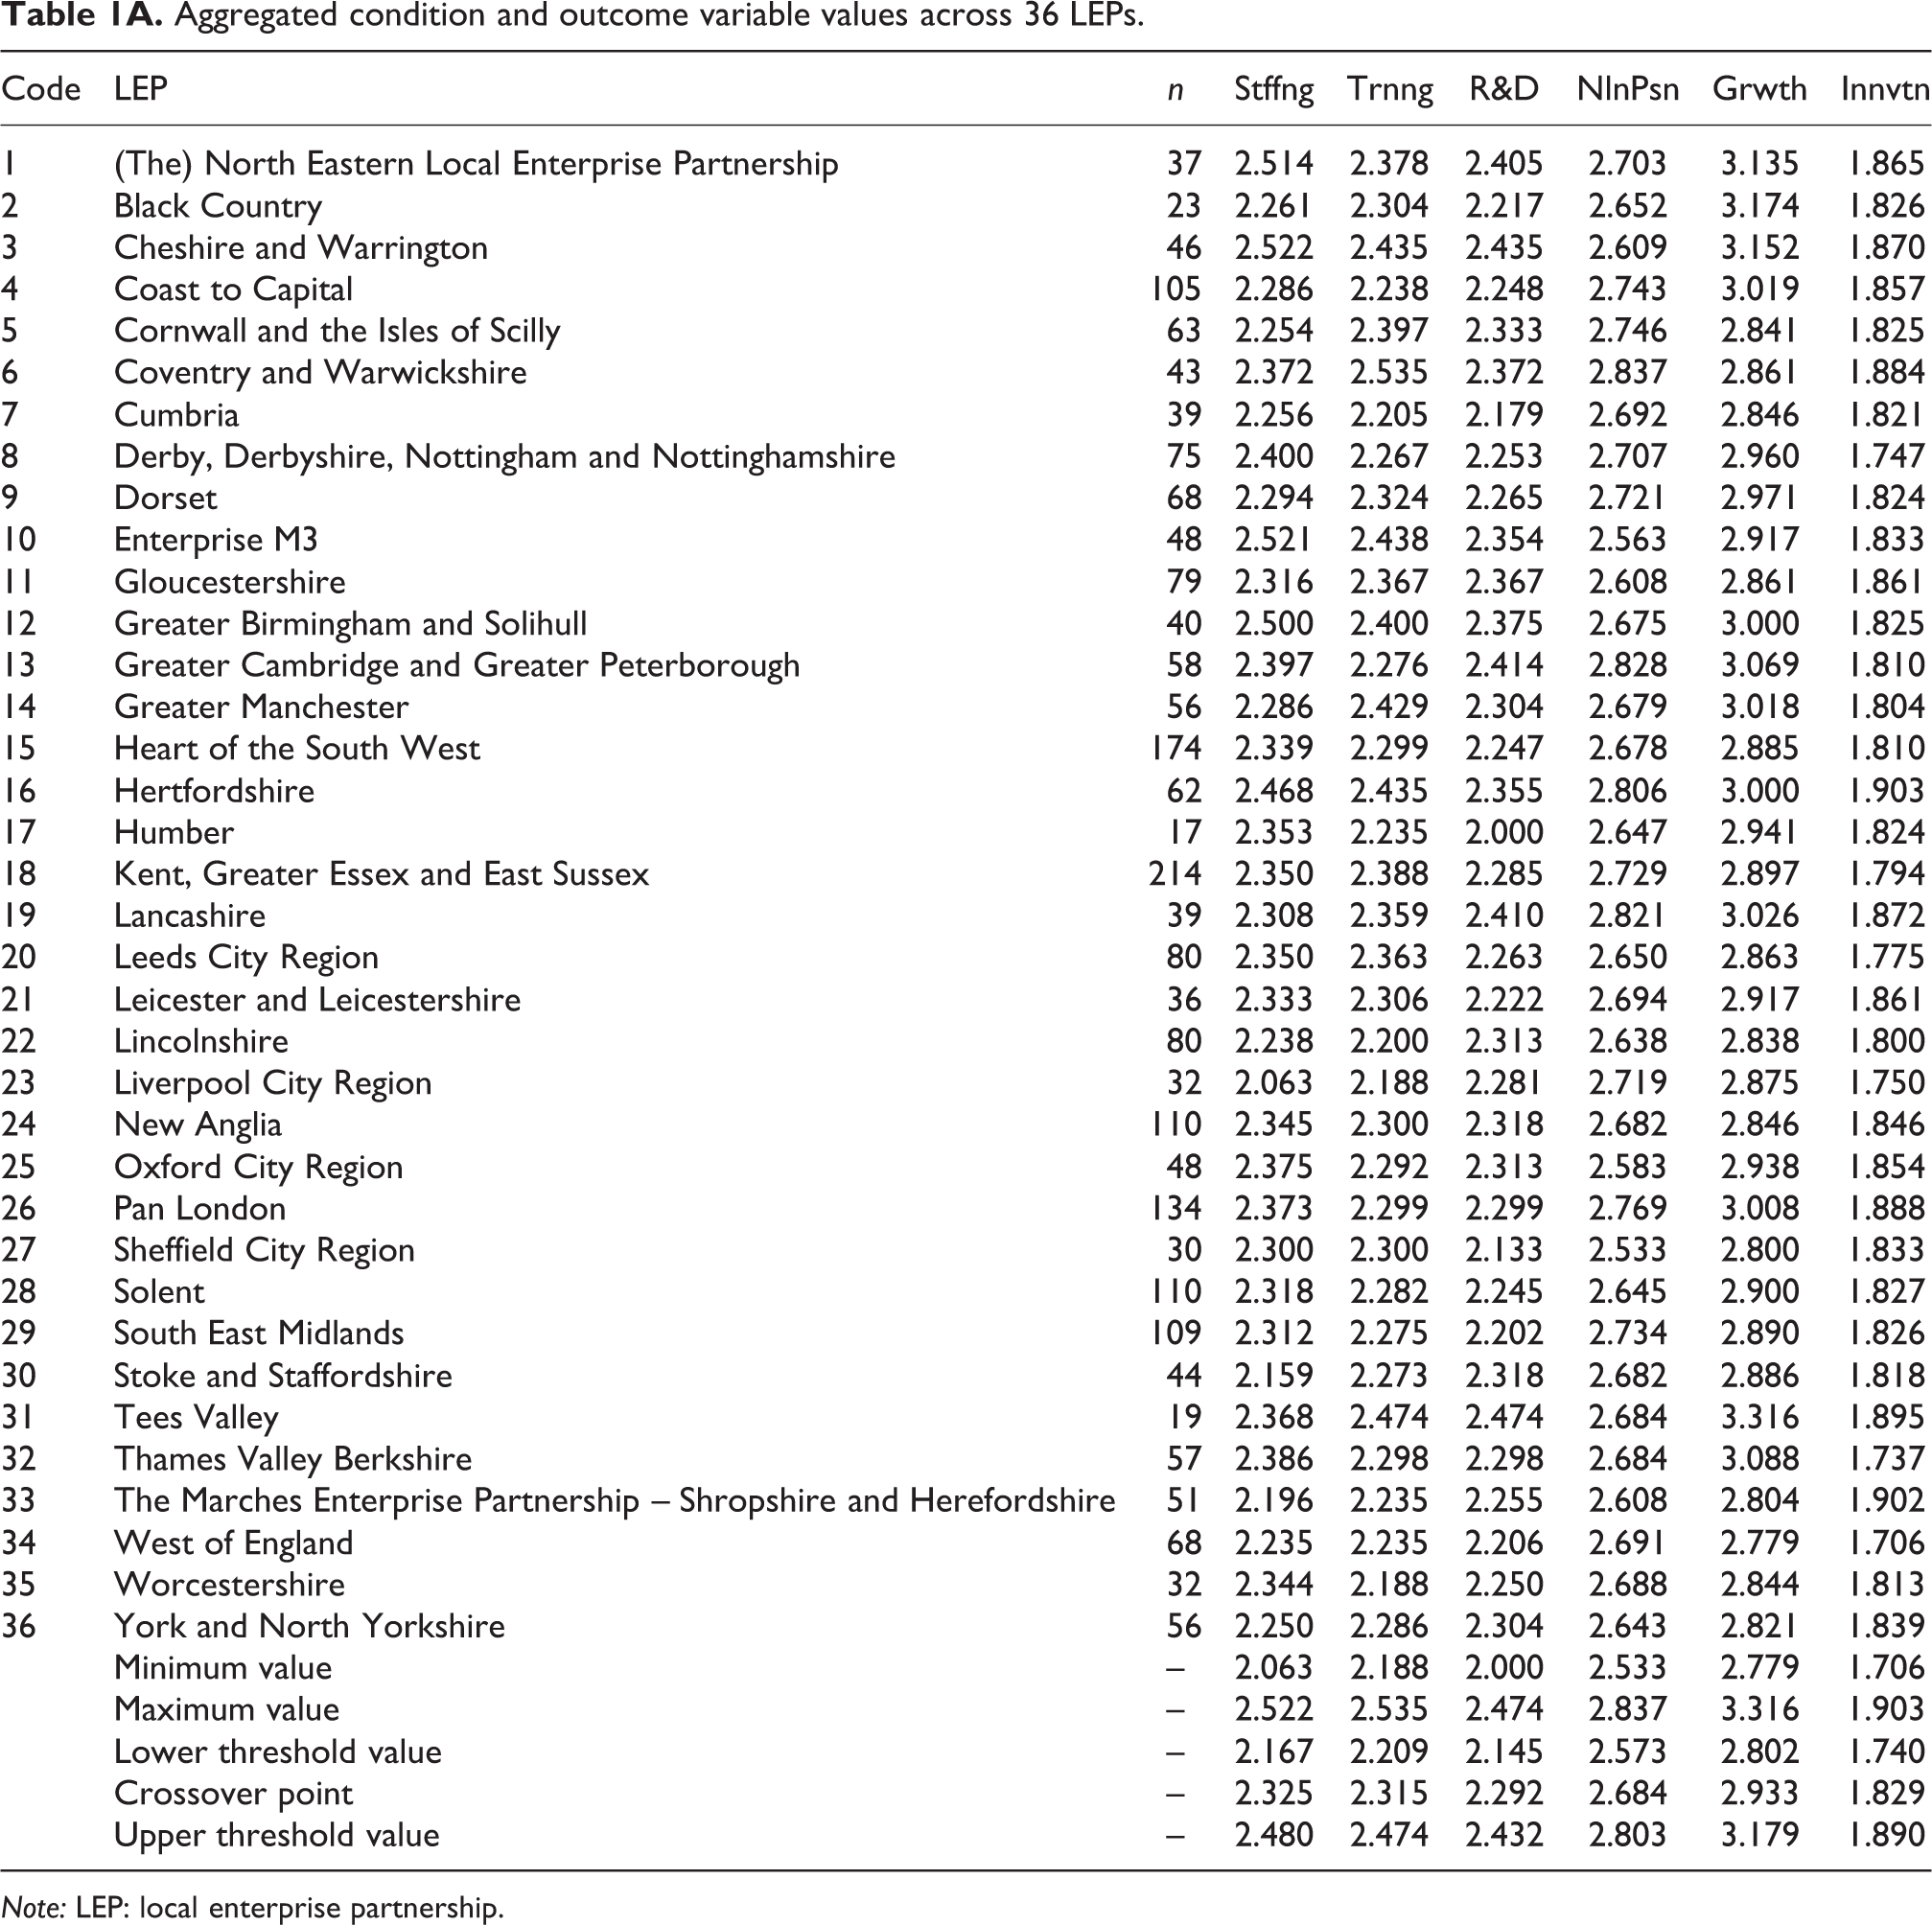
The 2010 FSB survey was sent to the FSB’s entire UK membership of approximately 200,000 firms, with 11,367 firms responding. Following coding of responses and non-response issues, 2382 respondents were considered, representing the 36 LEPs for which data were available, with each condition and outcome variable values aggregated appropriately (see Table 1A in Appendix 1 for the aggregated condition and outcome variable values for each LEP).
The analytical method used was first introduced in Ragin (2000), fsQCA offering a set-theoretic approach to causality analysis, in respect of conditions and an outcome (see also Ragin, 2008a). A recent review has shown that increasing studies in entrepreneurship and innovation have applied this method because it can deal with potentially complex relationships among different variables (Kraus et al., 2018). Crucially, fsQCA allows identification of groups of LEPs with similar experiences with regard to the variables under analysis to be identified, potentially aiding future collaborative policymaking in this area. Another key feature demonstrated in the undertaken analysis, for the 36 LEPs to be considered here, is that fsQCA is able to be employed on small-n data. fsQCA Version 2.5 software is employed in this study (Ragin and Davey, 2014).
To enable the fsQCA analysis of the LEP-level data, preprocessing is required, and the condition and outcome variable values need to be transformed from their continuous scale values to fuzzy membership scores (Andrews et al., 2016; Beynon et al., 2016). Moreover, each variable is rescaled over the respective fuzzy membership score 0.0–1.0 domain, with the limits representing 0.0 (full exclusion ‘non-membership’ from a set) and 1.0 (full inclusion ‘membership’). One popular transformation process, in relation to fsQCA, is the direct method (Ragin, 2008b), requiring the identification of three threshold qualitative anchors for full membership (upper-threshold), full non-membership (lower-threshold) and the crossover point, used to calibrate the necessary degree of membership scores, subsequently through the metric of log odds (Ragin, 2008b). Identification of the three qualitative anchors undertaken follows Andrews et al. (2016), Barton and Beynon (2015) and Beynon et al. (2016), involving identification of the 5th percentile (lower-threshold), 95th percentile (upper-threshold) and 50th percentile (crossover point) values, based on a constructed probability density function graph for each variable.
The number of cases (responses) associated with each LEP and their associated aggregated condition and outcome variable values are given in Table 1A, Appendix 1 (along with calculated triplet threshold values). As in Andrews et al. (2016), experts considered the positions of the threshold values against the distributions of the respective LEP values over each variable. The threshold values’ positions across the condition variables, staffing levels, investment in staff training, R&D and online presence were deemed acceptable as well as those for the outcome variables, growth and innovation (with particular reference to the position of relative crossover points).
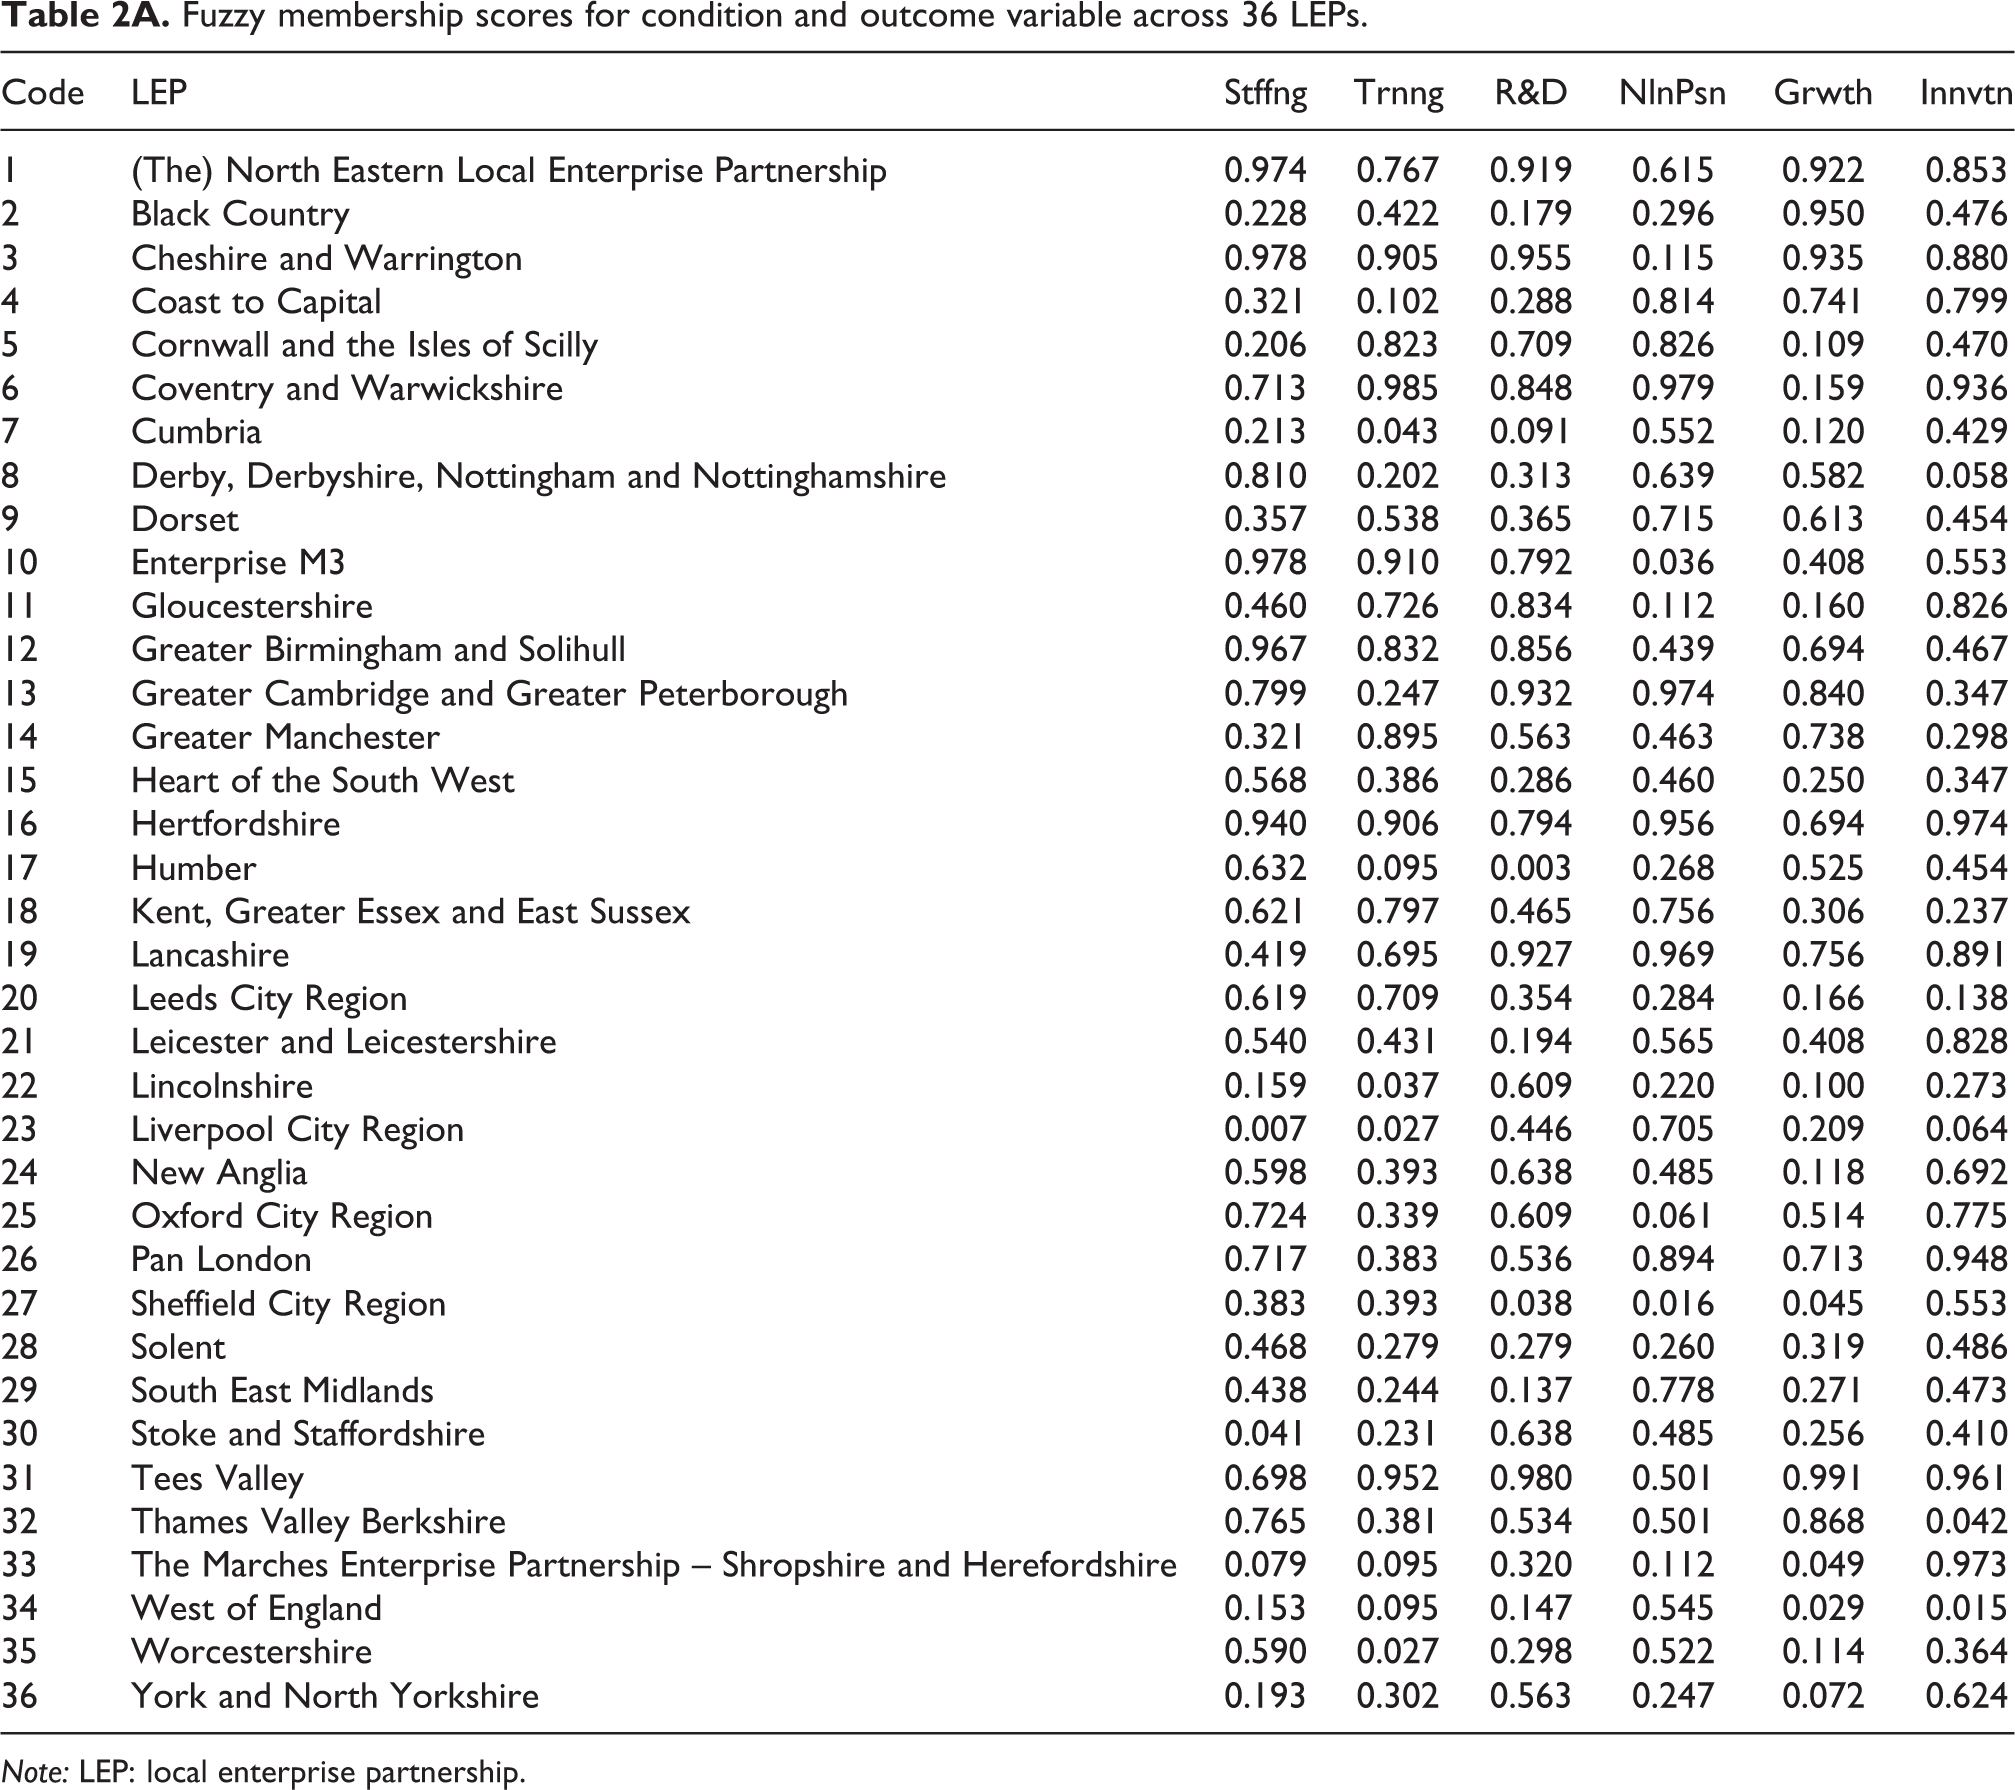
Using these threshold values (see Table 1A), within the Ragin’s (2008b) direct method, fuzzy values (μi ) are constructed over the 0.0–1.0 domain for each condition and outcome variable. For each variable, the 0.0–1.0 domain depicts the variable across the linguistic terms of low (0.0) to high (1.0) (membership to a variable’s focus). Used later, how a fuzzy membership score (μ) links to each of the limiting terms of a variable (v) is through the expression μ Low v = 1 − μ High v . With fuzzy membership scores evaluated for the condition variables (see Table 2A in Appendix 2), using the premise of LEP strong membership, 1 it is possible to see the groupings of LEPs across the logically possible configurations associated with the four condition variables, as shown in Figure 1 (see Beynon et al., 2016, for previous example of the use of Venn diagram).

Venn diagram representation of LEPs across logically possible configurations. LEP: local enterprise partnership.
Inspection of the LEPs in the cells in Figure 1 identifies groupings for each possible configuration. Taking the two extremes, configuration 1 (0000 in strong membership terms across the condition variables) shows four associated LEPs, including the Black Country and Sheffield City Region. This configuration denotes the absence of planned increase in staffing levels, investment in staff training, R&D and online presence. Conversely, configuration 16 (1111) highlights four LEPs (including the North Eastern and Coventry and Warwickshire), which all have presence of planned increase in staffing levels, investment in staff training, R&D and online training.
Results: fsQCA analysis of LEP-level data
This section presents the fsQCA-based findings over the four condition variables, Staffing levels (Stffng), Investment in staff training (Trnng), R&D and Online presence (NlnPsn), with respect to the separate outcomes Growth (Grwth) and Innovation (Innvtn). Table 1 displays the truth table rows that represent logically possible configurations based on the four condition variables. Of the 16 (24 = 16) possible configurations shown, 14 having at least one LEP associated with them in terms of strong membership (with configurations 4 and 5 – struck through in Table 1 – since no LEP associated with them; see Figure 1 for specific LEPS associated with each configuration). Within this study, configurations are only considered if at least two LEPs are associated with them (the argument here being that a configuration requires multi-evidence from more than one LEP to its consideration – see Ragin (2000) for further discussion in this frequency of evidence issue). This means the study continued with 11 of the configurations (those also now not considered are configurations 6, 13 and 14 - also having their values struck through in Table 1). 2
All configurations, based on condition variables, Stffng, Trnng, R&D and NlnPsn, and outcomes Grwth and Innvtn.
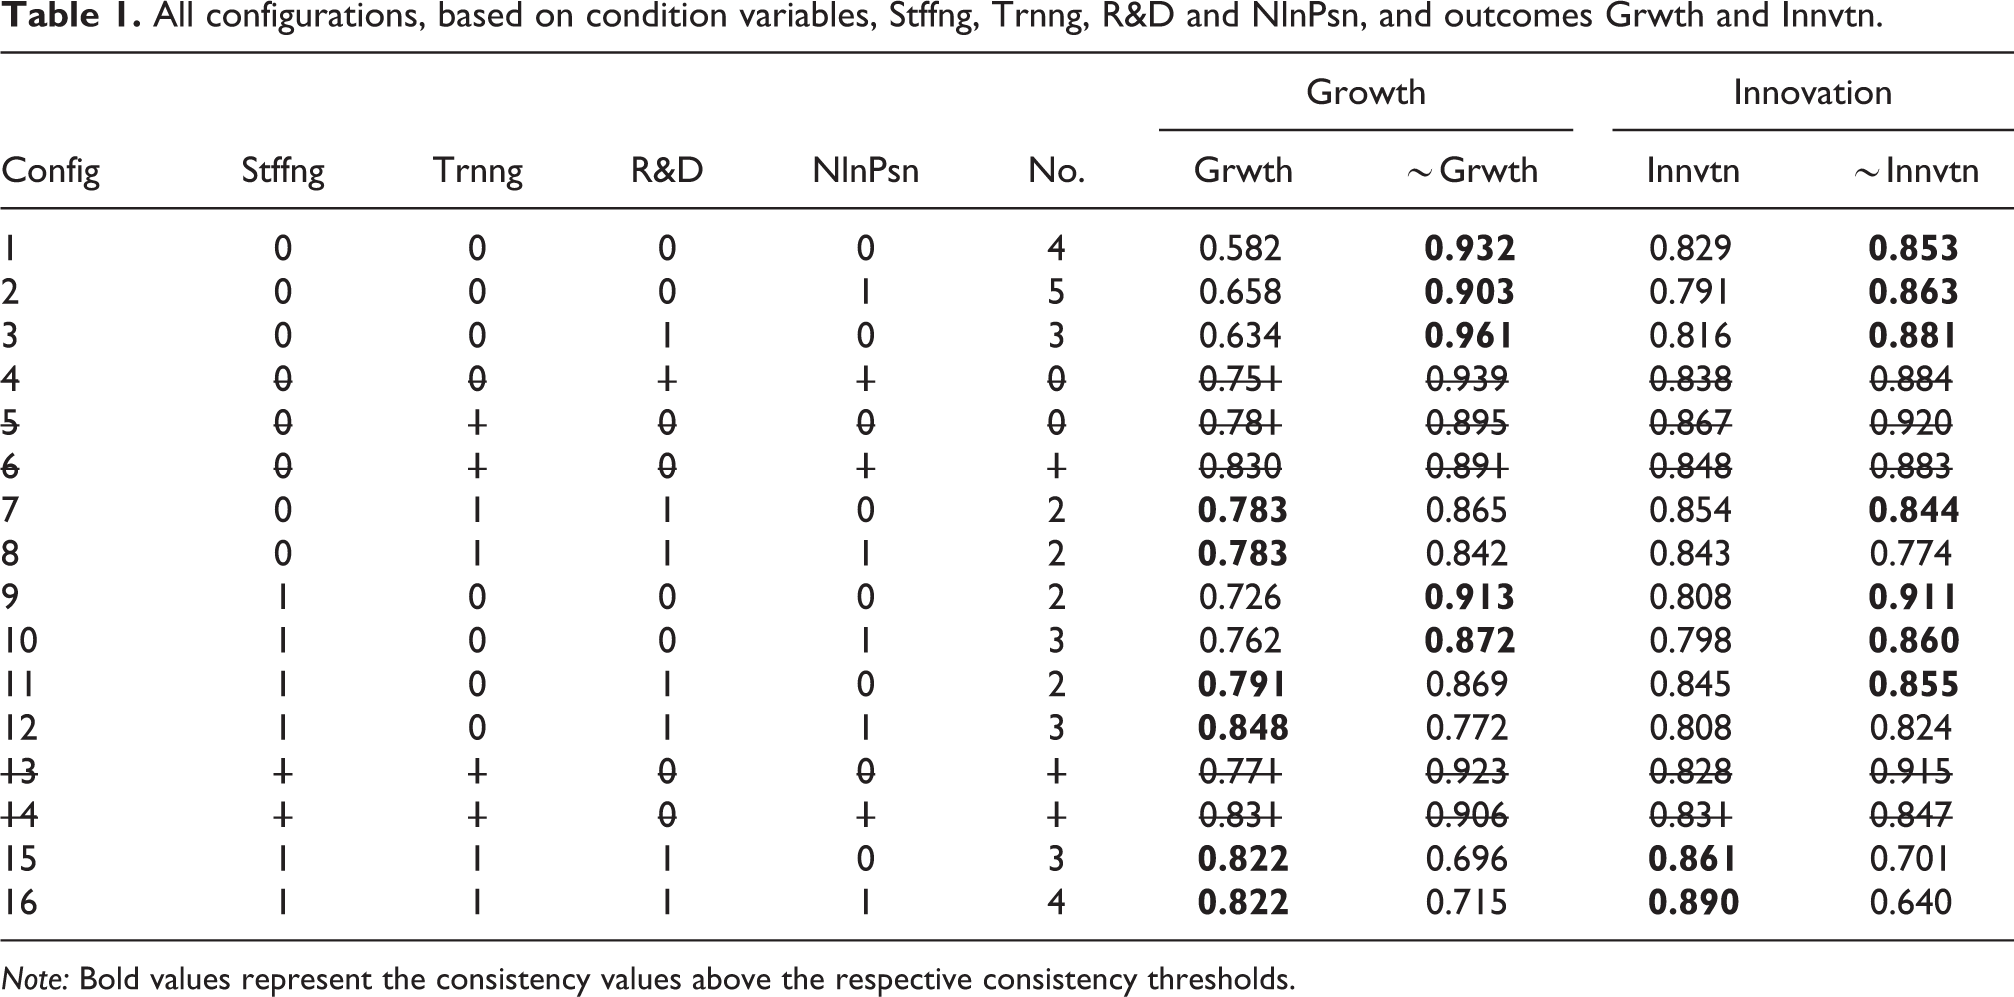
Note: Bold values represent the consistency values above the respective consistency thresholds.
The last two pairs of columns in Table 1 show the respective raw consistency values (which measures proportion of memberships, in fuzzy terms, in the outcome explained by each logical configuration, see Ragin, 2008a), associating a configuration with each of the outcome variables, Growth (Grwth and ∼Grwth) and Innovation (Innvtn and ∼Innvtn). 3 With respect to each of the considered outcomes Grwth and ∼Grwth, and Innvtn and ∼Innvtn, which configurations are considered associated with them and which are not is defined by consideration of the consistency values and a respective consistency threshold (Ragin, 2008a).
Choice of consistency threshold for the raw consistency measure influences the strength of evidence used in subsequent analysis (Ragin, 2008a). Andrews et al. (2016) and Beynon et al. (2016) considered this threshold value identification issue, selecting the same value for both the consideration of outcome and ∼outcome, with the proviso that no configurations would be considered if they were simultaneously associated with outcome and ∼outcome. This rubric is extended to take on the general trend of consistency values associating configurations with outcome and ∼outcome (see Appendix 3 for technical details), the four consistency thresholds employed were found to be 0.781 for Grwth, 0.870 for ∼Grwth, 0.859 for Innvtn and 0.843 for ∼Innvtn (Table 1).
A succinct approach to presenting fsQCA solution–based findings, of relevance to the issues discussed here, is found in Ragin and Fiss (2008). Complex and parsimonious solutions 4 differentiating core versus peripheral causal conditions are identified in Tables 2 (Growth) and 3 (Innovation), as well as the groups of LEPs (defined as configurations) that share these sets of conditions.
Sufficiency analyses results for Grwth and ∼Grwth outcomes (including complex and parsimonious solutions).
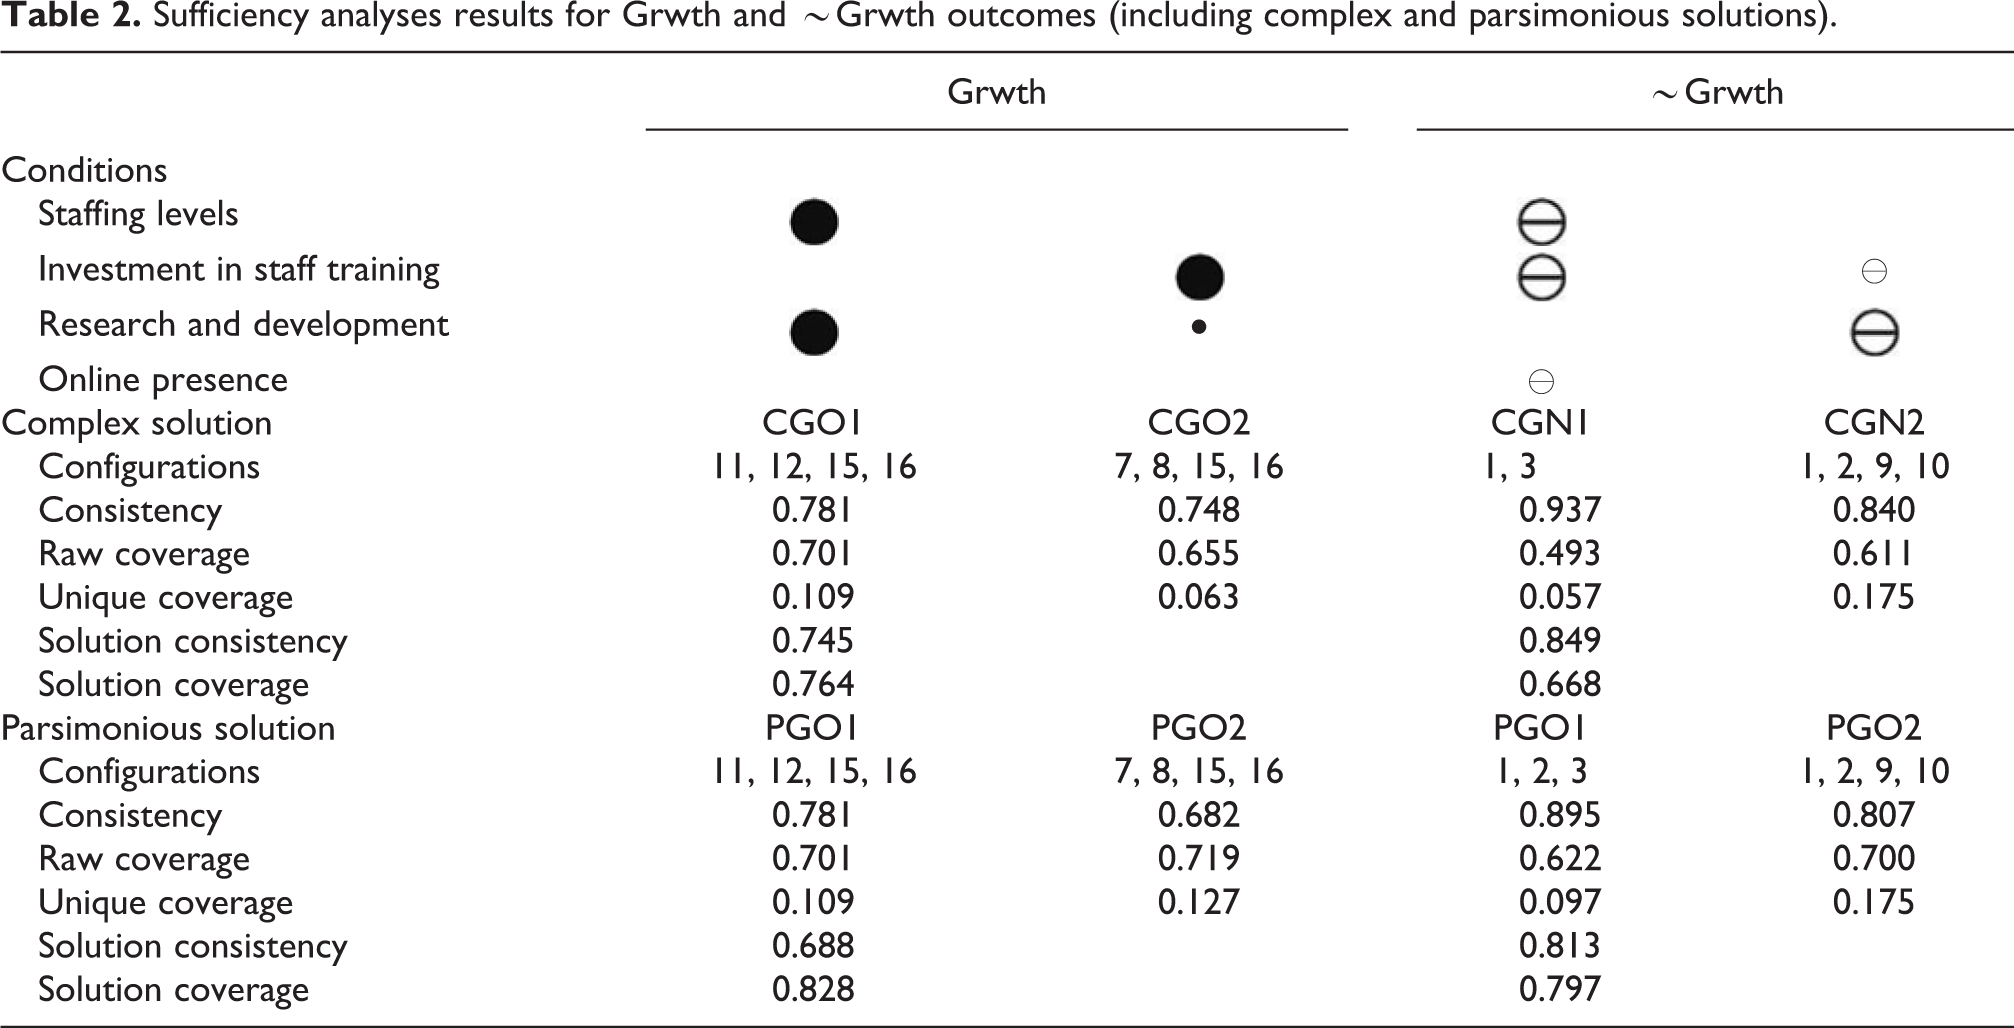
In Tables 2 and 3, each column represents an alternative combination of conditions linked to the respective outcome, termed a causal recipe (a specific combination of causally relevant variables linked to an outcome where the notion of combined causes is captured through the set-theoretic underpinnings of fsQCA, see Ragin, 2008a).
Sufficiency analyses results for Innvtn and ∼Innvtn outcomes (including complex and parsimonious solutions).
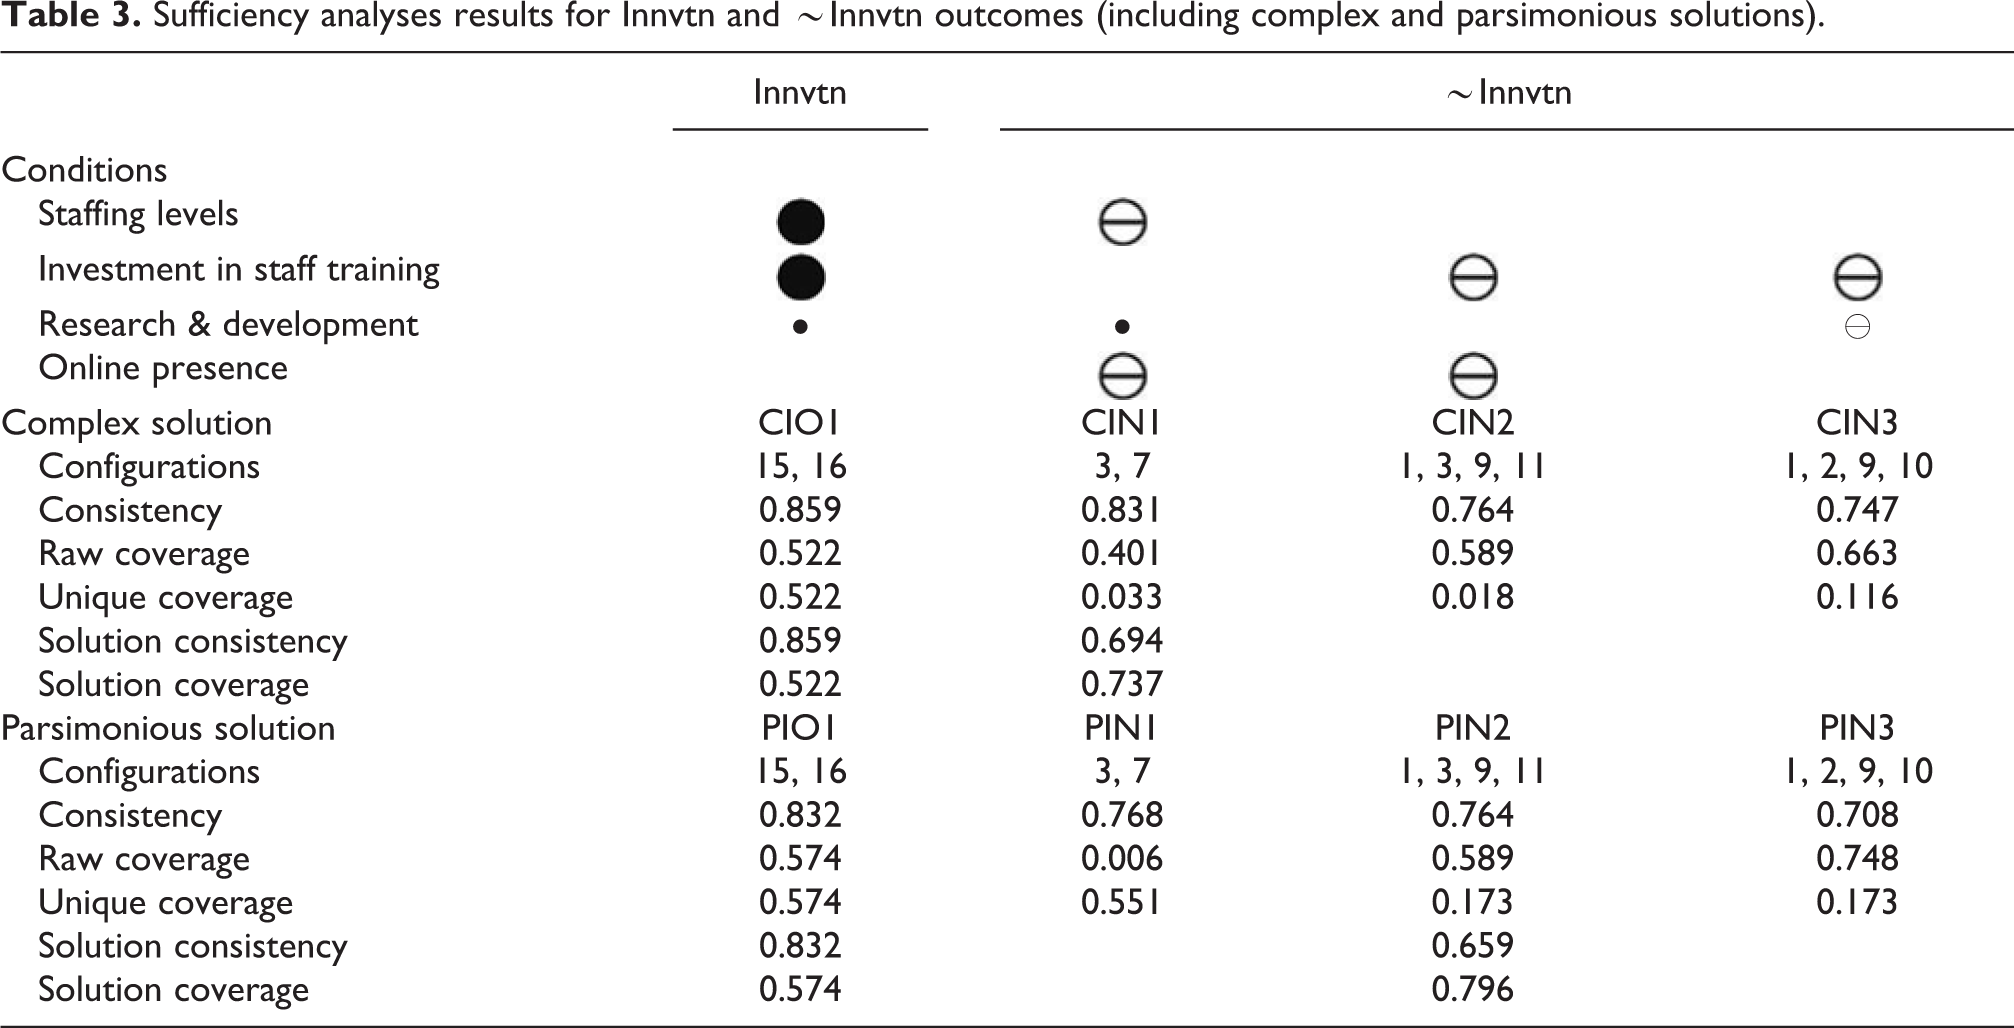
Full circles ( ) indicate the presence of a condition, and barred circles (
 ) indicate the absence of a condition. Further, core and peripheral conditions are distinguished by symbol size: larger circles indicate core conditions (presence or absence), part of both parsimonious and complex solutions. Unique consistency measures the degree to which cases sharing a given condition agree in displaying the relative outcome. Raw coverage measures overall coverage of a combination that may overlap with other combinations. Unique coverage refers to coverage uniquely due to a combination. To accompany the discussion of fsQCA results (in Tables 2 and 3), visualization of groupings of the considered 36 LEPs is presented in Figures 2 (again using Venn diagrams) and 3 (using geographical heatmap representation).

Venn diagrams of LEPs across configurations, shading in regard to causal recipes associated with (a) Grwth and ∼Grwth and (b) Innvtn and ∼Innvtn. LEP: local enterprise partnership.
In Figure 2, two Venn diagrams are shown, the same as in Figure 1, separately for when considering the outcomes Growth (2(a)) and Innovation (2(b)). Moreover, following on from the findings in Tables 2 and 3 are shadings of configuration cells that identify which configurations are associated with outcome (dark grey) and ∼outcome (light grey), with white shaded regions signifying no assignment to outcome or ∼outcome.
In Figure 3, two regional maps of England are presented illustrating the LEPs, with white and grey (dark and light) shading showing their association with outcomes Growth (3(a)) and Innovation (3(b)). Referral back to Tables 2 and 3 as well as Figures 2 and 3 enables understanding of which groups of same-shaded cells are associated with which of the defined causal recipes, as discussed in the section below.

Graphical maps of LEPs, shading in regard to causal recipes associated with (a) Grwth and ∼Grwth and (b) Innvtn and ∼Innvtn*. *At time of FSB study, there were three areas (shaded in black not covered by LEPs), also some LEPs overlapped across different local authorities (not shown here). LEP: local enterprise partnership.
Discussion
The results suggest that LEPs vary significantly with regard to growth and innovation intentions of SMEs within their region. Some LEPs are associated with firms that are predominately growth and innovation oriented, while the opposite is true for other LEPs, others sitting between these two extremes. Such findings have important implications for policymaking because an improved understanding of objectives of local firms would allow LEPs to better tailor their policy support with local needs.
Regarding the condition variables and combination of firm variables related to a future growth or innovation intention, the results from fsQCA demonstrate that Growth has four complex causal recipes: CGO1 and CGO2 for Grwth and CGN1 and CGN2 for ∼Grwth. Similarly, Innovation also has four causal recipes, but only CIO1 for Innvtn and CIN1, CIN2 and CIN3 for ∼Innvtn.
There are also more LEPs associated with the presence of growth intention (Grwth) than Innovation intentions (Innvtn), highlighting that absence of innovation intention (∼Innvtn) is a greater issue for English LEP policy generally. This may be caused by the lack of resources commonly faced by SMEs, prior research suggesting that ‘resource constraints often lead to SMEs to be more risk-averse and less willing to invest in new technologies than larger firms’ (OECD, 2017: 8). Further, there is a geographical concentration of many of the LEPs with the presence of growth intentions around the East, South East and Midlands regions, a pattern also seen, to a weaker extent, for the presence of innovation intentions.
In terms of individual variables, R&D appears most often, its presence contributing to explain Grwth and Innvtn and its absence contributing to explaining ∼Innvtn for two of the three casual recipes. This is consistent with previous works suggesting innovation is positively associated with R&D activity (Baldwin and Hanel, 2003; Love et al., 2009; Raymond and St. Pierre, 2010; and Roper et al., 2008). Similarly, it confirms the positive association between planned growth and planned R&D activity mooted in terms of actual outcomes by Ortega-Argilés et al. (2009), although contradicting the findings of Oakey et al. (1988).
Given the potential importance of the mixture of variables, it is important to note that in CIN1 for ∼Innvtn, R&D presence is associated with low innovation intention when accompanied by an absence of planned increased staffing levels and absence of online presence. This suggests that in LEPs where R&D spending substitutes for firm staffing and e-commerce expenditure, it is not related to innovation intention, highlighting that in certain LEPs, SME innovation intention requires more than just R&D, instead being a process requiring supporting human resources and marketing activities.
Planned investment in staff training is the variable that appears almost as consistently, present for Grwth and Innvtn intention and absent for ∼Grwth and ∼Innvtn intention. These results confirm the importance of planned firm investment in training towards planned growth and innovation outcomes identified in Muscio (2007) and Jones et al. (2013) in terms of actual outcomes.
In terms of multivariable recipes, the picture is more complex. Planned investment in training is associated with the presence of Grwth intention when combined with planned R&D and the absence of planned investment in training is associated with ∼Grwth when combined with the absence of planned R&D in one recipe. In the other recipe, however, it is the absence of planned investment in training combined with the absence of increased staffing and the absence of online presence that is related to ∼Grwth. For innovation, the picture is even more complicated. Planned investment in training is associated with Innvtn intention in combination with increased planned staffing and increased planned R&D. For ∼Innvtn intention, however, lack of planned training is combined with lack of R&D in one recipe and lack of online presence in another. The fact that it does not appear at all in the other recipe, but the absence of increased staffing does, also suggests the possibility of a substitution effect.
In contrast, increased online presence (or rather its absence) is only part of a minority of the recipes, only appearing in those for ∼Grwth and ∼Innvtn. Specifically, the absence of online presence is associated with ∼Grwth and ∼Innvtn. While this supports the results of Simmons et al. (2011) and Pickernell et al. (2013) in terms of planned and actual outcomes, this is only in the context of the absence in low growth and innovation intention (∼Grwth and ∼Innvtn) LEPS, which may be of particular relevance when examining policy potentials for different LEP areas.
In terms of the recipes, Innvtn is associated with a recipe where increased planned staffing, staff training and R&D are all present, suggesting that these are perhaps complementary investments towards the planned outcome. For Grwth, the two complex solutions suggest that increased planned staffing and staff training are potentially substitute strategies towards achieving high growth. For ∼Grwth and ∼Innvtn, this substituting relationship can also be seen to an extent, but there is added complexity in term of the other variables (R&D and online presence) also appearing in different recipes.
More importantly, there are clear differences in the recipes between Grwth, ∼Grwth, Innvtn and ∼Innvtn, in that they are not ‘mirror images’ of one another. In terms of the LEP regions, for example, there is only one ‘recipe’ (CGN2 and CIN3 – absence of investment in staff training and absence of R&D) that is identified for both ∼Grwth and ∼Innvtn, relevant to the same configurations, namely 1, 2, 9 and 10. Additionally, only configurations 15 and 16 are strong for both growth (Grwth) and innovation (Innvtn) and across all the relevant recipes (CGO1, CGO2 and CIN1).
While the importance of individual variables is known in the literature, the knowledge regarding effective combinations of them is nascent, particularly in terms of LEP geographies to which they apply but also in terms of their application to innovation and growth intention. Further, the wide variety of recipes indicate a degree of complexity for policymakers identified through fsQCA that would not otherwise have been apparent, specifically concerning different recipes where growth or innovation is present compared to where it is absent.
LEPs that share configurations may benefit from benchmarking against each other and also future policymaking collaboration. The strongest LEPs in terms of growth and innovation, configurations 15 and 16 (Figure 2), illustrate that geographically (Figure 3) the North-Eastern and Tees Valley LEPs could logically cooperate with regards to future policy, as could Cheshire and Warrington with Coventry and Warwickshire and Greater Birmingham and Solihull, while the Hertfordshire and Enterprise M3 LEPs are also close enough geographically to suggest exploration of future policymaking as well as benchmarking.
Conversely, nearby LEP geographies displaying weaker SME growth or innovation focus may be able to beneficially benchmark their localities and future policies against them, particularly in terms of SME strategic focus with regards to R&D, training, staffing and ICT activities (while recognizing the analysis suggests that combinations of variables are of importance rather than individual variables in isolation). For example, configurations 7 (Gloucestershire and Greater Manchester) and 11 (New Anglia and Oxford City) display positive growth intentions but not innovation intentions, while only differing from configuration 15 in terms of one strategic variable in the recipe (presence of staff levels and training, respectively).
The other sets of LEPs (1, 2, 3, 9 and 10) are weak in both growth and innovation outcomes, Configuration 1, for example, affected by all the weak growth and innovation recipes apart from one (CIN1). Three of the four LEPs in this configuration are geographically close enough to suggest some degree of future policy collaboration based upon common issues may be viable (the Solent LEP being much further South than the others). In terms of benchmarking and future policy focus, configurations 7 and 11 offer the strongest evidence in terms of where to focus initial policy resources to improve strategic intentions in the fewest strategic variables (in combination with continuing to promote the other variables in the recipes), at least in terms of growth intentions, configuration 7 indicating a focus on training and R&D, and configuration 11 staffing and R&D.
Related to this, it is apparent that there is overlap between cities, city regions and other types of LEP areas. For example, looking at the configurations 1, 2, 9 and 10, which show ∼Grwth and ∼Innvtn intentions and share recipes, these include city regions such as Sheffield and Liverpool, but also other (industrial and rural/semi-rural) types such as the Black Country, the Marches and Heart of the South West. This highlights that while LEPs may find it superficially more logical to restrict comparisons to LEP geographies with similar geopolitical governance structures, this approach may not be supported by analysis, at least where SME development policy is concerned.
Conclusions
This study contributes to research on LEPs by establishing a pre-LEP SME knowledge base, important to LEPs in evaluating subsequent policies and informing future policymaking. The fsQCA approach provides a novel method to compare and contrast regional differences in the growth and innovation intention of SMEs, relating them to sets of strategy recipes in English LEP geographies, rather than individual variables. The results indicate two recipe sets supporting growth, namely staffing levels combined with R&D or training combined with R&D. Additionally, there is one single recipe set, combining staff recruitment, training and R&D, supporting innovation.
These results suggest SMEs in different LEP regions tend to focus on different strategic areas to support their growth and/or innovation intentions. For low growth and innovation intention, there are more causal recipes, and greater overlap of LEP areas into multiple recipe groupings suggesting greater complexity, highlighting the importance of more nuanced locally driven policy responses. Together, these findings offer useful guidelines for SME managers on how to manage the different factors to support growth and innovation without potentially overstretching the resources they have. For example, they can focus on the combination of staffing levels with R&D or staff training investment with R&D to support growth. Additionally, or alternatively, a combination of staffing levels, staff training investment and R&D is required to support innovation.
Using fsQCA provides novel policy-relevant insights into the combinations of strategic areas that SMEs focus on to support their growth and/or innovation, suggesting, for example, that LEPs may need to integrate skills policymaking with other policies designed to support growth and innovation (Sissons and Jones, 2016). Moreover, the results are potentially useful in informing economic policy through identifying LEP groupings of most relevance for comparing SME growth and innovation intentions and sets of SMEs’ development strategies.
Given the varying growth and innovation aspirations of the SMEs analysed and their different areas of strategic focus identified, the suggestion of the CBI (2012) to allow LEPs greater responsibility and accountability in managing their own funding and programmes is supported by this analysis, supporting earlier calls (Fenwick et al., 2012; Lord Heseltine, 2013). For individual LEPs, however, there is also the opportunity to learn from and collaborate with other LEPs experiencing similar challenges and requiring comparable policy solutions.
Footnotes
Declaration of conflicting interests
The author(s) declared no potential conflicts of interest with respect to the research, authorship, and/or publication of this article.
Funding
The author(s) received no financial support for the research, authorship, and/or publication of this article.
Notes
Appendix 1
Aggregated condition and outcome variable values across 36 LEPs.
| Code | LEP | n | Stffng | Trnng | R&D | NlnPsn | Grwth | Innvtn |
|---|---|---|---|---|---|---|---|---|
| 1 | (The) North Eastern Local Enterprise Partnership | 37 | 2.514 | 2.378 | 2.405 | 2.703 | 3.135 | 1.865 |
| 2 | Black Country | 23 | 2.261 | 2.304 | 2.217 | 2.652 | 3.174 | 1.826 |
| 3 | Cheshire and Warrington | 46 | 2.522 | 2.435 | 2.435 | 2.609 | 3.152 | 1.870 |
| 4 | Coast to Capital | 105 | 2.286 | 2.238 | 2.248 | 2.743 | 3.019 | 1.857 |
| 5 | Cornwall and the Isles of Scilly | 63 | 2.254 | 2.397 | 2.333 | 2.746 | 2.841 | 1.825 |
| 6 | Coventry and Warwickshire | 43 | 2.372 | 2.535 | 2.372 | 2.837 | 2.861 | 1.884 |
| 7 | Cumbria | 39 | 2.256 | 2.205 | 2.179 | 2.692 | 2.846 | 1.821 |
| 8 | Derby, Derbyshire, Nottingham and Nottinghamshire | 75 | 2.400 | 2.267 | 2.253 | 2.707 | 2.960 | 1.747 |
| 9 | Dorset | 68 | 2.294 | 2.324 | 2.265 | 2.721 | 2.971 | 1.824 |
| 10 | Enterprise M3 | 48 | 2.521 | 2.438 | 2.354 | 2.563 | 2.917 | 1.833 |
| 11 | Gloucestershire | 79 | 2.316 | 2.367 | 2.367 | 2.608 | 2.861 | 1.861 |
| 12 | Greater Birmingham and Solihull | 40 | 2.500 | 2.400 | 2.375 | 2.675 | 3.000 | 1.825 |
| 13 | Greater Cambridge and Greater Peterborough | 58 | 2.397 | 2.276 | 2.414 | 2.828 | 3.069 | 1.810 |
| 14 | Greater Manchester | 56 | 2.286 | 2.429 | 2.304 | 2.679 | 3.018 | 1.804 |
| 15 | Heart of the South West | 174 | 2.339 | 2.299 | 2.247 | 2.678 | 2.885 | 1.810 |
| 16 | Hertfordshire | 62 | 2.468 | 2.435 | 2.355 | 2.806 | 3.000 | 1.903 |
| 17 | Humber | 17 | 2.353 | 2.235 | 2.000 | 2.647 | 2.941 | 1.824 |
| 18 | Kent, Greater Essex and East Sussex | 214 | 2.350 | 2.388 | 2.285 | 2.729 | 2.897 | 1.794 |
| 19 | Lancashire | 39 | 2.308 | 2.359 | 2.410 | 2.821 | 3.026 | 1.872 |
| 20 | Leeds City Region | 80 | 2.350 | 2.363 | 2.263 | 2.650 | 2.863 | 1.775 |
| 21 | Leicester and Leicestershire | 36 | 2.333 | 2.306 | 2.222 | 2.694 | 2.917 | 1.861 |
| 22 | Lincolnshire | 80 | 2.238 | 2.200 | 2.313 | 2.638 | 2.838 | 1.800 |
| 23 | Liverpool City Region | 32 | 2.063 | 2.188 | 2.281 | 2.719 | 2.875 | 1.750 |
| 24 | New Anglia | 110 | 2.345 | 2.300 | 2.318 | 2.682 | 2.846 | 1.846 |
| 25 | Oxford City Region | 48 | 2.375 | 2.292 | 2.313 | 2.583 | 2.938 | 1.854 |
| 26 | Pan London | 134 | 2.373 | 2.299 | 2.299 | 2.769 | 3.008 | 1.888 |
| 27 | Sheffield City Region | 30 | 2.300 | 2.300 | 2.133 | 2.533 | 2.800 | 1.833 |
| 28 | Solent | 110 | 2.318 | 2.282 | 2.245 | 2.645 | 2.900 | 1.827 |
| 29 | South East Midlands | 109 | 2.312 | 2.275 | 2.202 | 2.734 | 2.890 | 1.826 |
| 30 | Stoke and Staffordshire | 44 | 2.159 | 2.273 | 2.318 | 2.682 | 2.886 | 1.818 |
| 31 | Tees Valley | 19 | 2.368 | 2.474 | 2.474 | 2.684 | 3.316 | 1.895 |
| 32 | Thames Valley Berkshire | 57 | 2.386 | 2.298 | 2.298 | 2.684 | 3.088 | 1.737 |
| 33 | The Marches Enterprise Partnership – Shropshire and Herefordshire | 51 | 2.196 | 2.235 | 2.255 | 2.608 | 2.804 | 1.902 |
| 34 | West of England | 68 | 2.235 | 2.235 | 2.206 | 2.691 | 2.779 | 1.706 |
| 35 | Worcestershire | 32 | 2.344 | 2.188 | 2.250 | 2.688 | 2.844 | 1.813 |
| 36 | York and North Yorkshire | 56 | 2.250 | 2.286 | 2.304 | 2.643 | 2.821 | 1.839 |
| Minimum value | – | 2.063 | 2.188 | 2.000 | 2.533 | 2.779 | 1.706 | |
| Maximum value | – | 2.522 | 2.535 | 2.474 | 2.837 | 3.316 | 1.903 | |
| Lower threshold value | – | 2.167 | 2.209 | 2.145 | 2.573 | 2.802 | 1.740 | |
| Crossover point | – | 2.325 | 2.315 | 2.292 | 2.684 | 2.933 | 1.829 | |
| Upper threshold value | – | 2.480 | 2.474 | 2.432 | 2.803 | 3.179 | 1.890 |
Note: LEP: local enterprise partnership.
Appendix 2
Fuzzy membership scores for condition and outcome variable across 36 LEPs.
| Code | LEP | Stffng | Trnng | R&D | NlnPsn | Grwth | Innvtn |
|---|---|---|---|---|---|---|---|
| 1 | (The) North Eastern Local Enterprise Partnership | 0.974 | 0.767 | 0.919 | 0.615 | 0.922 | 0.853 |
| 2 | Black Country | 0.228 | 0.422 | 0.179 | 0.296 | 0.950 | 0.476 |
| 3 | Cheshire and Warrington | 0.978 | 0.905 | 0.955 | 0.115 | 0.935 | 0.880 |
| 4 | Coast to Capital | 0.321 | 0.102 | 0.288 | 0.814 | 0.741 | 0.799 |
| 5 | Cornwall and the Isles of Scilly | 0.206 | 0.823 | 0.709 | 0.826 | 0.109 | 0.470 |
| 6 | Coventry and Warwickshire | 0.713 | 0.985 | 0.848 | 0.979 | 0.159 | 0.936 |
| 7 | Cumbria | 0.213 | 0.043 | 0.091 | 0.552 | 0.120 | 0.429 |
| 8 | Derby, Derbyshire, Nottingham and Nottinghamshire | 0.810 | 0.202 | 0.313 | 0.639 | 0.582 | 0.058 |
| 9 | Dorset | 0.357 | 0.538 | 0.365 | 0.715 | 0.613 | 0.454 |
| 10 | Enterprise M3 | 0.978 | 0.910 | 0.792 | 0.036 | 0.408 | 0.553 |
| 11 | Gloucestershire | 0.460 | 0.726 | 0.834 | 0.112 | 0.160 | 0.826 |
| 12 | Greater Birmingham and Solihull | 0.967 | 0.832 | 0.856 | 0.439 | 0.694 | 0.467 |
| 13 | Greater Cambridge and Greater Peterborough | 0.799 | 0.247 | 0.932 | 0.974 | 0.840 | 0.347 |
| 14 | Greater Manchester | 0.321 | 0.895 | 0.563 | 0.463 | 0.738 | 0.298 |
| 15 | Heart of the South West | 0.568 | 0.386 | 0.286 | 0.460 | 0.250 | 0.347 |
| 16 | Hertfordshire | 0.940 | 0.906 | 0.794 | 0.956 | 0.694 | 0.974 |
| 17 | Humber | 0.632 | 0.095 | 0.003 | 0.268 | 0.525 | 0.454 |
| 18 | Kent, Greater Essex and East Sussex | 0.621 | 0.797 | 0.465 | 0.756 | 0.306 | 0.237 |
| 19 | Lancashire | 0.419 | 0.695 | 0.927 | 0.969 | 0.756 | 0.891 |
| 20 | Leeds City Region | 0.619 | 0.709 | 0.354 | 0.284 | 0.166 | 0.138 |
| 21 | Leicester and Leicestershire | 0.540 | 0.431 | 0.194 | 0.565 | 0.408 | 0.828 |
| 22 | Lincolnshire | 0.159 | 0.037 | 0.609 | 0.220 | 0.100 | 0.273 |
| 23 | Liverpool City Region | 0.007 | 0.027 | 0.446 | 0.705 | 0.209 | 0.064 |
| 24 | New Anglia | 0.598 | 0.393 | 0.638 | 0.485 | 0.118 | 0.692 |
| 25 | Oxford City Region | 0.724 | 0.339 | 0.609 | 0.061 | 0.514 | 0.775 |
| 26 | Pan London | 0.717 | 0.383 | 0.536 | 0.894 | 0.713 | 0.948 |
| 27 | Sheffield City Region | 0.383 | 0.393 | 0.038 | 0.016 | 0.045 | 0.553 |
| 28 | Solent | 0.468 | 0.279 | 0.279 | 0.260 | 0.319 | 0.486 |
| 29 | South East Midlands | 0.438 | 0.244 | 0.137 | 0.778 | 0.271 | 0.473 |
| 30 | Stoke and Staffordshire | 0.041 | 0.231 | 0.638 | 0.485 | 0.256 | 0.410 |
| 31 | Tees Valley | 0.698 | 0.952 | 0.980 | 0.501 | 0.991 | 0.961 |
| 32 | Thames Valley Berkshire | 0.765 | 0.381 | 0.534 | 0.501 | 0.868 | 0.042 |
| 33 | The Marches Enterprise Partnership – Shropshire and Herefordshire | 0.079 | 0.095 | 0.320 | 0.112 | 0.049 | 0.973 |
| 34 | West of England | 0.153 | 0.095 | 0.147 | 0.545 | 0.029 | 0.015 |
| 35 | Worcestershire | 0.590 | 0.027 | 0.298 | 0.522 | 0.114 | 0.364 |
| 36 | York and North Yorkshire | 0.193 | 0.302 | 0.563 | 0.247 | 0.072 | 0.624 |
Note: LEP: local enterprise partnership.
Appendix 3
This appendix reports the details of the regression analysis approach to the evaluation of matching consistency threshold values across outcome and ∼outcome models. First shown in Figure 3A are scatterplot representations of the respective consistency values (shown in Table 1) associated with an outcome and ∼outcome for the 11 configurations continued to be considered.
In Figures 3A(a) and 3A(d), the pairs of 11 configuration consistency values for Grwth and ∼Grwth, and Innvtn and ∼Innvtn, are shown in top and bottom rows of scatter plots, respectively. The dashed line labelled with a 1.000 in each scatterplot shows where, anywhere on that line, a single choice of consistency threshold value would be the same for both outcome and ∼outcome. The dashed lines labelled 1.114 and 0.981 in Figures 3A(a) and 3A(d) are the corresponding regression lines (with no constant terms) for the consistency values in each scatterplot. The regression coefficient values away from 1.000 indicate a variation in consistency context when considering either outcome or ∼outcome.
For the Growth outcome, with a regression coefficient value of 1.114, and as seen in the sub-boxed area in the scatter plot (3A(a)), the configuration-based consistency values associated with ∼Grwth are generally higher than those associated with Grwth. If this is to be taken into account in the subsequent analysis, then it may be pertinent to have different consistency threshold values for when considering Grwth and ∼Grwth. In Figure 3A(c), a blow up of the sub-boxed area shown in Figure 3A(a), consistency threshold values of 0.781 and then 1.114 × 0.781 = 0.870 were found to partition the configurations with respect to the association with Grwth or ∼Grwth (see shaded regions), without having the same configuration associated with both Grwth and ∼Grwth (empty unshaded top right region of sub-box). Shown in Figure 3A(b) is a similar result but using 0.781 as the consistency threshold value for when considering both Grwth and ∼Grwth. In Figure 3A(f), a similar illustration of the partition of the configurations in association with Innvtn or ∼Innvtn is given using the consistency threshold values of 0.859 and 0.981 × 0.859 = 0.843 for Innvtn and ∼Innvtn, respectively. The interpretation of these pairs of consistency values found is that they take into account the variation of consistency context in respect to an outcome and ∼outcome.