
Abstract
Traveling in a Hakka village, the tourist can feel the culture of the Hakka in Taiwan and see traditional drama, artwork, handicrafts, and foods. The current trend in tourism planning is to incorporate online word of mouth into route design. This paper aims to examine common characteristics of Hakka village tourism development, identifying the need for planning and offering a model of the directions planning might take. It begins with big data collection of the online service and combines that with social network analysis. The results indicated that tourism planning with user's online search strategy will provide a better and more precise tour service. It is suggested that the government should set up the tour service center at the location identified as being in the structural hole of the tourism network. As cultural tourism continues to expand, big data applications will offer new opportunities and challenges to tourism planning.
Introduction
Tourism, – employing millions of people and serving huge numbers of tourists worldwide – is regarded as one of the biggest and fastest growing industries in the world (Issa and Altinay, 2006) and so generates an estimated huge contribution to global gross domestic product (GDP) (Maswera et al., 2009; TravelDailyNews International, 2018). With the vigorous development of rural tourism, sustainable tourism in rural villages is beneficial for the conservation and revitalization of rural society and culture (Gao and Wu, 2017). Further, tourism may provide an alternative means for local communities to counter an economic recession (Hardy, 2003). However, a well-developed sustainable tourism strategy needs the participation of stakeholders to jointly formulate an effective tourism plan, through which to protect local communities from the hindrances of tourism’s negative impact and to help them get benefit from the tourism development (Lin and Simmons, 2017). Lin and Simmons (2017) addressed creating a structured inter-network collaboration among stakeholders led by government as beneficial for tourism planning.
In Taiwan, the development of cultural tourism in rural villages has received much attention as a means to leverage the local community economy. Each year, Hakka culture is celebrated by a total of 12 festivals surrounding Taiwan Hakka villages. The festivals are organized by the Council for Hakka Affairs of Taiwan. With the promotion of the cultural celebrations by the official institution, several Hakka villages in Taiwan are increasingly being recognized as interesting tourist destinations which, because of their natural and cultural attractions, have much to attract tourists.
Due to globalization and urbanization, rural agriculture, landscapes and lifestyle are undergoing rapid change (Gao and Wu, 2017). Nowadays, most Taiwan Hakka people migrate and settle in different areas of Taiwan in order to earn a living; they live together with other ethnic groups, and thereby they may lose their unique cultural identity. However, a small number of Hakka people still live in the hometown located among hills and mountains. These villages, with an outflow of population and without being over-developed, can remain in their natural environments and still can be distinguished by their preserving distinctly natural landscapes and Hakka cultural identity. These features resemble those of the model landscapes of Satoyama village in Japan, in which the people live in socio-ecological production landscapes and sustainably use the resources that benefit from local biodiversity conservation.
The low-level development of the economy and of industry has preserved traditional Hakka culture, such as architecture, material cultural heritage, folk etiquette techniques, religious beliefs and cultural and artistic activities. These cultural assets are worthy of being cherished and readopted into modern practice in order to restore and upgrade deteriorated Hakka property. In the process of reviving Hakka culture, the revitalization of the cultural industry is often seen as a way of promoting Hakka visibility as it can consolidate the efforts of local residents and the government to maintain Hakka culture by promoting tourism in the Hakka regions. In this regard, with the increasing number of tourists and the rapid development of the tourism industry in Taiwan, the assets accumulated in the Hakka regions have been perfectly preserved by cultural and ecological tourism (Chang and Hsie, 2004: 6). For persistent Hakka village development and persistent conservation of Hakka culture, as scholars note, sustainable traditional village revitalization requires an integrated rural tourism as a driving force (Gao and Wu, 2017). Thus, for sustainable Hakka tourism, it is necessary to propose planning a tourist corridor so as to attract tourist attention, such as the exploration of Taiwan Hakka villages tourism routes set forth in this study.
While the importance of tourism planning for tourism development (Gao and Wu, 2017; Issa and Altinay, 2006; Lin and Simmons, 2017; Shih, 2006) and rural village revitalization has received increasing attention (Blancas et al., 2011; Gao and Wu, 2017) as well as occasioned a growing body of tourism planning literature (Gao and Wu, 2017; Guo and Sun, 2016; Lin and Simmons, 2017; Shih, 2006), most of these studies have been about public participation in tourism planning (Gao and Wu, 2017; Lin and Simmons, 2017). Comparatively little research has appeared to explore the patterns of destinations networking for further planning of tourism by using social network analysis. Social network analysis is an effective tool for probing the network characteristic of multiple destinations and showing the spatial configuration with respect to all destinations by connecting available resources and attractions for tourism planning (Shih, 2006).
Shih (2006) employed social network analysis to explore structural network characteristic of 16 selected destinations located in Nantou county of Taiwan, and accordingly proposed appropriate tourist facilities and services for each destination under various plans of tourism routes in the context of tourism by driving. Although Shih’s work (2006) provided various planned tourist routes for the 16 selected destinations, it fails to go further to propose a comprehensive tourism corridor in the target tourism region wherein all possible destinations and potential attractions receiving the tourists’ attention have been identified and included for tourism planning as much as possible.
Researchers have addressed the values of innovative applications and analysis of big data in tourism forecasting (Li and Wu, 2019) and in tourism planning (Yang and Stienmetz, 2018); this approach may bring important implications for destination management and advantages to tourism planning practices (Yang and Stienmetz, 2018). For example, Li et al. (2017) adopted online data, such as the volumes of search engine queries, to forecast tourism demand for a destination, including tourist numbers and hotel occupancy. In short, the benefit of analysing big data gathered from tourists’ online keyword searching is that, accordingly, all possible attractions on their planned trip can be identified for tourism planning. A way to enhance effective tourism planning is via public participation of stakeholders to collaboratively plan tourism (Lin and Simmons, 2017). As public participation is considered a cornerstone of sustainable tourism planning (Lin and Simmons, 2017), the actions of searching for travel attractions on the internet can be regarded as the means for potential travellers to play a public participation role in tourism planning – because their search activity provides tourism planners with data to identify which attractions, distributed within tourists’ planned tourism region, are the most popular search and potential hotspots. Thus, the planners can plan the tourism routes to attract tourists and closely reflect the needs of the tourism market.
In sum, on the one hand, this study regards cultural tourism behaviour as a concatenation of different nodes and links. Each sight, store, activity, and souvenir is a node, which can interact with other nodes within the tourism network. Social network analysis is helpful to show all connections of identified nodes in a tourism region. On the other hand, in order to address the issue of how to collect data for social network analysis of tourism planning, this study considers ways in which tourists search online for tourist attractions and hotspots. This researched information is then regarded as the data source for social network analysis. By utilizing big data analytics to identify the possible nodes appearing in the planned tourism area, the tourism planner can then construct a context-aware tourism plan in which a sightseeing corridor connecting tourist hotspots is outlined to attract tourists and, in the instance under consideration in this study, to promote the preservation and regeneration of Hakka culture, thereby achieving sustainable tourism for levering Hakka tourism economy.
Literature review
Hakka tourism planning
A national approach to tourism planning has been conceptualized as a five-stage model with a description of steps regional tourism planning should follow (Gunn, 1980). The objectives of the first stage, study preparation, are to identify and plan a destination for the trip. Generally, the tourism planning is led by the government, and other specialists are invited to participate jointly in the planning process. The second stage is to determine the goal and objective of tourism planning by balancing the environmental, social, and economic issues. The planner should decide where the tourist may want the visit to take place within these destinations and follow up by evaluating the natural resources located at these destinations. The third stage is to conduct a survey by using a combination of statistical and quantitative methods to collect related tourism information, such as the planned tourism destinations’ existing facilities and services, economic situation, social conditions, availability of natural and cultural resources, and so on. The fourth stage is analysis and synthesis regarding tourism development by (1) identifying the tourism’s opportunities and constraints and (2) proposing a conclusion with respect to tourism capacity issues, such as requiring new or refined attractions and services for the planned tourism. The final stage, policy and plan formulation, is the integration of tourism plans as a whole and provision of a recommendation about the tourism development by assessing the social and environmental impacts (Gunn, 1980).
In Taiwan, a national-level tourism plan, Hakka Romantic Avenue, was introduced by the Council for Hakka Affairs in 2017 to develop the tourism industry, also with aims to promote the Hakka's tourism economy, improve the natural environment and revitalize the cultural landscape of Hakka villages. According to the World Travel & Tourism Council (WTTC), which is the most authoritative nongovernmental source of international tourism statistics, the value of Taiwan's tourism industry in 2016 totalled USD 13.3 billion. With a growth rate of 3.3%, tourism is a key economic industry of sustained growth in Taiwan (WTTC, 2017). Although the Hakka villages are full of traditional cultural elements and possess a natural environment for attracting tourists, the cultural tourism planning targeting Taiwan Hakka villages has not well implemented by the tourism planners due to the lack of official support until 2017.
The Hakka Romantic Avenue has been designated as a way of pushing visitors to visit the Hakka villages. The first stage of the national ‘Hakka Romantic Avenue’ is to establish the infrastructure and support the promotion of cultural projects such as Hakka cultural innovation, new agriculture, green creation, industrial settlement and cultural eco-tourism. However, there has still not been proposed a well-developed plan for Hakka culture tourism planning along Hakka Romantic Avenue. Such a plan would have the virtue of (1) identifying important factors attracting tourists; and (2) addressing the attractive destinations and also attractions within the villages of Hakka Romantic Avenue and (3) linking these attractive destinations and attractions as a specific tourism route. In this regard, the present study employs big data and social network analysis to propose a tourism plan along Hakka village tourism corridors.
Big data and social network analysis
The tourism industry is a networked, fragmented and geographical industry in which cooperative and competitive organizations, – such as national tourism offices, hotels, travel agents, and restaurants, together with their managers – develop business and personal relationships for linking the destinations with attractions, festivals, and tours as a tourism network (Scott et al., 2008: 1). Tourism with a network feature is suitable to use social network analysis for tourism planning, because social network analysis can offer a number of useful outcomes for analysis of tourism destinations and organizations (Scott et al., 2008). The use of social network analysis for tourism planning should assess the degree centrality, in terms of in-degree and out-degree, and identify the network structural holes among nodes in the terms of constraint index (Shih, 2006).
In-degree denotes the sum of numbers of inward connections with respect to a focal node from other nodes within the network; out-degree means the sum of numbers of outward connections from a focal node to other nodes within the network (Burt, 1992; Shih, 2006). While in-degree represents the receipt of numerous tourism routes with respect to a focal destination, out-degree reflects transmission of numerous tourism routes with respect to a focal destination (Shih, 2006). So, these two parameters disclose whether the focal destination is a ‘‘beginning’’, ‘‘core’’, or ‘‘terminal’’ destination for various tourism routes as a consideration in planning for tourism (Shih, 2006).
The concept of structural hole has been applied to identify the critical nodes within the network in tourism planning (Shih, 2006). Burt (1992) indicated that, considering a simple example of structural hole within an ego network of a node, two other nodes within the network lack direct connection but have an indirect linkage via the node that can be identified by social network analysis as a ‘‘structural hole’’. Thus, the node being considered occupied a position with a competitive advantage to broker others’ node connections within the network. The constraint index measuring the node with the feature of being a structural hole, – with the range from 1 to 0, – refers to the extent to which a node, directly and indirectly, depends on other nodes as it connects another within the egocentric network of the node (Burt, 1992; Shih, 2006). The node with the higher constraint value indicates that it is difficult for it to be associated with other nodes. Vice versa, the lower value represents that it has more connection to other different nodes; it exists as a structural hole (Burt, 1992), which serves as a gateway to occupy the necessary communication channels between the nodes.
In the context of tourism planning, compared with other nodes without the feature of structural holes, a focal destination with the feature of structural holes located at a at non-substitutable location will have more opportunities to bridge the flow of tourists. So, Hakka villages identified as the structural holes, with advantages as central hubs to broker the tourist flow among destinations (Shih, 2006), should be included as the must-have destinations and be allocated more facilities and services in planning a Hakka village tourism corridor.
Various sources of big data have emerged to provide a large amount of real-time data with space–time tags on tourism activities and destinations (Pan and Yang, 2016: 43–62). This is especially useful for travel agencies, who can use it to track their own online traffic and customer behaviour. The development of big data means that as more and more tourists share their travel experiences on social networking sites and discussion fora, far more insights can be gleaned now than earlier. Social media changes how travellers see and experience their trip; the sharing of tourism experiences is becoming increasingly important (Kim and Fesenmaier, 2017), especially for tourism planning. Thus, customer-oriented tourism planning is necessary for the planner to understand what the tourists like right now (Sun and Lee, 2004).
The analysis of consumers' online keyword searches using big data techniques can reflect consumers’ tourism preference and can be regarded as a preliminary exploration of social network analysis in which the keyword may serve as a node of a tourism network. The tourism network, in which social network relationships among nodes can represent different consumer interests ( Luo and Zhong, 2015 ), can provide cues for tourist agencies, manager(s), and researcher(s) to construct a well-designed tourism plan. Accordingly, the use of social network analysis in the present study constructs a tourism network by capturing communication characteristics of travel-related data obtained from considering and collecting the online opinions of individuals as well as the masses with respect to destinations, attractions, facilities and so on.
Research method
In this study, the relationships between the famous stores, souvenirs, festivals, celebrations, events, and specialties collected from online are analysed using social network analysis. To complete the social network analysis of the present study, the research procedures will be included: (1) data collection, (2) data analysis, and (3) data visualisation.
Google trends for data collection
With respect to data collection for social network analysis, social media and social network websites enable the researchers to find tourists’ travel experiences of visiting places related to their interest (Cvelbar et al., 2018; Gou et al., 2016). The factors relating to the context of cultural tourism planning, such as for Hakka cultural eco-tourism, can be identified by gathering the tourists’ searching tourism information from the Internet, which can be done via the emergence of new technologies (e.g., artificial intelligence) or web services (e.g., Google Trends). Social network analysis requires a large amount of sample data, so tourism planning adapts big data techniques to collect full network data in a systematic way. Google Trends is the free web tool offered by the web search engine giant, Google, that allows users to shop common search issues and manipulate information to create tailored insights. Thus, this study uses Google Trends, a service provided by Google Labs, to collect big data for the social network analysis.
The search issues and manipulation of information as big data for social network analysis in this study include: (1) external factors, such as the physical geographical environment and social-cultural events, and (2) internal factors, such as the physical conditions of a tourist. There are four kinds of Google Trends services. The Google search interest can be classified by season, region, related topics, and related queries. First, the ‘Search Query Trend’ analysis function can be used to understand the seasonal trends of products. Second, the ‘Interest by Region’ analysis function can offer understanding of the geographical location of the target consumer group. Third, the ‘Related Topics’ analysis function can be used to understand the distribution of related products. Fourth, the ‘Related Search’ analysis function can understand the customer's expectations. Moreover, the ‘Related Topics’ and ‘Related Search’ analysis functions can also be used to identify search themes that are rising in popularity (Google, 2018).
Data collecting
By collecting tourism data using Google Trends, the researchers analysed Google web search data related to travel in Taiwan Hakka villages from January 2017 to December 2017. The term, Hakka villages, also refers to their role as a key development area of Hakka culture in Taiwan. As depicted in Figure 1, there are 28 Hakka villages along the Hakka Romantic Avenue. Thus, the names of 28 townships and cities were used as search keywords. In order to better understand how the cultural elements influence the intention of a tourist to visit Hakka villages, this study also adds 12 cultural elements, together with the names of the 28 townships and cities, as search keywords that can be classified into four main categories: i.e., Hakka traditional food, Hakka festivals, Hakka religion activities, and Hakka cultural activities. Hakka traditional food included (1) Hakka Leicha (Ground Tea), (2) Oriental Beauty Tea, (3) Traditional Dessert (Niu-Wen-Shui), (4) Bitter Orange Tea, and (5) Herbal Tea. Hakka festivals included (6) New son cake festival in Donshin and (7) Tung Blossom of Hakka Festival. Hakka religion activities included (8) worshiping Yimin Men and (9) worshiping Sanshan Guowang. The Hakka cultural activities included (10) a DIY Hakka flower cloth, (11) visiting Liudui Park, and (12) visiting Hakka Cultural Park. After Google web search data collection via using Google Trends, a total of 281 elements in connection with these search keywords were identified by the researchers and used as nodes; according to the features of these nodes, these nodes were further classified into four types of nodes, – (1) tourism destinations: including 28 Hakka villages and tourist attractions surrounding these villages and, (2) famous stores, (3) specialties, and (4) festivals and activities along Hakka Romantic Avenue, – for social network analysis.

The 28 Hakka Villages along Hakka Romantic Avenue, distributed within Taoyuan city, Hsinchu city, Hsinchu county, and Miaoli county, and Taichung city.
UCINET 6.0 for the social network analysis and visualisation
This study uses UCINET 6.0 for the social network analysis (Borgatti et al., 2002). The relationship matrix was established from the result of big data analysis of Google Trends, which data were collected from various sources including Google's own website, its own blog and other websites. By quantifying the relationship between nodes, the researchers found the centrality and structural holes. With the relational data, the interaction can be analysed in terms of the relationships among nodes. These nodes were mapped into network diagrams using NetDraw, which is embodied within UCINET 6.0 as a visualization tool. The produced graph can show how many people are interested in a particular topic and what they think about it.
The result of big data analysis
Diverse big data have been applied to tourism research and made an amazing improvement (Li et al., 2018). Online tourism data helps analysts identify whether search volumes and patterns are increasing or declining. For example, Google Trends service used in this study is a good way to discover attractive Hakka villages for tourists to perceive as worthwhile to visit. Analysis results provided by Google Trends can allow the researchers to find seasonal trends in one clear-cut photo. The big data analysis of this study exemplified by Google Trends comprises (1) seasonal trend analysis shown by the search frequency and (2) search popularity comparison of different locations appearing in Google search, as described below in this section.
Search popularity refers to the volume of searches for a particular keyword, which is an indicator of the desirability of domains related to the hot topic (Coull et al., 2012). Search frequency is one of the measurements of search popularity. Google Trends gauges the search popularity of certain terms and topics among a targeted audience in terms of search frequency. The search frequency can only reflect the change in search volume by those targeted audiences with respect to a location during a period; it cannot be used to compare the search popularity of one location with that of other locations. In this regard, Google Trends uses the term, “compare relative popularity” by normalizing keyword search data over a period to make trend analysis easier. The term, relative search popularity, in Google Trends analysis is the ratio of a query’s search volume at a time point within the period to the greatest search volume at a specific time point (highest peak of search volume) within the period. The volume is measured with the range from 0 and 100. The higher the number of the volume measurement, the higher the popularity of the searched keyword.
Seasonal Trend Analysis As shown in Figure 2, the overall trend analysis of 28 Hakka villages with respect to search frequency was carried out. There are significant differences in the search (frequency) trend. However, it should be noted that each trendline shown in Figure 2 represents only the search frequency with respect to its corresponding Hakka village in different months of 2017, which cannot be represented as an indicator for comparing the search popularity with that of other Hakka villages.
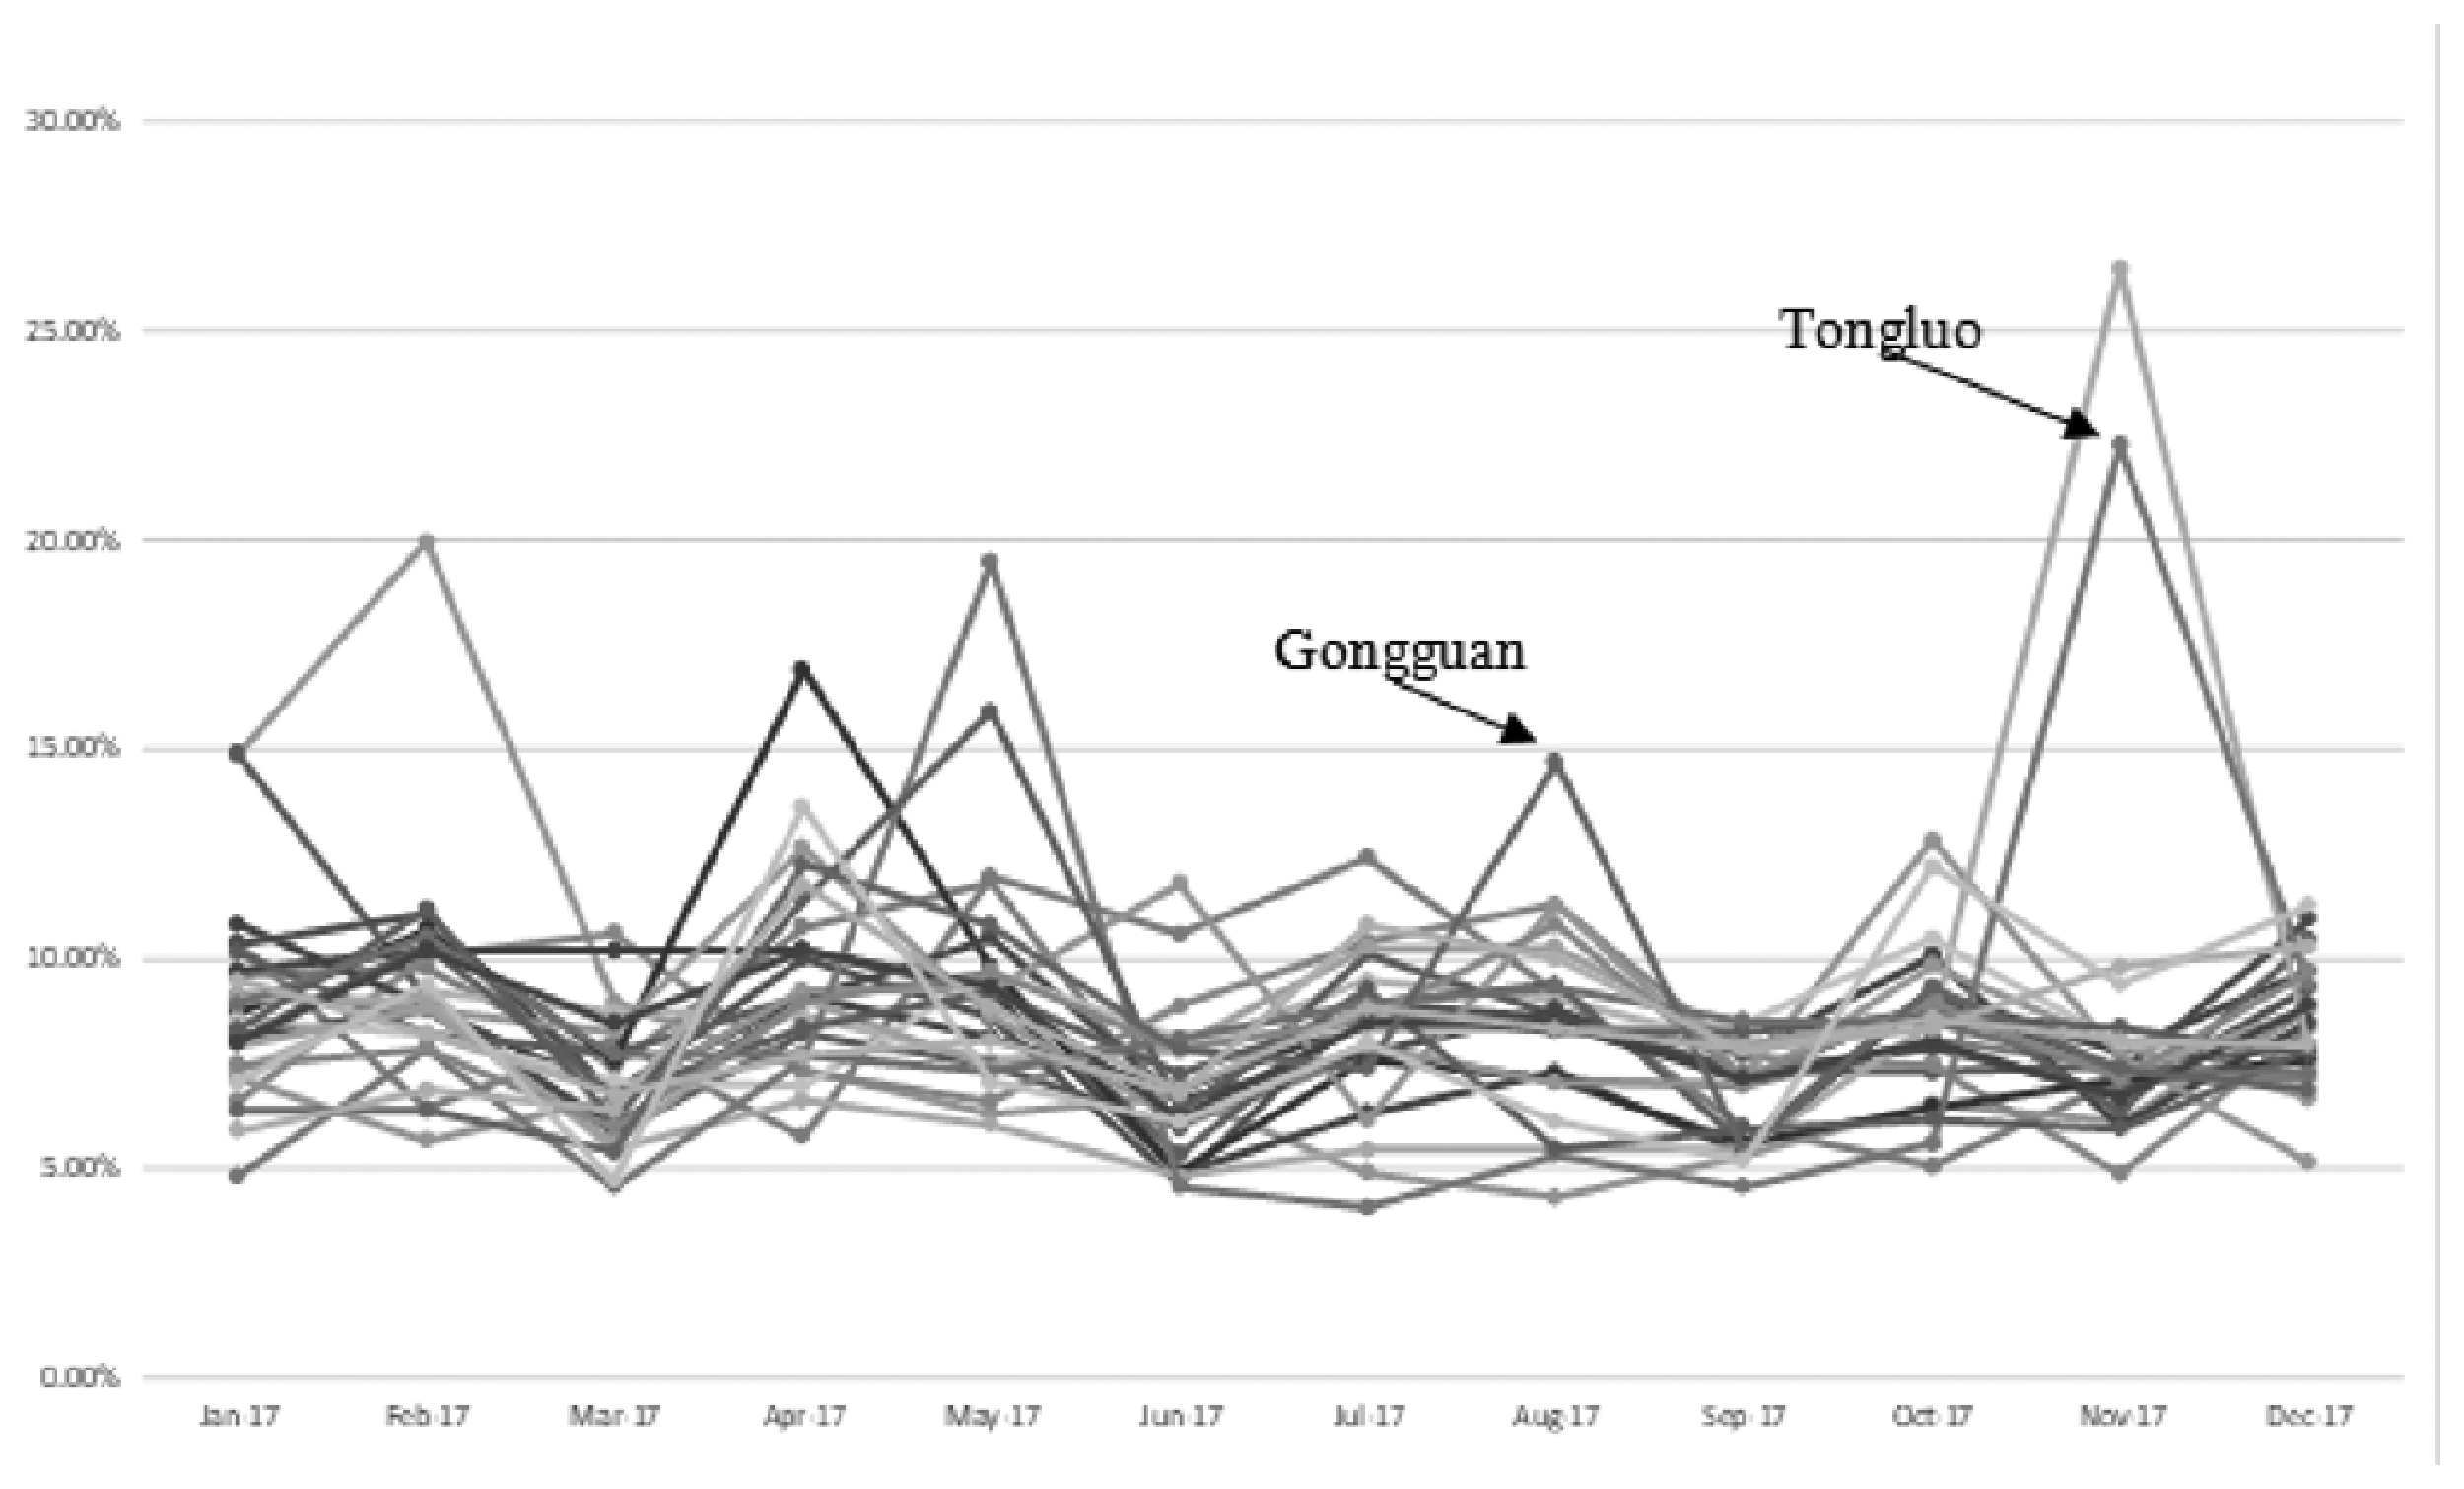
Seasonal Trend Analysis for Hakka villages.
The trend analysis in Figure 2 shows that the number of potential visitors reflected by their online searching for Gongguan increased by about 15% in July and August, which also falls within the harvest period of local agricultural products and, thus, leads to more tourists visiting during this summer season in Taiwan. This is a good sign for travel agencies and, according to the results of the trend analysis, enables them to make better decisions on how much budget they should invest in advertising for attracting tourists to visit the target village.
Another example can illustrate further how big data can help travel agencies plan tourism targeting the seasonal tourist hotspots by considering the seasonality of a crop which is very suitable for planting, Hangju (chrysanthemum). When the chrysanthemums blossom in November of each year, the flower petals cover the Jiuhu platform of Tongluo, creating beautiful snow-white scenery everywhere and so attracting many tourists to visit Tongluo or to visit relevant sites online by using keyword searches. As shown in Figure 2, search frequencies for Tongluo, suddenly go up. Therefore, Tongluo which is not frequently searched, will suddenly have a higher retrieval volume in November of each year. Accordingly, tourism companies can carry attractive advertisements by addressing this local beautiful landscape with seasonality for the purpose of persuading potential visitors.
In sum, by capturing the seasonality factor, the seasonal variance of search frequency with respect to each destination, as a trend line for each village represented in Figure 2, analysts can predict the level of tourists' willingness to travel to the specific destination in each period. This information can be used as a strategy guide for tourism companies to develop and organize relevant tourism marketing activities. Thus, the result of the big data analysis as revealed in Figure 2 can provide a great opportunity for tourism companies to plan attractive tourism for tourists with the willingness to visit the seasonal tourist hotspot.
Search Popularity Comparison When comparing the frequency of keyword searches, this study discovered the diversity of search popularity among Hakka villages. For example, taking Nanzhuang, Dahu, and Tongluo as depicted in Figure 3, the number of searches by Google search users related to Nanzhuang remained a significant amount over the entire year, which reflects it may be the most popular tourist destination within the Hakka Romantic Avenue of Taiwan. Compared with the second-interest search rates, i.e., for Dahu, and with the least-interest search heats, i.e., for Tongluo, people searched for Nanzhuang with high-interest search rates, representing that tourists have a greater intention to visit the local attractions there. Thus, they would like to search online for relevant information about local attractive places for planning a tourist visit.
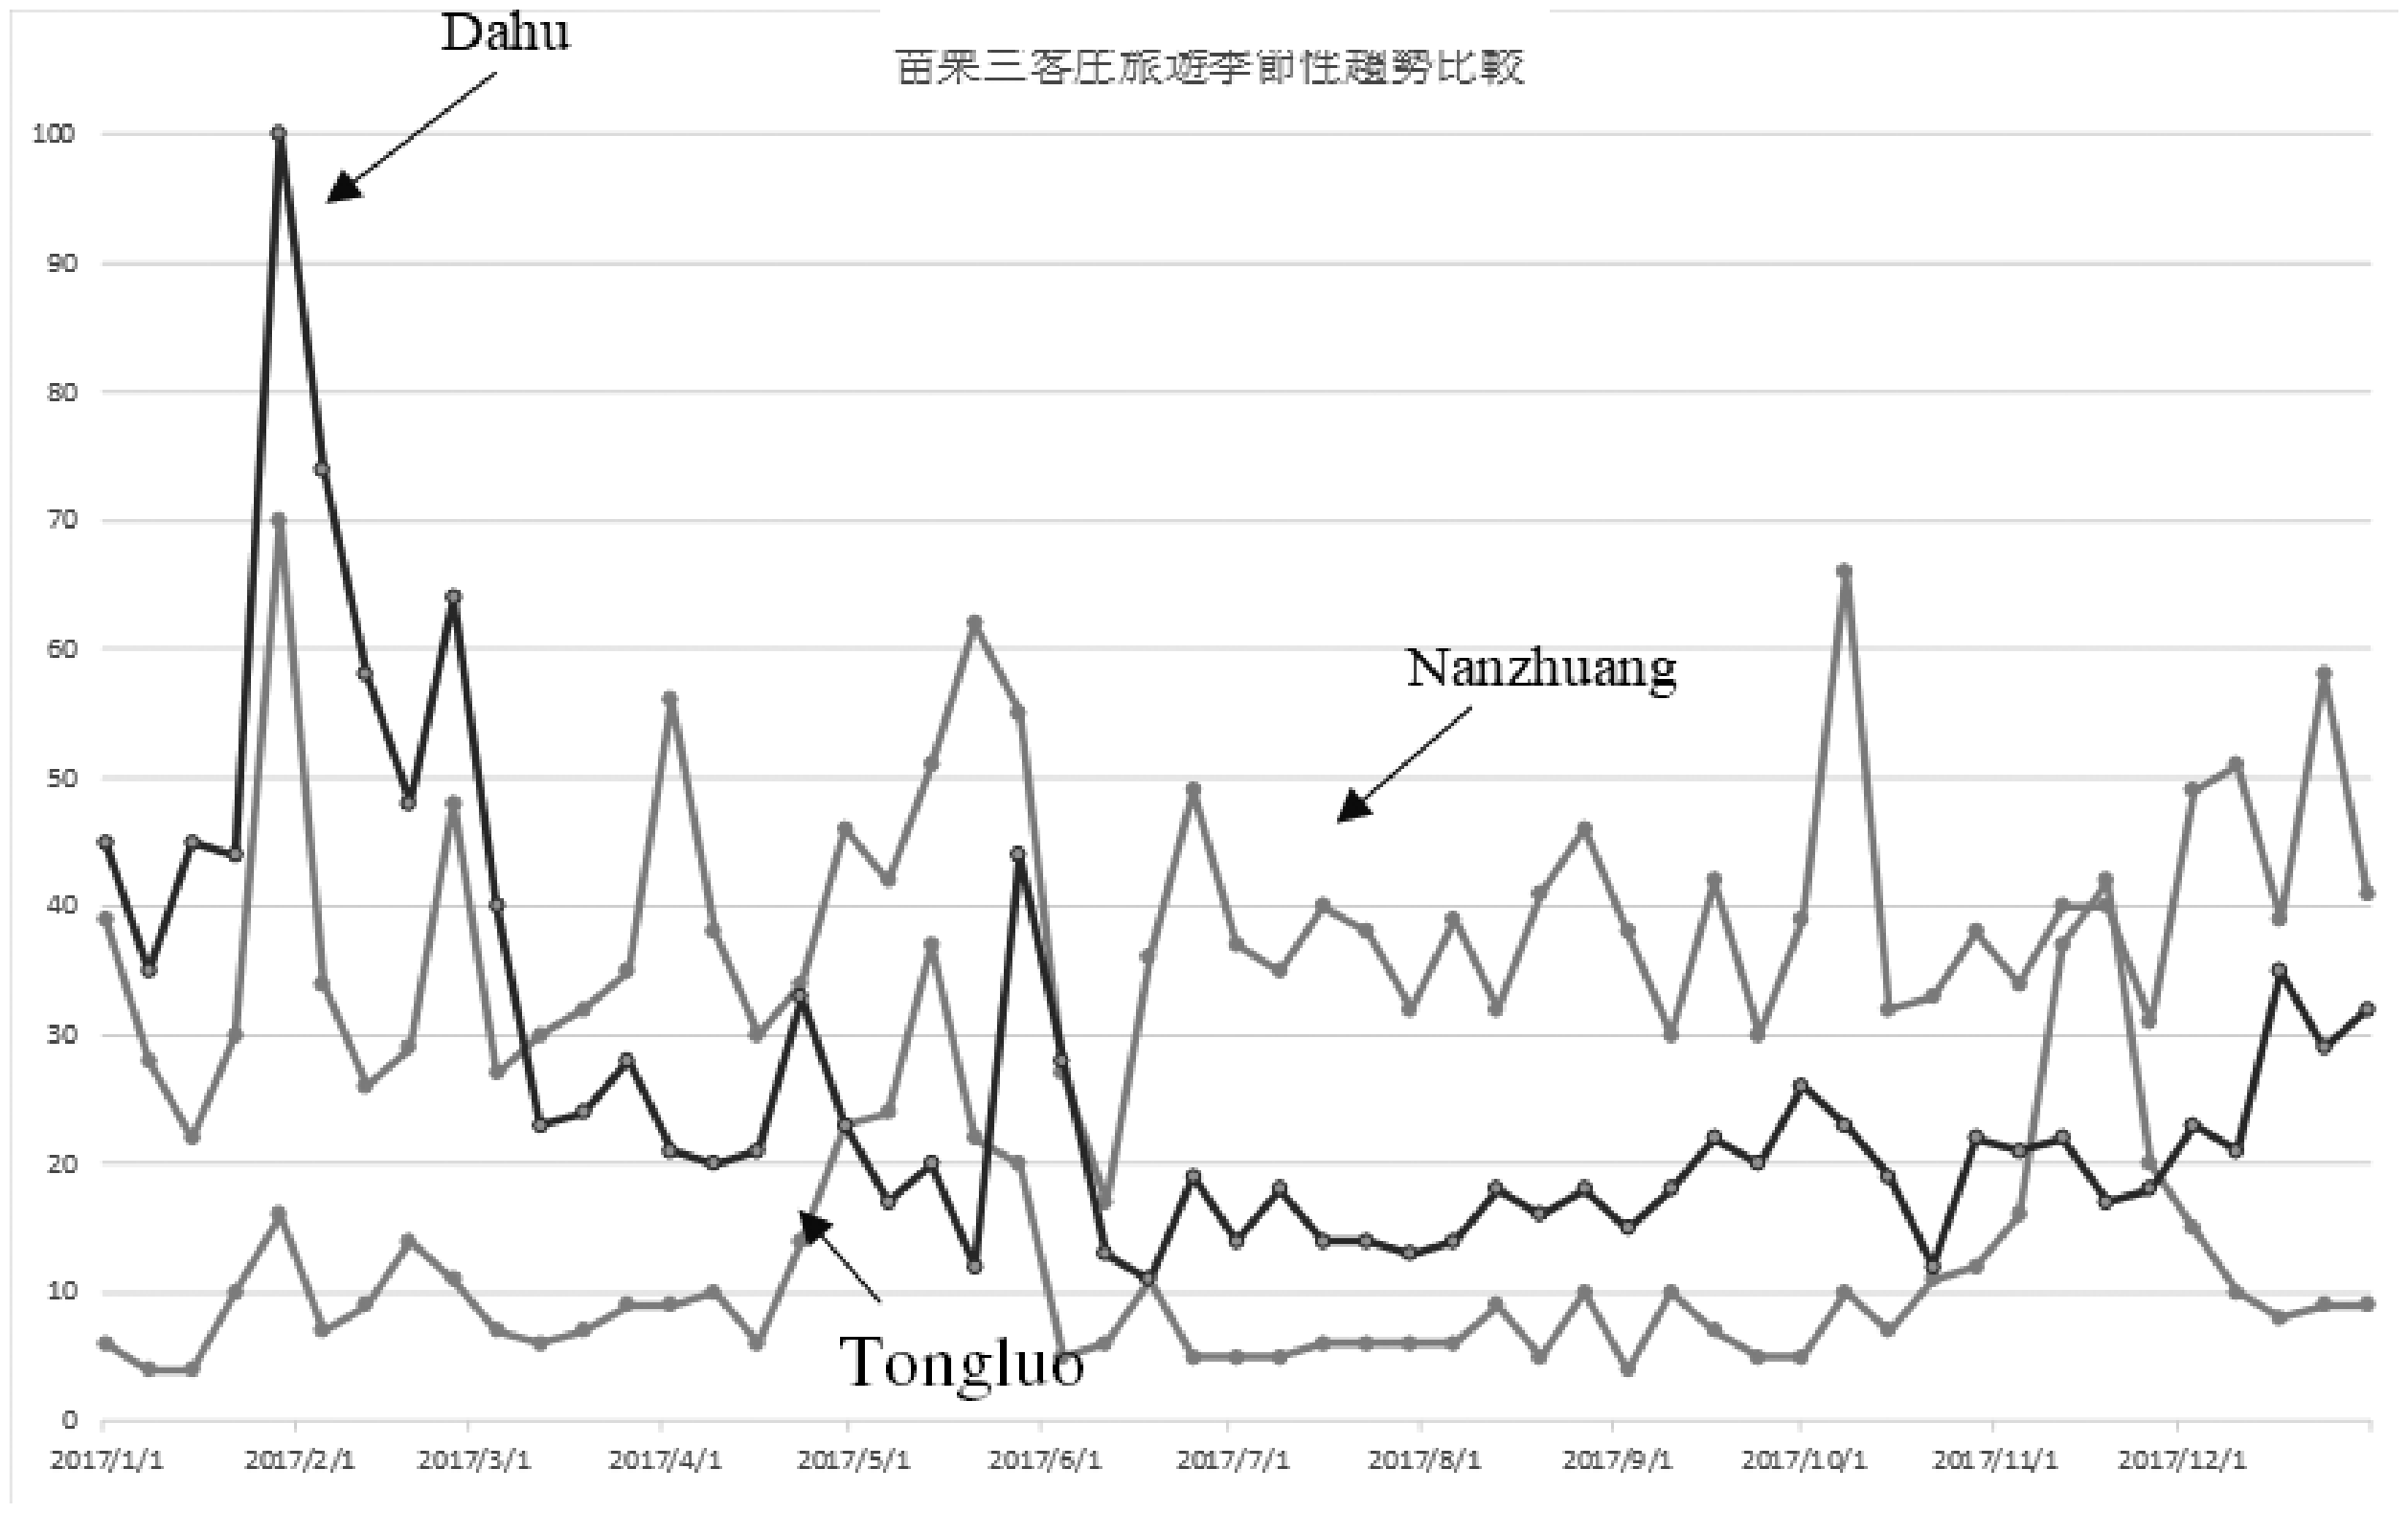
Search Popularity Comparison of Nanzhuang, Dahu and Tongluo.
Further analysing the seasonal differences with respect to search popularity discloses that there is a crossover effect of the search heats among these three Hakka villages. For example, during the Chinese New Year, February as shown in Figure 3, search frequencies for both Nanzhuang and Dahu increase noticeably, but the search frequency for Dahu villages is higher than for other Hakka villages in this period. It is critical to inspect what factor is associated with high search frequencies for Dahu villages in this period. Because this period is strawberry abundance in Dahu, there is more online search demand for strawberry in Dahu than any other Hakka villages. Also, in the Chrysanthemum season of Tongluo in November, the search volume of Tongluo will exceed that of Nanzhuang and Dahu; and in the Tung blossom season in May, the tourist popularity, in terms of search volume, of all three Hakka villages of Miaoli county, – Nanzhuang, Dahu, and Tongluo – increase. This is also a good signal for local officials and farmers to invite travel agencies to participate jointly in formulating a marketing strategy, thereby enhancing the growth of the fruit market in search popularity with respect to focal tourism destinations that have a significant high level in the specific period. In sum, the big data analysis exemplified by Google Trends analysis, as this study reveals, can be used to identify the popularity of tourism destinations in different seasons for tourism planning in the surrounding local area.
The result of social network analysis
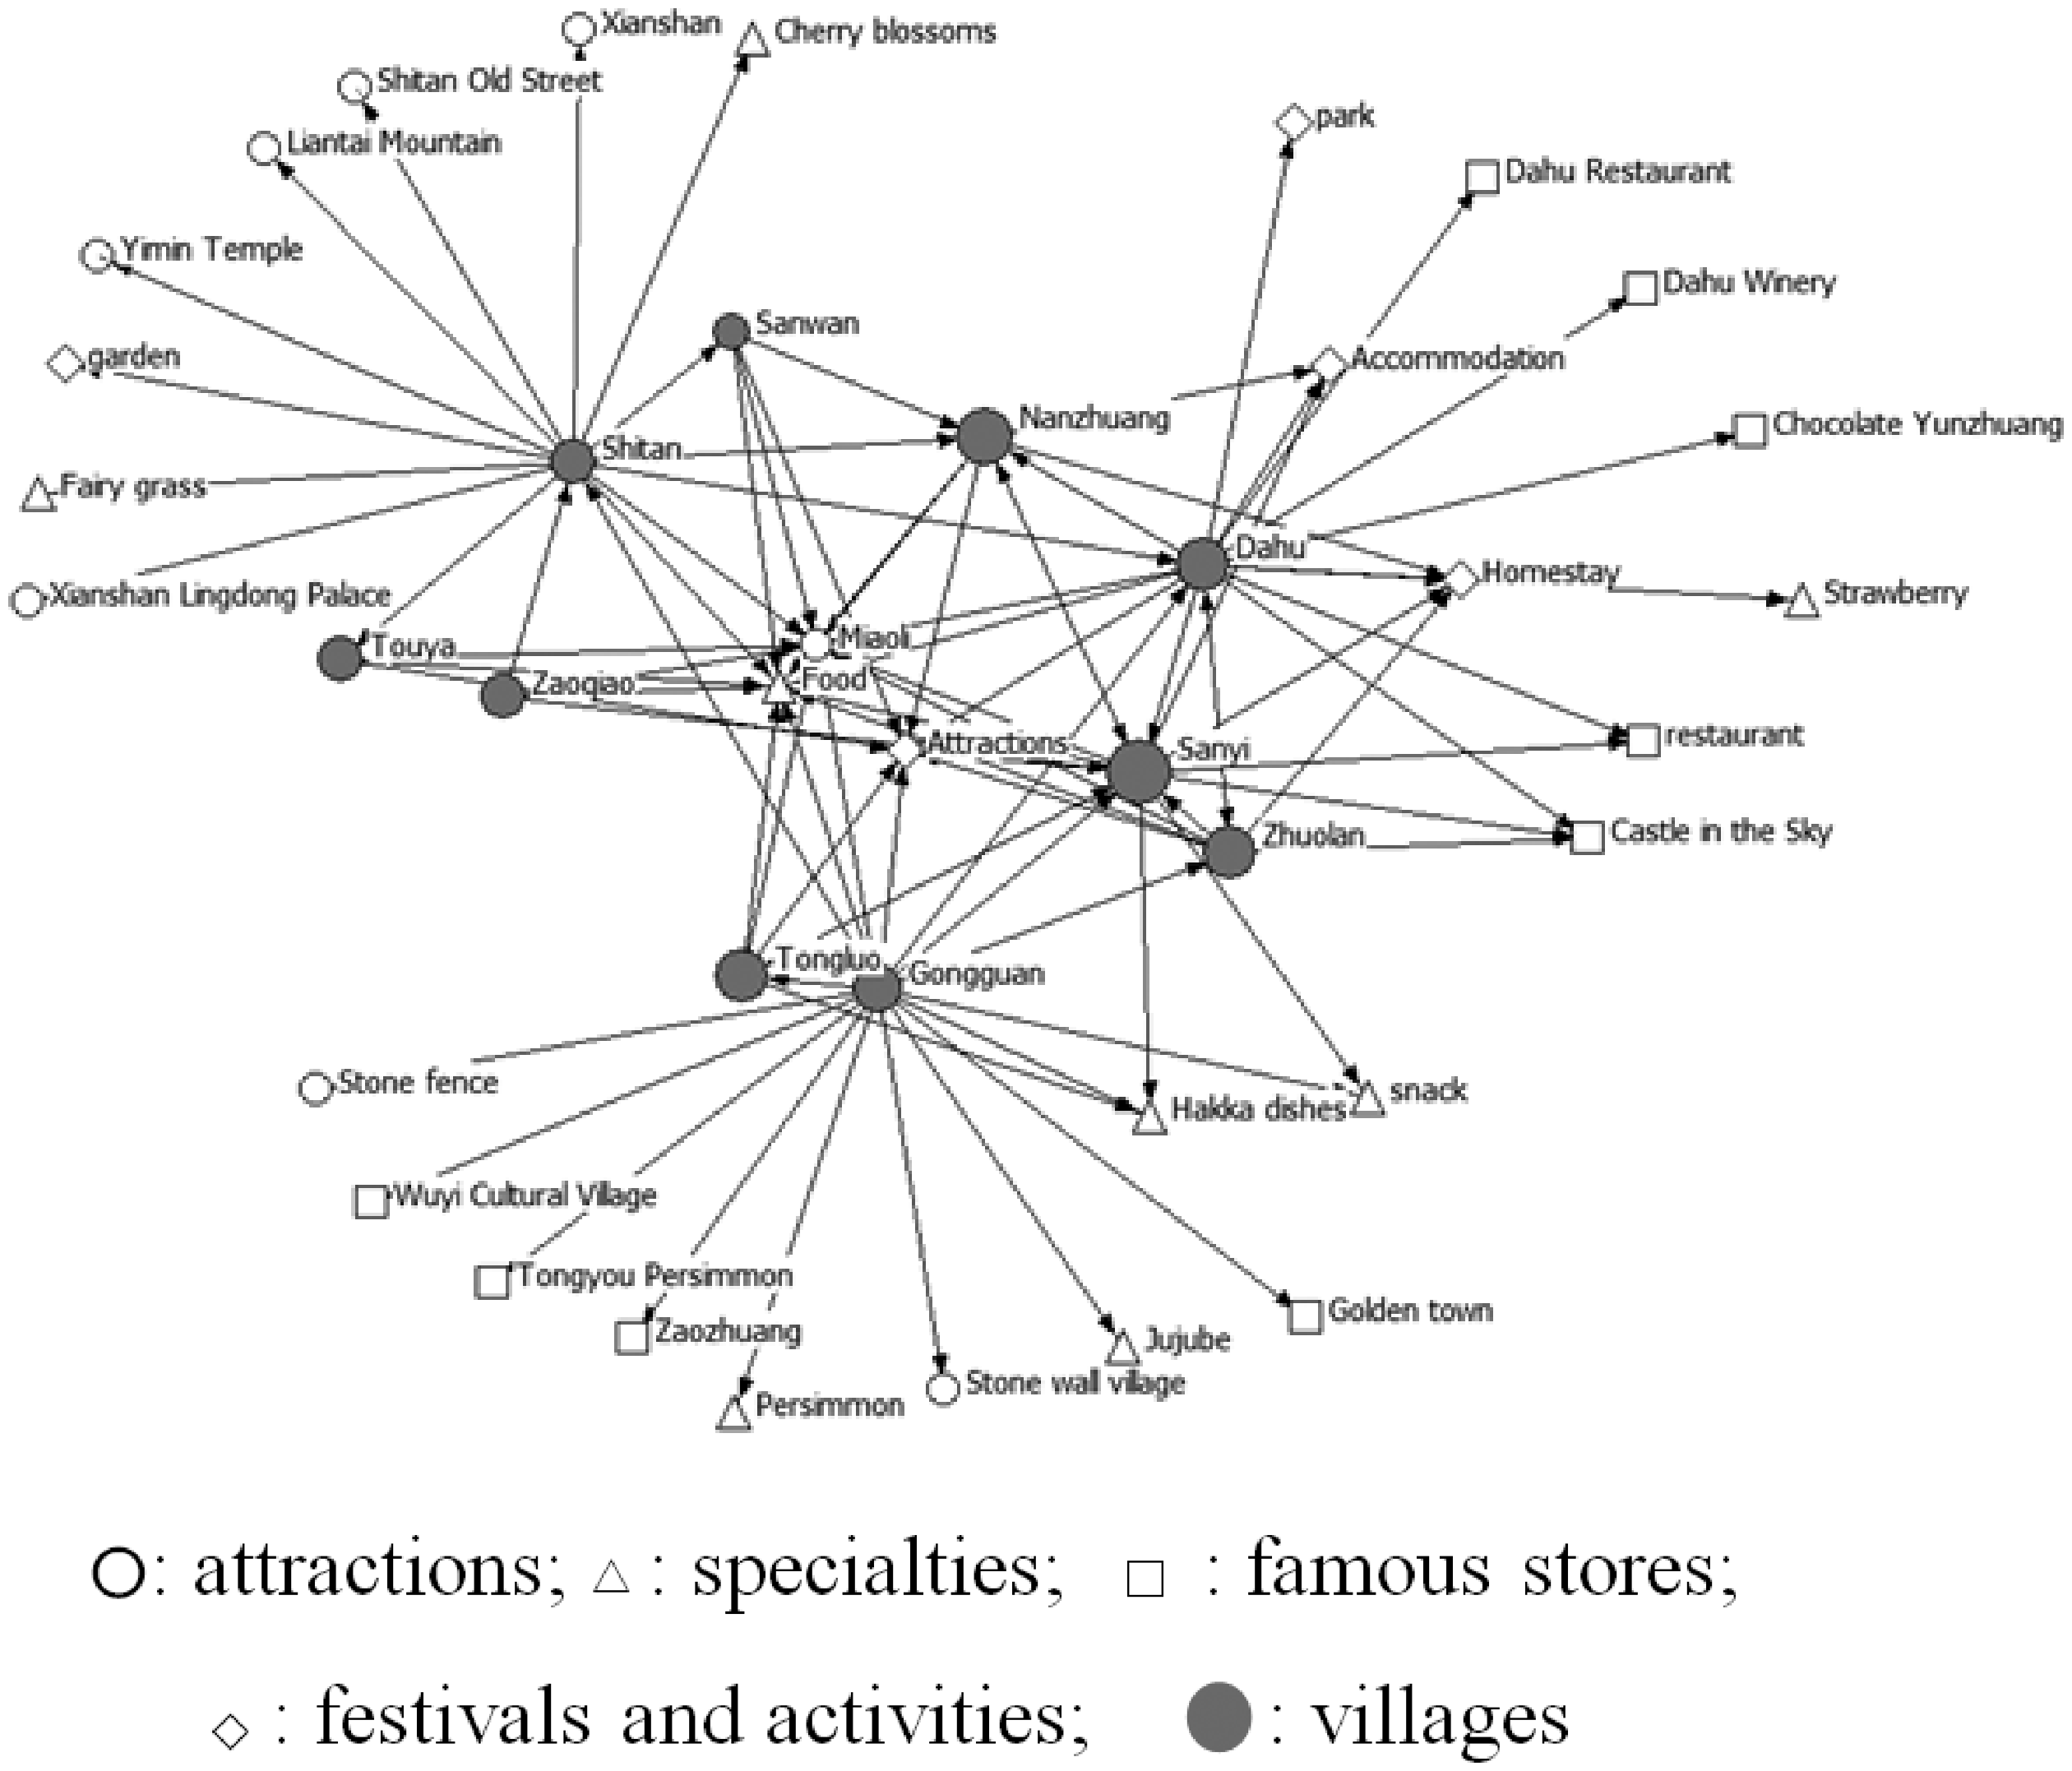
Social network analysis in this study is used to analyse the structure and shape of relationships between actors in tourism. The information for social network analysis was gathered from Google Trends, including geographical regions (28 Hakka villages), tourist attractions, famous stores, special products (specialties) and activities. As shown in Figures 4to 8, each node was assigned a distinct shape. Circular nodes represent destinations – including attractions with the shape of hollow circle and villages with the shape of solid circle; the square nodes represent famous stores, and the diamond nodes stand for festivals and events; the triangular nodes represent specialties. Firstly, this study uses social network analysis to determine the degree of centrality of the various tourism nodes, that is geographical regions (the villages), in terms of in-degree and out-degree.
Out-degree of nodes can be used to find out which destinations are connected to advertised products or services. The data, out-degree, collected from these nodes are then used to disclose which destinations have been visited, which hotels have been stayed at, which restaurants patronized, and so on. For example, the out-degree of Beipu was 98 as shown in Table 1, which means that there were 98 connected nodes, including souvenir shops, restaurants, hotels and other tourist spots that have been visited by tourists, paired with searches for Beipu (tourism destination, i.e., village). This is a great way to get information about the destinations (villages) tourists visit and also learn more about their culture and traditions through the attractions the tourists arrived at as they visit a specific destination. Importantly, it's also a great approach to know whether there are any hidden destinations in the area that current travel planning has not covered and realize where tourists will go next after they visit the destinations. In sum, the result of social network analysis can help travel agencies provide valuable information about local attractive destinations and a travel route, thereby promoting activities surrounding these destinations for appealing to tourists.
Network indicators of 28 Hakka villages along Hakka Romantic Avenue.
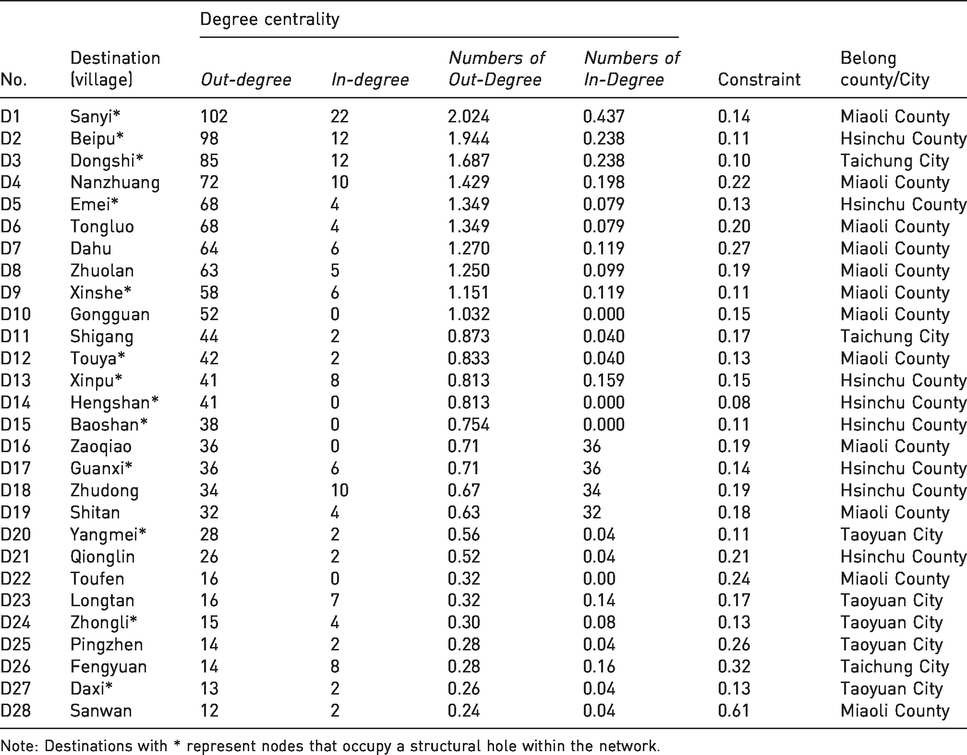
Note: Destinations with * represent nodes that occupy a structural hole within the network.
Whole social network of hakka village tourism
The whole social network of Hakka village tourism connecting all nodes is illustrated in Figure 4. A total of 28 nodes marked with big black circular spots are 28 Hakka villages. Table 1 shows in detail the result of social network analysis with respect to the 28 labelled nodes, which represent in detail the 28 Hakka villages along the Hakka Romantic Avenue. According to the distribution degree centrality of network nodes in terms of in-degree and out-degree in Table 1, the top three tourist hotspots are Sanyi (out-degree = 102; in-degree = 22) located in Miaoli county, Beipu (out-degree = 98; in-degree = 12) located in Hsinchu county, and Dongshi (out-degree = 85; in-degree = 12) located in Taichung city. That is, the density of famous stores and attractions distributed among these three areas are the highest in the network. The attraction of 28 Haka villages can be classified as at three levels and the levels are determined by adding the out and in numbers: higher level (out-degree numbers + in-degree numbers) >=50); moderate level: 50 > (out-degree numbers + in-degree numbers) >=25); and lower level of attraction (out-degree numbers + in-degree numbers) < 25). It can be said that the most popular tourist attractions of the traditional Hakka villages (out-degree numbers + in-degree numbers >= 50) are Sanyi, Beipu, Dongshi, Nanzhuang, Emei, Tongluo, Dahu, Zhuolan, Xinshe, and Gongguan villages. In addition, Shigang, Touya, Xinpu, Hengshan, Baoshan, Zaoqiao, Guanxi, Zhudong, Shitan, Yangmei and Qionglin also have good tourism attraction (50 > out-degree numbers + in-degree numbers >=25). In contrast, Toufen, Longtan, Zhongli, Pingzhen, Fengyuan, Daxi, and Sanwan are less frequently searched for because of their lack of visibility or attractions (out-degree numbers + in-degree numbers < 25).

Whole Social Network of Hakka Villages Tourism.

Step 1 for Cultural Tourism Planning.
Overall, the tourism potential of the Miaoli area is better than that of other areas including Hsinchu, Taichung, Taoyuan. High development opportunities exist for the tourism industry in Miaoli, because there are seven destinations located in Miaoli county that are in the top ten tourism search hotspots as shown in Table 1.
Cultural tourism planning
The first step for Cultural Tourism Planning is to identify the start destination and then add nearby destinations and attractions. Shitan village is where the tourist destination has been chosen. Generally, the starting destination must have a good reputation and/or geographical convenience, thereby being able to attract tourists from all over the world. In this regard, Shitan village has the advantage of being located on a hill near the city of Miaoli, the capital of Miaoli county, and is surrounded by mountains. The main attraction of Shitan village is its advantageous geographical location, based upon its being located in the middle of the Hakka Romantic Avenue, so the tourist can easily go to other attractions. As shown in Figure 4, the nodes around Shitan village in the social network represent several famous stores, special products, activities and other destinations which are connected with the related attractions showing local Hakka culture, including Yimin Temple, Shitan Old Street and Xian Mountain. The specialities include cherry blossoms, grass jelly and other things from several destinations, including Gongguan, Zaoqiao, Sanwan, Dahu, Touwu, Nanzhuang, etc. Shitan village, therefore, is suitable to assign as the starting point for the tourism planning.
The second step is to extend the trip scope and explore the potential opportunities for tourism. This will help the planner to understand what kind of additional attractions the customers want to consume. Taking Shitan as the example again, social network analysis can be used to find out the best way of reaching out to tourists as they are contemplating a trip to Shitan and discover that there are not enough attractions. The trip planner can consider going to the surrounding Hakka villages, such as Gonguan and Dahu. After adding these other villages to the itinerary, there are more places to visit, such as Chocolate Yunzhuang, Dahu Winery, Castle in Sky, Jujube and Stone Wall as shown in Figure 6.
Step 2 for Cultural Tourism Planning.
In practice, with the time and cost constraint, the tourists would like to visit as many more attractions as possible and as they can; thus, geographical considerations will appear in the process of choosing online keyword searches. That is, potential tourists naturally make search requests based on consideration of the geographical clusters among attractions surrounding the destinations to maximize their interest. Thus, for travel agencies, geographical location is a factor for reference when seeking to design a well-planned trip. By organizing more sightseeing and restaurant-hopping near the focal destination on the basis of geographical location, we can extend and create a more attractive travel itinerary to attract more interest of tourists, as shown in Figure 6. In short, this kind of itinerary planning is a good approach, because it is based on tourists' needs.
Regional tourism planning
The other way to plan the tour is to focus on the specific region of interest. For example, if travel agencies are planning a trip to Hsinchu region, including Hsinchu City and Hsinchu County, and want to see whether the tourism plan targeting that region is attractive from the perspective of tourists. The social network analysis approach allows analysts to find out the locations of attractions near to the target region. It also lets analysts know what type of activities are happening nearby the analysts’ selected region and how much time the tourist can spend there. In planning a tour of Hsinchu region, tourist and travel agencies may consider the local attractions of the region’s Hakka villages. As the tourists directly select all the favourite Hakka villages in this region, they will find all the attractions located in the administrative area of Hakka villages, including food and activities displayed on a digital map such as Google Map. As shown in Figure 7, tourism planning with big data can generate a detailed travel itinerary that considers the geographical location proximity within Hsinchu region. These nodes are generated using popular online search keywords so that the itinerary can be up-to-date with current tourist needs.

Regional Tourism Planning within Hsinchu Region.
Hakka village tourism corridor
This study employed structural hole theory (Burt, 1992) to create a Hakka cultural tourism corridor. In social network analysis, a node occupying the position of a structural hole is a critical node within a network (Burt, 1992; Shih, 2006), e.g., in trip planning, as the destination with the feature of a structural hole plays the role as broker of the trip route, connecting other destinations as a tourism network (Shih, 2006). Social network analysis utilised the constraint index, – the value ranges from 0 to 1, – to measure the degree of relatedness between two nodes and identify the node with the feature of the structural hole. A node with a lower constraint value exists as a structural hole within a network (Burt, 1992). The sightseeing nodes with the higher constraint value indicate that they are difficult to be associated with other nodes, and vice versa, the lower value with respect to the sightseeing attractions represent that they have more connection to other different sightseeing spots; they are structural holes (Burt, 1992), which occupy the necessary communication channels between the sightseeing nodes. Such a node is likely not to have greater numbers of outward interconnections toward other nodes (out-degree), but has a high degree of linkage heterogeneity. That is, some special and/or moderately popular nodes are related to these nodes with the feature of the structural hole. As a passenger service centre is planned to be set up along Hakka Romantic Avenue to conduct sightseeing promotion activities, these structural holes should be selected because they broker a tourist flow of a tourism network (Shih, 2006).
As shown in Table 1, a total of thirteen villages are identified as destinations with the feature of the structural hole, which have the values of constraint index with range from 0.08 to 0.04. Among these nodes. the most popular attractions among Hakka village destinations – Sanyi (effective size = 32.80; efficiency =0.94; Constraint =0.14), Beipu (effective size = 31.19; efficiency= 0.95; Constraint =0.11), and Dongshi (effective size = 25.19; efficiency = 0.97; Constraint =0.10) – possess the advantages of being structural holes in the whole tourism network. In addition, other Hakka villages with middle-level attraction, Emei, Xinshe, Touya, Xinpu, Hengshan, Baoshan, Guanxi, and low-level attraction, Yangmei, Zhongli, Daxi, also are nodes inhabiting the network that surrounds the structural holes; they serve as what might be called ‘subsidiary’ structural holes, indicating they stand in non-substitutable locations with the ability to bridge the tourist flow by connecting other destinations.
Figure 8 marked all nodes with the feature of structural holes by placing the letter ‘s’ within its circle and shows how all these nodes connect with other nodes to construct a Hakka village tourism corridor. Compared with Sanyi, Beipu, and Dongshi with the greatest number of outward and inward connections toward other attractions, other nodes in structural holes with middle- or low-level attraction are also seemingly very unpopular. Although these nodes are not frequently searched for, they are comparatively more related to other nodes within the tourism network. So, these nodes should be linked together and further the construction of a tour network system by adding service facilities, activities and food for attracting tourists in these locations.

Hakka Village Tourism Corridor.
Conclusion
In recent years, local cultural industries have become the core of industrial transformation and economic upgrading in various regions of Taiwan, especially in Hakka villages. Customer-oriented tourism planning allows tourists to express what the tourists like right now and ask the agent to plan tour routes and activities for tourists accordingly (Sun and Lee, 2004). In this regard, the information about tourists’ online tourism keyword searches, as our dataset for big data analysis, can reflect customers’ true need and destination preference and serve cues for planning tourism by using social network analysis to fit the customer needs. As this study revealed, the experience of tourists, and their preferences can be captured by gathering and analysing the big data of tourists’ online tourism keyword searches. Also, social network analysis is confirmed to be helpful to (1) represent a whole tourism network of a tourism area, (2) plan a cultural tourism, (3) plan a regional tourism, and (4) propose an area tourism corridor, such as Hakka Romantic Avenue along Hakka Villages. In sum, the case of the social network analysis contained in the present study provided an example validating how social network analysis using big data collection is an approach that serves as a useful means of planning a trip.
Theoretical implications
In the past, market analysis proceeded by collecting the understanding of customer needs, the characteristics of tourist attractions, and the experiences of tour guides from travel agencies as important information to map out an appropriate tour. However, the traditional approach to collecting tourism information, such as a tourism survey and/or interview of tourists and tour guides, could not capture an entire range of tourists’ tourism preference and their preferred destinations within a tourism area. To fill this gap, this study uses an innovative approach by utilising big data and social network analysis to plan tourism.
By utilising big data, all possible destinations, potential attractions, and tourist activities can be found and included for tourism planning. Specifically, we can find out which attractions are most interesting for visitors or what activities they would like to engaged in. Then, we can label these activities or attractions as important network nodes for the subsequent social network analysis. Through social network analysis, the relevant nodes are connected together to form a tour network of sightseeing attractions worth recommending. Especially, the proposed tourism analysis approach extends tourism planning knowledge; it can help to identify unpopular destinations, with fewer inward and outward connections to other destinations, as the necessary destinations in need of tourism planning. These unnoticeable nodes play a role as gateways to other destinations and bridge the tourist flow within the planned tourism network. Although the earlier tourism research by social network analysis disclosed that, for planning automobile travel by tourists, some destinations may be identified as nodes that occupy the structural holes and play the role of brokers by connecting other destinations and spanning different tourism routes (e.g., Shih, 2006), the importance of these unnoticeable nodes identified as structural holes by social network analysis has not been disclosed as an issue for tourism planning and has not been considered by tourism researchers and planners in constructing a tourism corridor.
In sum, as the approaches using big data (e.g., Robins, 2015) and social network analysis (e.g., Shih, 2006) have received more attention for tourism planning, the present study empirically integrates these two approaches into a framework to guide tourism planning. It contributes to the tourism literature by (1) providing an effective way to identify and include all critical destinations for consideration in constructing a tourism corridor and (2) disclosing the destinations occupying the structural holes that should be included as the central hubs in constructing a tourism corridor.
Practical implications
In a sense, tourism itself can be seen as the process of the understanding, discovery, and dissemination of culture. The manifestation of culture by planning the festival and tour event is the critical element of tourism. Such planning is accompanied with economic activities and is beneficial for the earnings of local residents and, thus, leads to preservation of and innovation in local traditional culture, as in the case of the Hakka studied in this article.
With growing use of social media such as Google map and Google search for planning a tour, this study takes an initial step for researchers and practitioners to develop their cultural tourism planning by exploring social media in relation to tourism, as well as its impact on the travel industry in general. Practical implications have been addressed by providing a scenario (solution) focusing on the way travel agencies can use social networks to find connections encompassing tourism destinations, famous stores, specialties, festivals, and activities; and promote them as a well-designed tour corridor, thus offering attractive tour services and products to potential customers.
For example, the planners of travel agencies can use web analytics tools such as Google Trends to collect the tourist information for social network analytics, as in this present study and, thus, capture customer tourism interests with respect to the specific tourism region. According to the tourism interests collected from big data tools, the planners can use a social network analysis tool to calculate in-degree with respect to each destination, find out which attractions are near the focal destinations, and then connect the destination and attractions as a tour for tourism promotion and marketing to fit the needs of their customers. Additionally, the findings of the present study revealed by social network analysis those destinations, – i.e., 13 of 28 Hakka villages along the Hakka Romantic Avenue, – that occupy the structural holes. These structural holes are central hubs for tourist travel and bridge different tourism routes; thus, tourism services and facilities should be built in these destinations to provide better tourism services for tourists, which also should be considered and included in constructing a tourism corridor by tourism researchers and planners.
Limitation and direction for future research
The present study provides an effective approach by using big data and social network analysis to plan cultural tourism. Some limitations remain and need further research in the future. Firstly, Google Trends cannot collect the demographic data of the target audience, such as their gender, age, and education. So, the present study cannot identify the gender, age, and education of the target audience and further explore the roles of these demographic features in affecting their search preference in terms of search frequency and compare the relative popularity among the villages. Further research can use other techniques and focus on the members of some online travel communities for collecting their gender, age, and education of the target audience to explore the effects of tourist’ demographic features on their travel intention, which is beneficial to propose a better tourism planning. Secondly, the big data collected from January 2017 to December 2017 by using Google Trends were sufficient for the researchers to conduct seasonal trend analysis and search popularity comparisons among the villages. However, the current data was based solely on a one-year period. The sample is likely too small so that, for more improved tourism planning, collection of longitudinal big data across several years is needed.
Footnotes
Declaration of Conflicting Interests
The author(s) declared no potential conflicts of interest with respect to the research, authorship, and/or publication of this article.
Funding
The author(s) disclosed receipt of the following financial support for the research, authorship, and/or publication of this article: This research was supported financially by the Hakka Affairs Council, Taiwan, ROC.