
Abstract
This article elucidates the methodological issues around reanalysis, by comparing the treatment of a corpus of 52 interviews in two European regions by two researchers. The primary data were initially analysed by the principal investigator using a method similar to content analysis and with the help of NVivo 12. It was then reanalysed by a second researcher who did not participate in the interview campaign, using a more inductive method of qualitative discourse analysis assisted by Atlas-ti 8. The overarching conclusion confirms the usefulness of combining these methods of analysis. The article is a contribution to the literature on the use of CAQDAS in the context of the reuse of data.
This article engages in a novel exercise of reanalysis of qualitative data from a recent research project. It explains how 52 qualitative interviews were coded according to two different methods of analysis and using two different CAQDAS (computer-assisted qualitative data analysis software): NVivo 12 and Atlas-ti 8. The original dataset was compiled initially by the primary researcher, X1, using NVivo to operationalise a method close to content analysis. The primary data were then analysed again by a second researcher, X2, who did not participate in the interview campaign. This reanalysis was carried out using a more inductive qualitative discourse analysis method. In both cases, the analysis was applied to the same empirical dataset, deposited with the main French data archive in 2018 (Cole et al., 2018a). We should stress that the two programmes could be employed to undertake both content analysis and discourse analysis, but we mainly used NVivo for the former and Atlas-ti for the latter.
The article thereby undertakes an original exercise in reanalysis of an existing corpus. The exercise explicitly is not about checking the validity of existing results (Evans and Thane, 2006; Fielding and Fielding, 2000). Nor is it an enterprise whereby existing datasets are revisited with new questions in mind (Gillies and Edwards, 2012; Savage, 2011). Rather, it involves reanalysing the same data based on the same research questions but using a different analytical method. We are aware of the definitional ambiguities that surround these new research practices of revisiting, secondary analysis and replication. We use the term ‘reanalysis’ to label our approach and to distinguish it from secondary analysis, or replication, which is underpinned by a positivist or post-positivist epistemological reasoning (Duchesne, 2017).
CAQDAS comprises tools that can be deployed in very different research designs (Fielding, 2000: 6; Gibbs, 2014: 277; Rioufreyt, 2019). Publications that focus on concrete cases of secondary analysis of qualitative data assisted by CAQDAS remain quite rare, with most extant examples simply mentioning (rather than illustrating) their use of CAQDAS (Abrial et al., 2017; Fielding and Fielding, 2000; Le Roux and Vidal, 2000; Medjedović and Witzel, 2008). This methodologically innovative article is a contribution to the literature on the actual use of CAQDAS in secondary analysis. In the first part, the article presents the primary inquiry and the differences between the methods used for the primary and secondary analysis and their consequences on the choice of software. The second part of the article is devoted to the presentation of the reanalysis. The article concludes that it is useful to combine approaches and tools.
From one inquiry to another: changing methods and tools
The interview corpus is drawn from a Leverhulme trust project, which compared four European regions (Andalusia, Brittany, Wales and Wallonia) in a period of economic crisis and political reconfiguration (Cole et al., 2018b, 2015). For practical reasons – time and budgetary constraints – we only report data from two of the four regions in this article, namely Brittany (France) and Wales (United Kingdom) (n. 52). Fieldwork was conducted over an 18-month period (November 2012 to May 2014), mid-way through the short decade of crisis (2008 (Lehman brothers)–2015 (the revived euro crisis)). It consisted of collecting statistical, secondary and grey data and organising interviews with territorial actors (around 25 interviews per region). Semi-structured interviews, using a common interview protocol, were designed to capture the core research questions of convergence and capacity in a context of economic crisis and political fragmentation. Functionally equivalent purposive panels were created in each region, drawing on three sub-groups: party politicians represented in the regional Assembly, territorial policy communities (trade unions, employers, civil society associations) and the territorial state services or their equivalent. The composition of each panel was validated by at least one member of the Steering group. All data files (anonymised interview transcripts, semi-structured protocol) were archived with Qualidata, based in Sciences Po Paris (Cole et al., 2018a). The interviews in this article were conducted in English and French; where necessary, translations are provided in brackets after the French word.
The project was centred on two principal research questions. The first core question revolved around whether the short decade of economic crisis and political reconfiguration (2008–2015) had undermined, or reversed the seemingly relentless trend towards decentralisation across Europe from the 1980s onwards. The second core question centred on whether endogenous territorial models were challenged or strengthened by economic crisis and political reconfiguration. Common to both of these dimensions was an exercise of making sense of territorial governance, the main focus of this article. The article contributes to the existing body of literature produced by the research team, in particular the two comparative frameworks known as the States of Convergence of Territorial Governance (Cole et al., 2015) and the Territorial Political Capacity Index (Cole and Pasquier, 2015; Cole et al., 2016; Cole et al., 2018b). But the main focus here is methodological.
This section continues with a brief presentation of the primary data and analysis. It then elucidates the different methods underpinning the primary and secondary analysis and their consequences on how interviews are coded. Finally, it explains how the choice of a new method for reanalysis resulted in a software change, thereby demonstrating that not all CAQDAS have the same embedded epistemology.
The primary analysis: mapping qualitative data in Brittany and Wales
NVivo sometimes claims to offer a quantitative expression of qualitative data. In the most widely read accompanying text, Bazeley and Jackson (2013) make several claims that situate the programme mainly within the hypothetical-deductive tradition: the reference to theory testing, modelling, matrix coding strategies, closed coding and export to quantitative programmes such as EXCEL and SPSS. For example, NVivo uses Pearson correlation techniques, usually reserved for quantitative data analysis, to establish whether there are statistical associations between specific words or passages. Indeed, one of the most powerful tools in NVivo is the cluster analysis feature, used in Figures 1 and 2. Through tools such as word clouds, cluster analysis and correlations, NVivo makes possible a rather more systematic comparison of the cognitive worlds of comparable panels of actors than the ‘intuition’ and ‘impression’ recommended in some qualitative approaches (Stake, 1995: 72). Within NVivo, the word cloud was in our case the most useful tool for presenting a structured idiographic overview of priorities and contrasts between regions (the word clouds are not included here for reasons of space, but are available at Cole et al. (2018a)). Visually, the Breton word cloud supports received representations of the Breton region as one with a strong sense of place-specific dynamics. If we limit ourselves to the strict logic of counting the 10 leading words, we observe that the Region (n.481, 0.96%), and Bretagne (n.445, 0.88%) occur with almost equal prominence, followed by France (258, 0.51%), regions (‘régions’) (240, 0.48%), politics (‘politique’) (211, 0.42%), local authorities (‘collectivités’) (204, 0.41%), Rennes (183,0.36%), regional (‘régional’) (166, 0.33%), decentralisation (‘décentralisation’) (162, 0.32%) and crisis (149, 0.30%). But cluster analysis is required to go beyond purely visual perceptions and is the instrument used here.
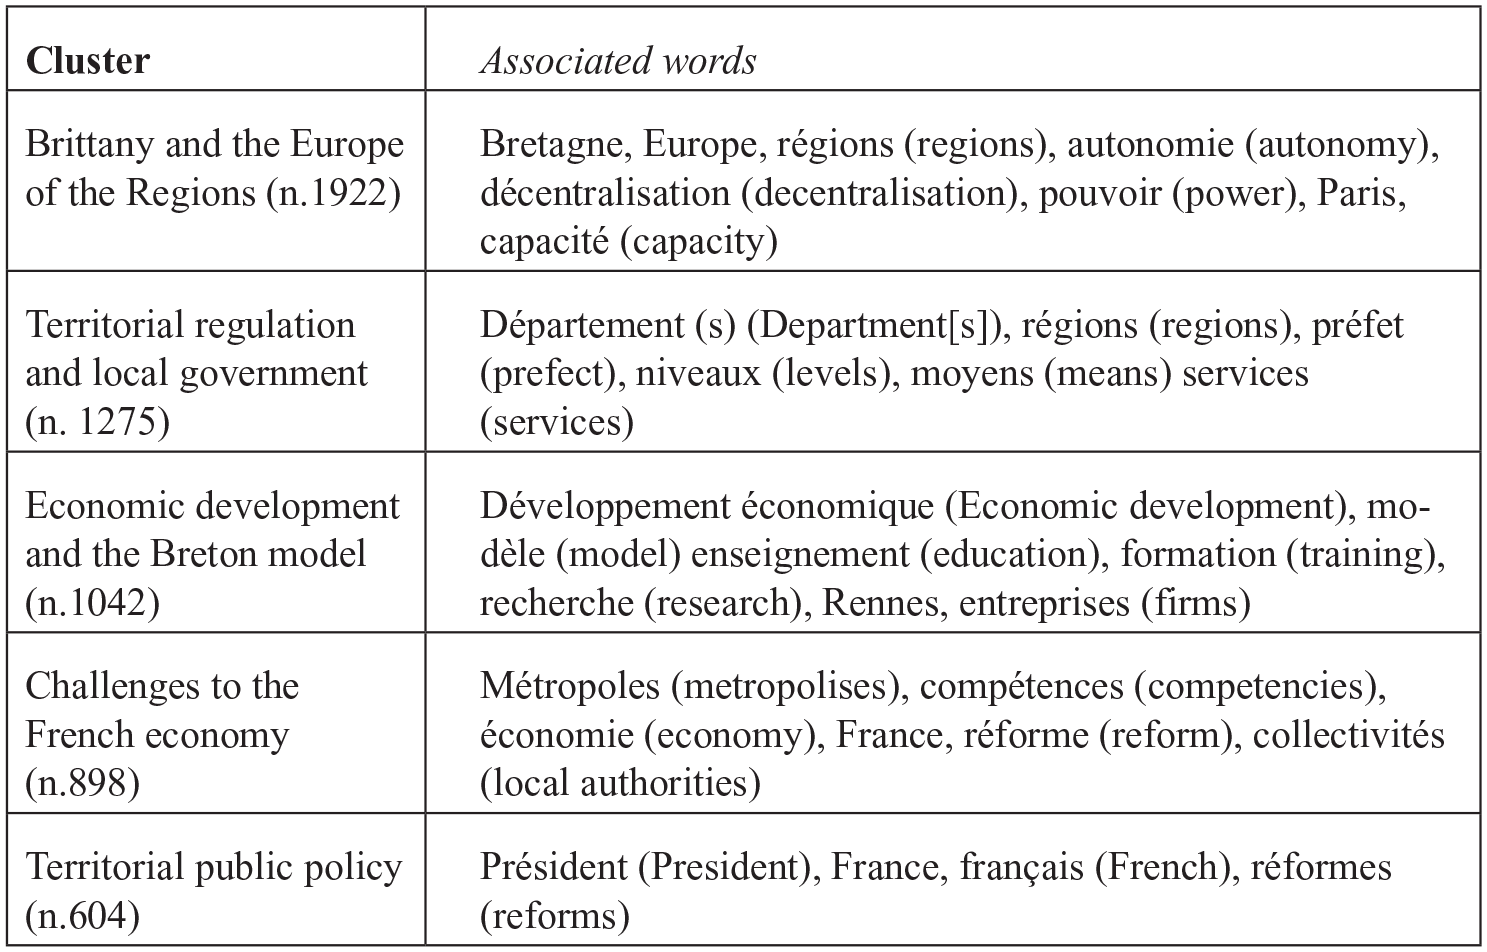
The Breton word clusters.
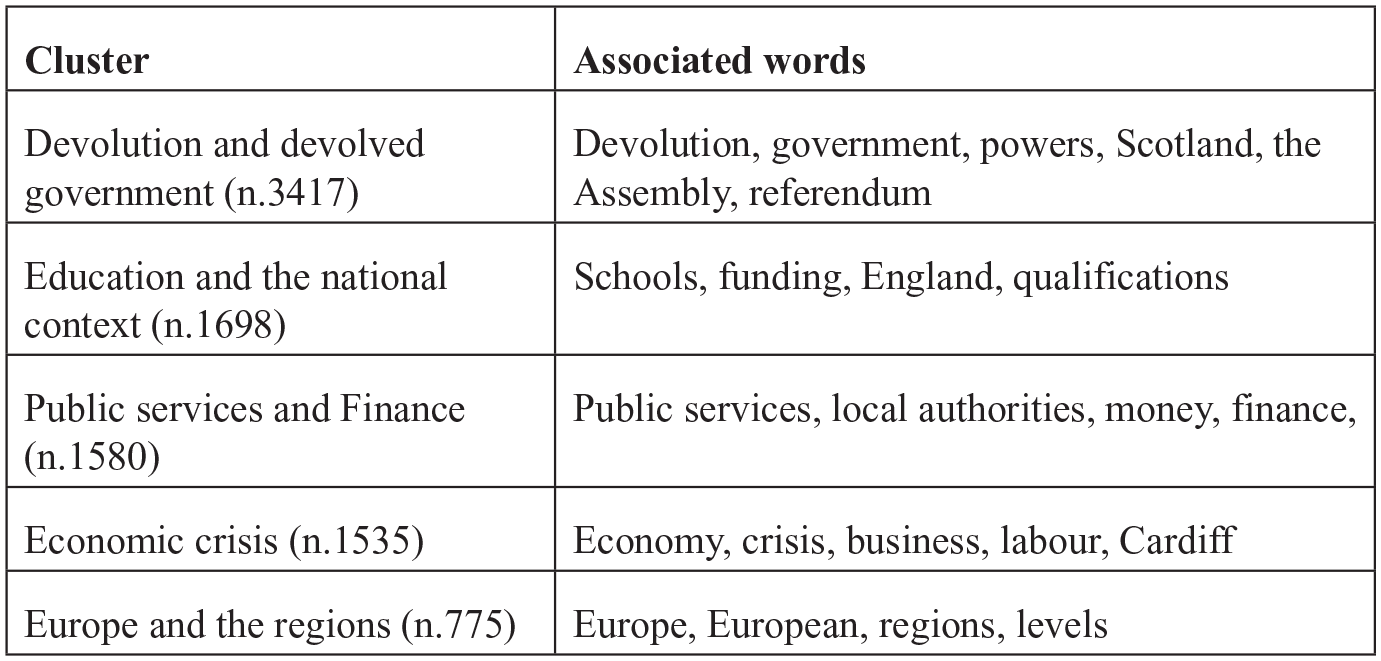
The Welsh word clusters.
The Breton interviews are structured around five distinct clusters, summarised in Figure 1. These clusters are not hierarchically organised, but they occupy a more or less central place for this corpus and illustrate the reality of a space of multilevel government. First is the cluster around Brittany (Bretagne) and the Europe of the Regions (n.1922). The linkage of the Bretagne region with Europe restates the strength of the Breton European model (Pasquier, 2004; Cole and Pasquier, 2015). The second cluster is that of territorial regulation and local government (n. 1275), a more traditional description of the French model of public regulation, with the axis on the relations between the prefects – the representatives of the central state – and the departments, and the focus on service delivery. Third, the cluster around economic development and the Breton model (n.1042), one that places high value on human capital (education, training, research) and a robust eco-system. The ‘polycentric’ Breton model was traditionally identified in terms of economic solidarity, cohesion and territorial diffusion, but the fourth word cluster (n.898) is framed in terms of the crisis of the French and European economy and the emergence of the phenomenon of metropolitan governments, to some extent challenging the existing model of balanced spatial development. Finally, the territorial public policy cluster (n.604) bridges various dimensions of a centralised French economic model under pressure. The overarching context is one of the adaptation of a visible territorial model to the new challenges of economic crisis. Though we identified some dissonance, the interviews represented the Breton territorial model as still robust and influential.
The same method was applied to Wales. The 10 most cited words were Wales (1027, 1.80% of total citations), government (735, 1.33%), Welsh (510, 0.92%), education (404, 0.73%), people (394, 0.71%), local (316, 0.57%), devolution (293, 0.53%), public (249, 0.53%), England (225, 0.41%) and Scotland (225, 0.41%). Members of the Welsh panel were fully focussed on the political dynamics of devolution: cluster 1 frames devolution as the process of building the institutions of more autonomous government. They were deeply preoccupied with developments elsewhere within the UK; the example of Scotland is mobilised to strengthen Welsh claims for more autonomy, while the case of England is framed as a negative lesson in terms of public services, especially education. Logically, members of the Welsh panel were supportive of strong public services, especially in education and health, core areas of devolved responsibility (cluster 2 + 3) and markers of attachment to a social-democratic model. The economic crisis figured prominently, understood in the traditional sense of business-labour relations and public intervention, in another sign of the strength of traditional social-democratic framing. Finally, there is some attachment – though much weaker than in the Breton case – to the Europe of the regions, reflecting the – pre-Brexit – context of large EU structural funding and the development of Welsh European capacity (Cole and Palmer, 2011).
In the above examples, the analysis conducted by X1 assisted by NVivo facilitated drawing general conclusions pertaining to territorial governance between these two regions. In the next section, we will discuss the reasons that led us to consider a new method for reanalysing the data, complementary to the original method, and to change the software to do so.
Reanalysing the primary dataset using Atlas-ti: from content analysis to grounded theorisation
The process of reanalysing our interviews involved the passage from a procedure of content analysis to one of inductive qualitative analysis mainly inspired by the grounded theory (Henceforth ‘GT’). These two methods adopt rather different assumptions in relation to coding and inference, as illustrated in Figure 3. In the traditional content analysis approach, coding starts before the process of collecting data begins; in GT, coding occurs simultaneously with data collection. In this project, researcher 1 began coding before a profound analysis of the data had taken place, in the sense that the ‘nodes’ (the NVivo description for codes) reflected the main dimensions of the semi-structured questionnaire. These codes were then tested on a portion of the interview sample – the Welsh interviews – in an exploratory phase, as recommended by the NVivo trainer. Researcher 2 then undertook the reanalysis of these interviews, taking great care to ensure that coding would emerge iteratively as part of the process of analysing the data, the procedure recommended by GT (Glaser and Strauss, 1967; Glaser and Judith, 2004; Strauss and Corbin, 1998) or more recently by the theory of Miles and Huberman (Miles et al., 2013). The reanalysis involved a process of re-coding, keeping very close to the text in a strictly inductive approach.
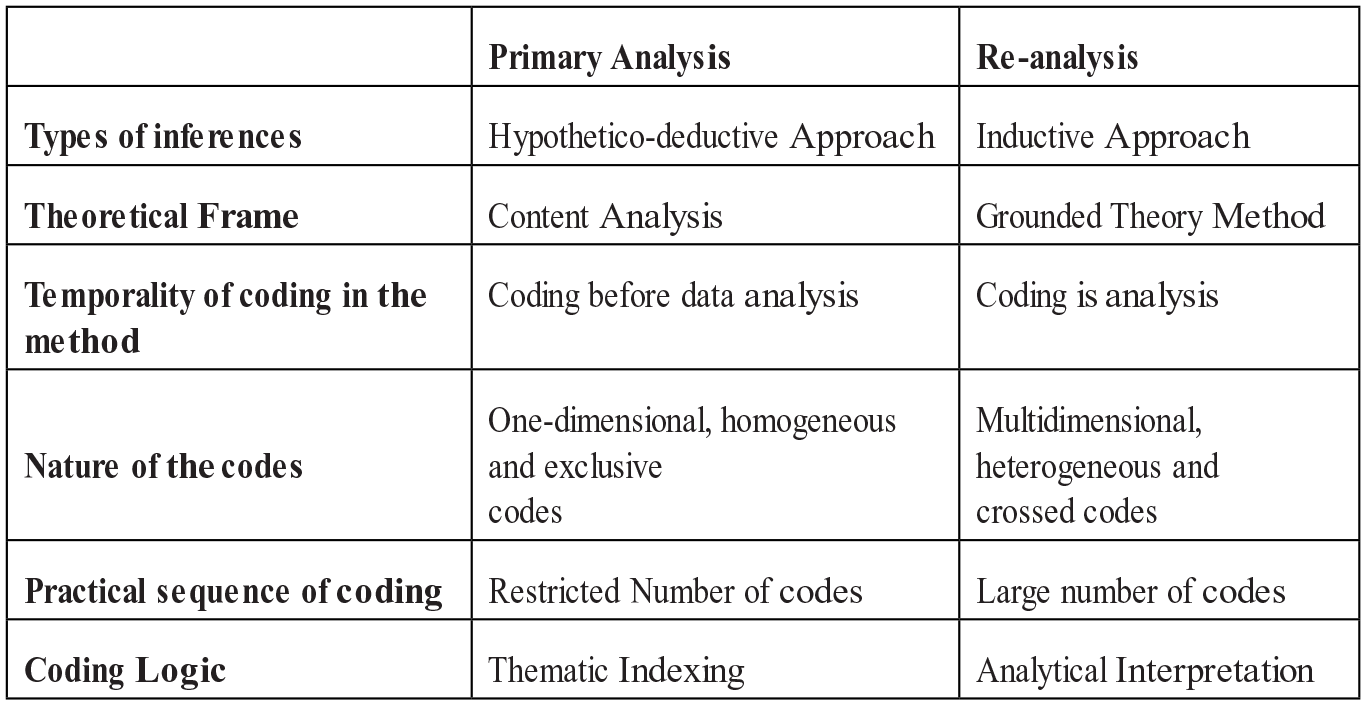
Comparison between method of primary and secondary inquiry.
The two analytical methods have effects on the practical process of coding the interviews. In the first approach, coding is methodical; hence, it is focussed on identifying a limited number of codes. Researcher 1 initially established a scheme with 61 distinct codes, drawn from the early Welsh interviews. This long list was reduced to 12 codes, on the advice of the NVivo trainer. The 12 initial NVivo codes drawn from the semi-structured questionnaire were: challenges, convergence, crisis, devolution, divergence, education, finances, style, parties, intergovernmental relations and capacity. Two codes were added later: social democracy and network. Researcher 2 reviewed the existing codes and added three new ones derived from inductive analysis with Atlas-ti (language, background and relations with other territories).
The primary and secondary method differ in their coding logics. In the content analysis approach, coding might to likened to a process of indexing. The code is a commentary that describes what the interviewee is talking about (Paillé and Mucchielli, 2012: 161). The analysis undertaken by researcher 1 was influenced by such a thematic coding preference. In inductive approaches, coding is more of a question of interpretation, the act of understanding the representations, experiences and words of the actor. Rather than an index entry, it is a vignette that analyses and interprets what the actor says on a subject (Lejeune, 2014: 63–64). The point of reanalysis is to identify the meaning of the main themes for the actors concerned and to establish links between them.
At each level of analysis, the researcher needs to address coding conundrums and make reasoned choices. Such is the case for micro-analysis, the first phase of coding in an inductive design. It consists of remaining as close as possible to the material, word for word, line by line, in order to discover the sense of the text. In the terminology of GT (which has been adopted in Atlas.ti), this process is known as one of open coding. Open coding must answer one fundamental question: should we code all or only part of the corpus? Selective coding misses out large parts of the corpus, and hence potentially introduces bias. Moreover, coding all the corpus safeguards the analyst against over-relying on parts of the corpus selected to back up hypotheses. The initial extensive reanalysis produced over 1200 codes; 783 segments were created through open coding, demonstrating a high level of granularity. Of the 1241 codes created throughout the whole process, 1160 were open codes and 81 abstract codes (not linked to any segment of text but able to link codes). Hence, 783 segments of text were linked to 1160 open codes, an average of 1.48 codes per segment. This represents a highly inductive analysis: 463 segments were linked to only one code, 192 to two codes and 122 to three or more codes.
The second conundrum concerns the establishment of relationships between codes, known in GT (and in Atlas.ti) as axial coding. Qualitative coding represents a process whereby segments of material are interpreted in terms of their own meaning, but also whereby they are attached to categories with a more general meaning (Lewins and Silver, 2014: 158). The process of coding emphasises how much NVivo and Atlas-ti are CAQDAS with different methodological assumptions. NVivo demonstrates a hypothetical-deductive set of preferences, expressed by an arborescent logic; codes are related in a hierarchical order, as a tree and its branches. The tree of codes contains an explicit hierarchy, an epistemological constant since the time of Aristotle (Deleuze and Guattari, 1980). For its part, Atlas.ti does not propose a hierarchy of codes; it is possible to introduce codes in a hierarchical manner, but the analyst needs to resort to an indirect way of portraying a hierarchical logic (hence the ‘cosmetic hierarchy’ described by Lewins and Silver, 2014).
In the inductive approach favoured by Atlas-ti, rising up the level of generality (from micro-level analysis to a few guiding concepts) occurs by creating links between the categories represented by the codes. The logic is fundamentally that of a network and network tools are frequently used in Atlas.ti (see Bandeira De Mello and Garreau, 2011). The network views feature of Atlas-ti allows us to understand the relationship between the main ideas raised in the interviews. The network does not necessarily refer to a structured form of exchange, as is understood in the literature on organisational network analysis (Wasserman and Faust, 1994), but it represents a visual relationship of the linkages between ideas.
The procedure is demonstrated in the case of the Breton political model. The first stage of the process was to develop open codes; in this case, two codes were ‘the Breton political model: co-operation between public and private actors’ and ‘the sentiment of common destiny and identity’. These two open codes had been drawn verbatim from the interviews. They were then linked, in a transitive manner, to the more abstract code ‘Consensual Political Model’, which itself formed part of a still more abstract code, ‘Breton Political Model’, which was in turn linked to the most abstract code of all: ‘Breton Model’. Abstract codes are not directly linked to any citation. They are free codes, which regroup several open codes through the link « is part of » to signify their belonging to a more general category. The software package can map all occurrences of an abstract code in the text, penetrating the corpus in order to link citations to open codes.
The most interesting feature of the axial coding is that the ‘Link to’ function allows the analyst not only to describe the links between codes but also to specify their nature. In the network view provided above, we mainly used the ‘is part of’ relationship. However, we also used other types of relationship. In Figure 4, for example, the open code ‘Breton specificity: recent influence of the National Front’ is linked to both the abstract codes ‘Consensual political model’ and ‘Breton Europeanism’ and described in terms of the relation ‘is cause of’. In this specific instance, we sought to establish a causal relationship between the Breton political model and the fact that the National Front has traditionally been weaker in Brittany than elsewhere in France. Interviewees explained this political reality by the consensus basis of the Breton political model and the stronger pro-European sentiment than in other French regions.
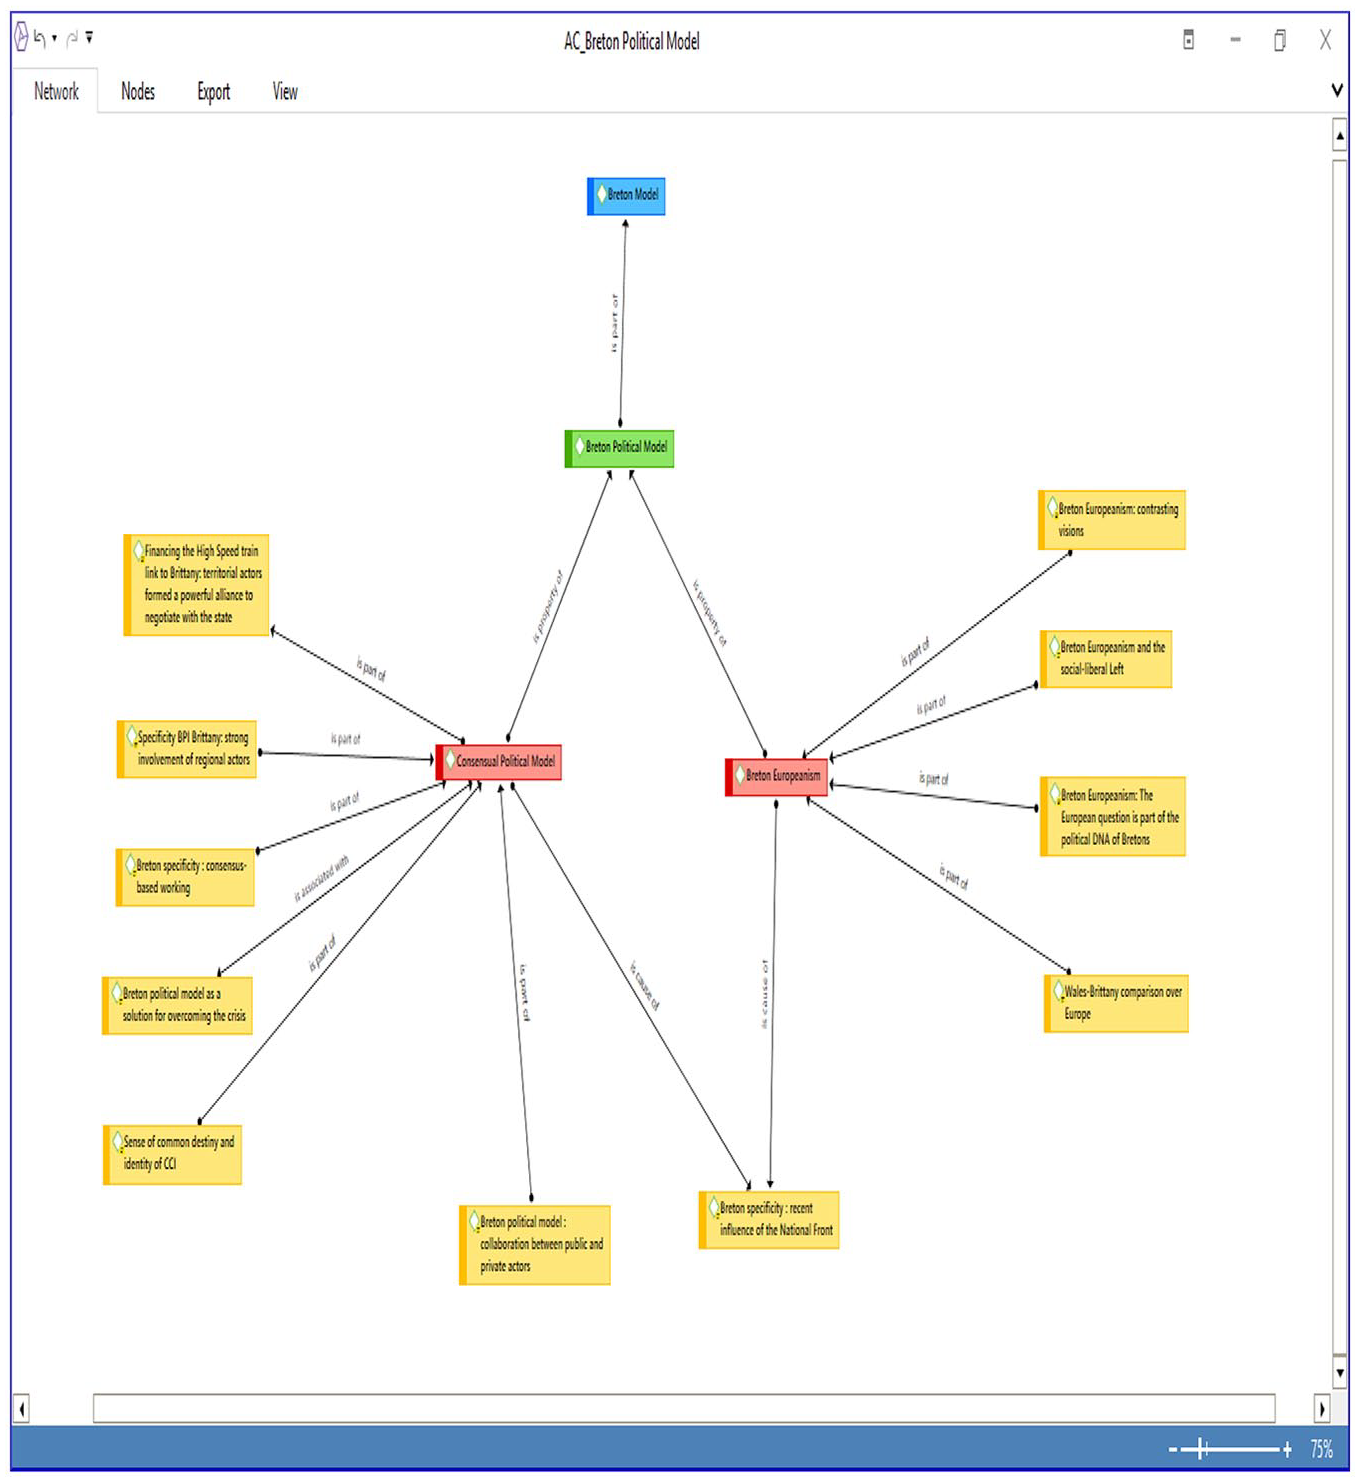
Network view of the abstract code ‘the Breton political model’.
The above section has illustrated the caution that must be taken when employing CAQDAS; the next section demonstrates how useful these tools can be in drawing conclusions and making generalisations.
Comparative findings
Drawing on both NVivo and Atlas-ti, this section presents comparative findings that make sense in the context of Sartori’s ladder of abstraction (1970). Comparing policy contexts across national boundaries presents theoretical challenges, while comparing across levels of analysis raises questions of conceptual equivalence and pertinence (Collier and Levitsky, 1997). Sartori’s ladder of abstraction provides the mechanism for linking the more macro- and micro-elements in the analysis. Sartori identified two complementary strategies in tackling the problem of equivalence between cases and concepts: first, moving ‘down’ the ladder to generate further differentiation of concepts with more defined attributes applied to fewer cases; or alternatively moving ‘up’ the ladder, whereby concepts have fewer defined attributes but can be applied to more cases. Sartori’s ladder of abstraction is of great heuristic value in our design, as it allowed us to address the question of mixing breadth and depth and capturing idiographic representations while engaging with efforts at generalisation and overall conceptualisation. Adapting Sartori’s metaphor, Atlas-ti is naturally situated at the bottom of the ladder of abstraction, as it seeks first to uncover many latent meanings, then to refine a few interpretative networks and finally even fewer central concepts. NVivo (as we interpreted its use) starts at the top of the ladder, using content analysis to propose categories that are sufficiently generic to enable comparisons; drilling down mainly takes the form of validation, in a quasi-quantitative design. In this second main section, we now present comparative case findings from the broader enquiry into territorial governance and we propose the hierarchical network as the most suitable means of bridging levels of analysis.
Both NVivo and Atlas-ti allow for forms of association and cross-reference that facilitate within-case and between-case comparisons. In the case of NVivo, as illustrated above, word clouds and clusters are invaluable for engaging in explicit forms of comparison. For its part, Atlas-ti allows for more circuitous forms of mapping through the functions of code groups (previously code families) and document groups (previously document families). For Friese (2014: 118), a ‘code family is basically a group of codes’, while a ‘document family’ is a group of documents. We treated code groups and document groups as distinct variables and cross-referenced them, in order to measure the distribution of the themes between the two fields. In the first instance, researcher X2 created 14 code groups corresponding to the thematic nodes used by researcher X1 with NVivo, to which three new code groups were added after the reanalysis with Atlas-ti. Finally, researcher X2 created two overarching document groups (Welsh interviews and Breton interviews), which regrouped all the interviews in the two regions. Subsequently, he used the Code-Document Table function (presented in Figure 5) in order to cross-reference the document groups and the code groups, allowing a direct comparison of the presence of the different thematic codes across the two regions.
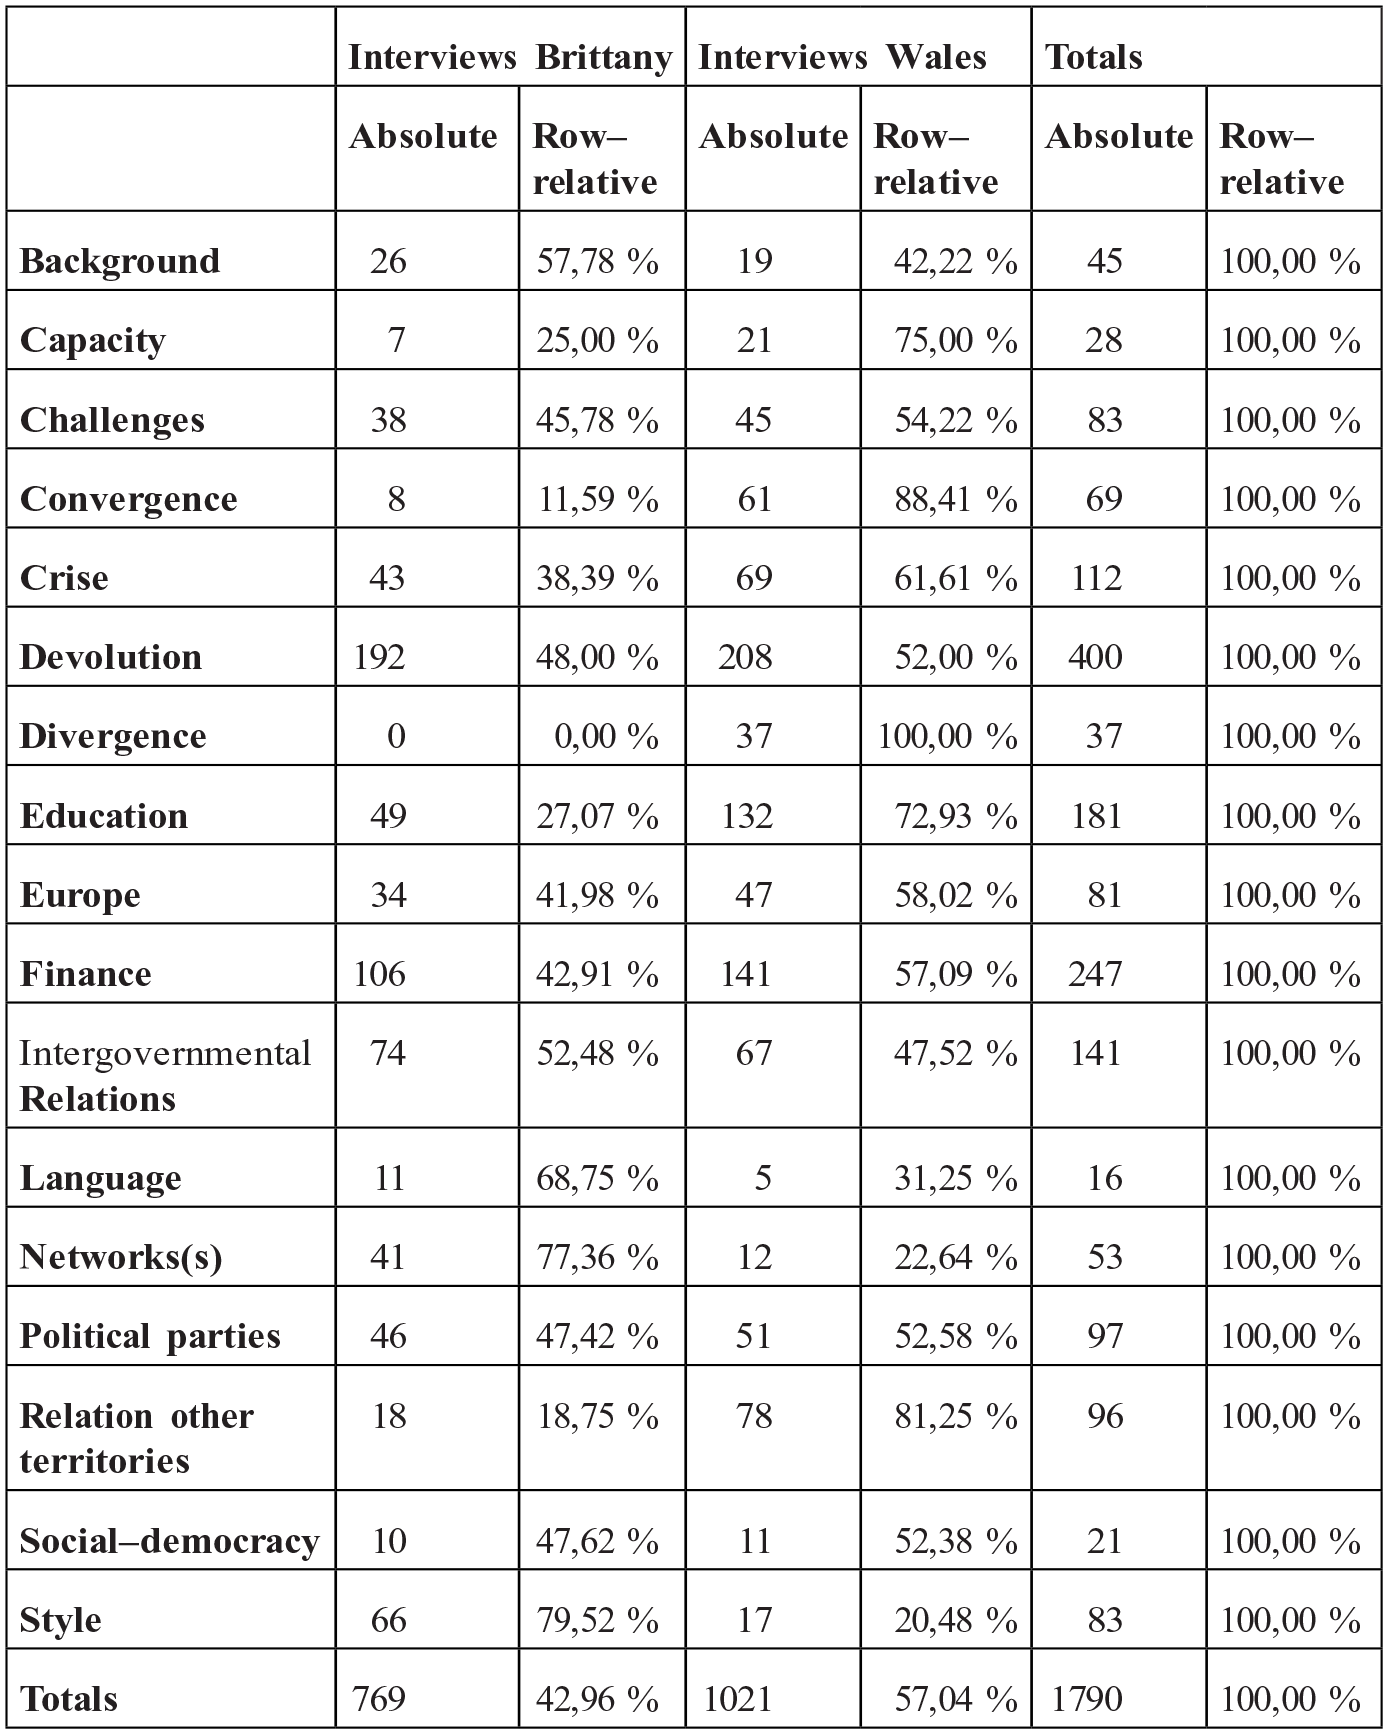
Code-Document Table: a comparison of code groups between two sub-corpus in Atlas-ti.
The ensuing analysis draws both on the coding initially constructed with NVivo, and the refinements brought by Atlas-ti. A few words of precaution are necessary to interpret these findings. First, the number of cases studied is too small to avoid statistical bias. Second, the interviews were carried out according to an overarching interview schedule, but the latter allowed for some adaptation and variation to accommodate the local contexts. Third, coding was part of the analysis, and hence evolved throughout the course of the project. Finally, this exercise is one of quantifying qualitative codes, which is fraught with methodological difficulty and interpretation (Sellers and Lidström, 2007). Another research team might not have interpreted the data in the same way. The exercise is essentially an interpretative one, rather than quantification according to a fixed set of indicators, not least because Atlas-ti encourages adding new codes if necessary. The findings are thus areas for further investigation that the data analysis suggests will prove fruitful. Taking these precautions into account, the Code-Document Table contains interesting findings, several of which are now discussed that are particularly important.
The Code-Document Table allowed convergences to be identified in the operation of political parties, social democracy and intergovernmental relations, as well as in finance. Logically, the comparison also revealed similarities in factual codes, such as background and challenges. The real difference between the two samples lies in the greater weight on the theme of divergences, capacity and devolution in the case of Wales, while networks featured much more prominently in Brittany. The core themes of ‘capacities’, ‘convergence’ and ‘divergence’ are more often mobilised by the Welsh sample than in the case of Brittany. This very uneven distribution might certainly be explained by the fact that devolution in the UK is much more advanced than decentralisation in France and Brittany (both in terms of competencies and saliency in national media debates). If we look more closely at the codes for these three themes, the Welsh sample is much more engaged with these issues, but the framing is principally in relation to other parts of the United Kingdom, rather than other European countries. The convergence/divergence that is identified as an important part of the discourse occurs principally in relation to England and Scotland, rather than the European Union; for the Welsh panel, divergence with England is seen as a more powerful dynamic than convergence with European regions. Both primary research and reanalysis highlight the importance of Scotland as a reference point for Welsh interviewees and the quasi-federal context of the UK, which encourages such comparisons. There was no real equivalent of this in Brittany, though Corsica was occasionally mentioned, as was the case of Lyon, as a metropolis with enhanced powers.
These findings backed up received views of the operation of territorial policy communities in Wales and Brittany (Cole, 2006). As described elsewhere (Cole and Pasquier, 2015), the Breton style appears as one of networked governance, with the regional interest transcending distinctions based on party or institution. In contrast, the key dynamic in Wales emerges as one of institution-building, a finding that is entirely consistent with data produced elsewhere (Cole et al., 2018). There are one or two surprising findings from the table; language, a powerful identity marker, appeared with greater regularity in Brittany than in Wales – but this might be explained by the fact that language concerns in Wales have been ‘mainstreamed’ while in Brittany they are powerful floating identity markers. The most remarkable finding from the reanalysis is that parties appear almost evenly between the two regions. Unlike the results obtained by the primary analysis, the theme of parties is evenly distributed between the Breton and Welsh fields (47.42% and 52.58%). Interlocutors in Brittany spoke in terms of parties almost as often as their counterparts in Wales, but the use of the term parties was less widespread in the French region. Herein lies an important methodological point: if the use of inductive interpretative analysis cannot pretend to statistical validation, it has a unique capacity to drill down into and extract meaning from data. It achieves this not only by listening to what interviewees say, but also by situating these representations in a broader web of meaning.
A hierarchy of variables? NVivo encourages and Atlas-ti enables forms of selective coding to occur, referring to the creation of central concepts that have broad interpretative power. There are several options for this. NVivo frames coding in terms of a hierarchical tree structure, by associating each code with a more general category in an exclusive way. This solution is mainly relevant and applicable in a hypothetical-deductive approach in which the researcher has constructed an a priori codebook (Bandeira De Mello and Garreau, 2011). Atlas-ti favours a symmetrically opposite way to create a code structure: the code network. Its strength lies in its intuitive and easy-to-use nature. However, its weakness is due to the difficulty of interpreting and understanding several thousand codes.
Between the tree and the network, a third way is possible; we label this as the hierarchical network. Of course, the hierarchical network might appear as an oxymoron, but it is nothing of the sort. A network can be defined by the fact that a spoke (here a code) might be linked to other spokes in a variety of forms. A code that forms part of a more general code is in a relationship. This is compatible with a network logic if the same code can potentially be linked to other codes. A tree structure, of the type preferred by NVivo, cannot contain a weak hierarchy within its organisation, whereas the network captures well this relationship. A horizontal network of equally weighted codes – the basis of Atlas-ti – is not impossible in theory, but would be very rare in practice, where codes are nearly always in a relationship of some kind with other codes. Between tree and network, we use the term of a hierarchical network to signify a weak hierarchical structure – but not a flat, non-hierarchical structure.
How does this work in practice? For reasons of space and readability, rather than transcribing here the visual representation of the complete grid of our codes, we have chosen to present below an extract corresponding to one of our research questions, concerning the impact of the economic crisis on political parties. Figure 6 outlines the hierarchical network corresponding to the abstract code that captures the link between the economic crisis and political parties. This code regroups three abstract sub-codes, the first of which (entitled ‘the effect of the crisis on parties’) consists of three sub-sub codes, with links to 11 open codes. In this extract, there is a hierarchy, but this does not take a tree form: one code can be placed in several abstract codes. Hence, in our example, the code ‘the victory of the Coalition government has simply brought into the open public divergences’ is linked to three different abstract codes. This example demonstrates well how we built a hierarchical network on the theme of the links between two variables: the parties and economic crisis. Three links were observed: first, the crisis had an impact by forcing the parties in government to undertake an economic austerity policy (with Labour and Conservatives both engaged in such a policy); second, relations between the Conservatives and Labour became more tense with the crisis, which had the indirect effect of pushing the Liberal Democrats to ally with the Conservatives; and, third, the crisis gave a boost to extremist parties. The variable effects of the crisis were thus mediated by partisan choices. Here, we have a good example of how selective coding allows the analyst to rise in generality and to propose several central categories for each complex research question.
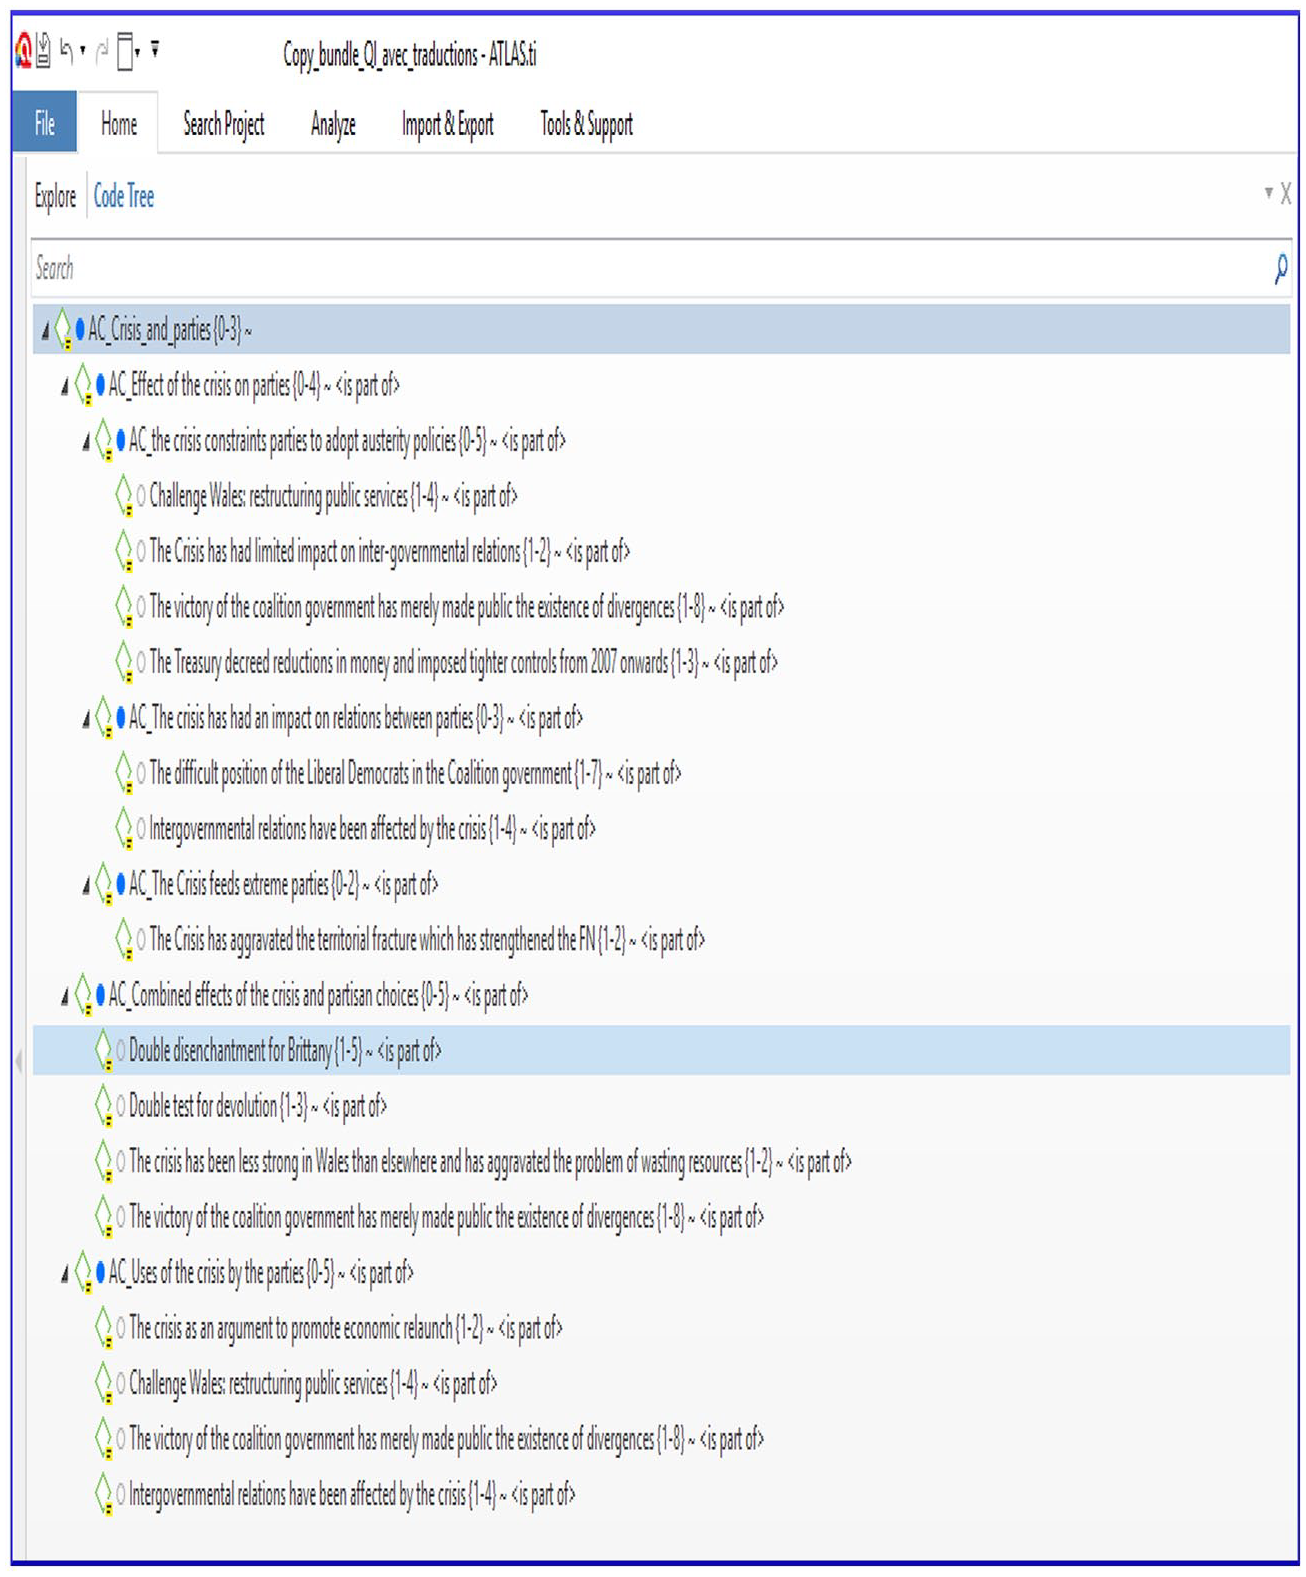
An example of a hierarchical network: the crisis-parties code tree.
Conclusion
The primary and secondary analyses presented in this article dealt with the same research questions – the perceived adaptation of modes of territorial governance in a period of economic crisis and political restructuring – using two different methodologies based on two different CAQDAS. The analysis has brought to the fore the strengths and limitations of both tools. The article demonstrates a real cohesion between these approaches in two senses: first, the thematic coding used with NVivo provided a broad set of categories that were in the main confirmed by more inductive analysis assisted by Atlas-ti; second, the reanalysis brought forward in much more detail the linkages between each of the categories and uncovered latent meanings that had been occulted in the broader-brush thematic coding.
Though the results of the two analyses mainly converged, we identify three degrees of interpretative variation in our use of NVivo and Atlas-ti. First, the degree of granularity: while NVivo was more centred on broad-brush lexicographical data, Atlas-ti was able to drill down and capture deeper meaning. Second, the degree of systematic treatment of the corpus: the analysis using NVivo (word clouds, cluster analysis) occurred using a partial selection of the text, while Atlas-ti systematically took the whole corpus as the terrain of analysis. Such extension allowed the secondary researcher to capture the importance of the Breton language amongst Breton respondents, for example, overlooked in the primary analysis. Third, the degree of linkage: axial coding with Atlas-ti allowed a finer linkage between categories, as demonstrated above in the case of economic crisis and parties. In all of these cases, though, the secondary investigation was complementary to the primary analysis; working on the same corpus, there are naturally limits to divergent analyses. Hence, the exercise illustrates diverse possible uses of the software, but gives no grounds for choosing one over the other.
The second contribution of the article relates to the care with which technical choices need to be combined with methodological reflexivity in any empirical enquiry. Naturally, there are limits to our approach. The same results might have been obtained in a less time-intensive manner and a different lexicographical package might have delivered similar results. Mapping lexicographical fields associated with classes of discourse might have produced a better understanding of the signification of each theme, but this lay well beyond the confines of the article. Above all, our approach was extremely time-intensive; practical budgetary constraints limited the analysis to two of the four regions in the main inquiry. Each method has its own limitations and can be completed by other approaches.
The article illustrates how two researchers used different methods and, consequently, distinct tools to respond to the same research questions. NVivo facilitated the early mapping and thematic coding; Atlas-ti then reversed the coding logic, first by drilling down, in a process producing over 1200 open codes, then engaging in axial and selective coding to allow several central research categories to emerge. The value added of Atlas-ti lies in its capacity to propose linkages between these codes, in a more intuitive and flexible manner than NVivo. But the overarching conclusion confirms the usefulness of combining these methods of qualitative analysis. Quite apart from broader questions linked to mixed methods, combining different software packages is productive within the field of qualitative data analysis, depending on where the analyst situates herself on the ladder of abstraction; NVivo allowed X1 to test the categories introduced in the semi-structured questionnaire, while Atlas-ti was closer to the corpus and more truly inductive.
Footnotes
Author’s note
Thibault Rioufreyt is also a lecturer in politics at the University of Lyon 2, France
Funding
The author(s) disclosed receipt of the following financial support for the research, authorship, and/or publication of this article: The work was supported by the Leverhulme Trust under grant IN- 2012-109.