



Abstract
Dealing with a large amount of qualitative data during the analytical process can be challenging especially when the data needs to be regularly discussed with other research team members. For researchers employing grounded theory methodology and methods, using visual tools such as concept maps or diagrams can be a beneficial approach at all phases of the research. Concept maps can assist researchers to visualize emerging concepts from raw data, efficiently communicate the developing theory under construction and demonstrate progress in the analytical thinking process. However, despite the usefulness of concept mapping, there is limited and detailed information on the use of concept mapping to guide novice researchers. This research presents the distinctive experiences of the authors in utilizing concept mapping to facilitate the analytical process of theory generation they undertook when conducting a grounded theory study examining diabetes health education in an Indonesian context. It is recommended that researchers consider the flexibility and efficacy of concept mapping as a tool to assist them with the process of data analysis in qualitative research.
Introduction
Researchers can choose to use a range of tools to assist them in the process of qualitative data analysis, including concept mapping. Buckley and Waring (2013) state that any form of visual representation can serve as an analytical technique and communications tool. Using visual tools to represent abstract and/or complex thinking in research can facilitate insightfulness during the analytical phases and promote communication of ideas between team members and others often more readily than using a text form (Buckley and Waring, 2013). In grounded theory, a tool that visualizes concepts and their relationships with each other is known as a diagram (Corbin and Strauss, 2008). Together with memos and field notes, the use of diagramming in a grounded theory study is an acceptable tool that assists the researcher in analyzing data for theoretical integration (Charmaz, 2006). Diagrams help researchers to keep records of concepts and their relationships and to systematically explain findings to other researchers (Corbin and Strauss, 2008).
A concept map, the term used in this paper to indicate a diagram, is used as a visual aid to manage and symbolize knowledge, including concepts and their relationships (Novak, 2004). In grounded theory, people (the researchers and participants) actively engage in an analytical process to construct knowledge (Charmaz, 2006). Using visual tools such as diagrams or maps can aid the process. Concept mapping can help researchers organize and construct knowledge from the gathered data. The information on the use of concept mapping (the term we use) to aid researchers employing grounded theory methods is however limited. Through concept mapping, researchers interact with the data and ‘their current cognitive structures’ to generate knowledge in a creative and meaningful way (Wilson et al., 2016). This research note will explain the use of concept maps in facilitating the analytical process of theory generation and will recommend methods to consider when using an analytical tool like a concept map, by explicating its use in a grounded theory study of diabetes health education in Indonesia.
Mapping in research studies
There are a number of different types of mapping such as knowledge mapping, mind mapping and concept mapping. ‘The phrase concept maps has been used interchangeably with mind maps, knowledge maps, graphic/visual organizers and semantic webs’ (Alkahtani, 2009: 128). These maps are similar in many aspects but they also differ in some ways. How researchers choose which maps they are going to use relates to their ‘attainment of a meaningful life’ because maps allow the researchers to engage in meaningful learning, verification, and reflection (Wheeldon and Åhlberg, 2012: 29).
Knowledge mapping refers to the learning process where a knowledge map is created through the manipulation or transformation of information or knowledge (Ebener et al., 2006). Knowledge maps are used to present texts in ‘two dimensional, spatial and node link network’ and studying using knowledge maps is an effective to increase the acquisition of knowledge compared to the traditional text (Hall and O’Donnell, 1996: 94).
Whereas mind maps are the tools used for collecting spontaneous data from qualitative studies (Wheeldon, 2011). Through mind maps, ideas, words and concepts are displayed and arranged around a central idea on a diagram (Wheeldon, 2011). Wheeldon continues that mind mapping is commonly used to focus on one topic at a time and is less formal than concept mapping because it does not need linking phrases and tends to be more creative. Mind mapping is expressed in a free form, which makes it particularly attractive to qualitative researchers (Wheeldon, 2011).
In contrast, concept mapping is commonly used in quantitative research studies to analyze open-ended survey responses (Jackson and Trochim, 2002). While concept maps are also used by researchers undertaking qualitative studies for purposes of clarifying relationships identified in the analysis of interviews and other data (Raymond, 1997 as in Wheeldon and Åhlberg, 2012). The use of concept mapping to assist in the learning process is common (Hall and O’Donnell, 1996); however, there is a dearth of information vis-a-vis the use of concept mapping in grounded theory studies.
Concept maps and mind maps are differentiated based on their common functions and use in diverse research approaches. Novak and Gowin (1984: 15) explain the aim of concept maps is to ‘represent meaningful relationships between concepts in the form of propositions’. Further, they define propositions as concept labels that are connected by linking words. While we acknowledge rules are important, as advocated by Novak and Gowin, we welcome Wheeldon and Åhlberg’s (2012: 31) perspective that it is permissible to take a more flexible approach regarding the adoption of mind or concept mapping. Wheeldon and Åhlberg (2012: 31) suggest it is more important to clarify how we use mapping and acknowledge any related drawbacks or challenges rather than ‘. . . insist on a uniform standard that favors the perfect over the good’.
Concept maps
Using concept mapping as a tool to illustrate knowledge structures, dates back to the early 1970s (Novak, 1977). Concept maps provide a visual representation of how different concepts are meaningfully related to each other, directly or indirectly. As new data is obtained the concept map evolves as possible new links or different connections are made and new concepts are included (Alkahtani, 2009; Novak, 1998). In this paper, we define the term ‘concept map’ as representing the concepts gathered from the data with the aim of visualizing the concepts, communicating and progressing the analysis. We chose this position because we were using concept mapping as a data analysis tool in each phase of our study, which facilitated seeing meaningful connections between concepts emerging from the data. Furthermore, we used this tool to help verify data and reflect on the data throughout each phase of data collection (Wheeldon and Åhlberg, 2012).
The concept map contains concepts in the form of words (Novak, 2004). Birks and Mills assert that ‘everything is a concept’ when analyzing data in a grounded theory study and as such, due to the large amounts of data, researchers may lose focus on the intent of the research (2015: 86). Thus, Glaser and Strauss (1967) emphasize that the unit of analysis should be kept in mind when the research is conceptualized. In our concept maps, the unit of analysis reflected who the actor was, what the action was, and who interacted with the actor. The unit of analysis should be reflected in the concept maps and the concepts and codes should be aligned with the research question, aim, and unit of analysis, as was done in our study (Birks and Mills, 2015; Glaser and Strauss, 1967).
The maps are not intended to be products or outputs but rather to inform and demonstrate the process of analysis. For example, the maps we provide as illustrations in this paper are not aimed to be read word-for-word. Rather, the maps reflect the process we undertook throughout the successive stages of analysis in our grounded theory study. In our maps, the complex connections and flows were further explicated in the memos, rather than using textual titles for lines and arrows on the maps themselves (Miles et al., 2014).
One of the lessons we learned in our analytical process was that using additional concept mapping features (such as arrows, line titles, shapes and colors), assisted us to further progress the analytical process. In addition, the inclusion of these more sophisticated features increased the explanatory power of the maps when they were used as products during the dissemination phase or during the member checking phase of our study. Therefore, we would recommend that future researchers take full advantage of these additional mapping features.
To develop concept maps, Novak (2004) suggests referencing a particular question that needs to be answered or events to be understood, in this case, a research question. Thus in concept mapping, knowledge gained from the data/the interviews can be represented. A concept map shows the relationship between concepts by linking them with a connecting line (Novak, 2004). Some concepts may not be related, and thus this data should not be forced as forcing the data may violate the principles underpinning grounded theory methodology (Kelle, 2005).
There are a range of software programs that can be used to facilitate the development of concept maps such as NVivo and Atlas-ti. In our process of analysis, we developed our concept maps using NVivo, Buble.us, Microsoft Office, and PowerPoint. NVivo per se provides options of mapping such as concept mapping and mind mapping. We chose to use ‘concept mapping’ based on our aims for visualizing emerging concepts from raw data, efficiently communicating the developing theory under construction, and demonstrating progress in the analytical thinking process.
To reiterate, in the process of analysis in a grounded theory study, ‘everything is a concept’ (Birks and Mills, 2015: 86). Birks and Mills further state that by using the essential methods of grounded theory 1 , the concepts will develop from a lower to a higher conceptual level, and this progressive development can be illustrated by the four progressively developing maps produced during our analytical process, and included here. The concepts we used were described as codes, categories, and subcategories based on the grounded theory methods we have undertaken (Strauss and Corbin, 1990).
For the purpose of our analytical process, the type of concept map we are referring to throughout this paper is concept mapping that is flexible (Wheeldon and Åhlberg, 2012) and served three functions: to visualize emerging concepts from raw data, to efficiently communicate the developing theory under construction, and to demonstrate progress in the analytical thinking process.
As mentioned earlier, the grounded theory analytical process occurs in three stages: initial, intermediate, and advanced. Concept maps were developed in each of the coding processes, and differences regarding complexity and the level of abstraction at each stage were evident. As the analytical process increased with each stage, the concept maps also became more advanced in their level of abstraction. The concept maps were labeled according to their level of abstraction and complexity: early, intermediary, penultimate, and ultimate concept maps.
The analysis of data in grounded theory can be visualized by using diagrams. Grounded theory studies aim to explore basic social processes. Some may consider that social processes are too complex and too fluid to understand without adopting conceptual frameworks that can provide an inductive method for considering emerging concepts (Miles et al., 2014). Using a conceptual framework allows for emergent concepts to be displayed and explicated with graphics depicting connections to the phenomenon being studied (Miles et al., 2014). The conceptual framework provides a means of mapping researchers’ evolving understanding of the basic social process they are exploring. Miles et al. (2014) also suggested that when using mapping, the conceptual elements should be selected based on a prioritization process of what they believe are the most important concepts, whether there are meaningful relationships and if there is additional data that is required to address the questions asked.
In qualitative studies, the data is generally textual as is the analysis. The data are fractured into segments (codes) that the researcher then interrogates, compares, and contrasts to build categories and theories that explicate the phenomenon of interest (Miles et al., 2014). Organizing our data for analysis was achieved by using concept maps. Data were displayed using matrices, networks, and graphics with the analytic text used to label data fragments, codes, and ultimately a theory that was revised as our thinking advanced (Miles et al., 2014). As Miles et al. contended, we also used analytic memos to capture our reflections on the conceptual meaning of data as we analyzed the data.
The choice to use a computer software package and which package to adopt to assist the conceptual mapping process is a decision that the researchers make based on their project, accessibility, costs, and fit (Miles et al., 2014). When using graphic mapping, the researchers create diagrams and other displays that visually present their study’s findings or theory. We used the data organization functionality of NVivo for this purpose. Like other software, this software does not analyze data, rather it provides details of the analytic process as it progressed. NVivo was an appropriate choice for us, as it provides a repository for the raw data, enables manipulation of the data, and has the capacity to provide visual representations of the data as the analysis process evolves.
Concept maps do not only include concepts per se, hierarchies, and connecting terms but also visual representation of concepts and propositions that aim to provide greater understanding of the relationships between various concepts (Wheeldon and Faubert, 2009). Wheeldon and Faubert contend that concept mapping should be defined in more flexible ways including collecting data so that maps can assist to elucidate the analytical process. To ensure that the necessary information is included in the maps, Kelle (2005: 10) suggests that researchers verify ‘only relevant aspects of the phenomena under scrutiny are recognized and described’. Thus, when undertaking concept mapping, researchers need to continually return to their research question. Moreover, to effectively conduct grounded theory, Kelle also recommends researchers engage in philosophical and epistemological discussions.
Link between philosophical stance and concept mapping
In grounded theory diagramming is used to display data. In our study we mapped the initial coding stage that informed and enhanced our capacity to conceptualize as we moved from initial to intermediate and then to advanced coding (Birks and Mills, 2015). There are no rules associated with mapping in grounded theory. We chose to adopt this method to focus our deliberations about the data without losing sight of the research question while adhering to the inductive nature of grounded theory methodology, where everything is a concept (Birks and Mills, 2015).
Different grounded theorists have advocated diverse terms to explicate ‘concepts: codes; categories; properties; core categories’. Mapping enables grounded theorists to establish a hierarchy that features codes, categories, and ultimately a theory(ies) (Clarke et al., 2015). In grounded theory, some researchers use situational analysis that employs the use of situational maps, while others utilize theoretical codes, storyline, and conditional matrix, or consequential matrix as tools supporting the analytical process (Birks and Mills, 2015). Initially, all the data are analyzed for incidents (reoccurring actions, characteristics, experiences, phrases, explanations, images, and/or sound). Codes are developed to identify ‘conceptual reoccurrence and similarities in the patterns in the data’ (Birks and Mills, 2015: 89).
An effective research design is congruent with the philosophical tenets underpinning research methodology (Birks and Mills, 2015). Our grounded theory study was informed by symbolic interactionism and constructivism. Symbolic interactionism has been regarded as an appropriate and frequently used method that researchers employ to study the life and behavior of human beings (Blumer, 1969). Constructivism refers to the relationships between the researchers and the participants who actively co-create and construct knowledge (Charmaz, 2006).
Using the process of concept mapping, researchers can ensure and strengthen methodological alignment. Concept mapping allows researchers to visualize the outcomes of data analysis and the process by which these are achieved. In addition, this methodological tool enables researchers to communicate the research process undertaken and identify relationships between discrete data fragments or emerging concepts. Novak (1993) states that in concept mapping, people construct and reconstruct the meaning of events or objects they observe and thus key concepts are demonstrated. Therefore, the concept mapping process aligns with the researchers’ philosophical stances of constructivism, which is the belief that knowledge is co-constructed and interpretive (Wilson et al., 2016).
The development of our concept maps were also congruent with tenets in symbolic interactionism. The data analysis involved looking at interactions rather than a single event or object. We considered a unit of analysis consisting of what they did, how they interacted with others, and what objects influenced them, rather than looking at single codes for the term or person.
The study exemplar
The focus of the study described in this paper is health education for people with diabetes in Indonesia. This study used grounded theory as the research methodology to address the basic social process of how people with diabetes learn about their diabetes and engage with health education. Ethical approvals were obtained from the Human Research Ethics Committee James Cook University Australia (H6445) and Faculty of Nursing Universitas Indonesia (0367/UN2.F12.D/HKP.02.04/2016). This study took place in both outpatient and inpatient healthcare facilities in the West Kalimantan province, which has a higher diabetes prevalence rate than other provinces in the country (National Institute for Health Research and Development, 2008, 2013). The study generated data from interviews with people with diabetes, diverse diabetes health care professionals, other health care service providers and families of people with diabetes.
Analysis in grounded theory
As stated, in a grounded theory study, the process of analysis occurs in three coding stages, namely initial, intermediate, and advanced (Birks and Mills, 2015). Through these coding processes, constant comparative data analysis allows the researcher to compare incoming data with existing data. Incidents, concepts, codes, and categories are compared across the interview excerpts and within the existing interviews. In this analytical process, the researchers need to interact with the data and the interactions should be recorded by writing memos and developing concept maps.
As in other qualitative study methodologies, analytical processes commence after data has been collected using various approaches such as interviews or observations. However, in a grounded theory study, generating and collecting data occurs simultaneously with analyzing the data. This means that analyzing data and the subsequent development of a concept map commences once the initial data set has been collected.
Kane and Trochim (2007) used concept mapping and shared their real-life experiences for planning and evaluation; similarly, in this manuscript we share the real-life experiences in analyzing grounded theory data from the perspective of one principal investigator for the benefit of other future novice researchers. Concept mapping is defined as ‘any process for representing ideas in pictures or maps’ (Kane and Trochim, 2007). Likewise, conceptually mapping during analysis in grounded theory studies is often called ‘diagramming’ (Birks and Mills, 2015: 100). Diagramming can help researchers organize lists of codes in the initial coding process that they then consider in order to raise levels of abstraction.
Diagramming in grounded theory helps to identify properties/dimensions of categories and subcategories, and then helps to find gaps in theory development or assists in directing the theoretical sampling. Moreover, diagramming helps to identify connections, intersections, and overlaps. However, as everything in grounded theory is considered to be a concept, we confidently chose to use the term ‘concept mapping’. In Strauss and Corbin (1990), diagrams can be used from the beginning of the study, along with memo writing. Memoing is a way of capturing the thoughts throughout data display, collection, conclusion, and verification. Memos are brief narratives that record the researchers’ reflections and thinking about the data. With memos, the researchers can synthesize the data to a higher level of analytic meaning (Miles et al., 2014).
Developing the maps as the analysis proceeds
We discuss below our experiences in using concept maps as an analytical tool in our grounded theory study entitled ‘Exploring the process of how people with diabetes learn about their disease’.
Early concept mapping
Early concept mapping was mainly produced during the first data generation phase. There were seven participants interviewed during the first field trip to West Kalimantan. A total of seven concept maps were initially developed, giving a big picture overview of each of the seven interviews. These early concept maps, which were handwritten, served the purpose of generating initial discussion with the advisory panel.
The handwritten concept maps were helpful because it did not limit our insightfulness of the data and our ability to transfer concepts that we highlighted in the raw data. However, in further developing these early concept maps, the researchers used ‘Bubbl.us’ application 2 . Each of the seven preliminary handwritten concept maps were transferred into an electronic version by using ‘Bubbl.us’, as it was easier to share via email (Novak, 2004). One example of an early electronic concept map is displayed in Figure 1.
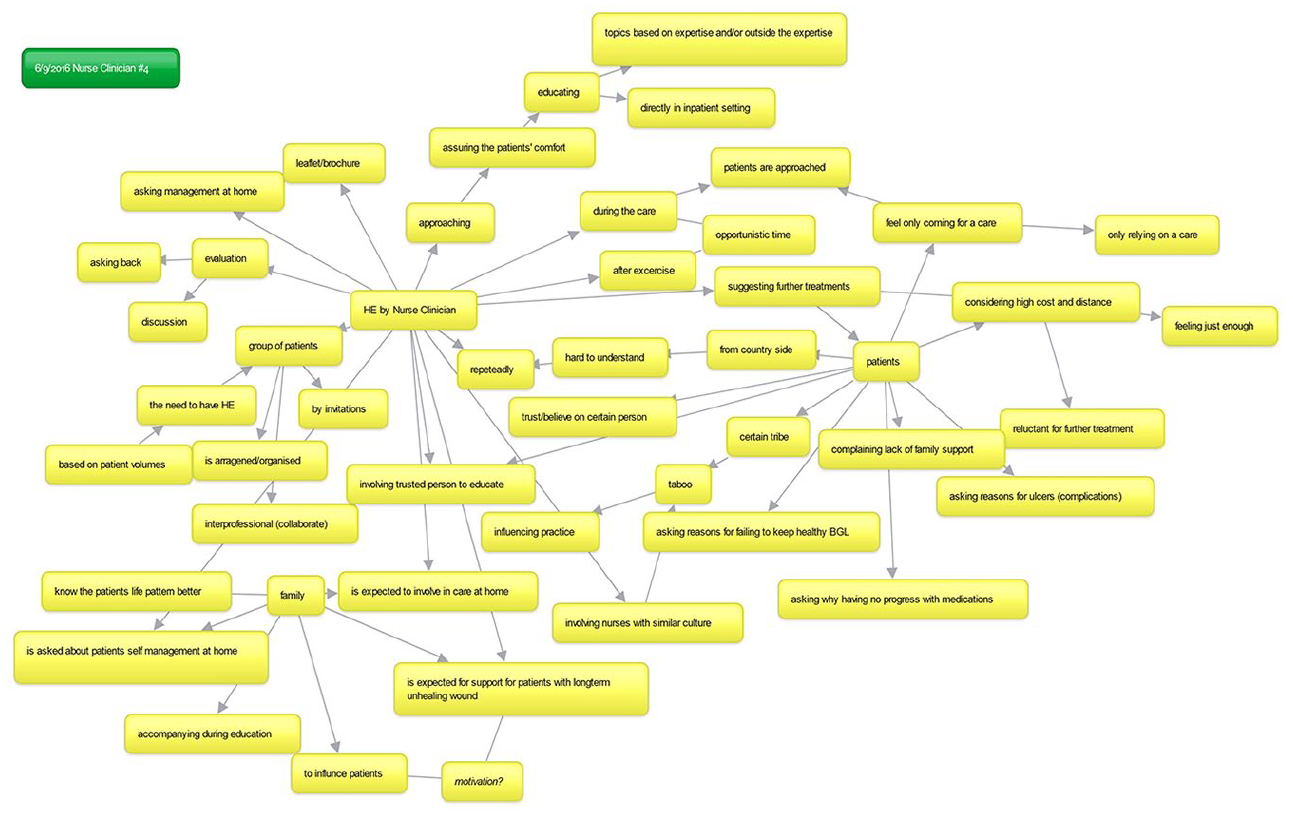
Example of an electronic version of the concept map using ‘Bubbl.us’.
The early concept maps were a useful communication tool during the analytical process. Each week, the concept maps were discussed with the advisory panel, three of whom were located in Australia and one in Indonesia. The electronic concept maps were shared easily and efficiently via electronic means. In addition, memos were written to help explain the generated concepts or codes on the maps. The memos supported the development of further concept maps. By constantly analyzing and comparing the data, a concept map was developed that encapsulated all seven preliminary concept maps. At this point, discussion sessions with research team members and writing memos were both crucial resources in developing the concept maps.
Discussion sessions, memoing, and further development of concept maps enabled the research team to identify gaps or clearly see concepts that did not relate to other concepts on the maps. The concept maps became a valuable tool in asking questions and determining what and where to search next. Birks and Mills (2015) state that this questioning strategy is useful for finding answers to the gaps identified by concept maps. By discussing the maps, clues were found in our study, which then directed the next stage of theoretical sampling. The gaps identified in the data led us to find further potential participants and a different research setting that resulted in a second field trip and further data generation.
Intermediary concept mapping
During the second field trip to West Kalimantan, a further 17 participants were interviewed and the data analyzed. During the analytical process, the data from the 17 participants was fractured to create initial codes and three subsequent concept maps were developed. These concepts maps were referred to by the research team as the intermediary concept maps. The first of the intermediary concepts maps was handwritten and included all 17 interviews from the second field trip, as well as the seven interviews from the first field trip.
The intermediate coding stage occurred concurrently with the second phase of data collection and analysis using constant comparative analysis. This process validated the further development of a concept map, with nodes/codes containing incidents that supported the data. During the discussion, the primary researcher explained the developed codes to other team members and provided evidence from the data. This process continued until the research team were satisfied that the concept map was true to the data and allowed the researchers to proffer answers to the research questions. Memos were also produced during this process.
The handwritten intermediary concept map, developed as an outcome of data analyzed from both field trips, was transferred into an electronic version using NVivo application. The electronic version of this concept map visually displayed the process of how people in Indonesia with diabetes learn about their disease. This concept map had a higher level of abstraction than the previous concept maps but was not yet at the highest level of abstraction from which a grounded theory could be produced.
Two electronic intermediary concept maps were created by using NVivo software 2 . NVivo was utilized because it was a time efficient approach for managing data. NVivo software allows researchers to link raw data electronically with an evolving hierarchal process of data analysis that can be shared. The codes or concepts were connected to the evidence from the interview excerpts. Figure 2 shows an electronic version of an intermediary concept map, which was a compilation and explanation based on the constant comparative analysis of the data from the first and second field trips.
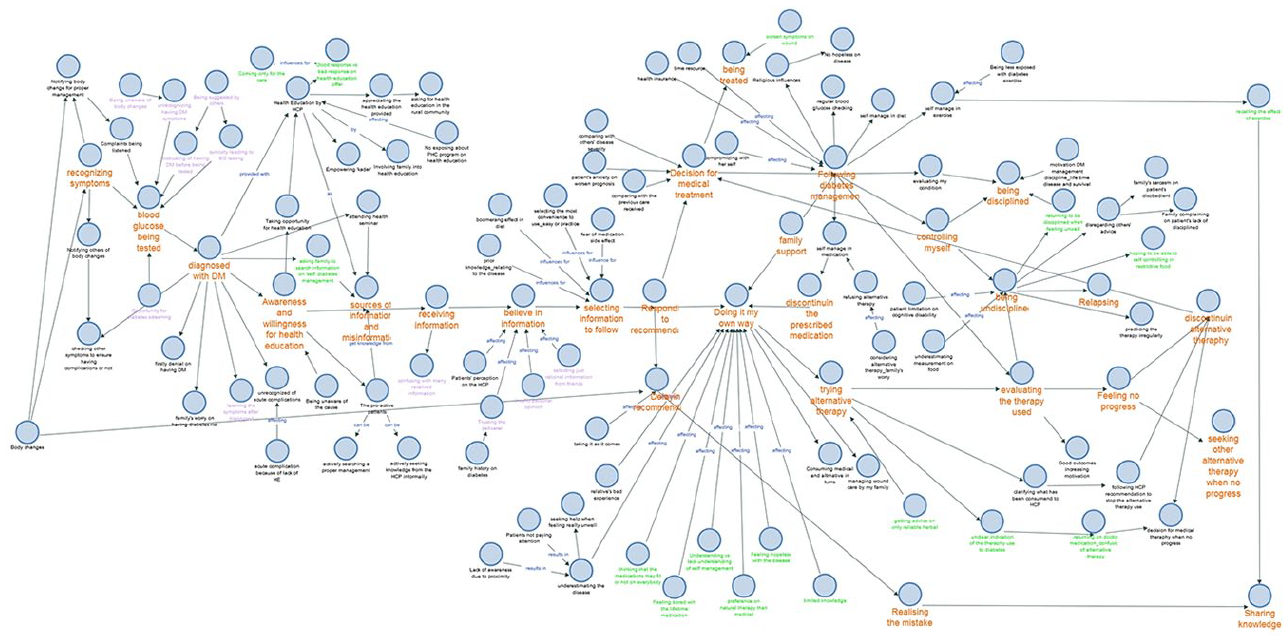
An electronic version of an intermediary concept map using ‘NVivo’.
Penultimate concept mapping
Throughout the advanced coding procedure, a core category was developed and a storyline written to explicate the process by which people with diabetes learn about their disease. The crafting of the storyline enabled the development of a further concept map, titled a penultimate concept map consisting of three concept maps. A penultimate concept map realized higher levels of abstraction with only a core category and major categories featured. This concept map was less complex visually than the previous concept maps: early and intermediary. Similar to these previous concept maps, the penultimate concept maps were also produced along with research team discussions and memo writing. In addition to discussion and memo writing, a storyline can also be considered as an element in the development of penultimate concept maps.
Using a visual tool as a method to verify the initial framework, or theory in our case, can increase trustworthiness (Whiting and Sines, 2012). To increase trustworthiness of the study and to validate the evolving theory, as represented by the storyline and the progressive concept maps, a decision for further data collection/generation was made. This penultimate concept map and the storyline explicated the participants’ experiences as interpreted by the research team. Thus we chose to provide the storyline and the penultimate concept map to existing and new participants to test, verify, or identify missing information in our theory. At this point, we used a penultimate concept map translated from Indonesian language. After that, we developed a refined penultimate concept map based on the analysis of the third phase of data generation (Figure 3).

Refined penultimate concept map.
We assert that validation of our theory was achieved as an outcome of this procedure. Corbin and Strauss (2008: 113) emphasize that the term ‘validity’ in a grounded theory study does not refer to ‘testing’, such as in a quantitative study, but rather ‘following’, which can be done by going back and comparing the evolving theory with the raw data as well as presenting and asking feedback of the evolving theory to the participants. During the process of theory integration, theory denotes an abstract version of the raw data as the theory grounded from the data (Corbin and Strauss, 2008).
Ultimate concept mapping
Ultimate concept mapping was developed during the advanced coding analysis. The categories generated in the final version of the concept map had a more advanced level of abstraction than the previously generated concept maps. At this advanced stage of data analysis, an ultimate concept map can serve to explain study phenomena compared to the lower stage, where simpler concept maps served as analysis for augmentation and clarification (Buckley and Waring, 2013).
Initially, one concept map of the overall grounded theory of ‘Exploring Diabetes Care’ was developed as the storyline was refined (See Figure 4). In the next analytical phase, evidencing the storyline, a more detailed concept map was created for each of the five major categories that contributed to the basic social process of ‘exploring diabetes care’. During this evidencing phase, the overall concept map of the theory as a whole was revised, thus becoming the final version of ‘Exploring Diabetes Care’ 3 . Therefore, a total of seven concept maps were produced at this point in this ultimate stage.
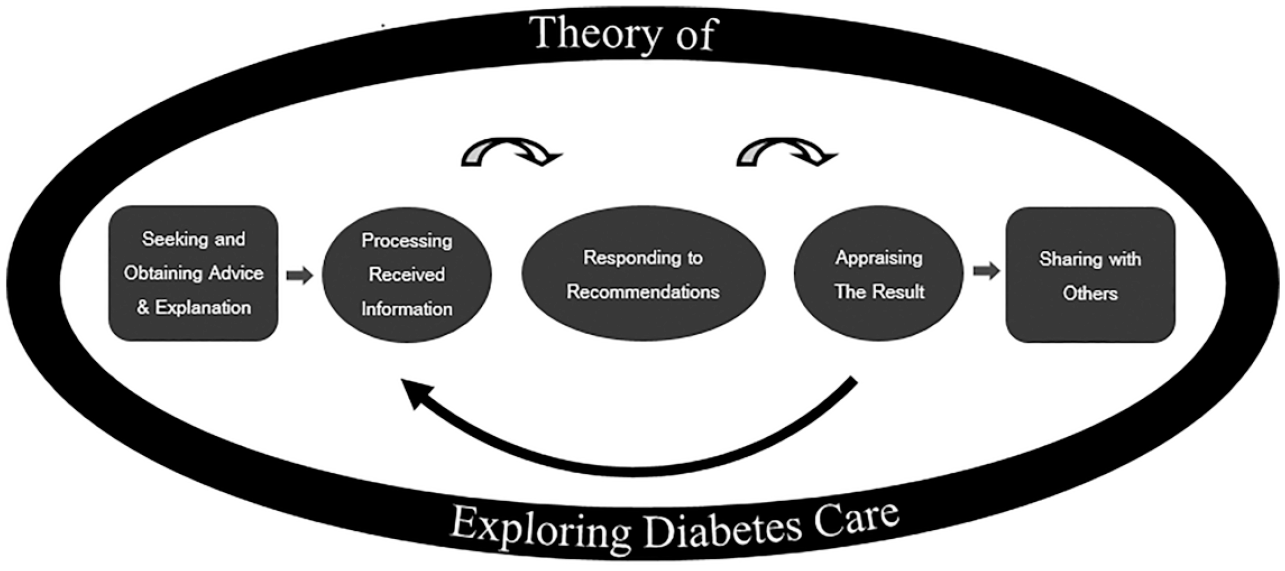
Version 1 of overall ‘Exploring Diabetes Care’ concept map.
Generally finalized grounded theories are explained in conjunction with a diagram. Corbin and Strauss (2008: 125) state that an initial diagram explaining a grounded theory is generally simple. As in a concept map, the commonly presented diagram in a grounded theory nursing study is the final product of a simple, but robust diagram that reflects a high level of abstraction. In Hoare et al.’s (2013) study of new graduate nurses in general practice in New Zealand, a final diagram was developed to depict a theoretical model representing how graduate nurses act as knowledge brokers for experienced practice nurses. Similarly, an Italian study (Palese et al., 2013) that investigated how nursing interventions affect patient outcomes in daily nursing practice also produced a final diagram visualizing theory integration with basic processes on nursing effectiveness. These diagrams typically represent a simplistic overview of the researchers’ final theory.
A summary of the main stages of concept map development, and the types of maps that were generated in each stage, are presented in Figure 5.

Summary of the process in using concept mapping.
How memoing supported concept mapping
Memos are the analytical writing that contains researchers’ ideas, thoughts, and perceptions that are closely related to the study (Birks and Mills, 2015). Memo writing was instrumental in this study as it facilitated the evolution of the initial concept maps from being descriptive to a higher level of abstraction. Categories or concepts and their relationships to each other are visually represented and sharpened through the use of diagramming (Charmaz, 2006), which is how concept mapping was used in our study.
Engaging memos during the mapping process by explaining what the concept map is about is a necessary part of a grounded theory study process. Concept mapping has helped to stimulate our thinking and understanding of the relationship between concepts and to ascertain if the concepts were distinct or similar to other concepts. Concept mapping allowed us to think and record our thoughts in memos. Conversely, writing memos helped to identify whether changes or refinements were needed to the maps. Thus, writing memos and concept mapping are both the fuel to energize theoretical integration, which is explicated in a storyline. We not only explained the concepts/codes or categories that were in the concept map but also described the relationships between them in memos. As an outcome of this action we were able to craft a storyline that provided the means for sharing, confirming, and/or gaining additional insights that led to the construction of our grounded theory. Memos provided theoretical linkages between codes highlighted in the storyline and an explanation for each (Williams and Keady, 2012). Memos, together with research team discussion sessions and the storyline, are the elements in developing concept maps. Moreover, we contend that memo writing cannot be separated from concept mapping as these musings help to explain concept maps developed throughout the research trajectory.
Recommendations for using a concept map during analysis
To adequately use concept mapping during data analysis in a grounded theory study, several points need to be considered. The use of a computer software application tool such as NVivo can assist researchers in developing theoretical understandings of the data. We advise paying attention to choosing a tool that does not limit capacity to be flexible, allowing for theoretical sensitivity to be accommodated. Drafting handwritten concept maps initially is advised, as these assist researchers to consolidate preliminary ideas and provide direction for further data generation and analysis. In choosing a tool, it is important to consider familiarity with, and the efficiency of the tool to assist researchers to manage, organize, add to, and facilitate manipulation of data throughout the analytical process.
Novak (2004) states that computer programs offer flexibility in organizing concepts like movement or restructuring. It can also be shared and is printer friendly. However, in our study, using an available online application at the initial stage was quite challenging because our maps comprised descriptive nodes and details. Using an online tool may have restricted our ideas. Once we developed our analysis to a further stage that produced categories and relationships, we could then use the online tool to help us to systematically map our concepts and easily communicate with each other.
Some aspects need to be considered before adopting an online application tool for making a concept map. First the flexibility of the application. Can the application be easily shared with team members and can they easily edit the developing map? Second, cost effectiveness. Generally, the more functions offered, the more expensive the application. Some free applications may provide the functionality required. Third is the application time-saving. Learning a new software application can take time, but we found it did help to advance our level of abstraction in generating concept maps while analyzing the data.
Conclusion
This paper confirmed the importance of and explained the use of concept mapping in a grounded theory study as an aid to data analysis. A concept map or diagram in a grounded theory study is not only valuable to explain the final theory but is also important for communicating the findings and assisting researchers to strengthen conceptual analysis. Examples of how developed concept maps throughout our study, and the importance of memoing, team discussions, and storyline as essential tools in the research process were described in this paper. This paper has discussed a number of considerations that researchers need to contemplate when choosing to use concept mapping during data analysis including the flexibility and efficacy of the concept mapping application and time available during the analytical process.
Footnotes
Acknowledgements
This paper is part of a doctoral degree program. The authors acknowledge the Department of Foreign Affairs and Trade, Australian Government, for the funding provided for Titan Ligita’s Doctor of Philosophy study at James Cook University, Australia.
Conflict of Interest
The author(s) declared no potential conflicts of interest with respect to the research, authorship, and/or publication of this article.
Funding
The author(s) disclosed receipt of the following financial support for the research, authorship, and/or publication of this article: The authors received financial support for the research, authorship, and/or publication of this paper from Department of Foreign Affairs and Trade, Australian Government.
