




Abstract
This article presents the design and functionalities of interactive software for multimodal analysis currently being developed in the Multimodal Analysis Lab, Interactive Digital Media Institute (IDMI) at the National University of Singapore. The software is being used for the annotation, analysis, search and retrieval of semantic patterns in unified but complex semiotic acts – for example, the interaction of gesture, gaze, intonation, camera angle, and music in a film. In addition to providing a digital platform for multimodal analysis, the software provides the site for further development of multimodal theory as the analytical techniques and tools produce insights into the nature of the multimodal phenomena. The approach is located within the digital humanities paradigm that promotes the use of computer techniques and technologies for humanities, arts, and social science research.
Introduction
The complexity of multimodal analysis, involving the annotation, analysis and interpretation of patterns of semiotic choices from language, image and audio resources, requires a range of theoretical and practical tools if the field is to move beyond general observations to empirically grounded insights arising from detailed semiotic analysis (for example, see Bateman, 2008; Bateman and Schmidt, 2011). The labor-intensive nature of multimodal analysis can be somewhat alleviated through interactive software that provides a palette of tools specifically designed for the multimodal analyst. In what follows, we describe the design and functionalities of the interactive multimodal analysis software application being developed in the Multimodal Analysis Lab in the Interactive and Digital Media Institute (IDMI) at the National University of Singapore. The software is being used for the annotation, analysis, search, and retrieval of semantic patterns in unified but complex semiotic acts – for example, the interaction of gesture, gaze, intonation, camera angle, and music in a film (O’Halloran et al., 2011; Smith et al., 2011). In addition to providing digital tools for multimodal analysis, the software provides a platform for further development of multimodal theory as the analytical techniques and tools produce insights into the nature of the multimodal phenomena. The approach is located within the digital humanities paradigm (e.g. Berry, 2011) that promotes the use of computer techniques and technologies for humanities, arts, and social science research.
Background
The multimodal analysis software for analyzing text, images, and videos was developed with a view to moving beyond page-based methods of multimodal transcription and analysis, and overcoming the limitations of existing multimodal annotation tools (see Rohlfing et al., 2006) which provide platforms more orientated towards description rather than sustained systemic analysis.
The software was designed with several principles in mind. First, the analyst has to organize and access a variety of media files and analyses in an efficient manner. Second, the software must contain tools to annotate different segments in the media files with respect to recorded timestamps for sound and video, 2D coordinates for images, and both for dynamic overlays in video. Third, the relations between different modalities must also be annotated and analyzed (e.g. text, image, and audio relations) through linking functionalities. Fourth, the software should contain semi-automated and fully automated features, referred to here as ‘media analytics tools’ (e.g. shot detection, optical flow, face tracking and audio tools) to help the analyst undertake low-level tasks, the results of which must also be related to other analyses. Lastly, the annotations must be stored in a database, where search results can be retrieved, exported and viewed using a range of data visualization tools.
In what follows, we provide a description of the design and functionalities of the software, which are illustrated through analysis of a video clip from ‘Happening Now’, a Fox News Corporation breaking-news program aired on 25 November 2009 (see website 1). The clip, which is approximately 6 minutes long, features a news segment where the interviewer and co-anchor, Jon Scott, interviews Dr Kevin E. Trenberth, a Distinguished Senior Scientist in the Climate Analysis Section at the National Center for Atmospheric Research in Colorado, and Mr Myron Ebell, Director of Energy and Global Warming Policy at the Competitive Enterprise Institute in Washington DC. The interview took place in the immediate aftermath of the Climatic Research Unit email controversy involving the hacking of a server at the Climatic Research Unit at the University of East Anglia on 20 November 2009. The Climatic Research Unit email controversy involved extensive media coverage where questions were raised about scientists’ manipulation of climate data, as illustrated in the video segment under analysis.
The aims of the analysis and discussion are twofold – firstly, we aim to show the efficacy and usefulness of the software for analyzing a unified but complex interaction of semiotic modalities; and secondly, we demonstrate how, from the analysis, the portrayal of events in this particular media event reveals particular biases which have political significance. We illustrate how the software can facilitate both the theory and practice of multimodal analysis situated within a larger socio-cultural framework, in this case, the ongoing debate about climate change. The design and functionalities of the software are first described, before presenting the results of the analysis.
Method
The software is organized into three components: a set of media files, a set of categorical descriptions (i.e. systems) used in the annotation, and a set of annotation units (with time-stamped and spatial co-ordinates). The software provides access to plain text, images, sound, and videos, which cover to a major extent the ways multimodal phenomena can be digitally recorded (hypertext is to be included in the next software development phase). The analyst imports the media file and uses a pre-defined set of annotation systems and/or their own set of descriptors and free text to annotate the media by creating nodes in strips with pre-assigned systems (for time-stamped analysis) and overlays (for spatial analysis). The analyst then selects the required system choice from the menu of available options and/or inserts free text. The selected option and/or text are stored in a database for later retrieval. As the analyst is likely to create multiple analyses of the same or related media using the same or similar annotation systems, the analysis components are organized into a transparent data structure so that the media files, annotation systems, and annotation units can be reused in different analyses. The method of analysis is described in detail below.
Annotation
The software contains graphical user interfaces (GUIs) for annotating text (Figure 1(a)), image (Figure 1(b)) and video and sound (Figure 1(c)).

Graphical user interfaces (GUIs) for (a): Text Annotation Interface; (b) Image Annotation Interface; (c) Sound and Video Annotation; and (d) Text Time Stamping.
The text annotation GUI is presented in Figure 1(a) where the analyst codes system choices for the linguistic text. Area (A) displays the annotation systems which, in the case of the Fox News video, have been organized into four folders: Text Analysis, Image Analysis, Tone Analysis, and Image and Text Systems. Area (B) is the word-level annotation interface, in this case for the clause ‘Hackers broke into the e-mail accounts of several prominent scientists who were working on climate change.’ Area (C) displays the annotation strips for the systems in the Text Analysis folder. The analyst codes the analysis by clicking on the desired node in the strip (corresponding to words/word groups) and selecting the required system choice. Area (D) is the browsing and editing interface where the text can be edited.
The image annotation GUI is illustrated in Figure 1(b) where the analyst draws overlays on images which can then be annotated. Area (A) is the annotation area where overlays are inserted using a palette of drawing tools (e.g. lines, circles, squares, etc.). Area (B) displays some of the systems in the Image Analysis folder. Area (C) displays two overlays, in this case for interviewer Jon Scott, which have been annotated by clicking on the desired system choice. The annotations inserted in the image annotation area (A) automatically appear as nodes (with spatial co-ordinates) in the overlay representation area (D). The ability to overlay systemic (rather than text-based or graphic annotations) is a novel affordance for multimodal analysis software.
The video annotation GUI is displayed in Figure 1(c) where the analyst plays and annotates the video using time-stamped nodes and spatial overlays. Area (A) is the filmstrip and waveform view for the video. Area (B) is the player window for the video, which can be undocked and enlarged. Area (C) displays some of the systems in the four folders. Area (D) is the playback controls for the video (e.g. play, skip, rewind, speed selection, etc.). Area (E) is the general controls (e.g. add strip, remove strip, save, search, etc.). Area (F) is the strip area for the overlays and the text, with area (G) functioning as the strip organization view. Overlays inserted in the video player (B) are automatically converted to time-stamped nodes in (F). Time-stamped nodes for the linguistic text may be coded, as described below.
The text time-stamping GUI is a special interface which relates the linguistic transcript from a sound or video to the dynamics in the source media, recovering the link between the coordinates for text annotations and the time-stamps for sound. That is, the time-stamping GUI connects text annotation, time, and sound together. The interface is illustrated in Figure 1(d). Area (A) is the filmstrip visualization area and area (B) is used to select different speech tracks (when several people are talking at once). Area (C) is the strip to view time-stamped clauses transcribed from the news interview. Area (D) is the annotated clause area where the linguistic analysis is coded. Area (E) contains the available systems and area (F) is the clause browsing and editing interface for the complete transcript. The analyst drags the clauses from (F) into (C) where each word can be positioned on the time line, thus providing the means for the analyst to synchronize system choices for language with system choices for visual and audio semiotic resources in the video. In essence, the annotation units (i.e. nodes and overlays) containing the system choices for different semiotic resources are related to each other both in terms of time and space. The ability of the software to precisely encode the spatial–temporal relations between semiotic choices and store them in a database for later retrieval and analysis is a key step forward with regards to advancing our understanding of how semiotic choices combine to create meaning.
The software provides another key functionality for developing multimodal theory and practice by providing facilities for defining and annotating network-like relationships between the annotation units. These relationships are implemented as nested links and chains, which the analyst codes by clicking on an annotation unit and linking it to another annotation unit. The links themselves are annotated using system choices for inter-semiotic relations. Links can also be made between groups of links. The GUI for coding inter-semiotic relations is illustrated in Figure 2(a) where areas (A) and (B) are annotated links between nodes in the different strips, in this case for attitudinal congruence between the systems of gaze and kinetic action vectors, interactive meaning, conceptual representation, free text annotations for describing screen composition and various overlay annotations in the Fox News report.
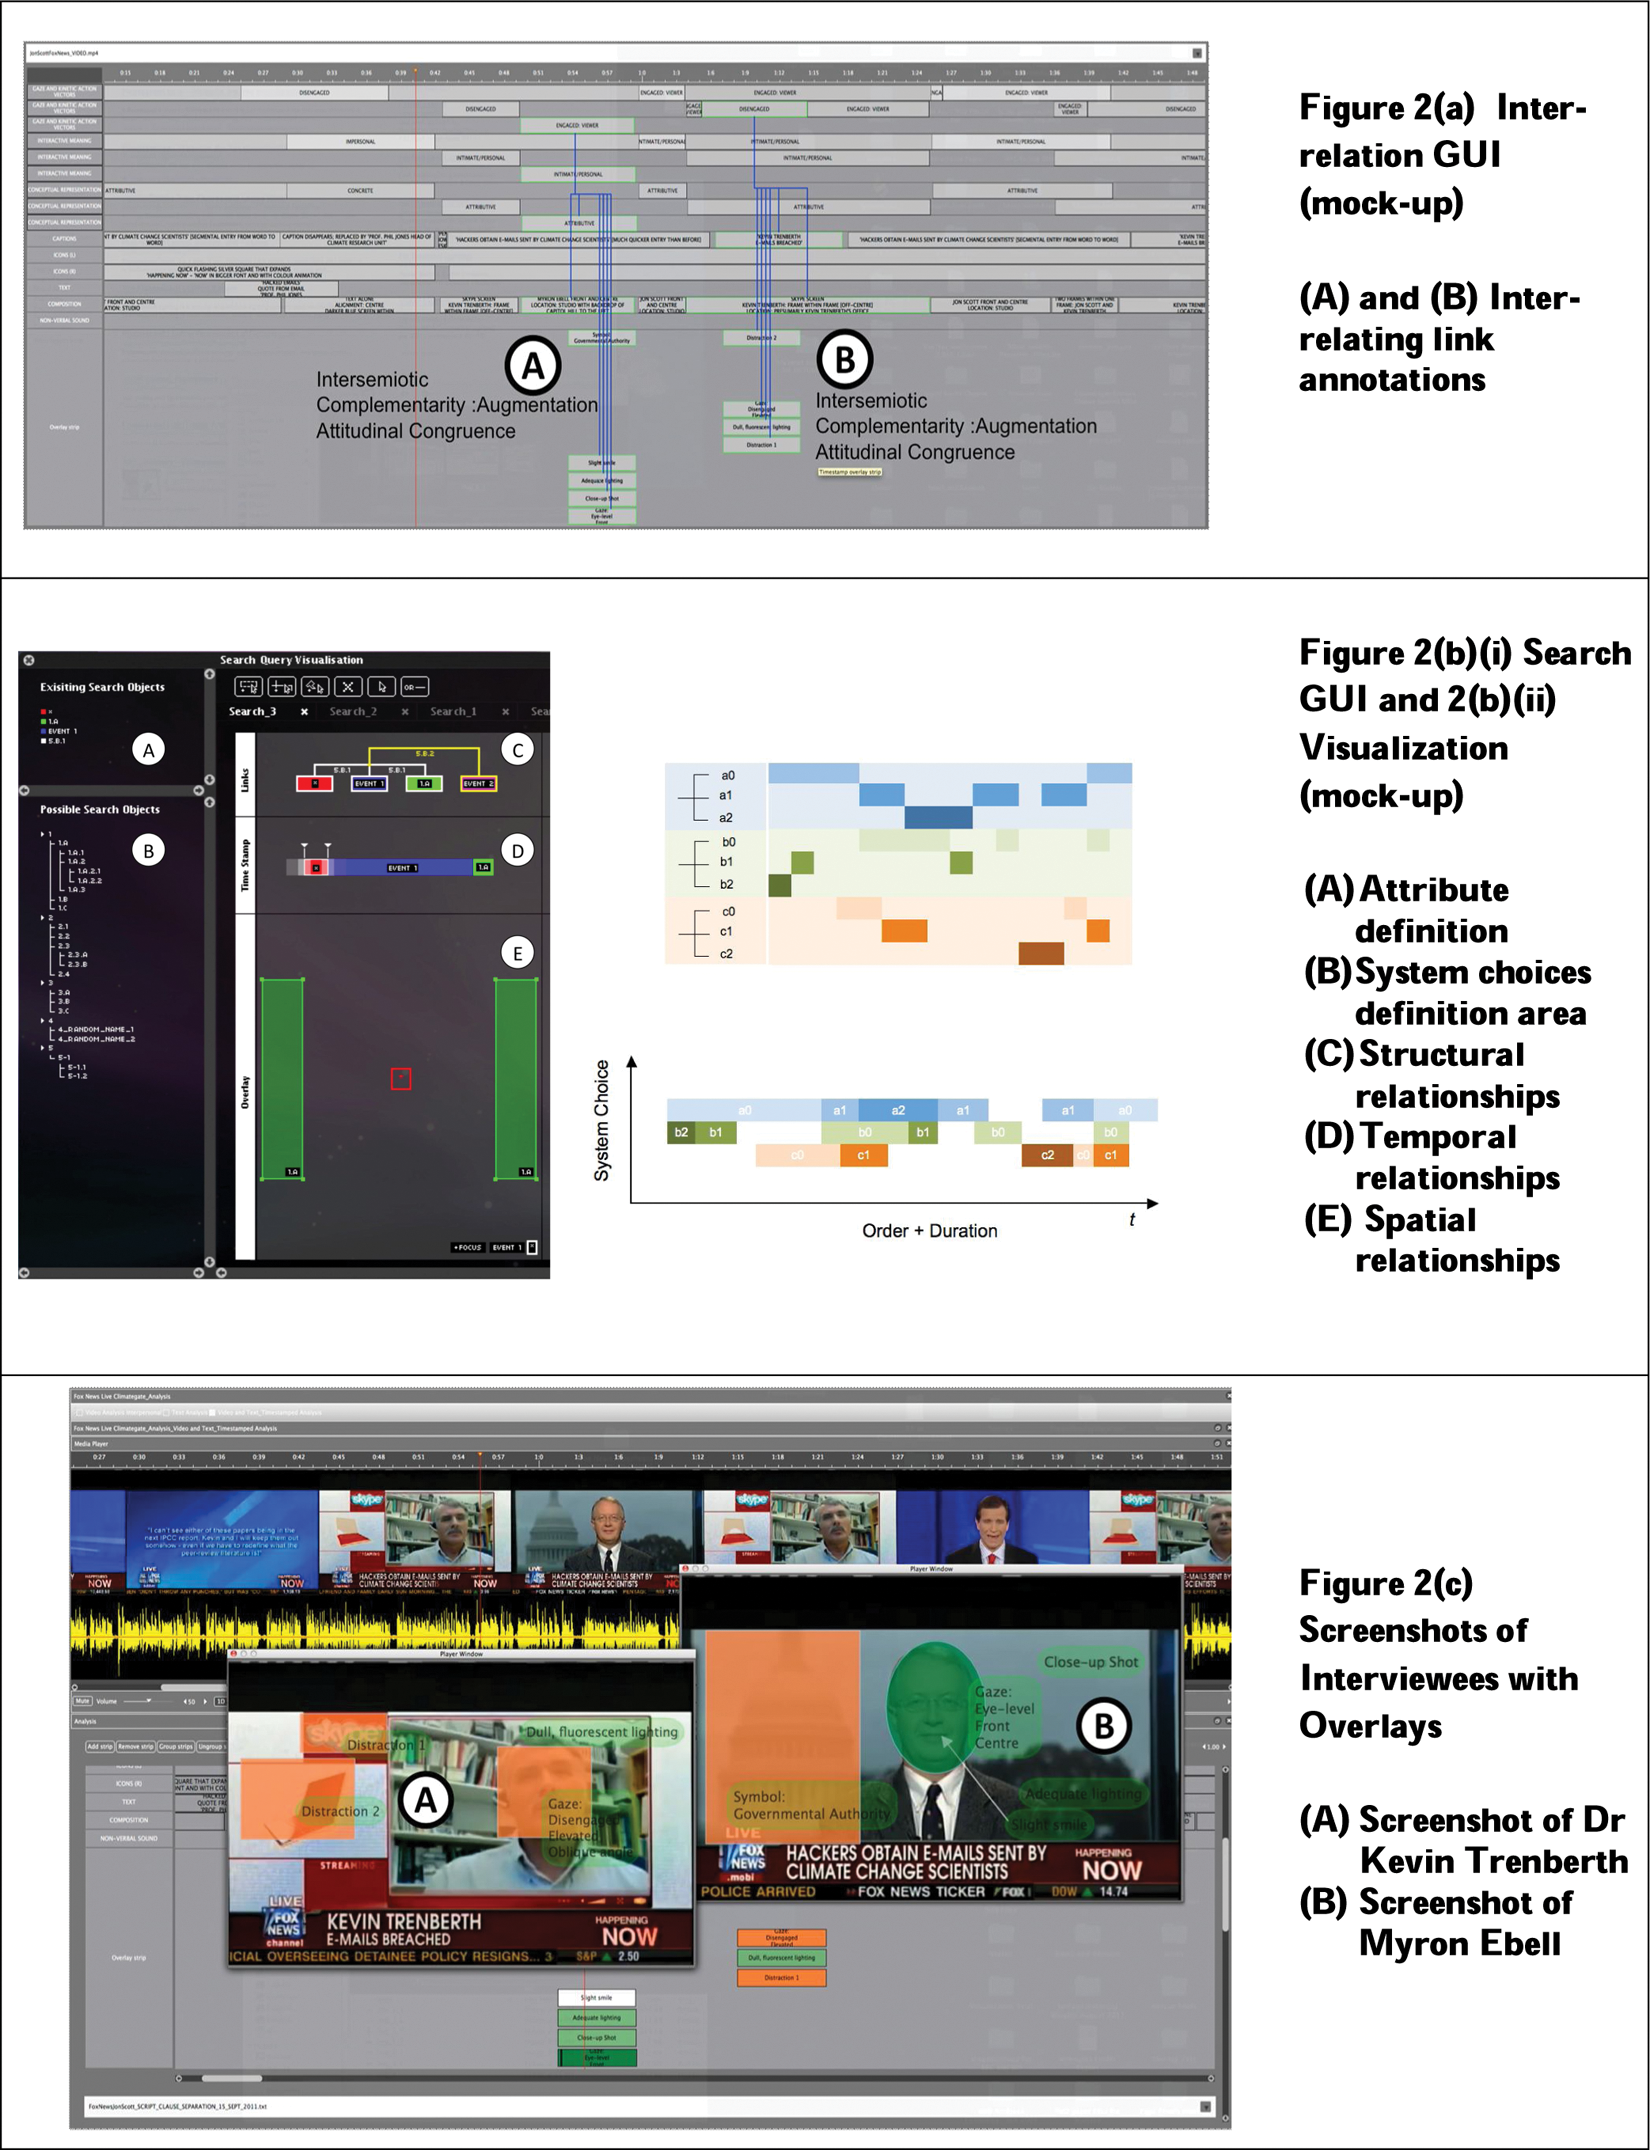
(a) Inter-relation GUI; (b)(i) Search GUI and 2(b)(ii) Visualization (mock-up); (c) Screenshots of Interviewees with Overlays.
Search
The design of the search GUI is motivated by two concerns. Firstly, the GUI must provide facilities for locating patterns of interest which are defined with respect to all the different types of annotations. Secondly, as the analyst may not be comfortable using complex programming like query language, the search GUI is implemented in a ‘What-You-See-Is-What-You-Get’ manner to define temporal and spatial patterns with respect to Attributes, Structures, Time and Space. The four types of search are:
Attributes – system choices and free text annotations
Structures – inter-semiotic relations between annotation units
Time – temporal patterns
Space – specific spatial patterns
Figure 2(b)(i) illustrates the resulting search GUI where the analyst enters criteria for the search. Area (A) is used to create the search entities (in terms of Attributes), and area (B) contains the list of system choices (i.e. the possible search objects). Area (C) is used to graphically define structural patterns (i.e. the Structure) between the search objects, area (D) is used to define the temporal relationships, and area (E) is used to define the spatial patterns. Following the input of the search criteria, filters automatically translate the search into machine-understood search queries and the results are extracted from the database. In this way, the analyst can extract the required data from the database and export it for processing.
Exporting
The search results are delivered to the user by highlighting the matching annotation units in the corresponding GUIs, which provides a visual overview, making it possible to detect patterns in complex texts from just viewing the annotations. Although this paves the way for new insights on both concrete data and multimodal theory in general via the analytical process itself, as illustrated in this article and elsewhere (see O’Halloran et al., 2011; Smith et al., 2011), this is insufficient for larger scale quantitative analysis. Therefore, the software contains an export function which permits the data to be imported into third-party software or frameworks specifically designed for numerical data visualization and analysis, such as, for example, Microsoft Excel for a general user or Matlab or Tulip (see website 2) for advanced users. The export feature enables the multimodal analyst to use the power of modern data analysis software packages for the interpretation of multimodal data. For example, time stamped annotations can be converted into state-transition diagrams which can be visualized using freely available graph visualization tools like Cytoscape (Podlasov et al., in press 2012). Moreover, a prototype visualization tool is currently being developed in the Multimodal Analysis Lab to display the search results in a ‘piano roll’ format, as displayed in Figure 2(b)(ii). The prototype tool will enable recurring patterns of choices to be automatically detected within and across different media files. In this way, the software produces data which permit patterns and trends to be identified in multimodal phenomenon.
Media analytics
The extensive palette of computational tools currently available for image, sound, and video analysis are typically designed for highly specific tasks. Moreover, they tend to be designed for expert users. However, there are algorithms which are generic enough to enhance productivity, especially because the multimodal analyst can manually correct the erroneous results that are automatically generated. The automatic tools are useful if the time taken to use the tool and correct the errors is less than the time taken to do the analysis manually. At this point in time, the following technologies are implemented in the multimodal analysis software:
Video shot detection – for identifying significant changes in the video
Audio silence/speech/music classification – for identifying intervals of likely silence, speech, or music
Face detection – for identifying faces in videos and images
Tracking – for automatically tracking objects in videos
Optical flow – for detecting the motion of objects, surfaces, and edges
Although not illustrated here, these automated tools are applied to the imported media files, resulting in, for example, annotation units for shot and speech classifications. In the case of face detection, tracking and optical flow, the results are implemented as overlays on the video, which then may be annotated using the desired system and/or free text. For example, optical flow automatically reveals the speed and direction of gesture and movement through arrows which are overlaid on the video, providing the analyst with much-needed empirical evidence for claims made about the functionality of these resources and how they combine with other semiotic choices.
Empirical Example
The multimodal analysis of the Fox News interview reveals insights into the interaction of linguistic, visual and audio modalities and intersemiotic relations which would be difficult to ascertain without the facilities afforded by the software. These findings are discussed in turn below.
The interaction of semiotic modalities across space and time
In the first few seconds of the video, an interesting interaction of visual, aural and verbal (i.e. speech utterance and written text) semiotic modalities occurs. Visually, the first shot is that of co-anchor and interviewer Jon Scott, identified via the text caption near the bottom of the screen (Figure 1(b), area (A)). Aurally, an electronic distortion guitar sound is played from the start of the video and lingers at its peak for about two seconds before it starts to fade off towards the 3-second mark (coded in the ‘Non-Verbal Sound’ strip in Figure 1(c), area (G)). Verbally, just after this electronic distortion sound is initiated and reaches its peak, the word ‘Hackers’ is uttered, beginning the first clause of the video: ‘Hackers broke into the e-mail accounts of several prominent scientists who were working on climate change’ (Figure 1(a), area (B) and Figure 1(d) area (C)). These semiotic choices function to attract the attention of viewers and focus their attention on specific aspects of the Fox News broadcast, as described below.
To analyze the image of the interviewer, the analyst is able to visually navigate and annotate the screen space by highlighting particular aspects of the image using the overlay functionality (Figure 1(b), area (A)), where we see that the gaze of the interviewer, Jon Scott, is at eye-level, front and centre, and the shot is a close-up, with the face and half-body visible. The interviewer is conceptually represented as a symbolic image with a focus on his attributes – the professionally attired and well-groomed journalist. The minimalist, dark-blue background contributes to the salience of this representation by providing a non-distracting background, which also contrasts with the interviewer’s red tie. The use of bright studio lighting is evident as the interviewer’s facial features and body profile are clearly displayed.
Based on these observations, Kress and Van Leeuwen’s (2006) framework for image analysis is used to annotate this particular shot in terms of gaze (labeled as ‘contact’, p. 149), interactive meaning (p. 149) and conceptual representational meaning (p. 105). The framework is based on Michael Halliday’s Systemic Functional Theory (Halliday and Matthiessen, 2004), where meaning-making systems consist of systems of choices that are available. These annotations are inserted in the video strip by selecting the appropriate system choice from the Systems Choice window (Figure 1(c), area (C)) and inserting it in a node which may be located at any point in the video strip.
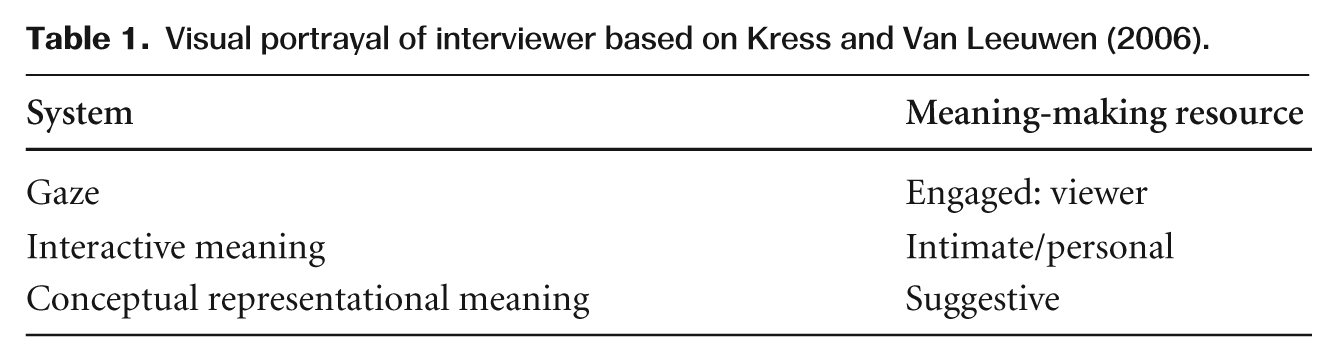
In this case, the annotated choices in the video are summarized in Table 1. From the table, we see how the interviewer Jon Scott is portrayed visually. The eye-level, front and centre gaze, combined with the intimacy of a close-up shot and the immediacy of his representation as an object of study, with his accompanying attributes, position him squarely in the viewer’s focus as a professional journalist engaging with his audience.
Visual portrayal of interviewer based on Kress and Van Leeuwen (2006).
In conjunction with this portrayal of the interviewer, the electronic distortion sound referred to earlier, which is heard in the first 3 seconds, is an interesting aural stimulus, and potentially a marked choice in the context of a news interview. However, it appears to be increasingly characteristic of news programs to go beyond merely reporting the event to providing some kind of commentary, often multimodal, in collaboration with an expert or eyewitness. Many present-day news programs now utilize other types of resources, for example, animation, graphics, sound effects, and real-time social media updates, to enhance the entertainment value of their programs (Budd et al., 1999; Montgomery, 2008). The addition of these types of resources underscores the evolution of news from being more than just information. It is now, to some extent, also entertainment.
The electronic distortion sound occurs at the beginning of the video segment, and it thus functions as a focusing and attention-seeking device, as noted earlier. Such sounds were first popularized in the 1950s and became an integral part of rock and roll music. Since then, these sounds have become very much a part of the public aural idiom, carrying with them connotations of difference, rebellion, and action (e.g. O’Halloran et al., 2011). These associative meanings have certainly not been lost on the producers of ‘Happening Now’ and they work in this particular context to shape not only the news being delivered, but also the audience’s first impression of the deliverer of the news – the interviewer Jon Scott. From the annotations in Figure 1(c), area (G), we can conclude that the lack of any other text or distracting elements in these first few seconds, other than the text caption at the bottom featuring the interviewer’s name, the Fox News ‘Live’ icon on the bottom left and the moving text below, accentuates this focusing ‘action’ in a visual manner, as the viewer’s gaze will most likely be directed to the interviewer, since he is perceived as a symbolic image and occupies a relatively large portion of the screen in the centre in a close-up shot at eye-level.
Thus, it is evident that already, both visually and aurally, there is an interaction of modalities that has a multiplicative, re-contextualizing effect – to seek attention, to focus and to imbue certain associative meanings. The verbal modality follows, with a message which the aural and visual modalities have been instrumental in framing. The software is equipped with facilities for analysis of words, word groups, and clauses, thus permitting time-stamped linguistic analysis, in combination with other modalities (Figure1(d)). In this case, the linguistic analysis stems from a systemic functional perspective (see Halliday and Greaves, 2008; Halliday and Matthiessen, 2004) where semiotic resources like language, image and sound are conceptualized as sets of inter-related systems of meaning potential (metafunctions) which operate at the different ranks and strata (e.g. words, word groups, clauses, and complex discourse structures in language, across phonetics and phonology, grammar, and discourse). There are four metafunctions: textual, interpersonal, experiential, and logical. The textual metafunction involves the organization of information into coherent text, the interpersonal, the negotiation of interactions between participants in an exchange, the experiential, the construal of experience, and the logical, the unfolding logical relations of sequences of information in the text. Following systemic conventions, the technical terms for functional units in the systems (e.g. Theme, Subject, Actor and so forth) have initials capitalized (see Halliday and Matthiessen, 2004).
The interviewer begins with a single word ‘Hackers’, which is part of the clause ‘Hackers broke into the e-mail accounts of several prominent scientists who were working on climate change.’ This single word is significant in terms of its grammatical functions and intonation. That is, ‘Hackers’ functions as topical Theme (in terms of textual meaning), Subject (in terms of interpersonal meaning), and Actor and Agent (in terms of experiential meaning and ergativity). With respect to intonation, it is tone choice 1, with the word being mapped as a single tone unit (Halliday and Greaves, 2008). Both these grammatical and intonational choices have been annotated using the word-level annotation strips in the Text Annotation Interface (see Figure 1(a), area (B)). The significance of these choices is discussed below.
The choice of ‘Hackers’ as topical Theme and Subject positions it as primary in the clause since the topical Theme is defined as ‘that which locates and orientates the clause within its context’ (Halliday and Matthiessen, 2004: 64) and the Subject is the obligatory and often first-occurring participant which has modal responsibility (in terms of tense and probability, usuality, and potentiality) with respect to interpersonal meaning. ‘Hackers’ also functions as Actor and Agent occurring in first position in the clause and, as such, is construed in the grammar as the doers of an action in the active effective voice. The intonational choice also contributes to the salience and interpersonal value of this word ‘Hackers’. The downward pitch movement of the tone 1 choice, combined with the allocation of ‘Hackers’ as a marked single-word tone unit (the default is one clause one tone group), work towards a resultant effect of emphasis and interpersonal declamation on the word ‘Hackers’ – as though it has some propositional value on its own, aside from its role in the clause.
Consequently, the interaction of resources in lexical and intonational grammar reinforces the word ‘Hackers’ and emphasizes its related concepts. As Actor and Agent positioned in the front of the clause, this word ‘Hackers’ becomes a key participant in an active, dynamic process of breaking into email accounts. The tone 1 and marked single-word tone unit choices, together with the grammatical primacy of topical Theme, Subject and Actor/Agent choices, position ‘Hackers’ and the act of hacking in the forefront of the viewer’s attention – as the nexus of choices in a range of systems.
In this brief discussion, we may see how the analyst can utilize the facilities provided on the holistic and multifunctional platforms in the software to interpret how semiotic choices interact through their occurrence across space and time.
Intersemiotic relations: using the functionality of links and chains
The annotation and analysis for the semiotic resources have largely been discussed individually, in relative isolation from the other resources which come into play, though this has been done for the purposes of illustrating some of the major functionalities of the software. However, semiotic choices from different semiotic modalities interact intersemiotically to create meaning. Thus, we can begin to examine intersemiotic relations between the visual and verbal modes in this video via the functionalities afforded by the software which permit links and chains between annotations and strips in the software interface to be inserted and annotated (see Figure 2(a)).
Our analysis investigates the portrayal of one participant, the climate scientist Dr Trenberth, arising from the interaction between the visual and verbal modalities in the text caption ‘Kevin Trenberth/E-mails breached’ and the image of Dr Trenberth himself (Figure 2(c), area (A)). There are multiple occurrences of this semiotic configuration throughout the video, but the discussion here focuses on the first occurrence (01:07:23-01:17:71). Concepts for understanding intersemiotic relations from frameworks such as Unsworth’s (2006) description of resources for the inter-modal construction of ideational meaning (in terms of experiential meaning and logical relations), and Royce’s (1998) systems for the intersemiotic analysis of interpersonal meaning are used.
Using the inter-relation functionality (Figure 2(a)), we can use links and chains to connect and label the intersemiotic relations between the text caption and the image of Dr Trenberth with its accompanying video and overlay annotations (Figure 2(a), area (B)) as ideational complementarity (Unsworth, 2006), which
refers to the situation in multimodal texts where what is represented in images and what is represented in language may be different but complementary and joint contributors to an overall meaning that is more than the meanings conveyed by the separate modes. (p. 62)
In our example, the particular type of ideational complementarity at work here is augmentation, which Unsworth describes as ‘where each of the modes provides meanings additional to and consistent with those provided in the other mode’ (p. 62). In this case, the verbal and visual are complementary and joint contributors to the multiplicative overall meaning in the sense that each is contingent upon the other – the text caption names the image, the comment in the text caption contextualizes the whole shot, and the portrayal of Dr Trenberth in the visual mode in turn works to construct a picture of the person to whom the name ‘Kevin Trenberth’ belongs, namely, the person who had his emails breached (Figure 2(a), area (B)).
Unsworth (2006) lists two sub-types of augmentation – image extends text and text extends image, as disparate choices. However, in this case, the result of the synthesis of the verbal and visual modalities is an overall expansion of meaning which we argue is a ‘bi-directional investment of meaning’ (Cheong, 2004) where both image and text extend each other.
The bi-directionality of intersemiotic relations happens as a result of both image and text containing elements which are absent in the other. In addition, the absent elements in one modality are not directly related to elements in the other modality. For example, the text caption ‘Kevin Trenberth/E-mails breached’ is an ellipsed version of two clauses – ‘This is Kevin Trenberth’ and ‘His e-mails were breached.’ The first clause is a relational identifying process clause, while the second is a passive material process clause with an ellipsed Actor/Agent. Both clauses act to identify the person in the image by giving him a name and providing information on his role in the Climatic Research Unit email controversy. However, the image shows Dr Trenberth in what presumably is his office with an untidy bookshelf in the background, giving a further extension of meaning regarding the context in which he works, influencing the overall meaning that is communicated to the viewer.
In the screen shot of Dr Trenberth (Figure 2(c), area (A)), his disengaged gaze, which actually changes from disengaged and engaged and back throughout his answer to the interviewer’s question, combines with his slightly elevated and oblique angle position (vis à vis the viewer), leading to an indirect engagement with the viewer (Kress and Van Leeuwen, 2006). Typically the low viewpoint shot of Dr Trenberth would make him appear powerful, but in this case, other semiotic resources work against this reading, illustrating the significant point that meanings cannot be unequivocally assigned to semiotic choices (e.g. low shot means high power) without regard to the multimodal context of their realization. In this case, along with the fluctuating direction of his gaze, the dull white fluorescent lighting and the Skype branding interface with rotating laptop animation on Dr Trenberth’s left serve to distract and further distance Dr Trenberth. This visual portrayal combines with the verbal text, which identifies Dr Trenberth as ‘Kevin Trenberth’, without his institutional and professional credentials, and which also defines his role in the event with the caption ‘E-mails breached’. He is thus cast as someone directly involved – a possible protagonist (he did not deserve to get his emails breached) or antagonist (he deserved to get his emails breached), depending on the viewer’s background knowledge of the event and climate science. However, if the viewer has had little or no background knowledge, this portrayal of Dr Trenberth with the disengaged, distant characteristics and untidy office might undermine any opinion he might contribute during the news interview. In addition, the lack of reference in the verbal modality to his institutional and professional credibility, and the ambiguity of his direct protagonist/antagonist role in the event, may further undermine his contributions to the interview.
Using Royce’s (1998) framework for intersemiotic relations for the interpersonal metafunction, we identify attitudinal congruence between text and image where both modalities convey similar meanings (Figure 2(a)). In the text caption, the absence of Dr Trenberth’s institutional and professional credentials and the ambiguity surrounding the nature of his direct involvement work to undermine the opinions he has expressed in the interview. Similarly, in the image, there is a sense of disengagement and distance which is conveyed. Thus, these forms of expression in both modalities invest each other with meaning and synergetically compromise whatever Dr Trenberth’s contribution is to the interview.
The portrayal of Myron Ebell (Figure 2(c), area (B)) stands in stark contrast to the disengaged and disempowering visage of Dr Trenberth.Visually, Mr Ebell mirrors the portrayal of the interviewer Jon Scott, with his front and centre gaze and close-up, eye-level shot. The background, with Capitol Hill as a building symbolic of United States governmental authority works to reinforce the authoritative visual ‘stance’ that Mr Ebell portrays here. Bright lighting shows clearly Mr Ebell’s facial features and his slight smile in this shot indicates acknowledgement and awareness of his audience, to which a certain degree of arrogance seems to be attached. The relevance of these findings is discussed below.
Relevance
Research has shown that the leanings towards sensationalist stories in news media have often led to unbalanced, superficial, and incomplete portrayals of climate science events which prioritize one perspective over another or do not lead to any definite conclusion (Boykoff, 2011; Boykoff and Boykoff, 2004). Scientists have also played into the hands of media agencies as their careful management of scientific uncertainty in scientific discourse, so often seen as a hallmark of scientific validity and reliability, has frequently, in non-science contexts, resulted in an ‘informational bias’ (Boykoff and Boykoff, 2004) that has been exploited by both politicians and the media alike (Carvalho, 2007; Smart, 2011).
Instances of choices for semiotic modalities and the manifestation of inter-semiotic relations are not without ideological significance. Space constraints prevent us from engaging in a full discussion, but essentially, the analysis undertaken here suggests how certain forms of expression and portrayal highlight, and thematize events from a particular perspective, and how the messages that individuals wish to convey are mediated by expressions of meaning in other modalities. In this case, we see the conflicting interests of the media, big business, and the scientists. The professionals in this media production are the interviewer and the climate denialist, and the novice appears to be the climate scientist, despite having the credentials to investigate and contribute to the climate science debate. With the software, it is possible to unveil and critique the variety of multimodal strategies at play in this news report.
Limitations
Multimodal analysis can only be satisfactorily undertaken through the use of interactive digital media and computer techniques that can capture dynamically the unfolding semiotic choices as they combine across multiple modalities. In this way, the meaning potential of analytical tools and the methodology accord with the phenomenon under study to encode temporal and spatial relations as they unfold. To this end, the software models the integration of language, image, and audio resources on a common computational platform.
The software was, however, complex to conceptualize and design, involving a wide range of research areas that include semiotic data models, raw data projectors for images and video, temporal, and spatial reasoning, visual analytics, and media analytics. The time taken to design and implement the underlying system infrastructure and the graphical user interface designs has meant that many advanced ideas, theories, and techniques have not been tested or implemented in the software. As a result, there are many limitations to the software.
First, the software lacks a comprehensive theoretical approach to multimodal analysis. That is, apart from system network trees, the software lacks facilities for modeling semantic systems, and it also lacks sophisticated techniques for modeling meaning arising from the interaction between semiotic choices, apart from time-stamped annotations of co-occurring choices and cohesive links which connect semiotic choices across different tiers. Such network relations are fundamental to the software, however, and they provide a platform for the development and testing of theory (Smith et al., 2011). Second, facilities to operationalize the inferential logic between systems and system choices (i.e. if choice a 1 from system A is made, then b 1 from system B follows) are not included in the software. Third, the multimodal analyst must export the search results into third party software for visualization and comparison of different analyses. Much effort has gone into designing and implementing the architecture and functionalities of the software to provide a common computational platform for integrating linguistic, visual and aural modalities, but the major theoretical and analytical issues surrounding the nature of semiotic resources and the integration of semiotic choices in multimodal phenomena are yet to be resolved.
Discussion
The multimodal analysis software permits multimodal data to be generated in a systematic manner, thus facilitating empirically grounded results that will advance the field of multimodal studies, particularly when combined with technologies such as eye-tracking (see Boeriis and Holsanova, this issue). Such systemic analysis is firmly anchored to close consideration of the expression plane, ‘to go back to the source, to reconnect with the meaning potentials that are opened up’ (Van Leeuwen, 1999: 193). The software contains a default grammar for language, image, and audio resources, and their inter-semiotic relations, largely conceived from a social semiotic perspective, but analysts are free to develop their own theoretical framework using the available facilities which permit the low-level features of media to be linked to semantic analysis. However, this is a small step in a long road where social scientists learn to engage with scientists and computer scientists to fundamentally change the way they understand and approach socio-cultural analysis. In this way, we will be able to move forward to address the issues and challenges presented in an age of interactive digital media technology which has fundamentally changed both the nature and rate of semiotic change in society today.
Footnotes
Acknowledgements
The research for this paper was supported by Interactive Digital Media Programme Office (IDMPO) under the National Research Foundation (NRF) in Singapore (Grant Number: NRF2007IDM-IDM002-066).
Biographical Notes
KAY L. O’HALLORAN is Director of the Multimodal Analysis Lab, Deputy Director of the Interactive & Digital Media Institute (IDMI) and Associate Professor in the Department of English Language & Literature at the National University of Singapore. Her research areas include multimodality, with a specific interest in multimodal approaches to mathematical discourse, and the development of interactive digital technology for multimodal analysis (see  ).
).
Address: Multimodal Analysis Lab, Interactive & Digital Media Institute (IDMI), 9 Prince George’s Park, National University of Singapore, Singapore 118408. [email:
ALEXEY PODLASOV is a Research Fellow at the Multimodal Analysis Lab in the Interactive and Digital Media Institute (IDMI) at the National University of Singapore, with a background in computer science and applied mathematics. His current interests are with data modeling, visualization and analytics, computer vision, image and video processing, as well as with software prototyping and development.
Address: as Kay L. O’Halloran. [email:
ALVIN CHUA is a PhD student at Katholieke Universiteit Leuven, working in the field of data visualization and analytics. His interest also includes generative art and design. He works with computational tools and techniques to create physical representations of data as well as visualizations of systemic processes. Alvin was a research assistant at the Multimodal Analysis Lab, Interactive Digital Media Institute (IDMI) at the National University of Singapore.
Address: Departement Architectuur, Stedenbouw en Ruimtelijke Ordening, Kasteelpark Arenberg 1 - bus 2431, 3001 Heverlee, Katholieke Universiteit Leuven, Leuven, Belgium. [email:
MARISSA K.L.E is a researcher at the Multimodal Analysis Lab in the Interactive and Digital Media Institute (IDMI) at the National University of Singapore. Her interests lie in multimodal discourse analysis and its role in the perpetuation and evolution of ideologies and culture. She is presently working on a project dealing with the mathematical modeling of multimodal data and collaborating on a project concerning the development of software for multimodal analysis.