
Abstract
With the development of visual digital technologies it has become more common in the social sciences to both use and present research visually. This article explores different strategies for working with and including images in ethnomethodology and conversation analysis (EMCA) transcriptions. The purpose is to investigate how, and if, the ontology of the transcript changes when verbal transcripts become visual transcripts. The article explores what ensures that a transcript is still a transcript and what happens to the reflexive interpretative strategy fundamental to EMCA when new digital technologies make it possible to incorporate images in transcripts. The article’s focus is on the social life of methods as well as methodological productivity showing how images can enact different social ‘realities’ and scientific knowledge.
Keywords
Introduction
More than 30 years have passed since Elinor Ochs (1999[1979]) problematized transcriptions in her widely read article ‘Transcription as theory’. The ‘newness’ of Ochs’ argument was that she took a reflexive approach to transcription conventions as researchers were gradually beginning to incorporate non-verbal aspects within their transcriptions. She was the first to argue that transcriptions of audio and video recordings are products of the researchers’ theoretical stances. In her article she also shows how transcriptions of social action are displayed from the top to the bottom of the page, how they run left to right and how non-verbal behaviour is described in a special column. She provocatively posits that transcriptions are the result of processes of choice undertaken by the researcher and that the researcher therefore needs to show more awareness and reflexivity when it comes to the choices that are made. Ochs argues against the then commonly practised realist approach where technical research devices, such as audio recorders, were seen as removing human agency from the research process – what has later been called ‘mechanical objectivity’ (Ambrosio, 2014).
Twenty years later in their article ‘Innocence and nostalgia in conversation analysis’ (2000), Malcolm Ashmore and Darren Reed worked in line with Ochs’ reflexive critique on transcriptions as neutral reflections of the studied event. They made a strong point in showing how the analytical object changes during the ‘stages’ from event, to tape and on to transcription and text, even pointing out the impossibility of ever returning to the actual event after having recorded it. This creates at least two significant tensions in the research process: first, between transcript and tape, where the latter often is treated as an epistemologically neutral analytical object; and second, between analyses of the transcripts and the transcripts per se, where they are considered epistemologically neutral analytical objects that the analyses are checked against. Their unpacking of the different phases in the research process, in much the same way as Ochs (1999[1979]), point to how transcriptions are products of choice. Even though both the transcription process and the transcriptions as such are the outcomes of rigorous work and focus on details, under Ashmore and Reed’s (2000) scrutiny, the process stands out as ontologically fluid, ambiguous and unstable.
New demands and challenges have arisen because the researcher has the possibility to create and shape data using visual digital technologies (Carusi et al., 2015). Image practices, as well as ways of seeing and observing material, introduce new visualization practices with the possibility, and need, to theoretically account for how research areas, such as the social sciences and humanities, spill into one another (Cartwright, 2015; Carusiet al., 2012; Carusi et al., 2015). If we see processes of choice in research as merged with technological/material possibilities and limitations, exploring how these technologies contribute to the scientization of research makes it obvious that they also have an effect on the transcribing practice (e.g. Mondada, 2007b; Ruppert et al., 2013). By taking on a reflective approach, we explore, unpack and describe the complex relation between knowledge production and ‘ontological politics’, which is about choices relating to how, whom and what are represented in research (Mol, 1999, 2002). We take Ochs (1999[1979]) and Ashmore and Reed’s (2000) explorative stance as our starting point in examining how the ethnomethodology and conversation analysis (EMCA) tradition draws on and merges images into the methodological convention of making transcriptions (see also Mol, 2002). Our aim is to reflect on how and if different methodological visualizing strategies influence the ontological politics of transcriptions: does it matter which images are used, how images relate to one another or to the verbal accounts in transcriptions, and to the video recordings they are generated from?
While we place the study within a critical approach, we start by broadly and briefly presenting earlier visual research traditions within the social sciences to situate our specific focus on EMCA. This is followed by a methodological presentation of the study and the choice of multimodal transcription examples from the EMCA tradition. We explore three different transcriptions made and transcribed by established EMCA researchers who conduct varied versions of what we call visual transcriptions. We want to make it clear that our focus is on the visual aspects of these particular transcriptions, not on multimodality and transcript as such, nor on the authors and their academic productions per se. As researchers, we have a dual position of being both inside and outside the EMCA field (similar to Ashmore and Reed, 2000). We both possess knowledge about transcription conventions from training and our own research – even though neither of us is firmly situated in the field – and combine this with our knowledge within the field of visual studies (e.g. Sparrman, 2005, 2015). Drawing on theories from Science and Technology Studies, we direct our attention to how transcriptions are turned into subjects of scientific inquiry (Cartwright, 2015; Carusi et al., 2012, 2015; Law, 2004; Mol, 1999, 2002; Ruppert et al., 2013; Savage, 2013).
Visual Research in the Social Sciences
Ever since Jacob Riis’ famous documentary photography book How the Other Half Lives (1980[1971]) was published in 1890, images have had a significant place in the social sciences. Riis’ photographs of the living conditions in the New York slums became important devices to argue for and establish new social interventions against poverty. It was also a call in the social sciences to approach and understand the social world through images, e.g. visual sociology, today entitled visual studies.
As mentioned above, with the rise of new visual digital technologies, images have become a significant research device and analytical object in all the social sciences (Carusi et al., 2015; Savage, 2013). Over the last 20 years, a plethora of visual-method handbooks has been published. Two of the early books were rooted in anthropology and ethnography (e.g. Banks, 2001; Emmison and Smith, 2000), while later handbooks cover the visual social sciences more generally and comprise authors from all over the research field (e.g. Margolis and Pauwels, 2011; Pink, 2012; Sidnell and Stivers, 2013; Stanczak, 2007; Van Leeuwen and Jewitt, 2001). 1 Most visual-method handbooks published during the last 5 to 10 years include a chapter on visual transcription conventions within EMCA (Ball and Smith, 2011; Forrester, 2011; Hindsmarsh and Tutt, 2012). A common denominator for all these publications is the how of making visual transcriptions, only a few of the texts reflect on the video camera as a cultural tool (see Forrester, 2011). Additionally, visual transcription practices are discussed in a wide range of articles in various academic journals and books (e.g. Ayass, 2015; Bezemer and Mavers, 2010; Jaffe, 2006; Laurier, 2014; Mondada, 2007a, 2007b).
In 1994, Charles Goodwin published the influential paper ‘Professional vision’ in which he includes pictures or frame grabs in transcriptions to illustrate how a particular way of seeing is learnt and cultured across two different sites: an archaeological field excavation and a criminal law case. In this article, Goodwin’s visual references point to discussions about visualization in the sciences, such as Donna Haraway’s Primate Vision (1992) and Mike Lynch and Steve Woolgar’s Representation in Scientific Practice (1990[1988]). Goodwin was one of the first to develop and reflect on what we call visual transcriptions within EMCA, and his work has been most influential. He has described his approach and strategies in the chapter Practices of Seeing Visual Analysis: An Ethnomethodological Approach (in Van Leeuwen and Jewitt, 2001). Modestly, Goodwin states in the text that: ‘When it comes to the transcription of visual phenomena we are at the very beginning of such a process’ (p. 160).
Visual resources such as images, diagrams, symbols and tables are well-known and often-used tools in research presentations. The multidisciplinary field of Science and Technology Studies (STS) 2 has a long tradition of critically investigating visual science practices and representations (Lynch and Woolgar, (1990[1988]), and visual technologies more specifically (Carusi et al., 2012, 2015; Coopmans et al., 2014; Pauwels, 2006). Lisa Cartwright (2015) argues that the way visual studies have informed science studies more generally is selective, as they mostly deal with scientific vision and objectivity. She points out that, just as in science studies, research on visual practices conducted by social scientists using cameras and videos tends to use visual technology in quite straightforward and non-reflexive ways even though a field like visual studies has extensive experience of research reflexivity.
Within STS, there is also a strong tradition, as Mike Savage (2013) expresses it, of scrutinizing the ‘social life of methods’. The focus is on the exploration of the social implications methods have for research topics, thus turning social science methods into ‘fascinating objects of inquiry’ (p. 5). At the vanguard of the tradition of methodological reflexivity is John Law’s (2004) work, After Method: Mess in Social Science Research, pressing for the productivity of methods by focusing on how they are assembled and how they mobilize research subjects (see also Ruppert et al., 2013). The core argument is that, as research methods – as well as research materials – are unstable units, methods can never be applied to empirical research in singular and predefined ways. This imprecision can tell us something about the topics we research (Law, 2004; Sparrman, 2014).
We take a reflective approach to the use of visuality in multimodal EMCA transcriptions by unpacking technological, methodological and representative aspects of visual transcriptions, and by examining the relation between the visual and scientific claims.
Methodological Starting Point
Researchers are always entangled with the topics they research, the methods they struggle with and the scientific research community they work within. To explore and investigate visual transcription conventions in the social sciences, we started out with a broad scope, examining handbooks, PhD dissertations and academic journals, such as Discourse & Society, Discourse Studies, Text and Talk, Visual Studies, Visual Communication, Research on Language and Social Interaction, and Journal of Pragmatics from 2000 to 2012. 3 The investigated articles span a wide set of image use, and we noticed that the use of images in transcriptions often occurred in studies of multimodality. We have identified photographic images extracted directly from video recordings, photographic frame grabs turned into line drawings, single images, series of images and images that have been manipulated by digital visual filters, combinations of frame grabs and drawings, comic drawings/plates and hybridization of speech bubbles in photographic frame grabs. The manifold ways of production and use of images in transcriptions make it possible to reflect on what the images accomplish rather than relying on a description of the different ways of doing visual transcriptions (for such a description of a selection of visual transcriptions, see Laurier, 2014).
In the present article, we examine three publications that position themselves within the EMCA field to show how different strategies are accomplished when presenting and analysing multimodal social interaction. The rationale for choosing EMCA articles has been that transcriptions are seen as representational practices, or more precisely as the way of (re)presenting data. Paul ten Have’s (2007: 32) argument is that EMCA transcriptions give readers a ‘kind of “independent access” to the data being analysed’. This independent access is what Ashmore and Reed (2000) call ‘analytical utility’. Consequently, the transcription process is a matter of research validity making the relation between transcriptions and analysis transparent. The second rationale for emphasizing publications focusing on multimodality in social interaction is that multimodal transcriptions involve multiple modalities, such as pointing, gestures and intonation for understanding social interaction (e.g. Goodwin, 2001; Mondada, 2007b).
We have selected three transcriptions from the following publications: ‘Action and embodiment within situated human interaction’ (Goodwin, 2000), ‘Lab work in science education: Instruction, inscription, and the practical achievement of understanding’ (Lindwall, 2008) and ‘Seeing through screens, hearing through speakers: Managing distant studio space in television control room interaction’ (Broth, 2009). The focus is on the use of images in these three specific publications and not, as pointed out earlier, on multimodality, transcript as such or the full academic authorships. The authors may have made claims or explanations in other publications that contradict the arguments put forward in the articles we have chosen.
When we now focus on the how and what of EMCA researchers’ ways of integrating images in transcriptions, we ask, inspired by Ochs (1999[1979]): Why are images merged into verbal transcriptions? What is at stake? How are choices being made and explained? What is the scientific stance for the visual transcription conventions? How do the images contribute to our understanding of a multimodal social world? Our reflective discussion on the transcriptions focuses on such details as the relation between images and images, images and words, coherency and image choices. We present the transcriptions in chronological order according to when they were published, focusing on their visual layout and analysis, and relate them to the aim and outcomes of each study.
Our larger methodological claim draws on the well-established idea that the social and material organization of research matters when it comes to the production of both methods and scientific knowledge that lead to different ontological outcomes (e.g. Latour and Woolgar, 1986; Law, 2004; Savage, 2013). Our concern is where, when and by whom are decisions made, especially if there are other versions or multiple possible options, and whom or what is being represented in knowledge practices, i.e. which version of ‘reality’ is sustained by whom and what? Thus, we also approach visual transcriptions as results of ontological politics (Mol, 1999), an approach that makes it possible to highlight and examine the politics that upholds different versions of visual transcriptions, as well as the methodological considerations that are made and enacted by different researchers.
Visual Layouts of Three Transcription Examples
Our analyses start by exploring what has been called the ‘see-able’ representation of lived events and recordings. We refer to the ‘look’ of the transcriptions published in journals that open them for re-analyses for both authors and readers (see Ashmore and Reed, 2000). The three examples represent different strategies for including visual and verbal accounts. The transcriptions are also seen as methodological assemblages (Law, 2004) consisting of multiple entities, such as speech, images, the original recordings, information about the practices under study, and conventions for transcribing and theoretical ideas about transcription procedures.
Example 1
The first transcription is from Charles Goodwin’s (2000) work on multimodality ‘Action and embodiment within situated human interaction’. Goodwin’s aim is to show how a number of different semiotic resources – such as spoken language, gestures and postures – are to be taken into account to describe and comprise what constitutes a dispute (p. 1494). He points out how social organization of a dispute is accomplished through the interplay of different modalities.
The transcription per se is set up with a combination of the original Spanish talk, its English translation, three line drawings, of which two are based on frame grabs from video recordings of the activity showing the girls involved in the dispute, and an illustration of a numbered hopscotch grid at the right-hand top of the transcription. The drawings give us no background information, for instance they do not place the activity on a street or a schoolyard. Rather, we are given a selective or even a restrictive contextualization in the sense that the background is erased while the hopscotch grid at the top left, and the right-hand drawings are inserted as contextual information. The reading of the transcription follows a logic whereby the gaze moves top–down, right to left and diagonally across it (see Figure 1a).
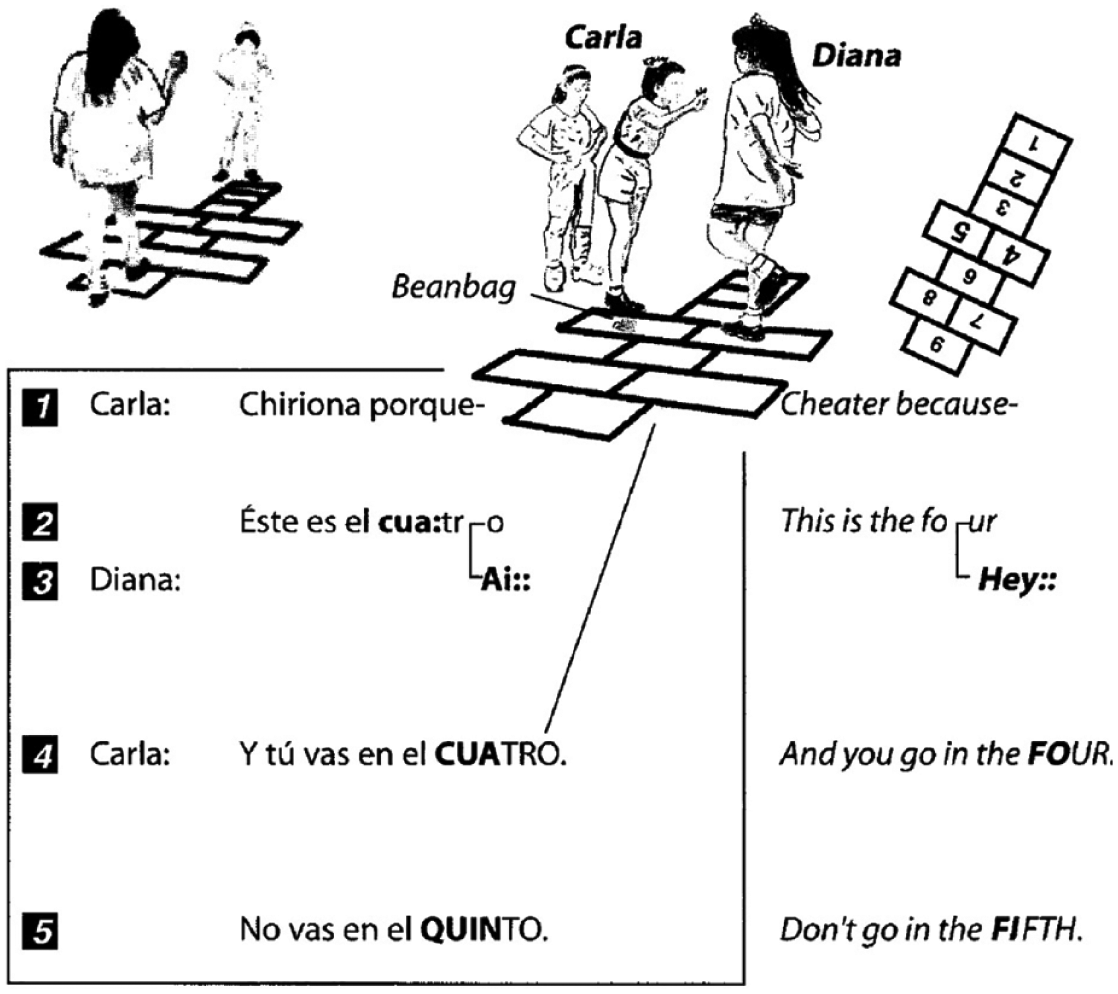
Transcription of the use of multimodal resources during a dispute. Source: Goodwin (2000a: 1494)
The transcription is divided into two spaces with the help of thin lines, creating – even though the transcription is open to the side – an inside and outside. The original Spanish transcribed speech is inside the square, that is inside the transcription. One of the line drawings breaks the lined boundary and pushes into the square with an attached line indicating which verbal account it relates to. The image shows how Carla stretches out an arm towards Diana, a movement highlighted later on in the text as seen below in Figure 1b.
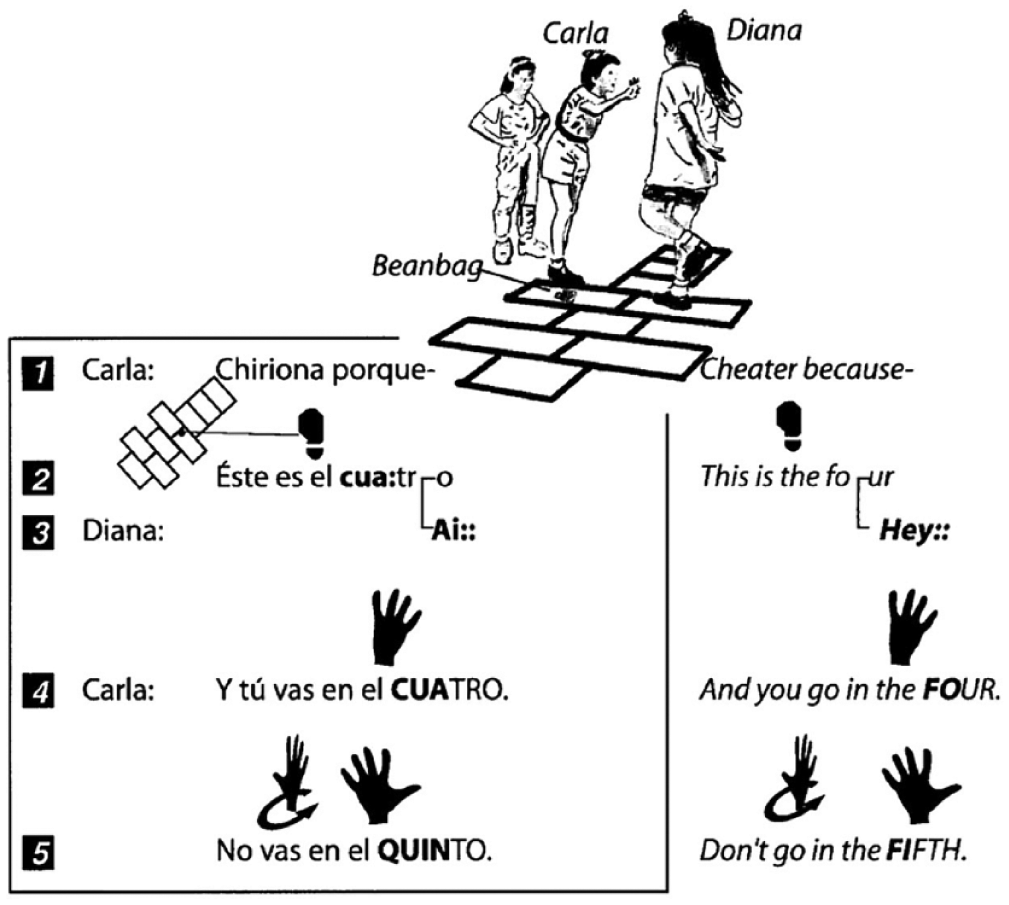
Hand highlights. Source: Goodwin (2000: 1497)
This is what we call a deepened or highlighted transcription, illustrating ‘points’, or critical ‘places’, where the girls’ visual detailed communicative resources are shown to put emphasis on how gestures are used in the conflict (Goodwin, 2000: 1497). A visual, somewhat nearly invisible detail from Figure 1a is re-worked here by focusing on a bodily detail of the conversation. The hand symbol used in the transcription does not look like a frame grab from the recording. Rather, it looks like a digitally pre-made accessed symbol, perhaps inspired by detailed hand movements, with arrows showing directions as is common in visual sign language transcriptions (e.g. Paabo et al., 2009). It is not quite clear if Carla in the original line drawing is showing any fingers. Goodwin’s emphasis of the hands, however, clarifies this point. Both the Spanish and English verbal accounts contain hand symbols, this time without line indicators drawn between frame grabs and speech. It is clear, though, that the lines have multiple purposes in the transcription: indicating borders, pointers/indicators and/or overlapping talk.
The supply of explanatory transcription conventions is to some degree standardized to texts within the conversation analysis (CA) tradition. However, Goodwin’s text lacks a key to the adapted transcription conventions. We argue that this implies either that there is no preferred way of reading and interpreting the transcription or that Goodwin takes for granted that his readers are comfortable with and recognize his way of presenting his material by following his explanations in the text.
Example 2
Oskar Lindwall’s (2008) article ‘Organizing time and space’ depicts ‘the social interaction in ways that maintain the temporal unfolding of the activity, the semiotic resources that they [authors: pupils] use in their interpretative work, and the visual display to which they orient’ (p. 117). The focus of the analysis is on the visual and material interaction of two young men trying to understand a graph on the computer in a science lab. Lindwall’s transcription strategy is to turn his video recordings into time-series images, as in a comic strip, to make it possible to focus on and visualize temporality and the activities of the young men. Lindwall uses visual well-established comic-strip conventions and grammar in his transcription: a time-series described by movements from panel to panel (and within panels), speech bubbles, separation by gutters, and what looks like hand drawings even though they are digital products made out of frame grabs from video recordings. Each panel has an episode number followed by numbers from one to seven to be read horizontally from left to right and then top–down. Lindwall describes that the interaction is taking place in a lab. The visual background/contextual information is erased, which strengthens the general two-dimensionality of comic strips and written verbal accounts. The blanks are used to visually highlight temporality through the insertion of horizontal motion lines around the moving bodies in panels 4.2–4.4. 4 We cannot clearly see, however, as pointed out by Eric Laurier (2014), when an overlap or interruption in speech begins and ends; what we do see is that two young men stand next to and talk with one another (panel 4.7). Looking at what is said, it is possible to understand the speech order based on comments and answers as, for example, in panel 4.6. To understand that an interruption is taking place, the insertion of extra information becomes important – information, which in Ochs’ (1999[1979]) terms, creates a new transcription column, but which in the comic strip is presented as an action box (panels 4.6 and 4.7) (see Figure 2).
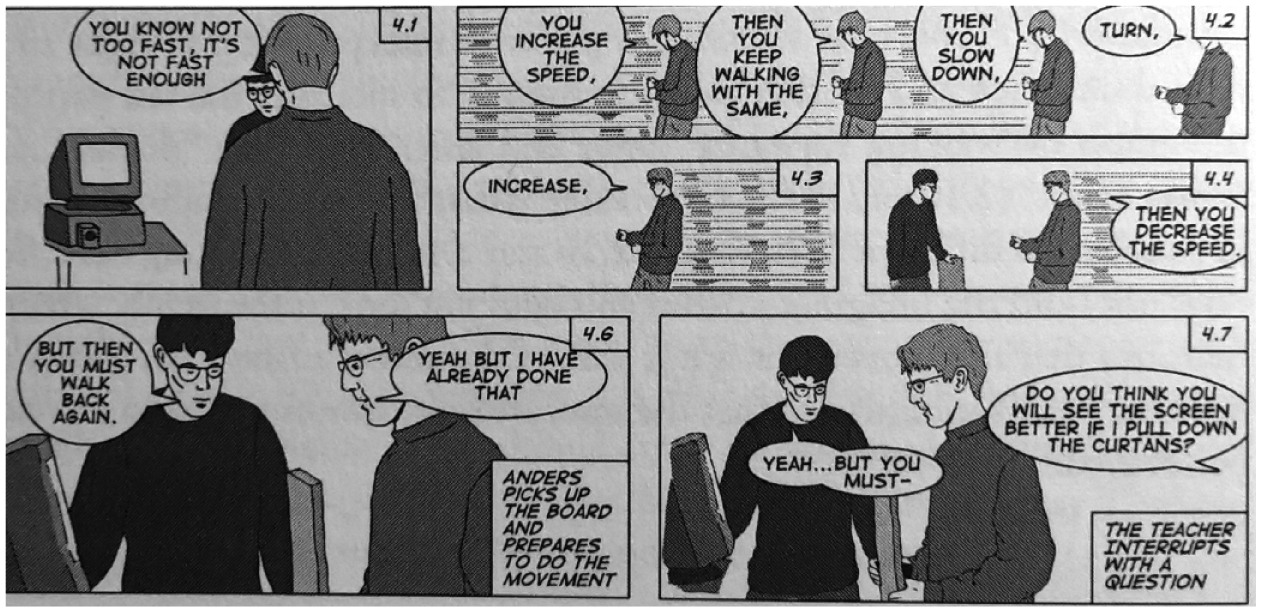
Transcription of multimodal interaction in a laboratory. Source: Lindwall (2008: 122).
To appreciate what we call a comic transcription, the reader needs to master the visual language of comics. As pointed out by Laurier (2014), comics have visual commands for whispering, shouting, inhaling and exhaling. Aspects such as jagged lines around the speech bubbles or ‘cat’s whiskers’ make it possible in some ways to adhere to EMCA transcription standards by not making up a private language but latching onto a culturally known common visual rhetoric (Haberland and Mortensen, 2009).
It is important to note that Lindwall (2008) does not provide a transcription convention key to explain how to read the transcription. We find that this implies that Lindwall takes for granted that the readers are comic-book literate. Even though the comic transcriptions look like comic strips, in this case they are situated in a scientific research practice and therefore offer and argue something more than being looked at as plain comics. While Lindwall fails to provide a transcription key, he is careful to mention that the transcriptions are indexical surfaces that point back to the video from which follows loss of information and knowledge. With a ‘comic transcription’, Lindwall argues, the information loss is no different from the more traditional transcription conventions within EMCA, as all transcriptions lack information.
Example 3
The last example is from Mathias Broth’s (2009) article ‘Seeing through screens, hearing through speakers: Managing distant studio space in television control room interaction’. Broth investigates how a French television control room is organized so the right person is on the air at the right time in a live TV show. His aim is to show how ‘the participants in the control room achieve a common understanding of, and deal with, locally relevant aspects in the distant studio space from screens and loudspeakers in the control room’ (p. 1999). The transcription, covering a full journal page, opens up towards the page lacking visual boundaries and is read like a traditional book page, top–down from left to right. The inserted images are merged into the transcription following an EMCA approach of seeing social interaction as sequentially organized in terms of turn-taking; that is, making it possible to read the verbal as well as camera movements reflexively, letting each ‘utterance’ provide an answer to what has happened earlier in the interaction.
The still photographs are frame grabs taken straight from the video recordings without any significant alterations, such as turning them into line drawings. The transcription utilizes two types of images: first, frame grabs from Broth’s own recordings of the interactions in the control room, and second, frame grabs from recording the TV monitors in the control room to highlight what is taking place in the TV studio. The inserted images show a temporal unfolding, which slows down the movements and shows how the images are part of the interactional activity between director, camera men and cameras. The first collection of pictures (line 130) shows what is called a ‘bank of screens’, displaying what the five TV cameras in the studio are recording. The next series of pictures that appears after line 138 shows how camera and camera man number three react to the instructions given by the director in the control room. There are three similar visual series from camera three in the transcription displaying the interaction between the camera man and director. Grids (#) are used to indicate at which point in the time line the pictures have been taken and where the images should be read in, a strategy also used, for example, by Mondada (2012) in her visual transcriptions with sequential order.
Language has also been distinguished visually. To differentiate between which talk is going on in the control room, the TV-studio talk is in grey while the control-room talk is in black. The original language, French, is directly translated into English just below the French text.
In this way, Broth’s first four lines in the transcription challenge the reader to keep in mind that these actions more or less take place at the same time while spatially situated in different places. The banks of screens seen in line 130 display what camera three and four (Ca3 and Ca4) record in the control room and should be read into the utterance where the # symbol can be seen. The utterance in line 130 is a verbal account made in the studio while the utterance in line 133 captures what is said in the control room. 5 To understand the complexity of the situation, the reader also needs to grasp that the camera actions in lines 131 and 132 should be read concurrently into the utterance at the # symbol in line 133.
Broth (2009) supplies transcription conventions describing how to read the interaction and the use of the pictures in the transcription at the end of his article. Thus, he also acknowledges that reading transcriptions demands special knowledge for understanding his ‘transcription tools’. Even though both of us are knowledgeable in reading transcriptions, it has been time consuming to decipher the instructions as well as the transcription. The complex logic of the transcription makes it difficult to easily return to the transcript after some time lapse without re-starting the interpreting procedure from the beginning all over again. Broth has increased verbal, material and visual details in the transcription to capture and display the complexity of the social and material interactive procedures of the television control room. We are not sure, however, whether the increase in details leads to a deeper understanding of what is going on. The photographs in the transcription vary in size from small to very small, making the see-ability of the images difficult. The increase in details even raises questions about the analytic utility (see Ashmore and Reed, 2009), as the miniature size of the photos counteracts the purpose of contributing transparency and complex understandings beyond personal judgements of the event (e.g. Pauwels, 2005). The purpose of the transcript, to capture multimodal interaction, is not questionable, the problem is the anachronistic realism (see Cartwright, 2015) deployed in relation to the images. The photographs seem to be used as examples of synecdoche, letting the reader know that reality is much more complex than what can be shown, what we see is just the tip of the iceberg.
Visual Transcription as a Process and Product of Choice
All three examples focus on multimodality. Goodwin (2001) focuses on multimodal semiotic resources in human interaction, Lindwall (2008) explores multimodal resources and temporality in understanding a computer graph and Broth (2009) investigates how a common and shared understanding is achieved in a multi-complex situation by using and drawing on multimodal resources. The analytic unit in the examples thus involves such semiotic resources as gaze, sound, bodily conduct, prosody, visual orientation and material objects. Another shared commonality is the concern for social actions in terms of public visibility, the public performance and see-ability by others. We will return to this issue after exploring the scientific knowledge production generated through the visual methodological choices made by the three authors (see Ochs, 1999[1979]). A video recording per se is the result of multiple choices made by researchers. It includes the angle of the video camera, the lighting conditions, how the camera cuts into or out of lived practices (what is and is not included?) and from whose point of view the video recording is capturing the practice (e.g. Heath et al., 2010; Lomax and Casey, 1998; Sparrman, 2005). Consequently, video-recorded ‘cuts’ are political actions of choice with significance for what can and cannot later be seen in the transcriptions. In this sense, the recording comprises a delimited highly focused cut of ‘reality’ (see also Haberland and Mortensen, 2016).
All the above three examples have processed the frame grabs from the video recordings. They are transformed into line drawings and contextual information is doubly reduced: first, from the recorded event and, second, through the video-recorded frame grabs (Figures 1 and 2). The size of the images is reduced so they fit into the transcription traditions (Figure 3) and certain aspects of the images are enlarged to highlight and increase the see-ability of analytical points (Figure 1) (see Sparrman, 2005, for a discussion on the presentation of video-recorded images). No matter how the images are altered, the process suggests a continuous loss of details from recording to frame grabs and to the final processed images inserted in the transcriptions (Ashmore and Reed, 2000). The purpose of both increasing and decreasing the visual details is to make convincing arguments. When Goodwin (2001) and Lindwall (2008) decrease the visual information in their drawings, they omit contextual information to draw particular attention to embodied actions, while Broth’s (2009) increase of details aims at conveying the situated complexity. The process of increasing and decreasing visual details in itself visualizes how transcriptions are products of choice.
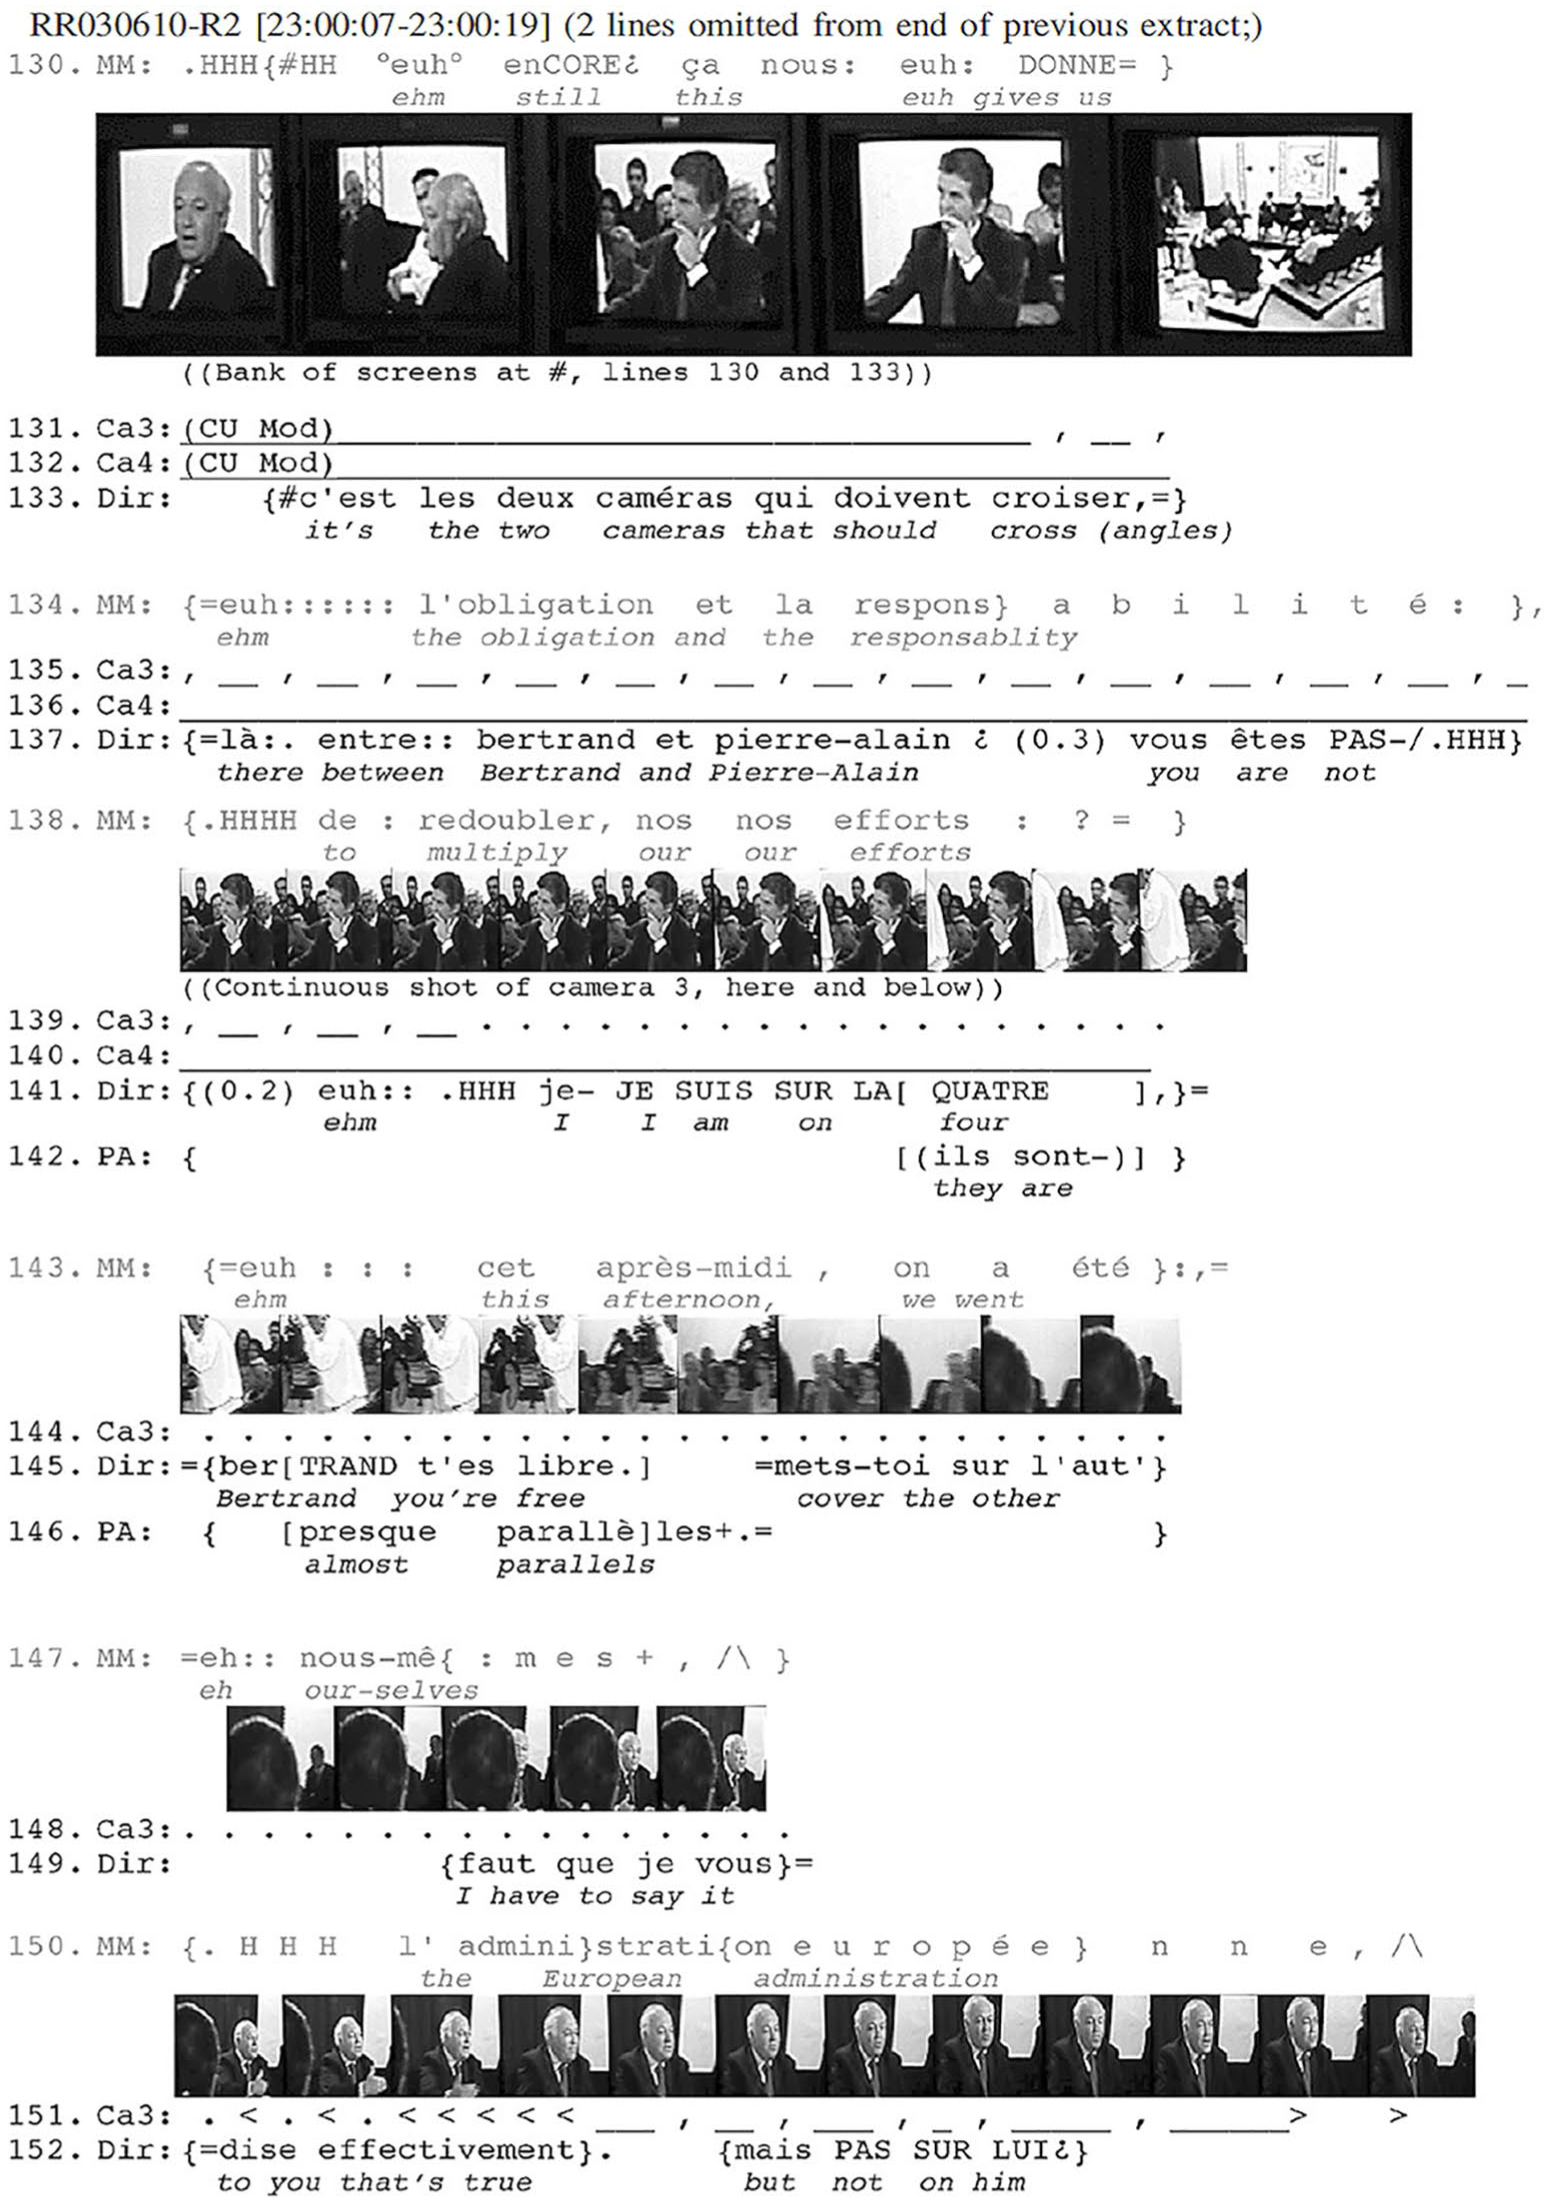
Transcription of multimodal TV studio interaction/communication. Source. Broth (2009: 2012).
Not only the video recordings but also the frame grabbing and extracting processes are the results of multiple choices made by the researcher. None of the three analysed examples offer reflexive methodological accounts on choice; they lack methodological information about the conditions under which the research material has been produced (Rose, 2012). The process seems to follow what Rose calls an ‘implicit methodology’ (p. 547) based on connoisseurship favouring a taken for granted-ness which keeps to the essentialism of the ‘naked’ knowing eye (Rogoff, 1998), rather than the trained and skilled professional vision suggested by Goodwin (1994).
Even though the examples are rooted in the same theoretical and methodological traditions, the use of images in the transcriptions differs strongly. Following Ashmore and Reed’s (2000) description of the transcription process from tape to text, a similar account can be made in relation to the visual transformation process of transcriptions. Ashmore and Reed state that, for them, audio and video recordings have the same status. What they fail to acknowledge, however, is that images, like video recordings, have visual qualities involving seeing, see-ability, gazes and looks which distinguish the visual from the spoken/heard words (see Mitchell, 1994). Subsequently, the visual opens for a slightly different ontological politics of the transcription in the sense that different versions of reality are produced and maintained by, or with the help of how images are merged with the verbal accounts, what the images show and how the images themselves look.
The three examples visualize the content of the video recordings quite differently. For one thing, they use different ways of merging images with the speech acts. In Figure 1, Goodwin (2001) makes frame grabs using imaging technologies to extract still frames and turn them into line drawings. In Figure 2, Lindwall (2008) follows the line drawing approach but turns his frame grab drawings into comic strips to be read as visual temporal durational narratives. The hybridity of the comic transcription, as argued by Laurier (2014: 240), offers a more-than-sequential reading, which opens for a more uncertain, tangential and contingent transcription. Comic transcriptions, however, are not only a visual narrative; they are also a ‘creation of records of events’. In Figure 3, Broth (2009) uses a similar narrative strategy as Lindwall (2008) by presenting frame grabs in a narrative order. By placing still images tightly one after the other, with hardly any noticeable changes between them, he visualizes temporal (camera) motions. Because they want to show actions over time, Figures 2 and 3 differ from Figure 1, which has a stronger focus on contemporaneity.
There is also a difference between using drawings and photographic frame grabs in the transcriptions. Drawings make it more obvious they are processed products of choice while the photographic images tend to fall into the category of claiming more realist accounts: This is what it looked like! This is what happened! At the same time, as strongly argued within EMCA, photographic images offer contextual information that opens for readers to make their own interpretations of the situation. However, the images in Figure 3 need to offer better see-ability if the reader is to make independent interpretations. What is made see-able or not in visual transcriptions are the outcomes of choices made by the researcher.
The Ontological Practice of Visualizing
Ashmore and Reed (2000) remind us that it is never possible to return to the recorded (‘real world’) event after the video recording is complete. The video recording, just like the audio-tape, is the main data source against which everything in the transcription should and can be checked. This is why the video recording has a tendency to be approached as an epistemologically neutral analytical object and why also photographic frame grabs might fall into the category of making or being perceived as making realist claims. Documentary photography, which the video recordings to some extent are, always struggles with the idea of photographic images as evidence of an event/action. Or as Cartwright (2015: 255) puts it: ‘The static frame is a record of an increment of marked time toward the always hoped-for appearance of the real that representations guarantee but don’t deliver in any fullness of being.’
A visual ontological politics is then about how we single out images, how we choose to present images, how we present them, how we look at and scrutinize them, how the visual is merged with the verbal and, finally, about the reflexive approach to this process. By openly displaying choices, the reader is given help to understand the different versions of realities enacted by the authors making it possible to re-interpret the claims that are being made.
This displaying of choices also opens thoughts about the relation between the visual and the verbal. Are the same things at stake in the verbal and the visual accounts of the three transcription examples? In other words, is it possible that the verbal and the visual contradict rather than confirm one another? If we look, for example, at the dispute in Figure 1: do Carla’s finger and hand movements emphasize the verbal dispute and, if so, how can we see that? Or might they be doing altogether different things? Are the hand movements explaining while the verbal accounts are correcting, or are the hand motions so emotionally acted that we are witnessing a possible, on the verge, bodily encounter of tangible physical conflict? We can see that Carla uses her hand and fingers as resources, but do we actually see in what ways they are used? We are not on a micro-analytic scale of seeing what is in a hand movement as the video recording is not a close-up of the action.
Our aim is not to answer these questions, rather we have posed them to highlight that the images across the three examples are approached neither as independent nor as equal resources for the verbal accounts. Let us undertake a simple thought experiment. When reading/looking through the analyses of the three examples we asked: Could these analyses be made without the images in the transcriptions? Our answer is, possibly yes. Could the same analyses be made without the verbal accounts? Our answer is, certainly not.
We argue that the transcribed images strengthen the verbal accounts, or even more strongly, validate language. The way the images are used as illustrations and pointers – with a lack of see-ability and as strategies for emphasizing certain aspects in the interaction – reduces contextual information. The aim is to capture the whole situation to present as coherent an argument as possible by omitting potential contradictions between the visual and the verbal. This is in line with Ochs’ (1999[1979]) reflection that, even if in the late 1970s there was great interest in the non-verbal strategies in interaction, the verbal aspect was still predominant. Our argument is that EMCA multimodal visual transcriptions also come with a bias for the verbal (see Ten Have, 2007).
To summarize, even though new visual technologies have facilitated the possibilities for using and visually displaying non-verbal accounts. even more, to include images in transcriptions, little attention is paid to what the visual aspects of visual transcriptions accomplish for the larger research argument. In that sense, it is not just example 3 that uses the images realistically, but all of the examples do. The three examples have as their point of departure the verbal accounts and actions, merging the images into the transcriptions to make them analytically usable and the analytical conclusions evidential and communicable for the reader (see Ashmore and Reed, 2000). The images are thus used as visual evidence. The lack of reflexive choices identified in relation to the examples presents the transcriptions as performances of realism. The outcome of the versions of reality produced by the final published visual transcriptions hence presents, upholds and sustains certain visual versions of ‘reality’ (Mol, 1999). Other ways of processing and cultivating the images would accordingly perform other realities.
Images need the same scientific scrutiny as any other research material (Cartwright, 2015; Lynch and Woolgar, 1990[1988]; Rose, 2012, 2016). The multiple choices made by researchers when conducting visual recordings and extracting frame grabs from the recordings are crucial to understanding how visual transcriptions are ‘made up’, as well as to understanding them as scientific knowledge-producing objects (Mol, 1999). In conclusion, we find it somewhat surprising that all three figures leave behind the thorough and detailed reflexive analytic strategies worked out in relation to talk and interaction when images come into the picture.
Last reflections
We have presented a critical approach to inquire and reflect on how images are used to produce scientific content for analyses, what we have called the visual transcriptions method within the multimodal EMCA tradition. As visual digital technologies are used both to produce and present scientific knowledge today, the methods involved in these processes are a key part of ongoing scientific social and cultural debates. Arguing that methods are the very stuff of making and enacting our understandings of social life has ontological and political consequences (Law, 2004; Rose, 2012; Ruppert et al., 2013; Savage, 2013).
By exploring the visual transcriptions as methodological socio-technical assemblages, it has been possible to discuss and reflect on the ontological practice of visual transcriptions. As stated at the beginning of this article, new visual technologies create new possibilities for visualizing content and knowledge. The question is: Do visual transcriptions generate new or different knowledge from predominantly verbal transcriptions? Video recording is not new to EMCA, it has been around for at least 30 years, and has been more the rule than the exception in the field. Digital technology for processing the recorded material also offers new ways of presenting the video-recorded events. Still, we argue, visual transcriptions are socio-technical assemblages made with the help of new technologies while still contributing more or less the same kind of thinking and knowledge. Instead of taking into consideration the instability of the method, letting the imprecision of it tell the researcher and the readers something about the topic being explored, visual transcriptions mobilize scientific coherency and evidential realism. Mol (2002) has argued that social science has an irresistible desire and a long unchallenged tradition to create coherency and singularity even when social aspects emerge as complex. So, even if the purpose is to understand social interaction as multimodal, the outcome is that visual transcriptions seem to aim at becoming ‘truer’ to life, striving, in other words, to make the world hang together as ‘one’, strangely enough, both through the decrease and increase in visual details.
Visual transcriptions are methodological assemblages mobilizing and performing the social world while simultaneously producing one image among many of ‘reality’ (Law, 2004; Mol, 1999, 2002; Ruppert et al., 2013; Savage, 2013). We argue that a ‘taken for granted-ness’ of visual information is performed, leaving images to ‘talk for themselves’ as documentary neutral evidence of events and actions (Cartwright, 2015; Carusi et al., 2015; Rose, 2012). The analyses of the merging of the images do not highlight how difficult and unruly social actions and interactions are.
Working with visual reflexivity involves acknowledging that visual transcriptions act as both the seer and the seen (Rose, 2012: 550). All the way through the visual transcription process, to the multiple choices made when conducting video recordings of an event, to placing the visual transcription on a journal page for the reader who is looking at and interpreting the transcription. We do not argue that visual transcription conventions should be universalized, but we do argue for making implicit methodological processes of visual choices explicit, as well as reflecting on cultural notions of images, such as photography as evidence, or the cultural values of comic strips; that is, reflecting on the image’s possibilities and limitations. On this point, we find it would be fruitful in the future to work in an interdisciplinary manner, combining more from visual studies, STS and EMCA.
Footnotes
Acknowledgements
We would like to thank the reviewers for their careful reading of the text and their constructive feedback. We also owe our thanks to our critical readers Helen Melander and Steve Woolgar who helped us out with an early draft when we were still fumbling in the dark. However, as authors, we are solely responsible for possible shortcomings.
Funding
This research received no specific grant from any funding agency in the public, commercial, or not-for-profit sectors and there is no conflict of interest.
Notes
Biographical Notes
PÅL AARSAND is Professor in the Department of Education and Lifelong Learning, Norwegian University of Science and Technology (NTNU), Trondheim, Norway. His research concerns children’s use of digital media across sites with a particular interest in media literacies, identities, play and game play in interaction. He is also interested in methodological challenges and ethical dilemmas in discourse analytical and ethnographic research with children.
Address: Department of Education and Lifelong Learning, Norwegian University of Science and Technology, N-7491 Trondheim, Norway. [email:
ANNA SPARRMAN is a Professor in the Department of Thematic Studies – Child Studies, Linköping University, Sweden. Her research focuses on visual culture, visual studies, child consumption, child culture and child sexuality, with a special interest in visual ethnography and visual research methods. Her interest in the productivity of research methods and what methodological dilemmas can tell us about the topics we are researching is, for example, highlighted in her co-authored articles: ‘The active, competent child, capable of autonomous action: An inherent quality or the outcome of a research process?’ (AnthropoChildren 2015) and ‘Access and gatekeeping in researching children’s sexuality: Mess in ethics and methods’ (Sexuality & Culture 2014).
Address: Linköping University, Department of Thematic Studies – Child Studies, SE-581 83 Linköping, Sweden. [email: