
Abstract
This article proposes a mixed-method framework for multimodal semiotic content analysis that systematically integrates qualitative semiotic coding with quantitative large-scale data analysis. Building on earlier frameworks by Bell and Milic (‘Goffman’s gender advertisements revisited: combining content analysis with semiotic analysis’, in Visual Communication, 2002) and Serafini and Reid (‘Multimodal content analysis: expanding analytical approaches to content analysis’, in Visual Communication, 2023), the authors propose a more empirically rigorous method to conduct quantitative analysis. They highlight the limitation of frequency counts through percentage comparisons and advocate for using proper statistical methods for identifying meaningful co-patterning of semiotic resources. Their approach also emphasizes the importance of transparent coding practices, detailed codebooks, pilot coding and intercoder reliability testing to enhance replicability and validity. The framework is illustrated through a case study of 277 depression-related internet memes. Results reveal significant associations across depression themes and semiotic resources of process types and social interaction, highlighting recurring communicative strategies such as infographical, emotional, dialogical and suicidal gaze memes. By demonstrating how multimodal choices co-pattern to construct meaning, this framework offers a practical, statistically grounded method for analysing complex visual and textual datasets beyond descriptive counts.
Keywords
Introduction: Beyond Comparing Percentages Through Frequency Counts
The widespread availability and variety of digital annotation tools has made the annotation of large-scale multimodal data – such as images, videos and interactive content – increasingly manageable. Researchers working with such data are often interested in testing hypotheses about generalizable phenomena in multimodal communication. However, they frequently encounter challenges in how to systematically code, analyse and interpret such complex datasets.
Previous multimodal studies that employ quantitative approaches have often focused on frequency counts. These typically involve comparing percentages of multimodal categories observed within a given dataset. While comparing percentages is useful for summarizing surface-level patterns, it is limited in its ability to provide statistically significant evaluation of category differences when the frequency differences are not intuitively interpretable. Neither can it support robust hypothesis testing or make inferences beyond the observed sample. Relying solely on percentage comparisons to judge the association and differences between categories/variables can lead to misinterpretation, especially when statistical significance is not properly established.
In other words, counting frequencies through percentages is insufficient when the research goal is to explain statistically supported differences or relationships between variables (for instance, categories coded based on semiotic theories). Without testing of inferential statistics, frequency comparisons often lead to false claims of result – judging differences based on percentages is highly risky and biased because the percentage differences are often caused by unevenly distributed categories in the data. Hence, to rigorously test hypotheses about multimodal communication phenomena – especially those grounded in multimodal semiotics or social semiotics (Bateman et al. 2017; Kress and Van Leeuwen, 2021) – researchers need broader quantitative and statistical methods, such as inferential statistical methods, for identifying patterns for examining relationships between variables, testing significance and for generalizing findings beyond the sample. This is particularly crucial in multimodal research involving large datasets, where the complexity of the data demands analytical precision.
Despite the established role of inferential or exploratory statistical methods in many social science disciplines, they remain under-utilized in multimodality research and semiotic analysis which aim to deal with larger amounts of data quantitatively. One reason for this is that inferential statistics often require foundational knowledge of data science and mathematics, such as probability, common distribution, etc. – areas not typically covered in humanities-based training.
The aim of this article is to provide an accessible entry point for multimodality scholars – particularly researchers from humanities or social semiotic traditions – who wish to move beyond basic frequency and percentage comparisons. It introduces an approach to multimodal content analysis that incorporates both semiotic insights and robust statistical exploration and testing. More specifically, this article contributes by:
Clarifying the principles of multimodal content analysis, building on prior seminal works in the field (Bell and Milic, 2002; Serafini and Reid, 2023), and proposing a more integrative framework that combines qualitative semiotic analysis with inferential statistics for hypothesis testing and identifying patterns in multimodal datasets.
Demonstrating this approach in practice by analysing a large-scale social media dataset, with a focus on how multimodal features contribute to particular communicative strategies.
With these aims in mind, the remainder of the article is structured as follows: Section 2 first problematizes the conventional divide of qualitative and quantitative content analysis. The section then outlines previous approaches to multimodal content analysis, situating our proposal within current research. Section 3 presents step-by-step procedures for conducting a comprehensive multimodal semiotic content analysis, from research design and hypothesis testing to the construction of communication strategies. This section also explicitly implements each step of the framework to analyse internet memes. Section 4 proposes further research directions where this approach can apply.
Revisiting Multimodal Content Analysis
This section first evaluates the legitimacy of maintaining a sharp boundary between quantitative and qualitative content analysis, focusing on their often-asserted epistemological and methodological contrasts. Drawing on Krippendorff’s theory, we argue that multimodal content analysis is inherently a mixed-method. We will then review the frameworks by Bell and Milic (2002) and by Serafini and Reid (2023), respectively, the two influential methodological frameworks for multimodal content analysis which this article builds on. Finally, this section reviews several quantitative studies of multimodal communication that deal with large multimodal corpora using inferential statistics.
Problematizing the divide of quantitative and qualitative approaches in multimodal content analysis
In social sciences, the epistemological differences between quantitative and qualitative research are often taken for granted. On the one hand, quantitative inquiry is assumed to typically rest on (post)positivist assumptions that reality is objective and measurable, seeks generalizable explanations and prioritizes reliability, validity and replicability. On the other hand, qualitative inquiry aligns with interpretivist/constructivist views that knowledge is context-bound and co-constructed, privileging depth, meaning, reflexivity and credibility/transferability over statistical generalization (Denzin and Lincoln, 2011).
In content analysis specifically, however, the boundary between these approaches is increasingly questioned. As Krippendorff (2004) points out: I question the validity and usefulness of the distinction between quantitative and qualitative content analyses. Ultimately, all reading of texts is qualitative, even when certain characteristics of a text are later converted into numbers. The fact that computers process great volumes of text in a very short time does not take away from the qualitative nature of their algorithms: On the most basic level, they recognize zeros and ones and change them, proceeding one step at a time. (p. 16) The quantitative/qualitative distinction is a mistaken dichotomy between the two kinds of justifications of content analysis designs: the explicitness and objectivity of scientific data processing on the one side and the appropriateness of the procedures used relative to a chosen context on the other. For the analysis of texts, both are indispensable. (p. 87)
While qualitative scholars often emphasize that text analysis is an interpretive act rather than an objective discovery of facts, both quantitative and qualitative multimodal content analysts follow a series of shared steps. They begin from explicit research questions and assemble a corpus of multimodal artefacts that they justify as relevant. They then unitize – segmenting complex artefacts into analytically meaningful units – before selecting concrete examples to demonstrate claims, all the while situating interpretations in the context of use and culture.
Recognizing this common analytical process clarifies the mutual dependencies between quantitative and qualitative methods. Quantitative multimodal researchers rely on hermeneutic work to define, refine and contrast categories prior to counting – and again to interpret results after counting. Conversely, qualitative researchers who work with larger corpora benefit from clearly specified procedures that enhance transparency and support the transferability of results (Lincoln and Guba, 2006). Echoing Krippendorff, we argue that multimodal content analysis is best understood as inherently mixed-method: quantitative approaches require interpretive acts in determining multimodal units, selecting examples and contextualizing results, whereas qualitative approaches require consistent, well-defined procedures and standards when scaling up.
This article builds on two seminal contributions to multimodal content analysis: a qualitative framework by Serafini and Reid (2023) and a quantitative approach by Bell and Milic (2002). Both offer valuable guidance for systematic analysis of visual imagery, yet leave room for further development in analytical depth – particularly in relation to statistical inference and coding transparency – which we address in the next subsections.
Bell and Milic (2002): combining content analysis with semiotic analysis
Bell and Milic (2002) present a methodological approach that combines quantitative content analysis with visual semiotic analysis. Their study revisits Goffman’s (1979[1976]) seminal work, Gender Advertisements and operationalizes his propositions about gendered visual representation using the semiotic framework of Kress and Van Leeuwen (2021). Their dataset comprises 827 magazine advertisements, which they analyse to test eight hypotheses concerning gender representations across various visual dimensions.
These dimensions include conceptual and narrative process types, social distance (operationalized as shot size), power (operationalized as camera angle), composition, gaze direction and modality. For example, the authors hypothesize that:
In their analysis, Bell and Milic coded the gender of main characters alongside values in eight semiotic categories. The authors relied primarily on frequency counts and percentage comparisons to interpret the presence of gendered patterns. Among their findings: women were more frequently depicted in conceptual roles, while men were more often shown as actors; women more frequently gazed at the viewer, suggesting an image-act demanding relational engagement.
While many comparisons reveal pronounced gender differences, some results are more difficult to interpret. For example, they state that ‘female groups were slightly more likely to be shot from above’ (our emphasis, p216), and that although ‘differences are not great’, men were more often portrayed at a public distance. Similarly, modality differences were described by the authors as not strongly marked by gender (our emphasis p. 217). Ambiguous interpretations of this kind are commonly seen in several multimodal quantitative studies relying on comparing percentages of frequency counts. This highlights a critical limitation: the lack of inferential statistical analysis. Without statistical tests (such as chi-squared tests, etc), it is often unclear whether observed differences are statistically significant or merely random variations. When the differences in the percentages of variables are not evidently divergent, it is challenging to interpret that difference intuitively. Terms such as ‘more likely’ or ‘not great’ remain vague without empirical thresholds for significance.
Despite this limitation, Bell and Milic’s framework represents an important milestone for semiotics-based quantitative study. The current article builds on this foundation by incorporating inferential statistical techniques and offering clearer operational definitions and coding procedures, thereby advancing the methodological strength of multimodal content analysis.
Serafini and Reid (2023): qualitative Multimodal Content Analysis
Serafini and Reid (2023) introduce Multimodal Content Analysis (MMCA) as a qualitative adaptation of traditional content analysis. MMCA draws on foundational work in content analysis (Krippendorff, 2004, Schreier, 2012), interpretivist research paradigms and social semiotics (Kress and Van Leeuwen, 2021), aiming to better address the complexities of contemporary multimodal texts. In contrast to current quantitative multimodal approaches that rely on frequency counts, MMCA foregrounds the need for flexible analytical frameworks capable of capturing the layered, interrelated meaning-making processes found in multimodal phenomena.
To this end, Serafini and Reid (2023) propose an 11-step, recursive analytical procedure that blends inductive and deductive reasoning. Their proposal of the blend and explicit steps is a key contribution: providing a transparent and replicable process for analysis, it goes beyond the conventional qualitative approach which pursues often open-ended, unsystematic interpretation.
The steps include: (1) Recognizing an Area of Interest; (2) Developing Initial Research Questions; (3) Constructing the Data Corpus; (4) Defining the Object of Study; (5) Developing Initial Categories; (6) Developing the Analytical Template; (7) Testing the Analytical Template; (8) Applying the Analytical Template to the Data Corpus; (9) Constructing Potential Themes; (10) Considering the Implications of the Analysis; and (11) Dissemination of Findings.
Through a case study of 100 commercial wine labels, they illustrate how this procedure can guide researchers in constructing categories and themes through iterative interpretation and close reading. According to the authors, ‘themes . . . do not just emerge; rather, they are constructed by the researchers during data analysis by close readings and interpretation of the data corpus’ (p. 644). The combination of data analysis and top-down interpretation of themes is similar to the process employed in this present article.
Nevertheless, in this present article, one aspect of Serafini and Reid’s framework, namely, the coding transparency and systematic analysis, will be substantially strengthened in order to achieve a higher degree of replicability and reliability of the approach.
When introducing the formulation of the analytical template, Serafini and Reid describe an inter-rater comparison exercise in which four wine labels were independently analysed using a revised template: The researchers selected four wine labels and used the revised analytical template to analyse each image individually. After the researchers completed their individual analyses of the wine labels, they compared their results. These comparisons led to further revisions of the template and enabled us to generate a final template that addressed the important multimodal features of the data under investigation. (p. 636)
While they argue that such comparisons help establish ‘reliability and trustworthiness’ (p. 636), the interpretive nature of coding remains a limitation. For instance, although four wine labels were considered a suitable number for checking reliability in their case study, it is unclear how much data should be taken when researchers have larger multimodal datasets. Moreover, due to the subjective bias, which means that different researchers might derive varying interpretations or themes from the same dataset, an explicitly defined codebook, clear coding criteria, or statistical reliability measures (e.g. Krippendorff’s Alpha, Cohen’s Kappa) would substantially enhance the reproducibility of findings. Nevertheless, MMCA’s methodological contributions are valuable as it is one of the first endeavours in social semiotic research area to broaden qualitative, thematic analysis with clearly defined analytical procedures. This current article will build on their structured steps and will enhance the aspect of coding transparency.
Quantitative studies of multimodal content analysis
A number of large-scale multimodal studies already demonstrate how inferential statistics offer analytic leverage beyond simple frequency counts. These studies are also particularly insightful because they combine quantitative techniques with qualitative interpretation – both in the selection of coding categories and in the interpretation of results.
Bateman and Tseng (2023) employ inferential statistics within a multimodal discourse analysis of news. They conduct correlation tests, principal component analysis and generalized linear models to contrast multimodal categories across two German news outlets – Tagesschau (N = 70) and Bild TV (N = 96). Their findings suggest systematic contrasts in narrative strategies between the channels and their interpretations explicitly bridge qualitative discourse analysis with quantitative comparison.
Similarly, Bower and Hedberg (2010) present a quantitative multimodal discourse analysis to test how activity design shapes collaboration in web-conferencing lessons. Drawing on activity theory and systemic functional linguistics, they code task subject matter (declarative, procedural, conceptual), activity design (teacher-centred, teacher-led, student-centred) and interface type (presentational vs collaborative), and then examine how these categories correlate with interaction and collaboration in an undergraduate computing course.
Also focusing on news, Wozniak et al. (2014) propose a standardized multimodal content-analysis design for climate-change coverage, formulating coding categories that include framing, narrative structures and visual representation for large cross-national samples. Methodologically, they report a pretest on newspaper material from Germany, India, South Africa and the US, using intercoder reliability to assess cross-cultural applicability. The pretest functions as a feasibility check rather than a full corpus study and the results show that most variables achieve acceptable reliability across countries, with some weaker agreement in the more exploratory narrative segment.
In another large-scale news analysis, Jungblut and Zakareviciute (2018) conduct a multimodal content analysis of online reports about the 2014 Israel–Gaza conflict to compare textual vs visual framing over time. Their dataset comprises 150 texts and 219 images, coded to identify frames, their co-occurrence across modes and temporal shifts in multimodal framing. A key finding is a divergence between modes as the conflict progresses: while textual coverage increasingly stresses negotiations and solutions, visuals become more graphic, indicating a growing mismatch between what stories say and what images show.
Building on these endeavours in multimodal content analysis, the remainder of the article sets out a step-by-step approach that bridges quantitative methods with qualitative interpretation in both coding and the reading of results.
Towards a mixed-method, multimodal semiotic content analysis: a step-by-step guide
Building on the multimodal studies reviewed in the previous section, the approach proposed in this article also draws on established methods of quantitative content analysis widely adopted across the social sciences (see Riffe et al., 2024). Specifically, this article integrates the systematic procedures of quantitative content analysis with analytical steps that are essential for multimodal semiotic analysis. The key steps necessary to conduct a comprehensive analysis with robust coding criteria and statistical testing are outlined below:
Identifying the research domain and developing research questions.
For hypothesis testing: formulating hypotheses by specifying variables and their expected relationships.
Defining the ‘population’ (i.e. the universe of multimodal data) and selecting appropriate data samples.
Determining units of analysis and developing semiotic coding categories through pilot coding, conducting inter-coder reliability tests, and refining and finalizing the codebook, which is a structured set of definitions and guidelines that specifies how multimodal content should be systematically categorized and coded into analysable variables.
Coding the content and analysing the data using inferential statistical methods.
Reporting the findings from hypothesis testing and/or outlining the development of communication strategies.
In the remainder of this section, each step and its practical implementation will be illustrated through applying the method to a large dataset of internet memes, both for hypothesis testing and for constructing communication strategies. The next subsection presents the process of hypothesis testing to investigate how semiotic resources shape multimodal communication in the context of depression memes.
Multimodal semiotic content analysis of depression memes
Step 1: The research domain and research questions
Internet memes have emerged as a popular medium through which individuals experiencing mental health challenges share their thoughts and struggles on social media. Scholars have highlighted that the playful nature of memes can serve as a valuable outlet for expressing negative emotions and discussing mental health issues that may otherwise be silenced due to stigma; memes achieve this by framing such experiences as common and relatable (Gardner et al., 2021).
Existing research on mental health memes has primarily explored the psychological effects of engaging with depression-related memes and their functions within online communities (Gardner et al., 2021). These studies suggest that depression memes fulfill several communicative functions: generating self-deprecating humour, framing depression-related experiences as relatable and providing a coping mechanism for depressive symptoms.
Building on these identified communicative functions, this case study seeks to examine the specific semiotic choices employed in depression-related memes to achieve these effects. Accordingly, this study addresses the following research questions (RQs):
Step 2: For hypothesis testing: from RQs and indicators to hypotheses and variables
To operationalize the research concept concerning the communication of depression-related memes and to address the research questions, specific indicators are developed for hypothesis testing. These indicators are measurable or countable aspects that translate broader research concepts into concrete, testable variables. In essence, they act as a bridge between the overarching research topic and the statistical testing of relationships among variables.
For this case study, the indicators are defined as follows:
Depression topics represented in the memes.
Semiotic dimensions theorized by Kress and Van Leeuwen (2021), which include, for example, categories of process types (i.e. narrative vs conceptual representations; see chapters 2 and 3) and social interactions (see chapter 4).
Other potential indicators could include any semiotic frameworks selected by researchers, or social categories such as gender and age, as well as different genres of multimodal texts – essentially, any feature the researcher wishes to examine comparatively.
These indicators can then be formulated into hypotheses with concrete variables to test for significant relationships. The alternative hypotheses (Ha) that posit the existence of statistically significant relationships between variables for the current study are as follows:
In hypothesis testing, the null hypothesis (H0) represents the default claim that there is no relationship or effect between the variables of interest, and that any observed associations are due to random chance. Researchers aim to reject this null hypothesis through statistical testing. The corresponding null hypotheses for the current study are as follows:
Other quantitative social semiotic studies, particularly those employing system networks, can similarly formulate hypotheses based on the features they aim to compare. In this way, hypothesis testing goes beyond merely counting frequencies or comparing percentages of semiotic features; it offers a more rigorous approach to examining and comparing the relationships among semiotic categories.
Step 3: Defining and selecting data
For this case study, a total of 277 depression-related memes were selected from the social media platform Reddit. Reddit, which hosts over 100,000 topic-specific communities, is often described as ‘a community of communities’ (Massanari, 2017: 331) because it enables users – known as ‘redditors’ – to engage in largely anonymous discussions within thematic subforums called subreddits. This structure facilitates targeted data collection by allowing researchers to focus on specific topics through dedicated subreddits, such as those that share depression-related memes.
The dataset analysed in this study was sourced from the subreddit r/depression-memes, which, with over 300,000 members, serves as a representative and active community for the sharing of depression memes. Our selected memes only include English-language content. All 277 memes included in this dataset contain English text and were posted between 2022 and 2025.
Step 4: Determining units of analysis and developing semiotic coding categories
A key challenge in conducting quantitative semiotic analysis lies in defining appropriate analytical units and developing coding categories that are tailored to the specific data and research domain under investigation. A common misconception is that a semiotic framework – such as the system networks or categories theorized by Kress and Van Leeuwen (2021), Van Leeuwen (2005), or Martinec and Salway (2005) – can be directly and universally applied to any type of multimodal texts and research domains. In practice, however, different research domains and datasets often demand different levels of coding granularity and adaptation of these frameworks.
Another critical issue involves determining the units of analysis within complex multimodal data. For example, when a meme or social media post consists of multiple segments featuring distinct narrative representations, researchers must decide whether to code all parts, or to prioritize certain elements, based on clearly defined coding criteria tailored to the need for addressing the particular research questions in a study.
To address these challenges and refine both analytical units and coding categories suitable for the research domain and dataset, conducting iterative and systematic
The final coding scheme – including units of analysis, coding categories and specific criteria – should be comprehensively documented in a detailed
The remainder of this subsection outlines how Step 4 was operationalized in our analysis of depression memes.
To illustrate the process of refining coding categories, we describe below how we adapted the categories proposed by Kress and Van Leeuwen (2021).
Kress and Van Leeuwen categorize the representation of ‘what is going on’ in the content of visual image into several process types. These are the ways images visually represent actions, events and relationships of people, places and things. They distinguish mainly between narrative processes – which depict unfolding actions, movements, or events through vectors (e.g. someone doing something) – and conceptual processes, which show participants in more static, timeless states or classifications (e.g. diagrams or posed portraits). These categories help analyse how meaning is constructed visually, much like verbs and nouns do in language.
In the first pilot study, we coded process types following the narrative representation outlined by Kress and Van Leeuwen: non-transactional actions, transactional actions, mental processes, verbal processes and reactional processes (e.g. gazing). After this pilot, we added the category ‘conceptual process’ (as also theorized by Kress and Van Leeuwen) to capture memes with non-narrative images. We did not further subdivide conceptual processes into subtypes (classification, analytical, symbolic) since the dataset was dominated by analytical processes, with very few instances of the others. Thus, we coded these broadly under ‘conceptual process’.
The analytical unit we adopt for our analysis is the entire meme. However, in cases where a meme contained multiple process types, we coded the dominant process type based on the overall visual representation, supported by salience cues and accompanying text. For instance, the meme in Figure 1 includes several narrative elements: blades flying toward a soldier and the soldier protecting a man, who is lying and sleeping in his bed. While the sleeping figure might be coded as a non-transactional process, the central communicative focus is the soldier shielding the vulnerable figure, which we coded as a ‘transactional action’.

A meme on Depression with multiple process types. Downloaded from Reddit. Meme created by bruh2rwtwtwy, 2020. Available at: https://www.reddit.com/r/memes/comments/mzi8rg/i_dont_know_who_you_are_but_thank_you/
Beyond narrative and conceptual representations, Kress and Van Leeuwen (2021) also propose categories for analysing the semiotic dimension of social interaction in images. Their concept of social interaction refers to how images create relationships between what is depicted (the represented participants) and the viewer (the interactive participant). They describe this through visual choices like camera angle (frontal vs oblique, high vs low) and distance (e.g. close-up, long shot), which shape how intimate, detached, or involved the viewer is positioned socially in relation to participants in the image. For example, a closer camera shot can suggest intimate social distance while a longer shot can signal distant or public social distance. These design choices are part of the image’s interactive meaning, guiding how viewers are positioned to see and relate to what is shown.
After our pilot codings using the categories for social interaction by Kress and Van Leeuwen reviewed above, we decided to focus on the two categories which we labelled as Social Relation (operationalized as oblique and frontal camera angles) and Social Distance (operationalized as camera shot size).
Regarding the category of Social Relation, while Kress and Van Leeuwen indicate that obliqueness of camera angles can vary in degree, we simplified this into two values – frontal and oblique – to maintain clarity and coding consistency. We added a third category, ‘no angle’, for memes composed solely of text or infographics where angle is not applicable.
In terms of the category of Social Distance, the original model by Kress and Van Leeuwen describes a detailed range of shot sizes from ‘very close shot’ to ‘very long shot’. Based on the reduced diversity of shot sizes in the memes, we collapsed these into three broader categories: close, medium and long shots. We also added ‘no distance’ to code text-only memes and infographics.
After the pilot codings, we decided not to include the categories about high and low camera angles in our coding scheme due to the lack of variety in our data.
For the same reason of lack of variety, we also decided to exclude another semiotic dimension by Kress and Van Leeuwen from our coding scheme, the compositional dimensions such as framing, information value and salience. Our pilot codings show that most memes follow rather similar visual layouts constrained by meme template, offering little variation in compositional choices; thus, this dimension would not meaningfully differentiate communication strategies in our dataset.
Another coding category, ‘depression topics’, was developed through a recursive process during the pilot studies. Initially, we identified 14 topics (e.g. self-harm, isolation, procrastination, hope, frustration, etc.). After reviewing frequency and mutual exclusivity, we refined these into four broader, analytically clearer categories:
Following two pilot studies and validation through intercoder reliability testing, we finalized three main coding categories: Process Type, Social Distance (camera distance) and thematic Topic. Table 1 summarizes the categories and coding values, with numerical codes used for spreadsheet-based annotation. Here we would like to emphasize that spreadsheet-based annotation is not necessary, if researchers are able to use other annotation tools.
Coding categories and their values.

A detailed codebook is provided as supplementary material to facilitate replication, coder training and potential future dataset expansions.
During each pilot coding session, the coders independently coded the sample, and the resulting reliability scores were reviewed. Following recommended practice (Lombard et al., 2002), the intercoder reliability tests were conducted on at least 10 percent of the dataset (30 depression memes). After one pilot coding process and its ICR tests, discrepancies were discussed, leading to refinements of the codebook. Based on the revised codebook, for the next round of pilot coding, another 30 memes are selected as sample and ICR tests are conducted following the second pilot coding. This iterative process continues until all coding categories reached an acceptable level of reliability (Krippendorff’s Alpha ⩾ 0.80).
After two rounds of our pilot codings in the current study, all three categories achieved acceptable to excellent levels of agreement as summarized in Table 2.
Results of intercoder reliability tests.

Step 5: Coding the content, analysing and visualizing data
The 277 memes were coded in a spreadsheet based on the coding categories and criteria described earlier. The completed coding data were then imported into JASP.
As the variables coded in this study are all categorical, we employed chi-squared tests for independence to test for potential associations between them. A chi-squared test evaluates whether there is a significant relationship between two categorical variables by comparing the observed counts in each category combination to the counts expected under the assumption of independence. When the difference between observed and expected counts is sufficiently large (reflected by a small p-value and a large
For hypothesis testing:
To test Ha-1, we examined the association between Process Type and each of the two social interaction variables: Social Relation and Social Distance. That means we will conduct two tests for this hypothesis.
To test Ha-2, we analysed the correlation between the two variables: Depression Topic and Process Type.
To test Ha-3, we tested the association between Depression Topic and each of the two social interaction variables: Social Relation and Social Distance. That means, we will also conduct two tests for this hypothesis.
Contingency table of Process Type (PT) and Social Relation (SR).
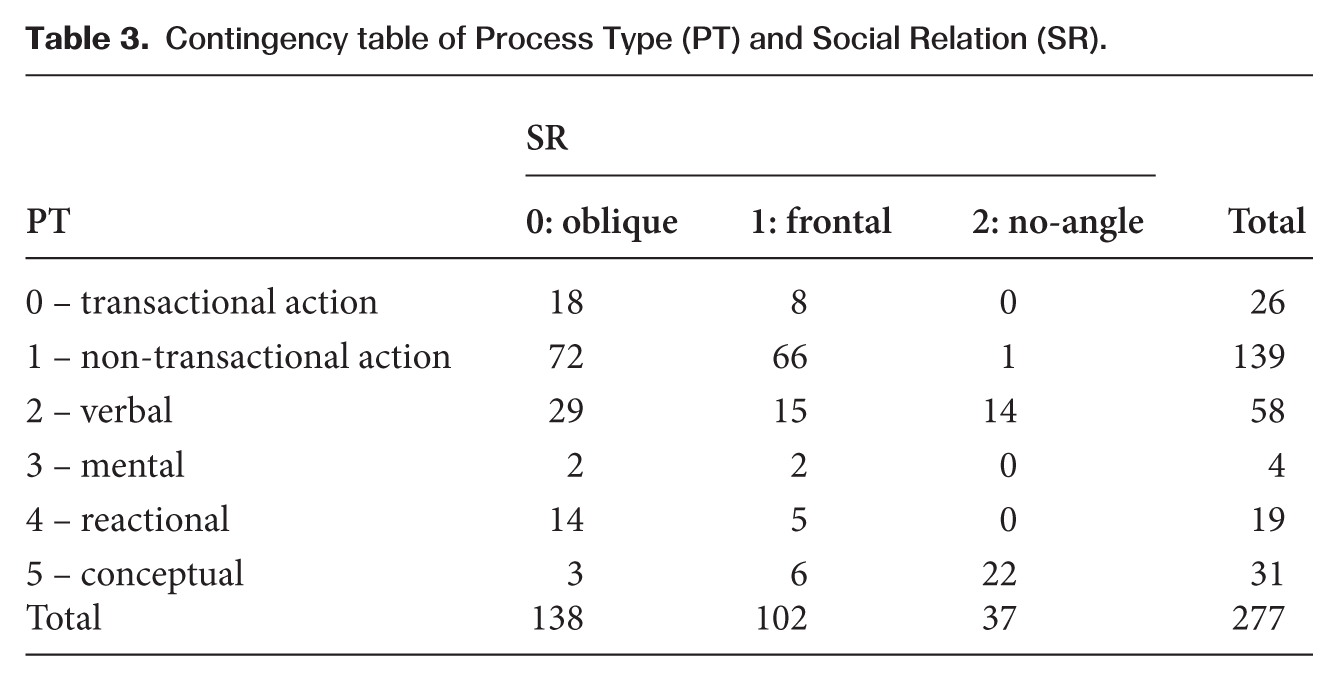
Beyond statistical significance, it is important to report the effect size to understand the strength of this relationship. While the p-value indicates whether an association exists, the effect size, here measured by Cramer’s V, quantifies how strong the association is, regardless of sample size. In this study, Cramer’s V = 0.480 suggests a medium to strong effect, indicating that the significant association between Process Type and Social Relation is not only statistically reliable but also substantively meaningful.
To address this, one examines the standardized residuals. Standardized residuals highlight which specific cells in the contingency table – i.e. combinations of Process Type and Social Relation – have observed counts notably higher or lower than would be expected under the null hypothesis of independence.
The results of these residuals can be most effectively visualized using a mosaic plot, as shown in Figure 2. This plot, generated via R-scripts in R-Studio (with the vcd R-package), divides a rectangle into ‘tiles’ whose sizes correspond to the frequencies of each category combination. The tiles are coloured based on the standardized residual values for the data with two contrasting colours: blue tiles for positive residuals (residuals > 2.0), which indicate combinations that occur more frequently than expected, and red tiles for negative residuals (residuals > –2.0), which indicate combinations that appear less frequently.
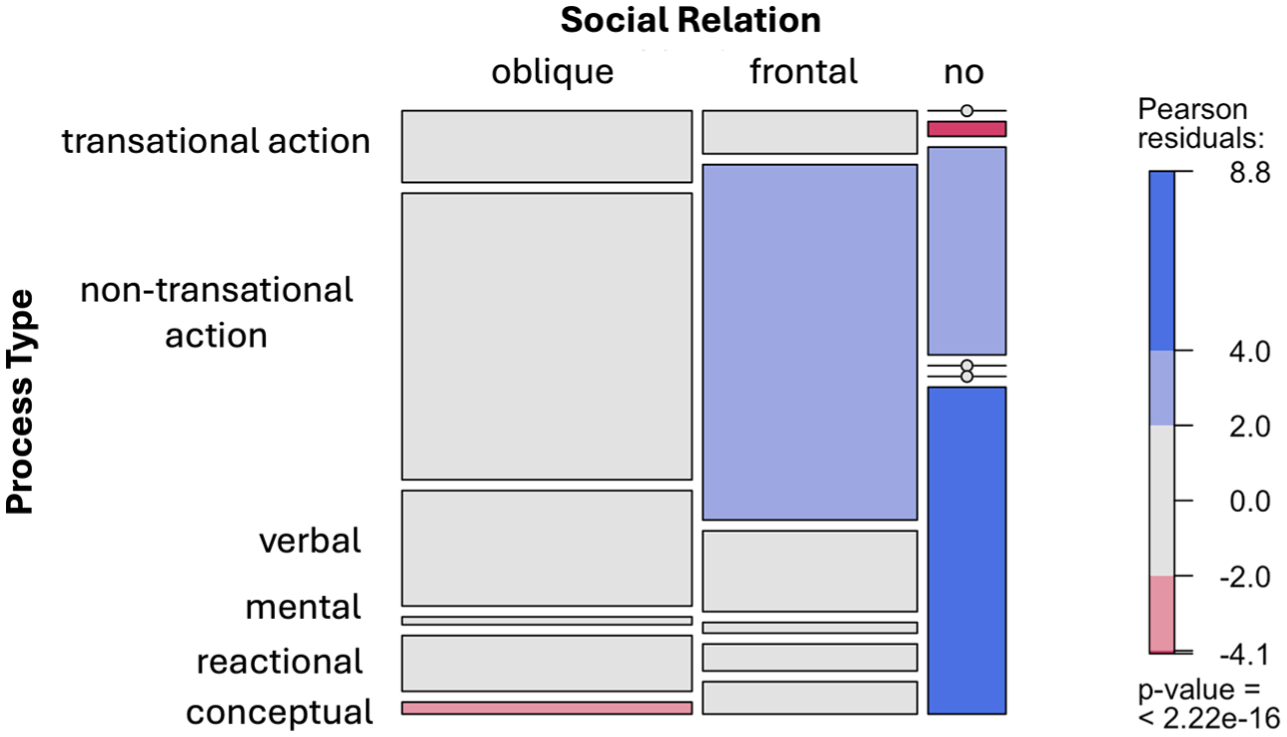
Mosaic plot showing the association between Process Type and Social Relation, with tile shading indicating standardized residuals (blue = higher, red = lower than expected) and an overall significant chi-squared test results, with a P-value < 2.2e–16
For researchers who may not yet use R, JASP also offers a clear table of standardized residuals. Nevertheless, one should always try to use graphic visualization as it enhances interpretability.
The mosaic plot shows that the Process Type category ‘conceptual process’ combined with Social Relation category ‘no angle’ stands out with residuals ⩾ 4.0, suggesting this combination appears much more often than random chance would predict. Additional combinations also contribute meaningfully: Process Type ‘non-transactional action’ with Social Relation ‘frontal angle’ and Process Type ‘verbal’ with Social Relation ‘no angle’, each showing positive residuals above 2.0.
Conversely, smaller red tiles – for instance, the combination of Process Type ‘conceptual process’ with Social Relation ‘oblique angle’ – indicate these pairings occur less often than expected. These contrasting patterns demonstrate that the observed association is not driven uniformly across all cells, but rather by specific, strong co-patternings of semiotic resources.
Here we would like to emphasize that, without checking standardized residuals, comparing percentages alone can overlook whether differences are statistically meaningful or just random variation, especially in small or unevenly distributed groups in the data.
To demonstrate this point, the percentages of each combination from Table 3 are shown in Table 4. The percentage comparison shows that the most frequent combinations are ‘non-transactional action’ with ‘oblique angle’ and ‘non-transactional action’ with ‘frontal angle’. These percentages are indeed reflected in the big tile sizes of the tiles in the mosaic plot in Figure 2. Nevertheless, the tile ‘non-transactional action’ with ‘oblique angle’ is shown in ‘grey’ – although its percentage is the highest of all, its standardized residual value indicates that this combination actually does not contribute to the correlation of the variables.
Standardized residual values of each combination from Process Type (PT) and Social Relation (SR) (%).

This example clearly illustrates that relying solely on percentages of frequency counts to interpret empirically meaningful co-patterning of semiotic resources can easily lead to misleading conclusions.
Following the same test procedure, we conducted chi-squared test for independence to investigate the correlations between the two variables, Process Type and Social Distance. The results also show a significant association and a medium effect size (
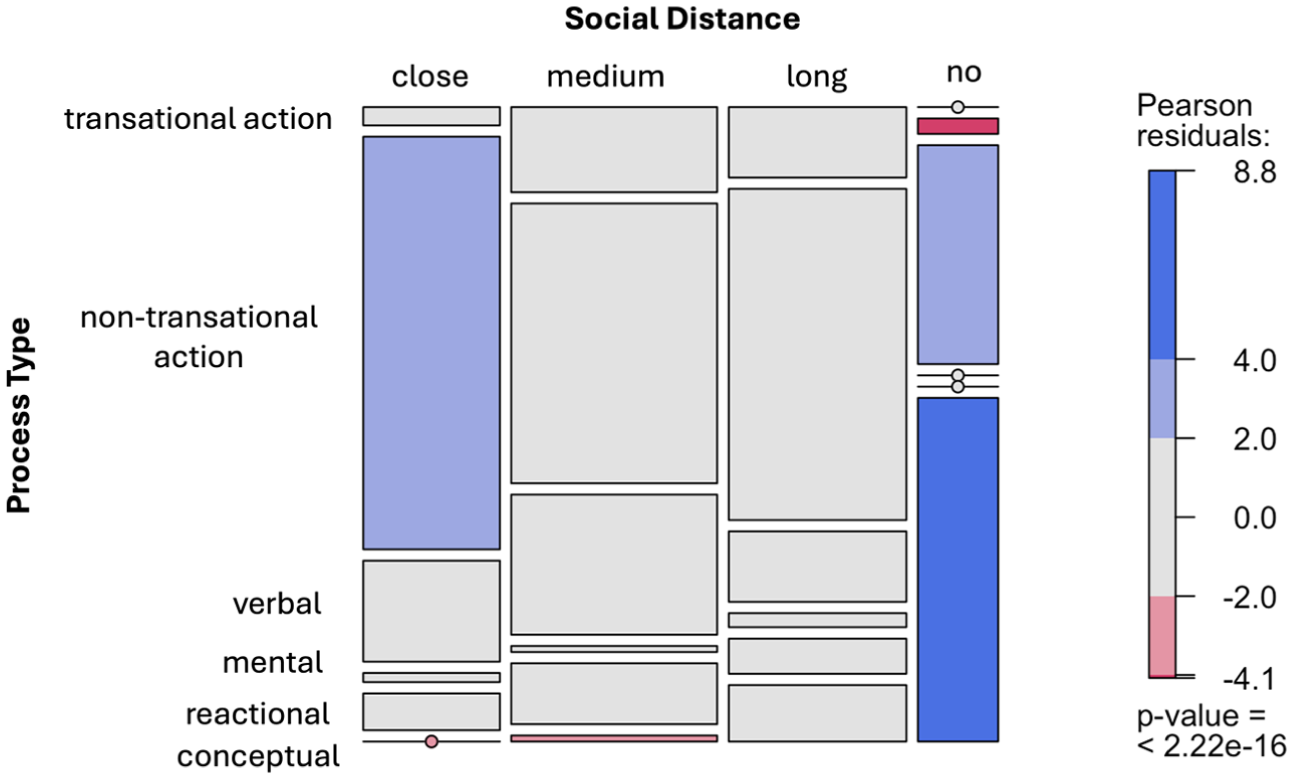
Mosaic plot showing the association between Process Type and Social Distance, with an overall significant chi-squared test (P < 2.2e–16).
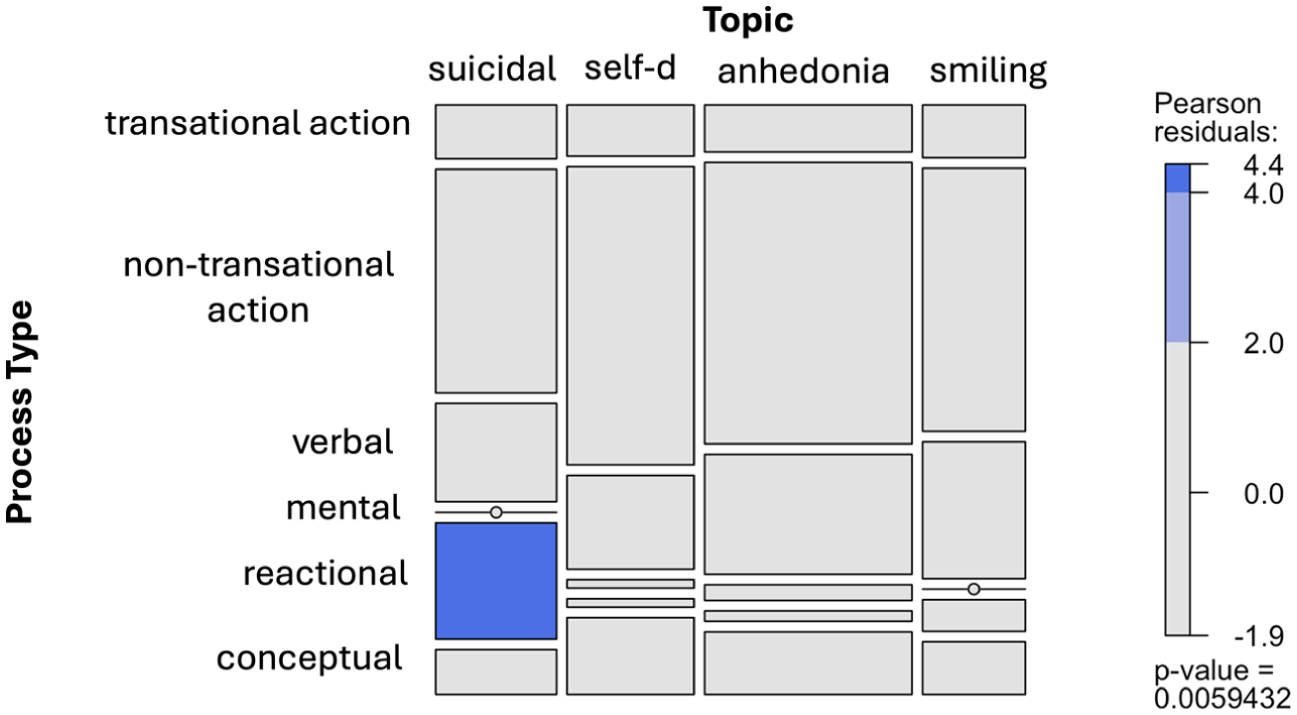
Mosaic plot showing the association between Process Type and Theme, with an overall significant chi-squared test (P = 0.0059432).
Step 6: Reporting findings and exploring communication strategies
The chi-squared test results allow us to reject the first two null hypotheses (H0-1 and H0-2) while retaining the third (H0-3). Specifically, the analysis shows significant associations between Topic and Process Type, as well as between Process Type and the two social interaction variables: Social Distance and Social Relation. However, no significant associations were found between Topic and either of the social interaction variables individually.
These findings highlight that, within the domain of depression-related memes, Process Type emerges as a central semiotic resource that systematically co-patterns with social-interaction-related features. Furthermore, Process Type appears to strongly associate with how depression topics are visually and narratively represented in these memes. This suggests that Process Type plays a key role in communicative strategies used to construct and convey meaning in this particular genre.
‘Conceptual process’ with ‘no angle’ (test result of Ha-1)
‘Verbal process’ with ‘no angle’ (test result of Ha-1)
‘Non-transactional action’ with ‘frontal angle’ (test result of Ha-1)
‘Non-transactional action’ with ‘close-up distance’ (test result of Ha-1)
‘Verbal process’ with ‘no distance’ (test result of Ha-1)
‘Conceptual process’ with ‘no distance’ (test result of Ha-1)
‘Reactional process’ with ‘suicidal ideation’ (test result of Ha-2)
Drawing on the above chi-squared tests, these seven combinations represent the most prominent elements of the communication strategies employed in depression memes. In other words, with these co-patterning drawing on standardized residuals, not only can we construct communicative strategies based on these bottom-up content analysis, but also, these results also help us select representative examples from our data.

A meme with the infographical strategy. Downloaded from Reddit. Meme created by 19MattZi, 2025. https://www.reddit.com/r/depression_memes/comments/1jczkl1/facts/
A meme with this communication strategy, the abstract concepts or emotions related to depression are encoded through text–object relations. Figure 5 uses a contrastive infographic structure to highlight the gap between public assumptions about depression and the complex internal experiences of those who suffer from it. The strategy uses conceptual process, particularly analytical process for part–whole relations to show parts (e.g. ‘nothing’, ‘sadness’, ‘self-loathing’, ‘hopelessness’, ‘isolation’, ‘anxiety’ and ‘guilt’) of the whole ‘what I actually feel’. Similarly, the side-by-side figures – the uniformly coloured and labelled only with ‘sadness’, the other divided into multiple colour visually juxtapose a simplified two contrastive parts (i.e. simplified external view vs layered internal emotion) of the complex depression reality.

A meme with the emotionalization strategy Downloaded from Reddit. Meme created by LastInMyBloodline, 2025. https://www.reddit.com/r/depression_memes/comments/1is7frr/regular_day/

A meme with the dialogical strategy. Downloaded from Reddit. Meme created by ZombiePriton, 2025. https://www.reddit.com/r/depression_memes/comments/1j8tch2/if_theres_a_god_he_hates_me_ben_grimm/
In this meme, a concise dialogical exchange conveys depression through irony and subversion of expectations. The first statement, ‘People treat me like a god’, initially sets up a positive or self-aggrandizing tone, prompting the interlocutor’s ‘How?’ – a standard turn-taking pattern in conversational structure. Then the punchline, ‘They ignore my existence unless they need something from me’, reinterprets the initial positive claim into negative emotional neglect. The dialogical strategy often shows a common pattern in which seemingly neutral or positive prompts are reframed negatively and it leverages the structure of everyday conversation to reveal underlying depression emotional traits.

A meme with the suicidal gaze strategy. Downloaded from Reddit. Meme created by imadeyoureadthisss. https://www.reddit.com/r/depression_memes/comments/10vzcvp/suicide_it_is/
In summary, Research Question 1 (RQ1) was addressed by analyzing the correlations across semiotic categories and depression topics. Research Question 2 (RQ2) was addressed by integrating multimodal semiotic coding with the construction of communication strategies. From the seven prominent semiotic resource and topic combinations identified in our 277 depression memes, we uncovered at least four recurrent communication strategies: infographical, emotionalization, dialogical and suicidal gaze. Drawing on the approach, we suggest that these are crucial strategies that shape how the concept of depression is represented and communicated in internet memes amongst the English-user Reddit community.
Conclusion
This article proposed a framework for multimodal semiotic content analysis. In doing so, the article first problematizes the quantitative and qualitative divide and argues that multimodal content analysis is inherently mixed-method. It then highlights the methodological considerations that are often overlooked in several previous multimodal semiotic analyses.
First of all, as exemplified in Table 4, relying on percentage comparisons can lead to false results because percentages do not reveal how statistically meaningful data distributions are relative to what would be expected by chance. Moreover, a systematic process of pilot coding supported by ICR testing is essential when applying pre-theorized semiotic categories. It should not be assumed that categories defined in earlier studies will automatically fit new multimodal datasets. Instead, the granularity and selection of coding categories and analytical units must be tailored to the dataset and aligned with the specific research questions.
To illustrate the implementation of this approach, this article focused on variables such as depression-related topics, visual process types and dimensions of social interaction. Future research could expand this framework to include additional variables, such as genres of verbal text, the use of visual metaphors, colour palettes and user engagement metrics – each tailored to more specific research questions in the field of depression memes.
Ultimately, we hope this article demonstrates how researchers can identify prominent combinations of semiotic choices – showing how these choices co-pattern to fulfil communicative functions within a specific domain – and, importantly, how to investigate such co-patterning with the statistical analysis necessary to ensure empirical validity and reliability.
Supplemental Material
sj-docx-1-vcj-10.1177_14703572261418120 – Supplemental material for Multimodal semiotic content analysis: combining quantitative large-data analysis with qualitative semiotic coding
Supplemental material, sj-docx-1-vcj-10.1177_14703572261418120 for Multimodal semiotic content analysis: combining quantitative large-data analysis with qualitative semiotic coding by Chiao-I Tseng, Emily Fielder and Luise Charlotte Claire Wenk in Visual Communication
Footnotes
Data Availability Statement
Supplemental Material
Supplemental material for this article is available online.
Biographical Notes
CHIAO-I TSENG is Associate Professor in Communication in the Department of Applied Information Technology, University of Gothenburg, Sweden.
EMILY FIELDER is a student in the program Master in Communication in the Department of Applied Information Technology, University of Gothenburg, Sweden.
Address: as Chiao-I Tseng. [ email:
LUISE CHARLOTTE CLAIRE WENK is a student in the program Master in Communication in the Department of Applied Information Technology, University of Gothenburg, Sweden.
Address: as Chiao-I Tseng. [ email:
References
Supplementary Material
Please find the following supplemental material available below.
For Open Access articles published under a Creative Commons License, all supplemental material carries the same license as the article it is associated with.
For non-Open Access articles published, all supplemental material carries a non-exclusive license, and permission requests for re-use of supplemental material or any part of supplemental material shall be sent directly to the copyright owner as specified in the copyright notice associated with the article.