
Abstract
An apparent anomaly in brand metrics data is that the aggregated buyer base of each brand appears to buy the category at above the average rate. This seems arithmetically impossible. The effect is real, but it has a simple explanation. It is caused by the fact that heavy category buyers buy more brands than light buyers do. They therefore appear in the buyer base of multiple brands, and so inflate the category buying rate for each brand to above the overall average rate. This study shows what it calls the ‘category purchase rate anomaly’ in empirical data, as well as demonstrating how it occurs via a simulated dataset.
Introduction
The purpose of this paper is to investigate and explain an apparent anomaly that occurs in brand performance data derived from consumer purchase panels. The anomaly is that each brand’s buyer base appears to buy the category at above the average rate. At face value this seems arithmetically impossible, but is shown to be due to (a) the distribution of category purchase frequency is highly skewed (many infrequent, very few frequent buyers) and (b) those frequent buyers buy more brands than the infrequent ones do, thereby they appear in the buyer base of each brand and so inflate the category buying rate of each brand.
Consumer Panels and Panel Data Metrics
Brand managers and consumer insights specialists in hundreds of consumer-packaged goods companies subscribe to the data and reporting provided by consumer panel companies such as GfK, Kantar and Nielsen. These research corporations run large-scale panels of households in dozens of countries, whereby shoppers scan the codes of products they buy on a daily or weekly basis, with the results collated into large databases. Subscribing client companies access the resultant information, often in the form of ready-designed brand metrics reports via electronic interface.
Key metrics provided to managers and researchers from consumer panel data include:
And of course,
Metrics such as these are indispensable to consumer goods companies, and are used to monitor their market share, assess competitor activity and growth, as well as one’s own actions or interventions. These metrics allow managers to understand factors such as the composition of their market share, which comprises the number of brand buyers, multiplied by how much each of them bought. The metrics also allow for ‘pattern spotting’ to discern, for example, how the brands in a category follow the famous double jeopardy pattern, whereby small brands not only have fewer buyers, but they get somewhat less loyalty from those customers (e.g. Graham et al. 2017). A frequent point of interest is whether certain brands receive unusually high loyalty or unusually low loyalty, given their penetration level (Pare & Dawes, 2011). Likewise, managers may be interested to see the extent to which their brand appeals to lighter or heavier buyers of the category (e.g. Ehrenberg et al. 2004; Romaniuk & Wight, 2015; Stern & Hammond, 2004). At face value, appealing more to heavy category buyers appears desirable, since they offer more potential volume (Hallberg, 1995). That said, brand growth arises from attracting new buyers to the brand, most of whom will be light (Sharp, 2010; Dawes, 2016).
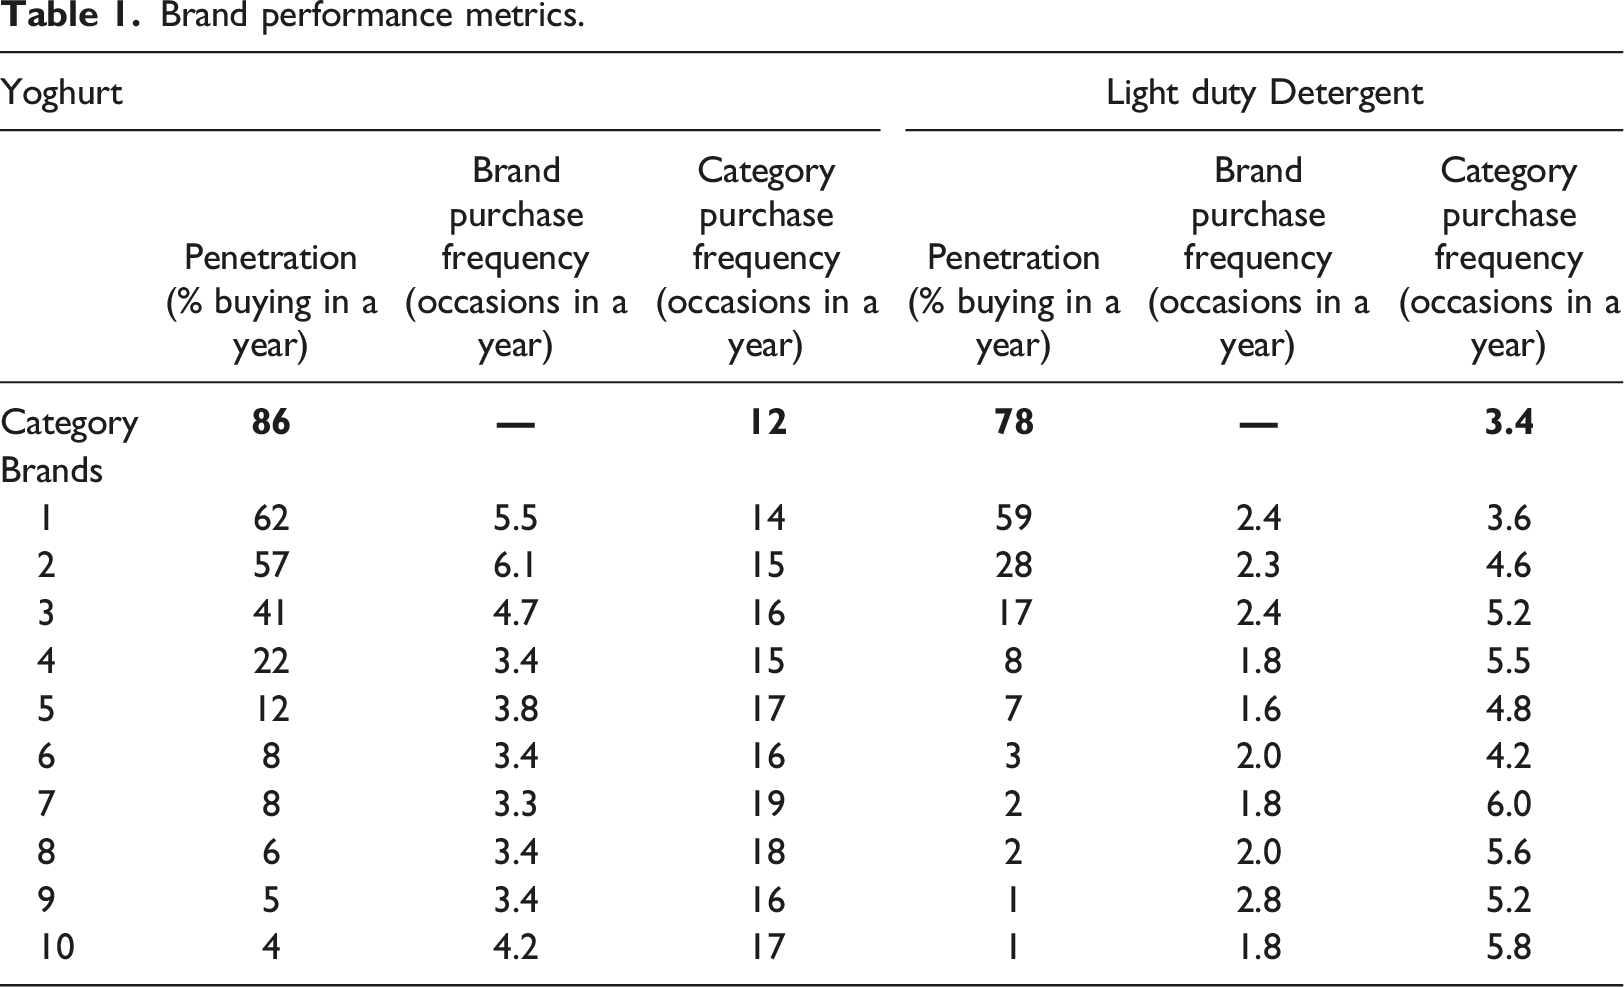
Brand performance metrics.
An Apparent Anomaly in Category Purchasing
The focal issue examined in this study is that consumer panel data of the type used in Table 1 consistently produces an anomalous result. That is, the rate at which each brand’s buyers buy the category is almost always higher than the overall average rate. For example, in Table 1 the average number of purchase occasions per year for Yoghurt is 12. However, every brand’s buyer base purchases the category at above this average rate – from 14 for the largest brand, to 17 for the 10th ranked. Likewise, the average purchase rate for detergent is 3.4, but we again see that all the brands’ buyer bases purchase at above this average rate; ranging from 3.6 to 5.8 occasions per year.
Basic arithmetic tells us that if we create an average from a set of numbers, all those numbers cannot be above the average. But the anomaly is plainly in evidence, and has the potential for marketers or research analysts to question their data or the way they interpret it, since it seems so obviously wrong.
The answer was explained to this author by the late Mr John Scriven of London SouthBank University, (a colleague of the legendary researcher Andrew Ehrenberg). Unfortunately, this author only thought he understood the explanation. It became clear only years later. The explanation is that categories have many light buyers and few frequent buyers; and the frequent category buyers buy more brands. They therefore appear in the buyer base of multiple brands, and so inflate the category buying rate for each brand.
Worked example of category and brand buying rates.
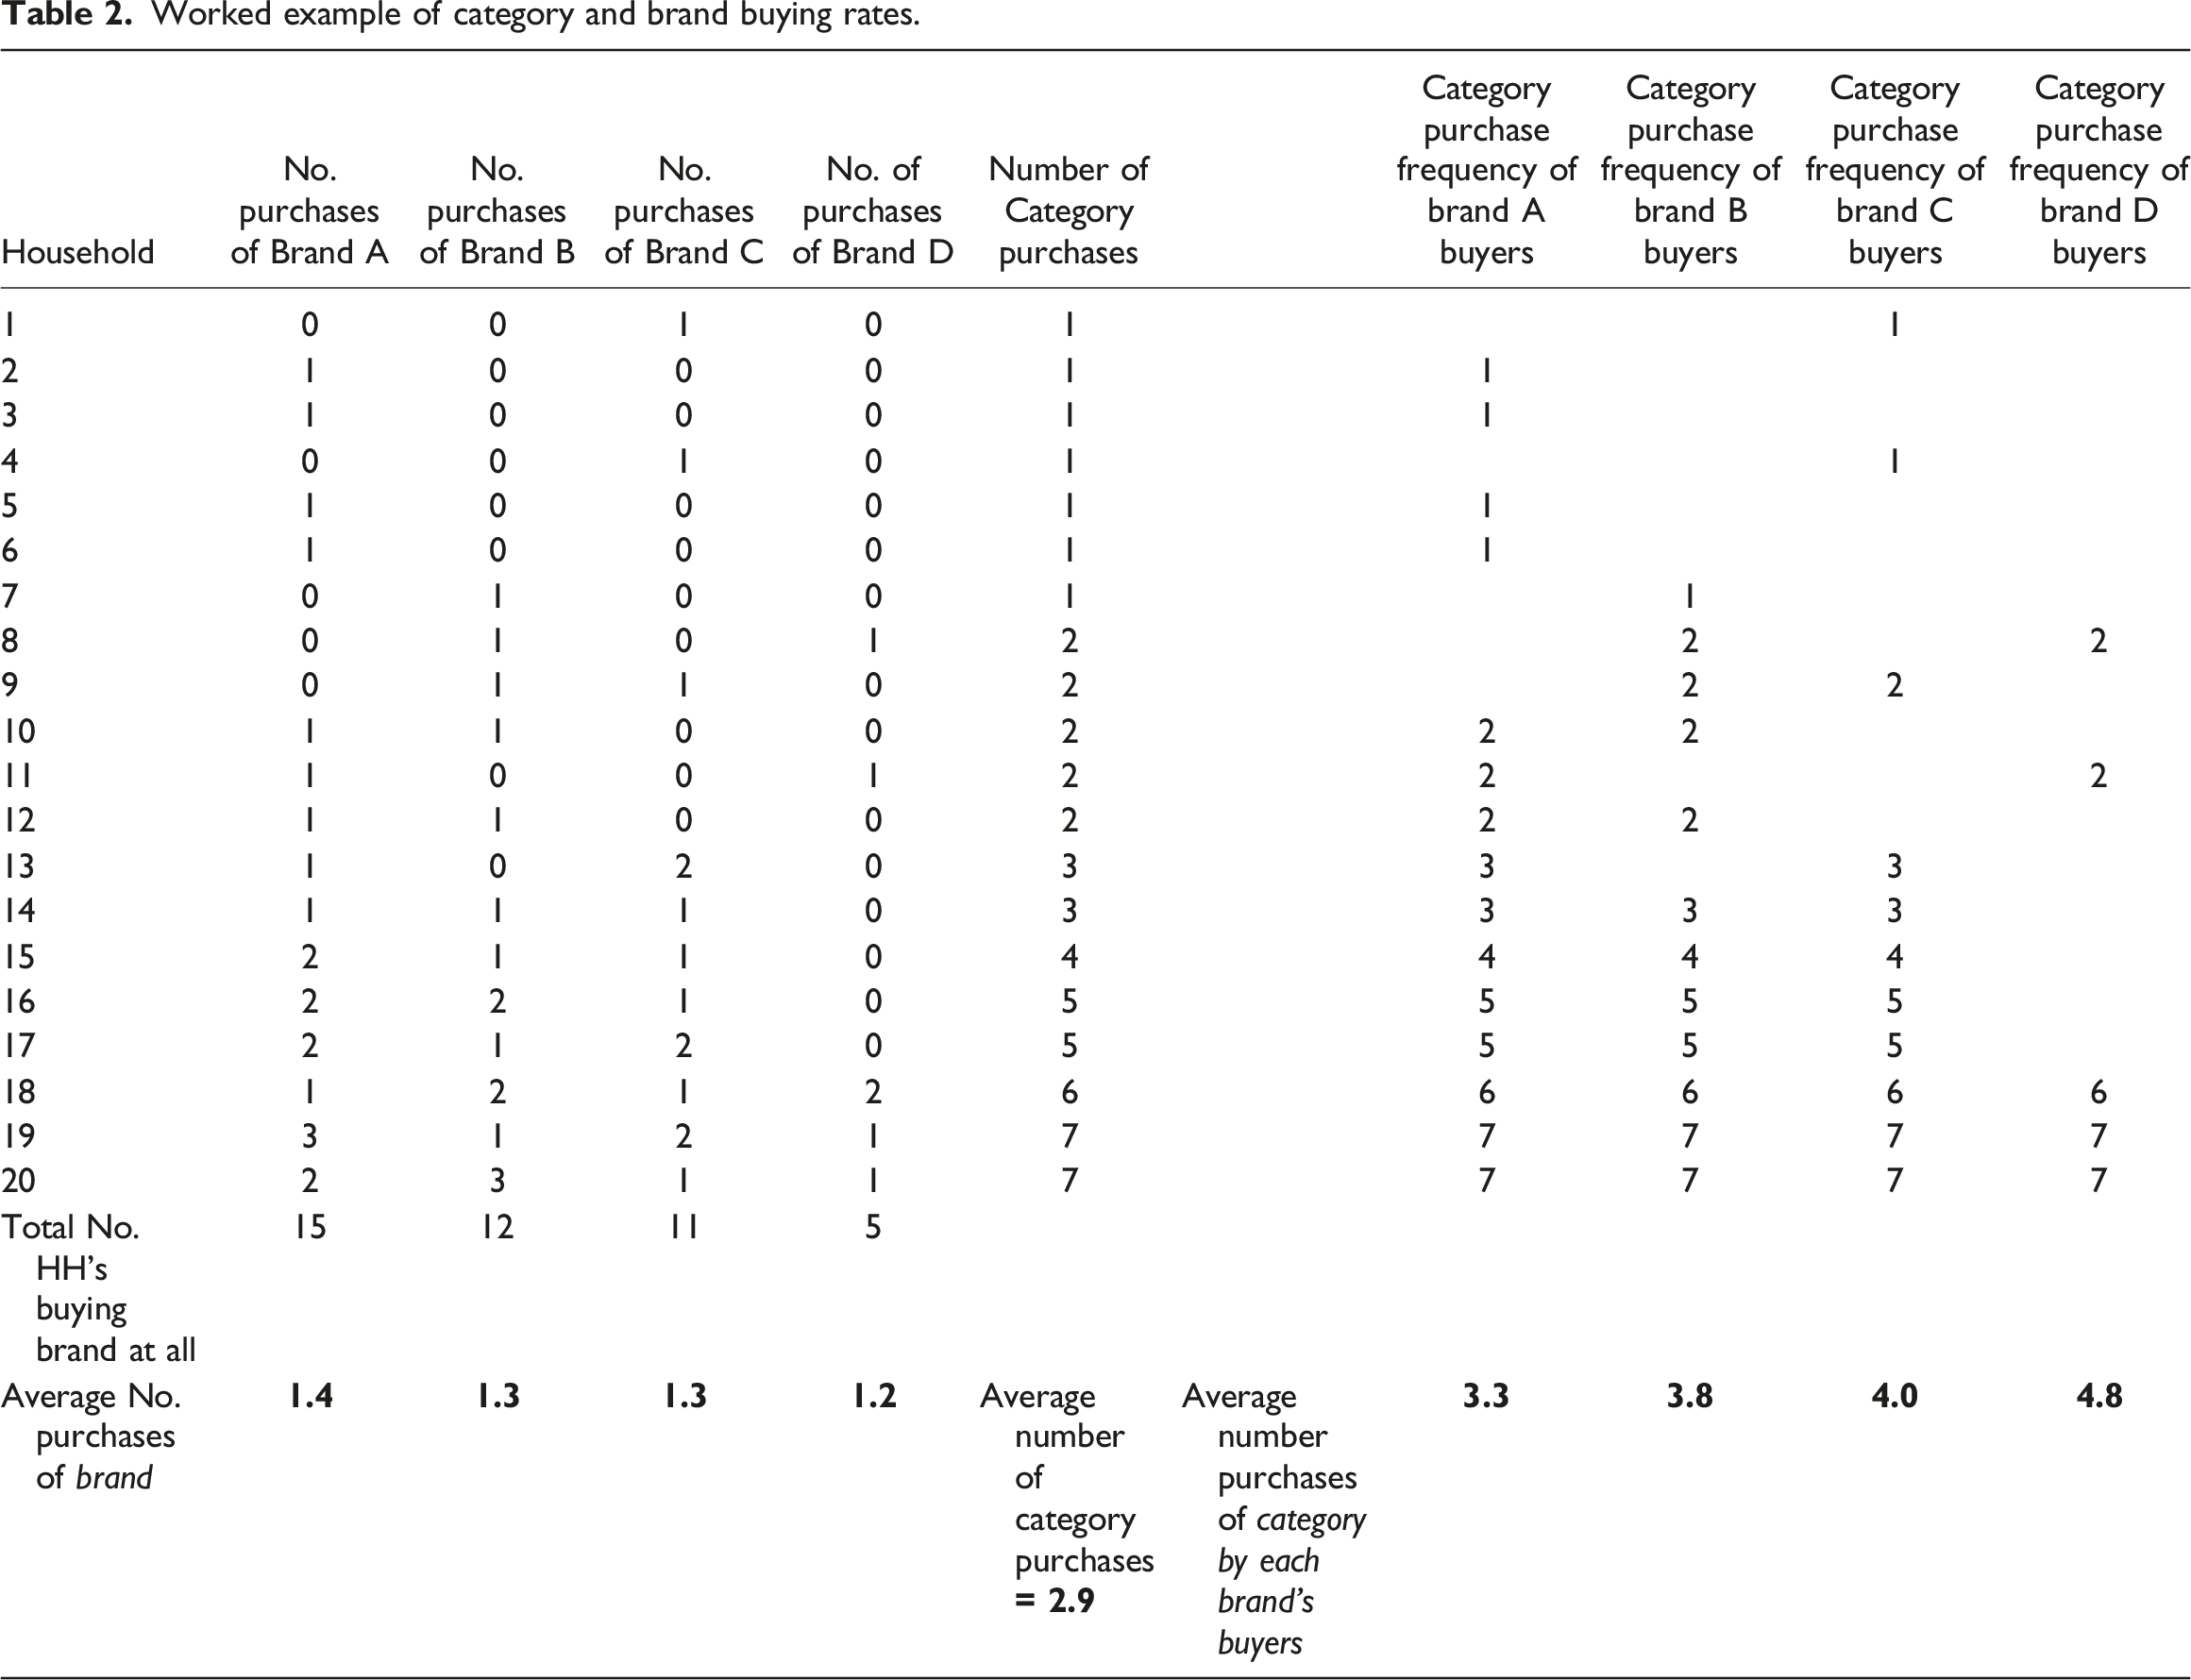
We see that the overall average category purchase rate of 2.9 is formed from the number of category purchases made by the entire 20 households. Most of these buy only once or twice; a couple of them buy seven times. But if we look over into the columns that show the category purchase frequency of each brand’s buyers, we notice that the lightest category buyers appear in only one brand’s buyer base; but the heaviest category buyers appear in multiple brands’ buyer base. Households 19 and 20, for example appear in all four brand’s buyer base. Consequently their seven purchase occasions ‘overweights’ the category purchase rate for all those brands – this is the explanation. The heaviest category buyers buy multiple brands, but the lighter ones buy say, only one – so the relative proportion of heavy category buyers is higher in each brand’s buyer base than it is in the category overall.
Therefore, if a researcher, insights analyst or marketer notices that their brand’s buyers are buying the category at higher than the average rate, it means (1) their data or method of extracting it is not necessarily incorrect, but (2) it also does not mean their brand is ‘different’ in that it really does skew to heavy category buyers. The category purchase rate anomaly they are seeing is a form of statistical selection effect, whereby heavy category buyers are more likely to be in any brand’s customer base relative to their incidence in the category as a whole. The data output is likely to be correct, albeit it can be puzzling without an explanation.
As a final note, we observe in Table 1 that the category purchase rate becomes larger as the size of the brand gets smaller. In other words, smaller brand buyers tend to purchase the category more often; whereas bigger brand’s buyers tend, on average, to be less frequent buyers of the category. This is a manifestation of what is called the ‘Natural Monopoly’ effect (e.g. Dawes, 2020) and in turn, helps explain Double Jeopardy (e.g. Ehrenberg et al. 1990). The buyers of bigger brands tend to be somewhat less frequent or less knowledgeable category buyers; they buy the brands they know, which tend to be the market leaders. By contrast, heavy or more knowledgeable category buyers, while obviously still buying market-leading brands, also buy the smaller brands but because they know more about the brands in the market, they buy more brands. The outcome is that buyers of small brands buy more other brands, therefore the small brands all get somewhat lower loyalty.
In conclusion, an apparent anomaly that occurs in brand performance data derived from consumer panels has a straightforward explanation. Knowing this explanation may save effort by analysts or marketers querying why it occurs, or wondering if their data is incorrect.
Footnotes
Declaration of Conflicting Interests
The author(s) declared no potential conflicts of interest with respect to the research, authorship, and/or publication of this article.
Funding
The author(s) received no financial support for the research, authorship, and/or publication of this article.