
Abstract
Electroencephalography (EEG) offers insights into the neural responses of consumers to marketing stimuli which can be used to evaluate the effectiveness of such stimuli in directing favorable consumer behavior in real-world settings. This practical review provides guidelines for using EEG in consumer and marketing research. It provides recommendations for how EEG may effectively be employed in neuromarketing in the future. EEG requires careful experimental design, and as such, we outline current recommendations for the collection, processing, analysis, and interpretation of EEG evoked potentials (i.e., event related potentials; ERP) and spectral content (i.e., EEG frequency). By providing an introductory overview of EEG measures in marketing and consumer research, this practical review extends previous literature that is primarily focused on other neuroimaging techniques (e.g., functional magnetic resonance imaging) and other disciplines (e.g., economics and organizational behaviour). Furthermore, by reviewing how EEG has been used throughout psychophysiological and neuromarketing research, we provide recommendations on how EEG can be used to measure marketing-related outcomes. These include processes relating to perception, attention, memory, emotion, and cognitive load, demonstrating the unique value of considering the neural responses captured by EEG in understanding and predicting consumer behavior.
Introduction
With the rapid growth and increasing accessibility of techniques used in neuroscience, the field of neuromarketing has emerged in efforts to offer a competitive advantage in marketing (Cherubino et al., 2019; Fortunato et al., 2014). Neuromarketing–the application of neuroscience techniques in marketing–aims to understand the biological basis of consumer behavior under the assumption that physiological responses to marketing stimuli can reveal conscious and unconscious cognitive, emotional, and perceptual responses which will drive consumer preferences and consumption decisions (Javor et al., 2013). Therefore, direct measurement of the brain response to marketing stimuli has emerged to predict and potentially influence consumer behaviour and decision-making (Cherubino et al., 2019). These measurements can be achieved through neuroimaging, which encompasses the measurement of the structure and function of the brain (Cherubino et al., 2019). Researchers in marketing and business have increasingly adopted functional neuroimaging to understand the types of marketing stimuli which can produce the most favourable response in consumers.
Functional magnetic resonance imaging (fMRI) and electroencephalography (EEG) are methods of neuroimaging which have largely gained popularity within the field of consumer neuroscience (Bazzani et al., 2020; Cherubino et al., 2019; Prakash & Reddy, 2021a). The most common neuroscience technique adopted in consumer research is fMRI, and as such, existing reviews in neuromarketing have most often outlined the benefits, limitations, and methods of fMRI (Harris et al., 2018; Levy & Glimcher, 2012; Reimann et al., 2011; Smidts et al., 2014). fMRI takes measurements of the small changes in blood flow throughout the brain via the application of strong magnetic fields. This can be used to decipher brain activity because greater blood flow within a particular brain region can indicate neural activity within that region (Glover, 2011). While fMRI allows a spatially accurate measurement of brain activity, its application is limited due to its high cost and invasiveness. Furthermore, fMRI can only track neural activity over the course of several seconds, limiting its ability to identify short-lasting but significant neural responses (Burle et al., 2015; Glover, 2011). This poor measurement accuracy over time, referred to as temporal resolution, is because changes in blood flow are relatively slow. This is an important consideration as a marketing-relevant stimulus and the contingent neural activity related to the consumer’s response may occur over fractions of a second (Fortunato et al., 2014; Prakash & Reddy, 2021b; Vecchiato et al., 2011).
On the other hand, EEG measures changes in electrical activity at the surface of the brain via the application of several electrodes on the scalp (Henry, 2006). This technique is significantly less costly and invasive in comparison to fMRI. However, to date, a comprehensive review of the practical application of the EEG method to consumer and marketing research is lacking. Instead, studies have more often focused on the fMRI technique (Harris et al., 2018; Levy & Glimcher, 2012; Reimann et al., 2011; Smidts et al., 2014). However, fMRI as a method is costly to utilize and researchers are often met with physical accessibility constraints. In contrast, EEG is becoming increasingly accessible. The advent of wireless and portable EEG technologies offers the potential to gain insight into consumer behaviour that is more translational to real-world settings. However, EEG is limited in its ability to identify the exact location of neural activity to the extent that fMRI can (Burle et al., 2015). The spatial resolution of EEG is limited due to the source of electrical activity being several centimetres below the scalp electrodes which are used to record the activity, passing through several cortical layers and the skull to reach the electrodes (Babiloni et al., 2001; Burle et al., 2015; Nunez et al., 1994). As a result, the signal is spatially blurred at the scalp due to volume conduction of the EEG signal (Burle et al., 2015).
Furthermore, the EEG signal represents the summation of electrical activity in cortical neurons, and therefore, the determination of activity within subcortical regions of the brain can be difficult (Seeber et al., 2019). However, real-world behaviour such as decision-making, which is applicable to consumer and marketing research, involves the integration of complex activity throughout a vast neural network, and hence interpretation of spatially precise activity can be overwhelming to researchers trying to understand the neural responses to marketing stimuli (Cherubino et al., 2019; Ladouce et al., 2017; Varela et al., 2001; Ward, 2003). Therefore, the summed activity in EEG may be sufficient and, in some cases, can be advantageous in terms of the ability to interpret neural responses to a marketing stimulus. Furthermore, the application of EEG is beneficial in terms of its temporal resolution due to changes in electrical activity at the scalp being a direct consequence of post-synaptic potentials in cortical neurons (Bazzani et al., 2020). Consequently, EEG offers the ability to track neural responses over the course of milliseconds, which is in direct contrast to the relatively slow changes in blood flow that fMRI indexes. This can be useful in identifying the neurophysiological correlates which occur immediately in direct response to stimuli such as advertisements (Bazzani et al., 2020). In particular, EEG offers a robust measurement of sensory and cognitive processing, which occurs over a short duration of time after the presentation of a stimulus (Sur & Sinha, 2009).
Despite the significant insights that can be gained through EEG and the analysis of event-related potentials (ERPs), there is little detail on this in the neuromarketing literature. Furthermore, EEG has increasingly been employed in neuromarketing research, but these data have often been over-interpreted, and their value to consumer neuroscience has also often been under-appreciated. It is critical for any field of research to encourage the adoption of innovative methods and at the same time, guide them to design appropriate research that is suitable for the specific methodology. However, to our knowledge, the current literature on neuromarketing does not provide researchers with clear and accurate guidance on how to conduct EEG and ERP research and its potential in measuring specific consumer psychological mechanisms (Lee et al., 2018). Therefore, the current paper provides a practical and introductory guideline for the use of EEG in marketing and consumer research.
Neuromarketing versus traditional marketing research methodology
Traditional methods such as interviews, surveys, questionnaires, and focus groups have been widely used in marketing and consumer behaviour studies (Aldayel et al., 2020; Kwak et al., 2011). However, the results of such studies may be biased as they depend entirely on self-reporting or the expression of their conscious experiences and ideas (Amin et al., 2020). Self-report relies on the assumption that participants provide accurate and honest subjective responses. These responses must therefore be memorable and conscious to the participants. Psychophysiological methods, on the other hand, can be used to objectively measure both conscious and unconscious mental processes. Moreover, self-report measures are not capable of providing an objective measure of how the brain processes and responds to marketing stimuli (Carrington et al., 2014; Lucas, 2018; Plassmann et al., 2012). Therefore, relying on traditional methods may generate inaccurate and unreliable results. In contrast, neuromarketing techniques overcome the disadvantages of the conventional methods by measuring the underlying neurological processes of consumers’ subconscious and short-time decisions (Aldayel et al., 2020; Amin et al., 2020).
Given the objective characterization of neural activity captured by neurophysiological methods, EEG can provide information relating to consumer preferences that cannot be obtained through traditional consumer research methods (Ariely & Berns, 2010). This is particularly important as decision-making involves a range of conscious and unconscious processes (Newell & Shanks, 2014) and it has been demonstrated that consumers often cannot consciously explain their reasons for purchasing a specific product (Zaltman, 2003). Thus, the measurement of subconscious activities of the brain can provide more accurate measures of consumer processing and preferences in comparison to traditional methods (Agarwal & Dutta, 2015). Among neuromarketing techniques, EEG is relatively less invasive and less expensive when compared to other neuromarketing and neuroimaging techniques. Specifically, EEG measures brain activity on the scalp’s surface. Recent technological advances in EEG equipment have also made EEG and ERP measurements available in the form of portable and wireless headsets (Amin et al., 2020).
Despite the accessibility of EEG, previous reviews have primarily focused on comparing the capabilities and drawbacks of different neuroscience or neuroimaging methods. Furthermore, these reviews are mostly related to management, organizational research, and leadership (e.g., Becker et al., 2011; Butler et al., 2017; Senior et al., 2011; Waldman et al., 2011). Thus, the existing literature lacks a specific and practical guide on the application of EEG and ERP in marketing and consumer behaviour studies. Most previous studies have provided valuable findings related to neuromarketing designs and modalities; however, they have considered neuromarketing as a macro concept without focusing on specific methods or identifying the best method for consumer behaviour research (e.g., Lee et al., 2018; Lim, 2018). For instance, Lim’s review (2018) demonstrated how business-to-business marketing could be advanced using a neuromarketing approach, but it lacks a thorough review and practical guidelines of EEG or ERP application.
Compared to other neuroscience or neuroimaging methods, the high temporal resolution (milliseconds) of EEG may provide the most appropriate neuroscience method to study human decision-making and consumer studies (Heekeren et al., 2008; Lin et al., 2018). For instance, techniques such as graph-theoretic analysis of EEG data have been used to classify individuals’ emotional states while they are watching music clips and the approach was accurate in classifying moment-by-moment affective states (Gupta et al., 2016). Another study achieved high accuracy in using EEG to understand consumers’ emotional reactions to an advertisement according to their theta power signals (Avinash et al., 2018). Furthermore, the EEG-based hyper scanning technique provides an opportunity to measure dynamic brain activities, which may provide insights into consumers’ socio-affective interactions and the neural mechanism of information processing (Hasson et al., 2012).
Of particular relevance to neuromarketing, ERP analysis may provide a more granular neurological index of consumer behaviour (Bazzani et al., 2020). ERPs reflect the accumulated activity of postsynaptic potentials, which are produced when a large number of similarly oriented cortical neurons fire in synchrony in response to stimuli (Peterson et al., 1995). ERPs have been used in marketing studies to provide potential avenues for consumer behaviour studies (for a review, see Shiv et al., 2005). For example, Schaefer et al. (2016) used EEG to measure the neurological correlates of consumer behaviour and found that an ERP component known as the feedback related negativity potential is related to price evaluation and buying decisions. They also found that the P300 ERP component positively increases when consumers are offered a price cheaper than their expectation, suggesting that the feedback related negativity and P300 may be used to better understand price promotion and discount. Zhao et al. (2015) have also applied ERPs to examine the emotional valence of services. Their findings indicate that services with high emotional value evoke a larger late positive potential (LPP) component, suggesting that positive emotion or motivation may be measured using the LPP amplitude in the left frontal regions. ERPs also have the potential to be widely used in marketing research as a reliable neural indicator of brand association (Camarrone & van Hulle, 2019), in-depth decision making (Mansor et al., 2021), purchase intentions (Zubair et al., 2020), and green purchase behaviour (Jing et al., 2022).
Against this backdrop, practical guidance on EEG and ERP can contribute significantly to the literature by guiding researchers to conduct efficient and effective neuromarketing research. Thus, the purpose of this practical review of relevant literature is to outline how EEG has been used in both the psychophysiology and consumer neuroscience literature. In this paper, we will also outline methodological guidelines for the application of EEG and ERP so that these neuromarketing methods may be more accessible to marketing researchers. We also highlight potential avenues for future research in the application of EEG and ERP in marketing and consumer studies.
Collecting electroencephalography and event-related potential data
EEG is normally collected by electrodes located on the surface of the scalp. Electrodes either apply directly to the scalp or through an EEG head cap worn by respondents. Electrodes are most often placed on the scalp according to the International 10–20 system (Seeck et al., 2017), which standardizes electrode placement to ensure specific electrodes are recording data over a particular brain region (Figure 1). The 10/20 system nominates electrodes based their location on the scalp (Jurcak et al., 2007). The positions of the electrodes show two landmarks: nasion and inion. Nasion represents the area between the eyes and above the nose, whereas inion indicates the protrusion of the occipital bone in the base of the skull at the back of the head (Jurcak et al., 2007). The electrodes record the voltage of brain electrical activity (Bazzani et al., 2020). After collection, EEG data need to be pre-processed, which can be done either homogeneously or by using analysis toolboxes (see below for more details; for a review, refer to Delorme and Makeig (2004). International 10/20 system (Seeck et al., 2017).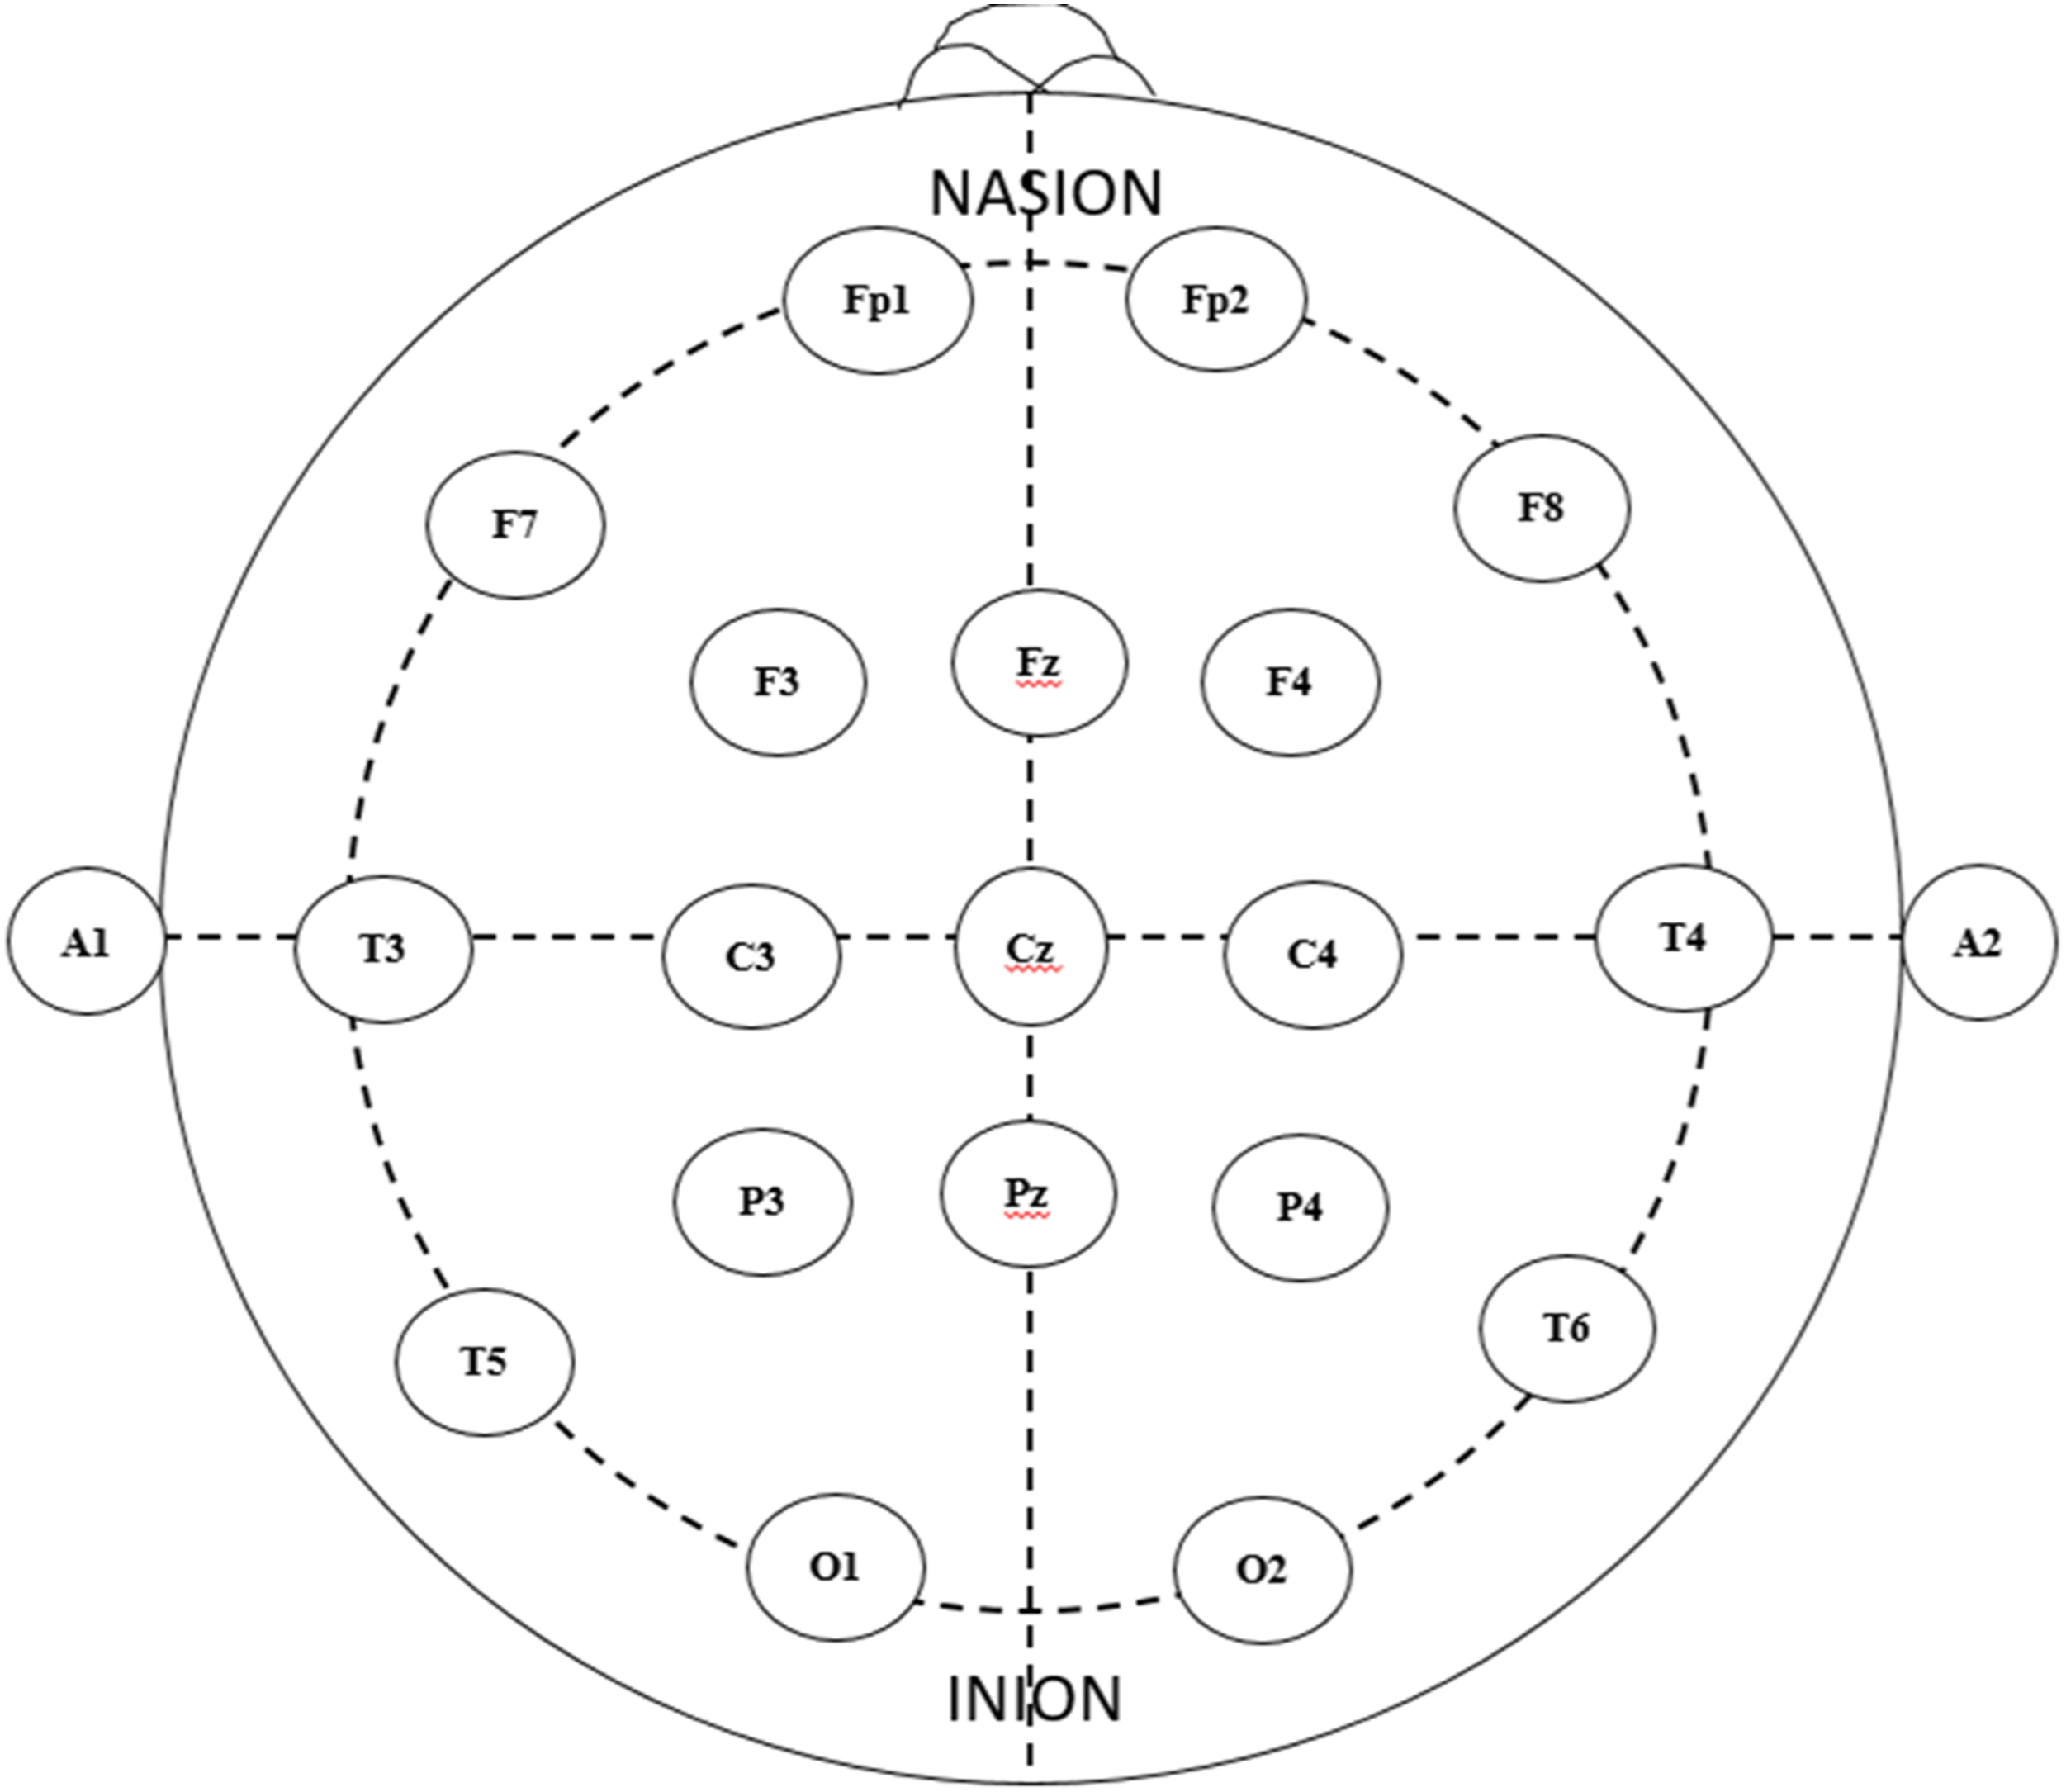
EEG systems most often have at least 64 channels (Montoya-Martínez et al., 2021), but this number can range from as few as four channels to as many as 256 channels in high-density electrode arrays (Lau et al., 2012). When a higher number of electrodes are used, they are typically contained within a cap or mesh, which aids in the application of electrodes to the scalp. While “dry” EEG systems which do not require conductive gel or paste to be applied between the scalp and electrodes exist, these are often prone to signal degradation due to electrical impedance at the scalp (F. Wang et al., 2016). Therefore, conductive gel or paste is usually applied underneath electrodes to reduce impedance and allow greater signal stability. Electrodes may also be placed around the eyes to detect ocular movements that produce artifacts in the EEG signal that should be removed. While artifacts produced by ocular movement can be minimized during processing of EEG data, experiments should be designed to limit the need for eye movements to prevent the occurrence of these artifacts.
There are a number of other factors for researchers to consider when designing experiments using EEG, in addition to the prevention of ocular-related artifacts. For example, experiments should be designed to be compact yet rigorous, using appropriate group randomization or counterbalancing in repeated-measures designs. These experiments should also allow for causal hypotheses to be posed and tested, rather than associative ones (Herrmann et al., 2016; Lim, 2021). Neuromarketing experiments are often resource-intensive when compared with traditional marketing research methods and therefore, data and resource maximisation should be prioritized in neuromarketing research. Lim et al. (2019) recommend data partitioning to aid in resource efficiency in business and marketing research. For example, market segments can be stratified across experimental conditions, which may be useful in enhancing the informational value of data. In addition, when recording EEG during an experimental session, event markers should be registered with the EEG system so that analyses can be time-locked to the occurrence of particular events. It should also be considered that EEG analyses typically require many trials to attain sufficient statistical power to detect the small changes in electrical voltage in the EEG signal which are of interest. ERPs at the single-trial level inherently contain a large amount of noise relative to the signal of interest, meaning experimental manipulations must be repeatedly presented a significant number of times and averaged to isolate the desired signal from background noise (Hajcak et al., 2011). The exact number of trials required varies, depending on the research question being addressed and the type of analyses being employed, but can range from 35 –to 1000 trials per experimental condition (Woodman, 2010b). If a sufficient number of trials cannot be obtained for practical reasons, experimenters may choose to collect fewer trials from a larger number of participants.
Data processing
Once EEG data have been recorded, they can be processed using freely available software such as EEGLAB (Delorme & Makeig, 2004) or Fieldtrip (Oostenveld et al., 2011) toolboxes. Pre-processing of EEG data largely involves the removal of artifacts and noise from the signal. As a consequence of EEG electrodes being spatially close to the forehead, jaw, eye, and eyelid muscles, undesired electrical activity may be recorded from these muscles, producing artifacts in the EEG signal, potentially masking the cortical activity which is actually of interest. Hence, pre-processing of EEG data primarily aims to remove these artifacts. If data from any channels are of poor quality, these data may be interpolated (Courellis et al., 2016). The EEG data may also be down-sampled to reduce file size and computational load (P. J. Allen et al., 2000; Weber et al., 2017). Down-sampling may also assist in artifact rejection via independent component analysis by removing high-frequency noise (Bigdely-Shamlo et al., 2015). However, if conducting spectral analysis (see below), the sampling rate should be maintained at least 2.5 times that of the highest frequency one intends to analyse to avoid aliasing (Srinivasan et al., 1998). Low-pass filters should also be applied before down sampling to avoid aliasing (P. J. Allen et al., 2000; Bigdely-Shamlo et al., 2015). Furthermore, the sampling rate should be kept at a high enough rate that the temporal dynamics of the EEG signal can be maintained.
Prior to analysis, independent component analysis may be used to detect and reject blink artifacts, horizontal saccades, and other artifacts present in the EEG signal (Glass et al., 2004; Palmer et al., 2011; Pion-Tonachini et al., 2019). However, it is difficult to completely remove artifacts from the EEG signal without affecting the actual signal of interest (Woodman, 2010b). Therefore, trials and participants with excessive noise and artifacts may be considered for exclusion from analysis. Signal processing may include detrending, electrode re-referencing (Hu et al., 2019; Yao et al., 2019), removal of line noise using a notch filter, creating epochs of time-points of particular interest, and low- and high-pass filtering (Bigdely-Shamlo et al., 2015; Weber et al., 2017; Winkler et al., 2015; Woodman, 2010b). The extent to which low-pass filters are applied to data depends on the type of analysis being employed. If the ERP peak amplitude or peak amplitude latency are of interest, low-pass filters should be used sparingly as they can impair the accuracy of peak voltage measurements (Woodman, 2010b). In addition, if the spectral content of the EEG signal is of interest, time-frequency decomposition may be applied to the data via a short-time Fourier transform or wavelet transform before analysis (Bruns, 2004; Cohen, 2014; le Van Quyen et al., 2001). A flowchart of steps involved in the processing of EEG data is presented in Figure 2. Flowchart of EEG data processing and analysis.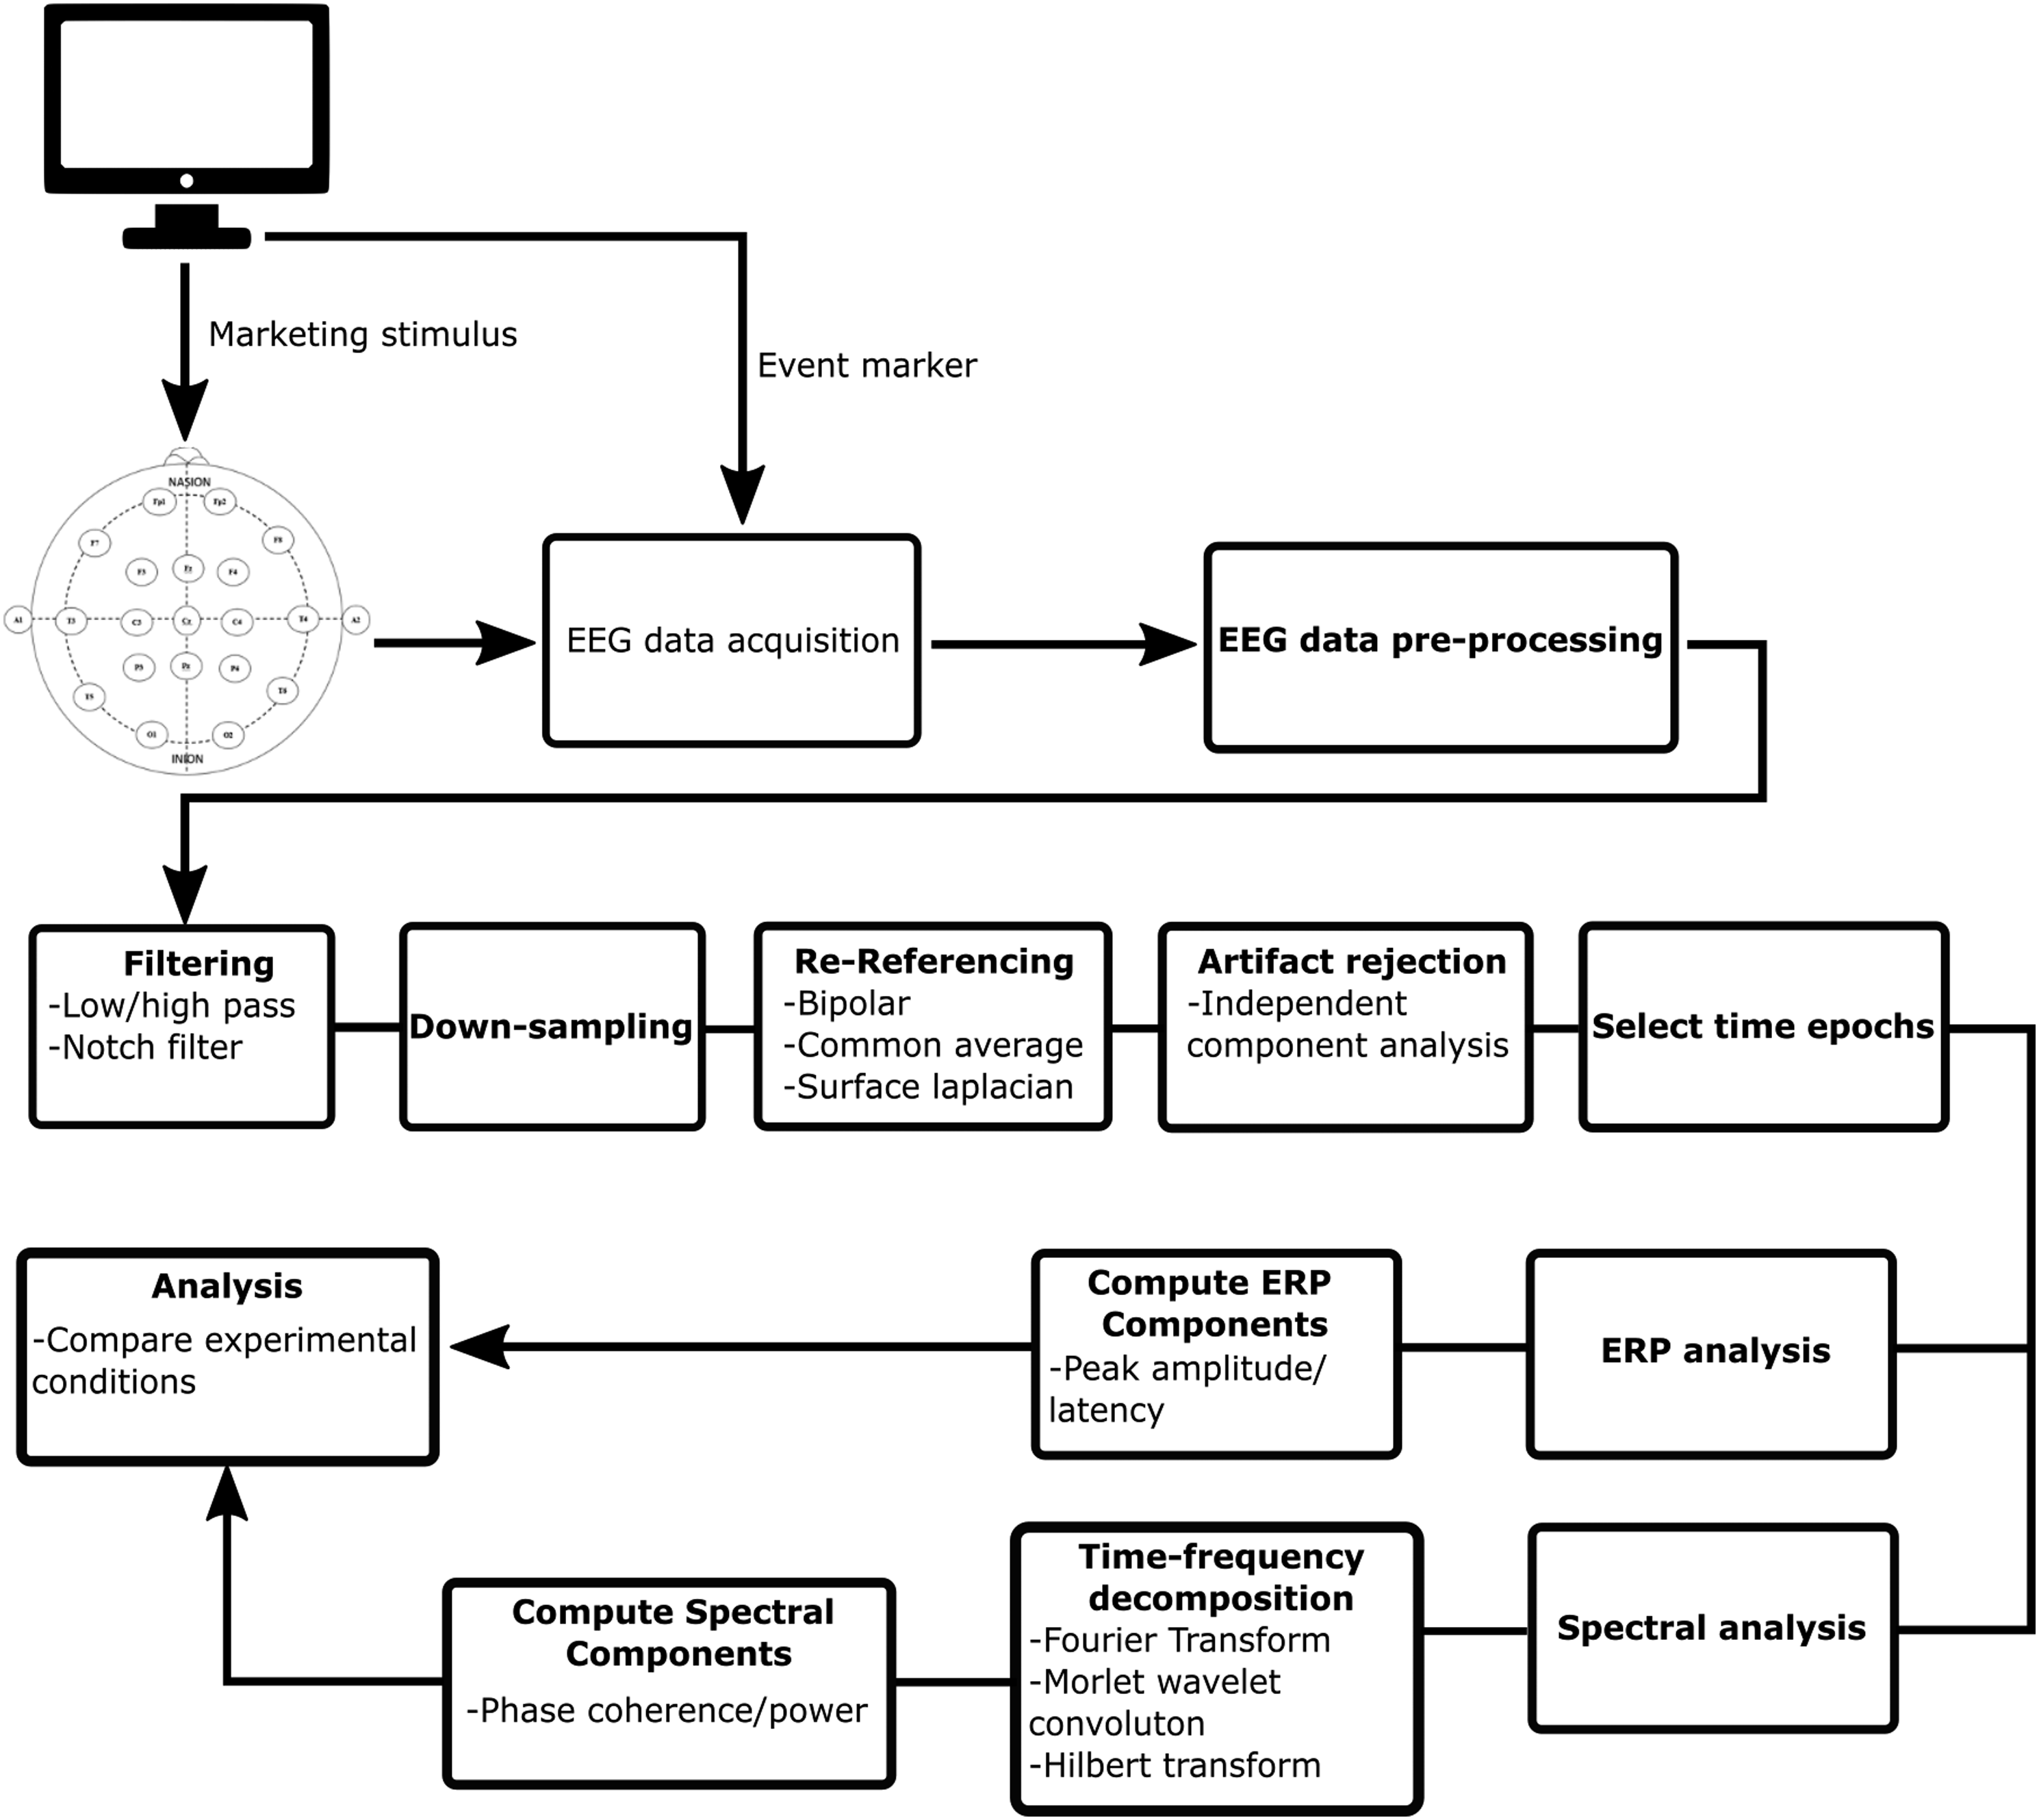
Methods of analysing electroencephalography data
Data analysis considerations
At the conclusion of the processing of EEG data, they can be subject to analyses. When analysing ERP responses, there are multiple methods that may be utilized and the techniques employed in ERP analyses have evolved significantly over their long history (Woodman, 2010a). Once data have been averaged across each condition, the peak amplitude of an ERP component may be measured and compared between conditions. Alternatively, the latency of the peak amplitude may be examined. However, the peak amplitude of an ERP can be distorted by high-frequency noise, as well as filtering (Woodman, 2010a). Furthermore, the ERP component peak amplitude latency may be less informative in comparison to the onset or offset of the ERP component (Luck, 2005; Miller & Hackley, 1992; Renault et al., 1982; Woodman, 2010b) and components of an ERP response may overlap, making it difficult to determine the neurocognitive basis of a peak amplitude value (Näätänen et al., 1978; Näätänen & Michie, 1979). However, ERP components and subcomponents may be isolated from one another by comparing responses at different scalp locations and examining unique cortical distributions which are known to be related to specific ERP components (Coles et al., 1988; Woodman, 2010b). For example, whilst being temporally overlapped, subcomponents of the N100 can be differentiated from one another based on their scalp location (Luck, 2005). Therefore, interpretation of task-specific ERP responses can be aided by examining any modulation of the N100 subcomponents over different scalp locations.
In contrast to examining ERP component peak amplitudes, other methods of ERP analysis include the examination of mean amplitude over a given time window (Luck, 2005). This time window may be set based on a theoretically expected time window for a particular ERP component (Luck, 2005). However, similar to the measurement of ERP peak amplitudes, this method may also be impacted by overlapping ERP components if the time window is not set appropriately (Zhang et al., 2020). This issue may be avoided by calculating the mean signed area amplitude, which only takes positive or negative samples (relative to baseline) in its calculation of mean amplitude (Luck, 2005; Zhang et al., 2020). This avoids amplitude calculations being skewed by overlapping components as it does not use samples of the opposite polarity in its calculations, thereby limiting the calculation to samples that are in accordance with a particular component. Along with ERP amplitude, which represents the magnitude of neural response, the latency of an ERP can be examined to determine the speed of the neural response. The latency of ERP components can be examined by calculating the time point at which the amplitude of the signal exceeds a given threshold of its total amplitude within a particular time window (known as the fractional-area latency; (Woodman, 2010a)). For example, the time point at which the signal exceeds 25% of the area under the voltage curve, within a theoretically defined time window, may be calculated and compared between experimental conditions as a means to examine any modulation of ERP onset. Finally, an effective method of examining the modulation of neural activity induced by experimental conditions is the calculation of difference waveforms. If one expects an enhanced neural response in ‘Condition B’ in comparison to ‘Condition A’, then subtracting the EEG voltages in condition A from condition B will determine the magnitude of neural modulation induced by the manipulation in condition B (Luck, 2005).
When analysing the spectral content of the EEG signal, there are multiple methods that may be employed, depending on the research question and hypotheses. Analyses within the time-frequency domain often examine the phase synchrony or power within a particular bandwidth. For example, when activity recorded over multiple EEG electrodes show high phase synchrony, it is believed that the relative cortical regions are engaged in communication with one another (Cohen, 2014). Subsequently, greater inter-site phase clustering within a particular bandwidth for an experimental condition can indicate a greater degree of cortical connectivity (Cohen, 2014). When examining phase coherence between multiple electrodes, volume conduction should be accounted for using methods such as a surface Laplacian transform (Kayser & Tenke, 2015). In addition, coherence across trials within a particular bandwidth at a given electrode location may also be examined and compared between experimental conditions (Cohen, 2014). This may indicate the extent of cortical phase synchrony that is evoked by an experimental stimulus. Similarly, the power of a particular frequency band at a given electrode location can be determined to examine changes in oscillatory frequency power evoked by a stimulus and compared between experimental conditions (Cohen, 2014).
Event-related potentials
After pre-processing, the EEG signal can be analysed in multiple ways in order to interpret the sensory and cognitive processing which occurs subsequent to the presentation of a stimulus. One such method, the ERP, is determined as the averaged amplitude of the EEG signal, time-locked with respect to the occurrence of a particular event (Luck, 2005). The summed synchronous activity of neurons during a sensory or cognitive event produces a series of positive and negative voltage deflections in the EEG signal. These deflections of voltage represent underlying components of information processing (Luck, 2005). As such, ERPs can be separated into several components, with early components (latencies < 100 ms) representing the activation of sensory processing of the stimulus features and later components representing cognitive processing related to the event (Sur & Sinha, 2009).
ERP components are named according to their polarity and approximate latency. For example, commonly analysed components include the N100 (a negative component peaking at approximately 100 ms after an event), P100 (a positive component peaking at approximately 100 ms after an event), P200, N200, P300, and the N400 (Sur & Sinha, 2009). Several components can further be separated into a number of subcomponents that contribute collectively to the component peak, and different subcomponents can be observed within the same time period at different locations on the scalp. For example, approximately 100–150 ms after the occurrence of an event, an N1 subcomponent can be observed to peak at electrodes that are anterior on the scalp. However, two additional N1 subcomponents can be observed to peak approximately 150–200 ms after the occurrence of an event, with one of these subcomponents taking place in the parietal cortex and another in the occipital cortex (Luck, 2005). While all three of these subcomponents are influenced by spatial attention and contribute to the overall amplitude of the N100 response (due to signal averaging and volume conduction), their individual amplitudes can be impacted differentially depending on task demands (Hillyard & Anllo-Vento, 1998). Therefore, modulation of different ERP subcomponents may provide further insights regarding cognitive processing in response to different stimuli. ERP responses are often analysed by comparing the averaged signal amplitude for a given experimental condition with that of a different condition (Luck, 2005). However, lateralised activity may also be determined by examining the difference between activity at an electrode on the left side of the scalp with that on the right side of the scalp (Luck, 2005).
The event-related potential components
Examination of the amplitude and latency of ERP components between experimental conditions can indicate facilitation or inhibition of particular sensory and cognitive processes evoked by the experimental manipulation(s). In response to visual stimuli, the P50 and N50 have been associated with visual stimulus processing (Pratt, 2011). In addition, the P100 has been associated with sensory and perceptual processing (Pratt, 2011). Along with perceptual processing, the N100 has been associated with image recognition and visual discrimination (Hillyard et al., 1998; Vogel & Luck, 2000). The P200 is also associated with perceptual processing, which can be modulated by attention (Lijffijt et al., 2009). Furthermore, the P200 is associated with memory and recognition (Lijffijt et al., 2009; McEvoy et al., 2001). The N200 has been associated with stimulus recognition, identification, and classification (Folstein & van Petten, 2007; Patel & Azzam, 2005). Furthermore, the N200 is apparent when an individual detects an unusual stimulus, referred to as mismatch negativity (Folstein & van Petten, 2007; Sutton et al., 1965), or when exerting cognitive control such as overcoming a habitual response (Azizian et al., 2006). Finally, the P300 is reflected in cognitive processes related to stimulus evaluation and decision making (Polich, 2011). For example, the P300 has been associated with shifts of attention due to changing environment and the processing of novel information or surprise (Levi-Aharoni et al., 2020; Polich, 2011). In addition, the P300 component can also be indicative of how demanding a task is on an individual’s cognitive resources (Takada et al., 2019).
Spectral analysis
The ERP has been extensively studied as an indicator of attention, emotion, memory, and language processing. In addition to the analysis of ERP components, the EEG signal can also be subject to spectral analysis. This involves the analysis of the oscillations of neural activity at different frequencies in the EEG signal (Cohen, 2014). The raw EEG signal contains a spectrum of frequencies that can be decomposed to reveal the power and phase synchrony of neural oscillations within particular frequency bandwidths (Cohen, 2014; Roach & Mathalon, 2008; Sanei & Chambers, 2007; Varela et al., 2001). Changes in these oscillations over time are used to characterize the brain’s processing of information in response to task events. The amplitude and coherence of neural oscillations are typically analysed within one of five bandwidths: 0.5–4 Hz (delta), 5–7 Hz (theta), 8–14 Hz (alpha), 15–30 Hz (beta), and 30–50 Hz (gamma) (Harris et al., 2018). Changes in the amplitude within a particular frequency band can indicate sensory or cognitive processing, and oscillatory coherence between multiple electrode locations within a particular frequency band can indicate a potential interaction between different cortical areas (Cohen, 2014; Klimesch, 1996).
Analysis of oscillatory activity within different frequency bands can be used to indicate the extent to which subjects are engaging in particular cognitive processes. For example, attention, perception, and some aspects of memory are associated with activity in the alpha band (Clarke et al., 2019; Klimesch, 1997, 2012). However, Astolfi et al. (2008a) found an increase of activity in all frequency bands when viewing advertisements that were remembered in comparison to ones that were not remembered. In addition, activity in the beta band is suggested to increase during decision-making and problem solving (Alfimtsev et al., 2015), and theta activity is related to the difficulty of a decision (Jacobs et al., 2006). Emotional processing has been associated with activity in the gamma and theta frequency bands (Putman et al., 2014; Rao et al., 2012; Yang et al., 2020), and the experience of pleasure and interest when viewing advertisements has been associated with activity in the theta band (Guixeres et al., 2017).
The application of electroencephalography and event-related potential in marketing and consumer research
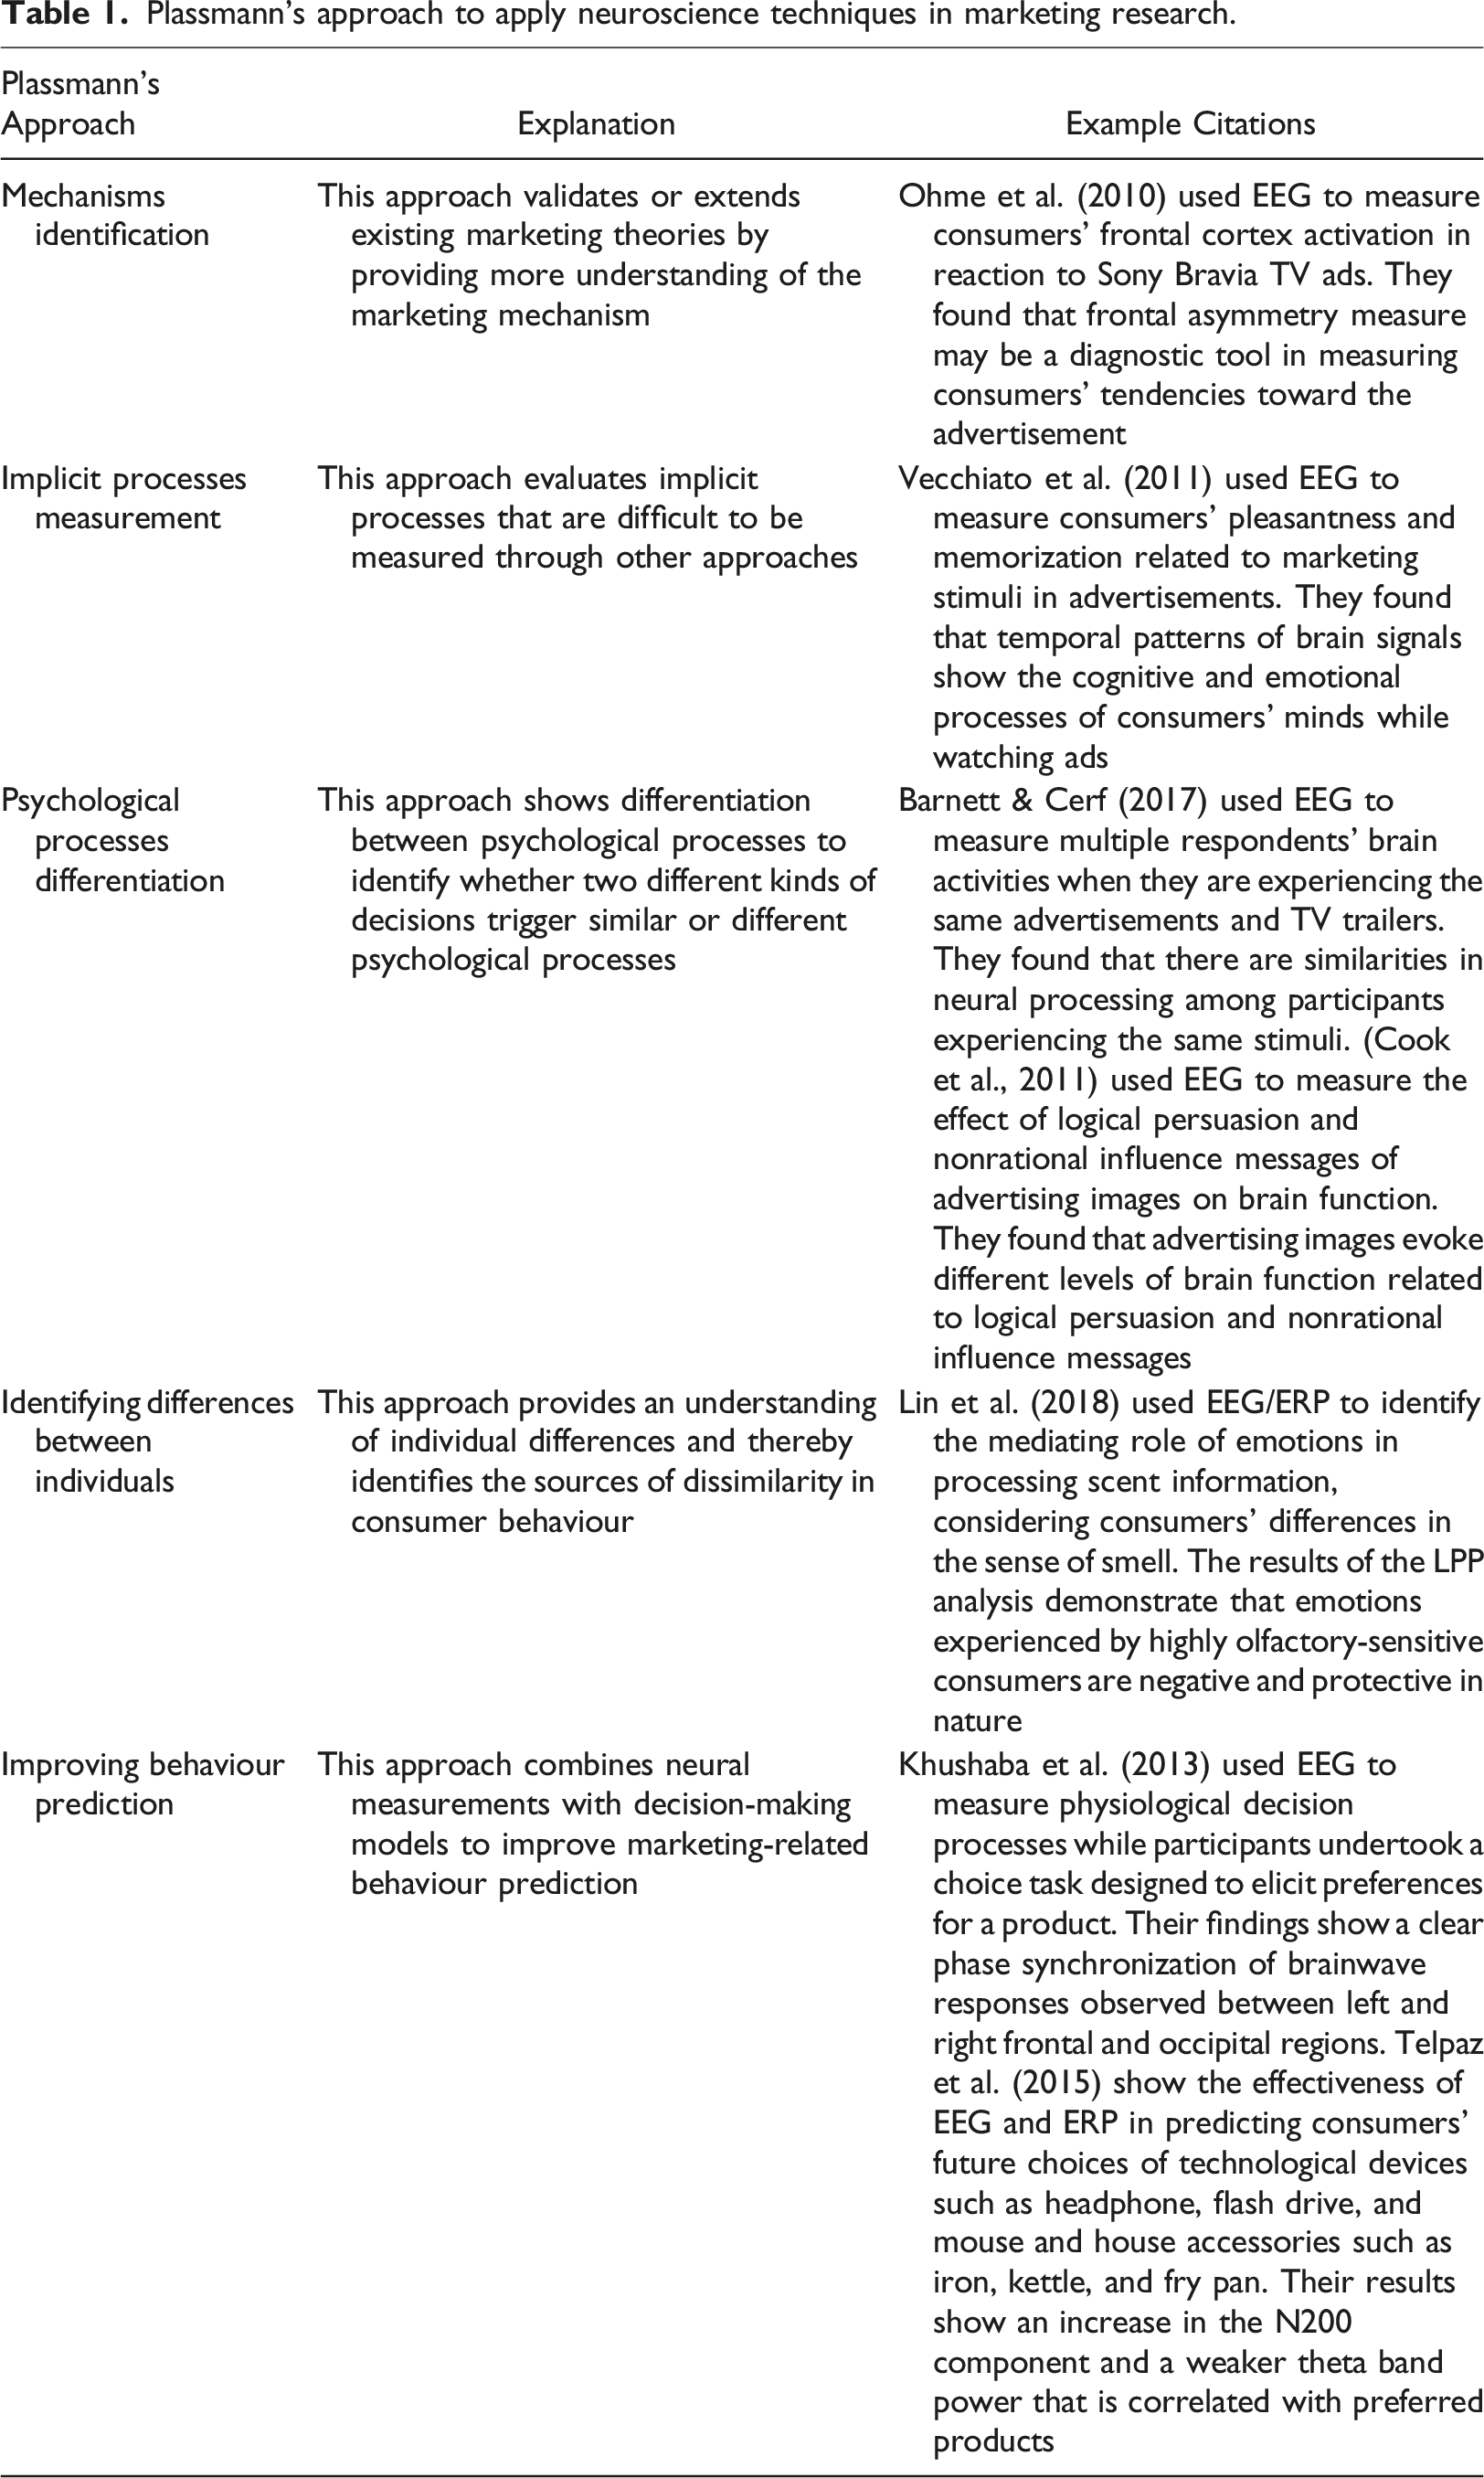
Plassmann’s approach to apply neuroscience techniques in marketing research.
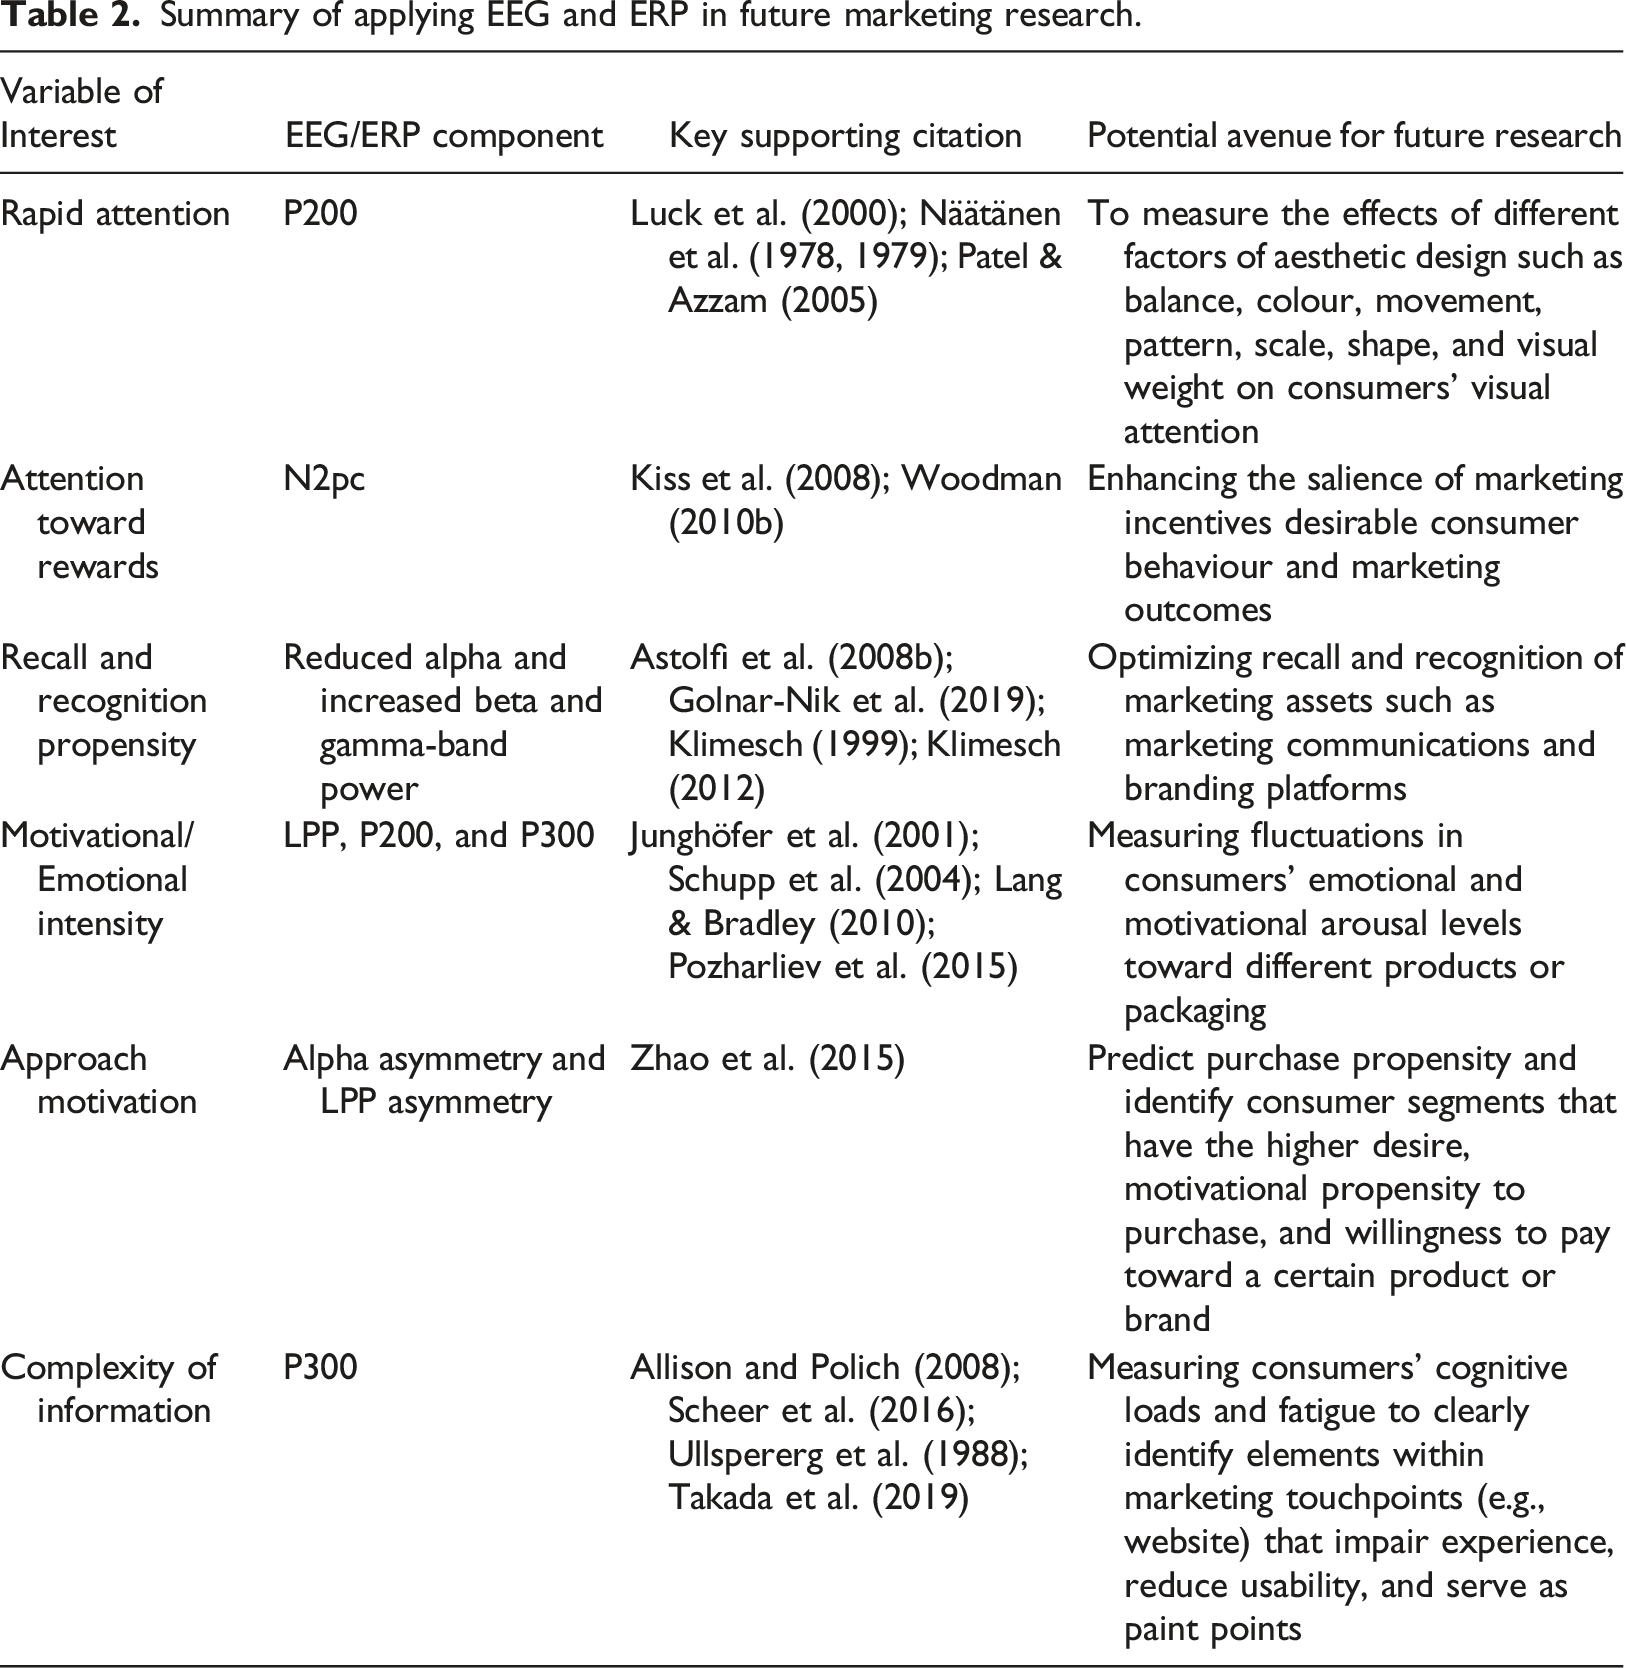
Summary of applying EEG and ERP in future marketing research.
Attention processes
Whilst EEG has largely been adopted by medical practitioners in order to identify and diagnose conditions such as epilepsy and sleep disorders (Tatum, 2021), EEG has shown a broad range of applications in a variety of research disciplines. One such area of investigation is the examination of the neurocognitive mechanisms underlying attention. For example, ERPs have been used to demonstrate how the processing of sensory characteristics may be modulated by both voluntary and involuntary allocation of attention (Luck et al., 2000). Of relevance to neuromarketing, ERPs may also be beneficial in identifying the types of stimuli that are more likely to capture an individual’s attention. However, care should be taken when comparing different experimental stimuli in EEG experiments, as EEG responses can be easily influenced by physical stimulus characteristics rather than cognitive processes, which are more likely to be of interest. For example, different neural responses can be evoked depending on the physical characteristics of a stimulus, such as colour or luminance (Johannes et al., 1995).
Despite difficulties in separating experimental confounds from the measurement of attention, the allocation of attentional processes has been successfully studied throughout neuroscience literature. The early stages of attentional allocation involve rapid automatic processing, which can be reflected in the early components of the ERP. In particular, the P200 component has extensively been examined in its relation to the rapid automatic deployment of attentional resources to different stimuli (Luck et al., 2000; Näätänen et al., 1978; Patel & Azzam, 2005; Risto, 2018). For example, examination of the P200 in frontal areas has revealed a “negativity bias” for which negative or unpleasant information evokes a greater automatic attentional response, reflected in an enhanced amplitude and shorter latency of the P200 component (Carretié et al., 2001). This may serve as an evolutionary advantage in automatically deploying attention rapidly to potentially threatening stimuli (Bublatzky & Schupp, 2012; Carretié et al., 2001).
Applying Plassman et al.’s (2015) mechanism identification and implicit measurement approach, EEG can be used to assess the types of stimuli that garner attention more readily, especially toward disliked brands (Handy et al., 2010) and visually unappealing items (X. Wang et al., 2012). For instance, the P200 component is enhanced when the negative characteristics of a product are emphasized prior to its presentation in an online shopping environment in comparison to when their positive characteristics are emphasized (Jin et al., 2017). P200 is also an indicator for assessing design aesthetics (Shi et al., 2021). Therefore, from a managerial perspective, the P200 can be beneficial in evaluating customers’ attention toward a product or packaging design with high intensity of affective valence. In addition, following Plassmann et al.’s (2015) behavior prediction approach, P200 can be applied in understanding consumers’ attentional responses toward danger cues such as safety signs or safety recommendations and providing predictions for compliant behaviour (Bublatzky & Schupp, 2012). Similarly, reductions in the P300 amplitude to threatening health messages have been suggested to indicate defensive attentional disengagement with these messages (Kessels et al., 2010). Along with identifying the types of marketing stimuli which evoke greater attentional responses, ERPs may provide insights to pressing consumer and marketing issues, such as the intention-behaviour gap (see Lim and Weissmann (2021) for review). For example, individuals who are high in intention for condom use but low in their actual condom use (intention-behaviour gap) show a reduced P300 amplitude to relevant health information in comparison to individuals who are intention-behaviour consistent (Brüll et al., 2019). This was suggested to indicate that individuals with an intention-behaviour gap are likely to disengage attentional processes to this health information. As such, this can be beneficial in understanding processes underlying psychological phenomena relevant to marketing and consumer research, as well as enabling further behavioural prediction.
The latency of the N2pc subcomponent has also been used to show that faster shifts of attention can be elicited by stimuli that are associated with reward (Kiss et al., 2008). This may be beneficial to neuromarketing in not only identifying the attentional shifts associated with different marketing stimuli but also the level of reward associated with the stimulus. Moreover, the N2pc subcomponent has been indicated to be more sensitive to the presence of a stimulus than behavioural report (Woodman, 2010a), further highlighting the utility of neuroscience techniques in understanding responses to marketing stimuli. Applying Plassmann et al.’s (2015) five approaches, N2pc analysis may provide novel avenues for marketing researchers and practitioners to fully understand the reward process of consumers’ purchasing decisions and how they can be influenced by optimized by rewarding incentives or promotions. N2pc is also useful in food-related studies as it is spurred by hunger (Ilse et al., 2020). Therefore, N2pc can be used in marketing research, especially in food-related studies, to better understand the factors, attributes, and even marketing strategies that enhance attentional processes sensitive to reward and intrinsic motivations.
Along with ERP analysis, the spectral content of the EEG signal may be indicative of attentional processes. Reduced alpha-band power, reflective of alpha desynchronization, has been long known to be associated with the activation of attentional processes, and evoked alpha activity in response to mobile phone advertisements has been used to predict future purchase decisions (Golnar-Nik et al., 2019; Klimesch, 1999, 2012). Furthermore, increases in beta and gamma-band power have been observed during the viewing of television advertisements that are remembered in comparison to those that are not remembered (Astolfi et al., 2008a). While this may be indicative of the activation of processes important for memory, it is also important to consider the possibility that this is reflective of greater attentional allocation to the remembered advertisements, which subsequently led to improved recall. Aligning will Plassmann et al.’s (2015) implicit measurement and behavioural prediction approaches, reduced alpha and increases in beta and gamma-band power may therefore be used by marketers to objectively index consumers’ propensity of recall and recognition toward marketing assets.
Emotional processing
It should be noted that activation of neural processes relating to attention is highly interlinked with other psychological processes, such as emotional responses. Activation of neural processes related to emotion is known to modulate ERPs in several ways, and these have been a significant point of interest in the neuromarketing literature. Similar to the relation of the P200 ERP component to attentional processes, the P200 has been suggested to be modulated by the emotional content of a stimulus. As a short-latency ERP component, the P200 enhancement to emotional content may reflect a reflexive direction of attention to hedonically significant stimuli (Junghofer et al., 2001; Schupp et al., 2004). This rapid sensory processing may promote more complex processing of a stimulus’ emotional content, reflected in the enhancement of longer-latency ERP components such as the P300 and the LPP (Cuthbert et al., 2000; Pozharliev et al., 2015; Schupp et al., 2004). In particular, the LPP has been shown to be a reliable indicator of emotional processing, with an enhanced LPP amplitude to pleasant and unpleasant stimuli in comparison to emotionally neutral stimuli (Hajcak et al., 2011; Münte et al., 2000; Olofsson et al., 2008; Pozharliev et al., 2015). This activation may represent the processing of the emotional content of the stimulus as well as sustained attentional allocation to the emotionally relevant information (Bradley et al., 2007; Brown et al., 2012; Lang & Bradley, 2010; Pozharliev et al., 2015; Schupp et al., 2004). Furthermore, the extent to which the LPP is modulated may reflect the intensity of the emotional response evoked by a stimulus.
Examination of emotion-related ERP responses has been applied in neuromarketing literature to understand the effectiveness of marketing media. For example, participants who were shown a movie excerpt that positively depicted tourist attractions showed an enhanced emotional response, reflected in the LPP, to images of those tourist attractions in comparison to individuals who were not shown footage of the tourist attractions (Bastiaansen et al., 2018). Other studies using ERPs to examine emotional responses to marketing stimuli have also examined the P200 and P300 components along with the LPP. For example, the P200 and P300 amplitudes have been observed to be enhanced when presented with products that were rated as more preferred (Lang & Bradley, 2010; Pozharliev et al., 2015). Interestingly, this effect was larger when participants were in the presence of another person in comparison to when they were alone. Furthermore, the LPP was only enhanced after the presentation of luxury items in comparison to basic items when participants were in the presence of another person (Pozharliev et al., 2015). These findings suggest that there may be social-related modulations of neural responses to marketing stimuli that should be taken into consideration.
Following the behavioural prediction approach of Plassmann et al. (2015), marketing researchers can apply LPP and P300 analysis to anticipate how consumers will respond to their new product/service based on the level of their attention and emotional arousal. As LPP and P300 are both effective in measuring pleasant and unpleasant feelings (Schupp et al., 2004), future researchers can use LPP and P300 to engage in the identification of affective mechanisms, measure implicit affective processes, differentiate affective processes, and improve behaviour prediction (Plassmann et al., 2015). For instance, branding researchers can use LPP analysis to measure consumers’ responses to luxury products and their willingness to pay for them. Measuring fluctuations in consumers’ arousal levels while looking at pictures of different products or packaging also has a great potential for future studies.
While emotion-related processing can be reflected in the modulation of ERPs, it can be difficult to determine the type of emotion elicited by a stimulus. For example, both pleasant and unpleasant stimuli can evoke a similar enhancement of the LPP in comparison to emotionally neutral stimuli, making it difficult to differentiate the valence of a stimulus. Despite this, lateralized asymmetries in the brain have also been used to further understand emotional activation and provide a means to differentiate positive emotions from negative ones. The dorsolateral prefrontal cortex is a region of the brain which is thought to be implicated in the neural processes related to emotion (Davidson, 2004). Importantly, the prefrontal cortex shows hemispheric asymmetries in its activation, which is related to the valence of emotional experience (Briesemeister et al., 2013; Davidson et al., 1990; Dolcos et al., 2004; Harmon-Jones et al., 2010). The prefrontal cortex of the left cerebral hemisphere shows enhanced activity during the positive emotional experience, such as happiness (Davidson et al., 1990). Conversely, the right prefrontal cortex shows greater excitation during the negative emotional experience, such as disgust (Davidson et al., 1990; Dolcos et al., 2004). This asymmetry has been observed in the EEG signal. Decreases of power in the alpha spectral frequency indicate greater alpha desynchronization, which can in turn, indicate greater cortical activation (Davidson, 1988). Therefore, calculating the difference in alpha power between electrodes over the right and left prefrontal cortices can indicate the degree to which prefrontal cortex activity is laterally biased and potentially reveal the valence of emotion evoked by a stimulus (Cherubino et al., 2019; Davidson, 1988; Davidson et al., 1990; Pantano, 2015).
Of further relevance to neuromarketing, analysis of EEG spectral content may also have utility in identifying consumer preferences. The evocation of positive or negative emotions, as identified by this frontal asymmetry, is associated with motivation to approach or avoid a stimulus (Davidson et al., 1990). This highlights the utility of EEG in neuromarketing as a method of understanding and predicting consumer behaviour in response to marketing stimuli. Several neuromarketing studies have taken advantage of this frontal EEG alpha power asymmetry to determine the valence of emotion evoked by marketing stimuli. For example, lateralized frontal alpha activity has been used to identify gender and age differences in emotional responses to the car and chewing gum television advertisements (Cartocci et al., 2016). This approach has also been used to examine the experience of pleasantness to stimuli such as music, visual art, the taste of wine, and the smell of different olfactory stimuli (Babiloni et al., 2013; Cherubino et al., 2018; di Flumeri et al., 2016; Hsu & Chen, 2019; Maglione et al., 2017; Modica et al., 2016). The extent of positive or negative emotional states evoked during user experience tests of mobile phone applications (Chai et al., 2014) and online shopping environments (Cakar et al., 2018; Dulabh et al., 2018) have also been examined using this method. Furthermore, frontal asymmetry in the alpha band has been linked to unconscious reactions to the attractiveness of clothing (Touchette & Lee, 2017). While examination of lateralized prefrontal cortex activity has been primarily examined on the basis of EEG spectral analysis, the amplitude and latency of the LPP in frontal electrodes also appear to show hemispheric asymmetry according to the experience of positive and negative emotions (Cunningham et al., 2005). Specifically, the LPP shows an enhanced amplitude and shorter latency in the left hemisphere after the presentation of positively evaluated words, whereas this enhancement of the LPP is observed in the right hemisphere for negatively evaluated words (Cunningham et al., 2005). Therefore, examination of lateralized biases in ERP responses may also provide a valuable means of determining emotional responses to marketing stimuli.
Frontal power asymmetry and LPP asymmetry have also been successfully applied in measuring consumers’ willingness to pay associated with their expectations (Bazzani et al., 2020; Ramsøy et al., 2018; Schaefer et al., 2016). The frontal regions of the left and right hemispheres are responsible for consumers’ positive feelings (motivation approach) and negative (withdrawal approach) feelings (Touchette & Lee, 2017), respectively. For example, frontal alpha asymmetry is associated with motivation, desire, and avoidance (Touchette & Lee, 2017). Therefore, future research can apply LPP analysis to identify how marketing strategies such as brand promotions and sales can motivate consumers to pay more or less for a product. Moreover, future marketing studies can use frontal asymmetry to identify consumer segments that have a stronger desire, motivational propensity to purchase, and willingness to pay toward a certain product or brand. These fulfil Plassmann’s five approaches in utilizing neuroscience techniques to advance the field of marketing and consumer studies.
Cognitive load and effortful processing
Mental effort is a process of interest to neuromarketing as it may assist in understanding the types of product or advertising designs that may be too complicated and produce cognitive overload (Berka et al., 2007; Sanfey et al., 2003). Importantly, visual advertising effectiveness has been suggested to follow an “inverted U-curve” relationship with advertising complexity, where advertisements which demand too much or too little cognitive effort may be less effective (Bornstein & Berlyne, 1975; van Mulken et al., 2014). As such, examination of mental effort may be beneficial in identifying the optimal complexity for the transmission of information to consumers. Examining mental effort during experimental sessions may also be beneficial in identifying individual differences in an effort that is applied during an experimental task. Both analyses of evoked responses and spectral content of EEG signals have been used to examine how different stimuli may require different levels of mental effort in order to process their information.
Cognitive load may be measured via analysis of the P300 ERP component. Increases in the P300 amplitude are observed as the difficulty of a task is increased. In fact, when performing two tasks simultaneously, P300 responses to stimuli of a secondary task are decreased as the difficulty of the primary task is increased, potentially reflecting the depletion of cognitive resources (Allison & Polich, 2008; Scheer et al., 2016; Ullsperger et al., 1988). Furthermore, presenting images to participants after a difficult writing task evokes a greater N200 amplitude, which may reflect cognitive fatigue evoked by the writing task (Garrison et al., 2017). ERPs have also shown benefits in understanding mental effort in neuromarketing studies. For example, the latency of the P300 component has been used to determine the optimal complexity of information to display when designing vehicle head-up displays (Takada et al., 2019). Following the mechanism identification and implicit measurement approach of Plassmann et al. (2015), the analysis of P300 components may therefore be used in marketing research to objectively examine the understandability and complexity of an advertisement. It may also be applied in the user experience and usability discipline to measure consumers’ cognitive loads and fatigue, allowing user experience researchers to clearly identify elements and pain points within marketing touchpoints (e.g., website) that impair experience and reduce usability.
Similarly, the spectral content of the EEG signal can indicate the degree of mental effort required for a task and provide a means to assess the extent to which limited cognitive resources may have been exhausted. For example, increased theta power in frontal regions and decreased alpha power in parietal regions can indicate the level of mental effort required for a task. Calculating the ratio between parietal theta power and frontal alpha power can therefore provide a metric of cognitive load (Anderson et al., 2011; Antonenko et al., 2010; Gevins & Smith, 2003; Klimesch, 1999, 2012). For example, an increase in this ratio can be observed both as cognitive demand and mental fatigue of aircraft pilots and car drivers is increased (Borghini et al., 2014). Directly relevant to neuromarketing, García-Madariaga et al. (2020) used the theta/alpha power ratio to evaluate the mental effort required to comprehend print advertisements of increasing complexity. These findings overall indicate the utility of EEG data in understanding the optimization of products and advertisements. In marketing studies, it is argued that concurrent cognitive load has a devastating impact on consumer decision-making. However, this negative effect will be moderated once the load is reduced or removed (Dewitte et al., 2005). Consumers have been shown to differ in their choices while they are under high cognitive load (Dhar, 1996; Dewitte et al., 2005; (Allen et al., 2014; Dewitte et al., 2005; Dhar, 1996; Sivaramakrishnan & Manchanda, 2003). More importantly, cognitive load is not directly associated with the duration a consumer spends looking for products, but it is related to mental fatigue that can result in burn-out (Demerouti et al., 2002). Therefore, measurement of the theta/alpha power ratio can assist marketing researchers and advertisers in considering and reducing the effects of fatigue and cognitive load not only in their advertising but in other critical touchpoints such as retail experience and e-commerce platforms where consumers’ decisions and purchases are made.
Conclusion
In summary, the application of EEG to neuromarketing offers great potential in understanding and predicting consumer behaviour and can offer a unique advantage in optimizing product and advertisement design. Neuroscience methods offer a unique advantage when used in conjunction with traditional marketing methods, offering strong insights and predictions relating to consumer behaviour. While much attention has been devoted to fMRI for its high spatial accuracy in identifying the activation of neural regions during experimental tasks, EEG as a method of neuroimaging should not be overlooked. EEG may be particularly favourable to neuromarketers due to its low cost and invasiveness, along with its advantages in being able to identify neural responses with millisecond-level accuracy. Neuromarketing would also benefit greatly from the growing accessibility of portable EEG systems, which can be applied in real-world settings to further understand consumer behaviour.
Both evoked potentials and changes in oscillatory activity in the EEG signal can provide a range of insights regarding consumer responses to marketing stimuli. In particular, EEG offers valuable indices of neural processes such as perception, attention, memory, emotion, and the expenditure of cognitive effort, which are ultimately related to consumer decisions. The application of EEG throughout research has highlighted the complexity of the processes that may contribute to decision-making. Therefore, it is important for marketing researchers to note that a combination of any number of interacting cognitive and perceptual processes may underly the final decision of consumers to buy. For example, the decision to buy may be influenced by the recognition of a product or brand, which in turn may be influenced by an interaction of memory and attentional processes at the initial exposure to that product or brand. Furthermore, as demonstrated throughout the psychophysiological and neuromarketing literature, these attentional and/or memory-related neural processes may be modulated by additional cognitive processes, such as emotion or social connection (Pozharliev et al., 2015). Therefore, while it is beneficial to understand the neural processes which are thought to be associated with different phenomena which can be observed in the EEG signal, the complexity of these interacting processes should always be considered. Relatedly, neuromarketing researchers may benefit from examining both chronic and primed neural responses to jointly supplement self-reported measures. For example, chronic responses to a marketing stimulus may impact an individual’s consumer behaviour. However, these chronic responses may be modulated (enhanced or reduced) by the situational context in which stimuli are delivered (Lim, 2015). Therefore, examining the interaction of these responses can help translate experimental research to understand the real-world behaviour of consumers and encourage favourable marketing outcomes.
Despite the complexity of interpreting neural data, the application of EEG has a long history, and in particular, the ERP method has identified a range of well-known neural responses which are successfully utilized throughout several fields of research. EEG has offered robust insights relating to mental processing which are applicable to understanding consumer behaviour. As a particular advantage of EEG, its high temporal resolution can allow researchers to differentiate the early autonomic, perceptual, and reflexive responses of consumers from the later evaluative and emotional responses. Furthermore, while EEG cannot offer spatially precise recording to the extent that is offered by fMRI, research-grade EEG systems offer a spatial resolution which is sufficient to differentiate the activation of different cortical regions. These findings can be useful in marking lateral biases in cortical activation, which can offer valuable insights into consumer responses to marketing stimuli, such as emotional valence (Davidson, 1988). Furthermore, the use of high-density EEG systems to record neural activity during the presentation of television advertisements has successfully been used to identify the activation of different cortical areas, which can predict future buying decisions (Daugherty et al., 2016). As such, given the versatility and highly informative data which can be obtained from the application of EEG, it is clear that carefully considered use of this method offers significant advantages to the field of neuromarketing.
Footnotes
Declaration of conflicting interests
The author(s) declared no potential conflicts of interest with respect to the research, authorship, and/or publication of this article.
Funding
The author(s) received no financial support for the research, authorship, and/or publication of this article.