
Abstract
Researchers must increasingly account for growing expectations from scientific journals to infuse their work with real-world significance through field experiments. However, field experiments often require researchers to have access to substantial resources or a network that includes nonacademic partners willing to provide those resources. This article aims at overcoming those barriers by providing researchers with the tools they need to conduct randomized field experiments delivered to participants through mobile applications, given limited resources. The method presented herein takes advantage of the facilitated access to user data made possible by computing and development platforms such as Google’s Firebase. While the programming tools required to collect and analyze the data may feel intimidating, this article provides step-by-step instructions and illustrates the procedure with a case study experiment.
Introduction
The value of field experimentation in business and psychological research has been increasingly acknowledged in recent years (e.g., Gneezy, 2017; van Heerde et al., 2021; Morales et al., 2017; Viglia et al., 2021). In field experiments, participants are unaware of their involvement in a study where researchers manipulate factors to test hypotheses in natural settings. This approach enables researchers to observe and measure actual behaviors as they normally occur, that is, without the interferences of interacting with participants through questionnaires, eye-tracking technologies, and other tools that would make the situation seem artificial and disconnected from reality in the eyes of the participants.
Including a field experiment in a study package provides ecological validity to research findings, that is, they highlight how relevant such findings are to the real world (van Heerde et al., 2021). Without, research articles may only boast of offering internal validity, which may be achieved through lab experiments where researchers can control external factors and precisely isolate causality, and/or external validity, which may be achieved through multiple studies to show the generalizability of results across consumption contexts, populations, or industries (Gneezy, 2017; Morales et al., 2017; van Heerde et al., 2021).
Beyond the scientific value of showing that the results of a study can be generalized to naturalistic situations, at least two reasons should motivate researchers to use field experiments. First, field experimentation addresses an understandable wariness from practitioners vis-à-vis academic research that often provides recommendations by extrapolating results obtained in a lab or through online questionnaires without further testing in the real world (Haenlein et al., 2021; van Heerd et al., 2021). Although lab and online studies may strive for high levels of realism (Morales et al., 2017), they usually involve self-reported measures that rely on the assumption that respondents can accurately predict their own preferences and behaviors (Viglia et al., 2021). Second, researchers must face growing expectations from scientific journals to provide ecological validity in research articles. Editorials of leading journals have gone as far as explicitly appealing to researchers’ self-interest to get published to promote fieldwork (e.g., van Heerd et al., 2021).
Despite the benefits of field experiments, they remain the exception because of important obstacles for researchers, including the need for substantial resources (e.g., money, logistics), the need for nonacademic partners to provide those resources, and the noise that comes with the limited control over the experimental procedure.
The growing weight of digital media in our lives can help us overcome these obstacles. Conducting field experiments with digital media offers at least three advantages. First, they are logistically less troublesome compared to field experiments conducted in offline contexts. Such field experiments require finding and managing a location, which increases in difficulty as data collection stretches over time. Moreover, they raise the critical question of keeping the treatment location and the control location comparable or consistent enough that detecting an effect can reasonably be attributed to the manipulated factor(s) (Trafimow et al., 2016). Second, conducting field experiments with digital media makes randomization much simpler. Randomization consists in assigning participants randomly across experimental conditions; it allows to control for external confounding factors by making the treatment and control groups approximately comparable in all respect but for the treatment (APA, 2022). Third, relying on digital media gives access to a wide array of data collected in the background and thus allows the inclusion of relevant control variables to account for extraneous influence.
Sample of recent research articles involving field experimentation in a digital context.

Notes. The protocol for article selection consisted in selecting the first 15 articles published in top-tier marketing journals in the database Business Source Ultimate after entering the following keywords: “field experiment” and “marketing.” (January 2022).
Asides from such collaborative experiments, researchers may design ad hoc field experiments on their own. An emerging trend consists in using advertising platforms such as Facebook Ads (e.g., Paharia & Swaminathan, 2019; Yin et al., 2021). Such platforms allow researchers to run ads, randomly assign users to conditions, and select metrics of interest (e.g., ad clicks). Although they perform analyses and provide researchers with the results (Google, 2022b), they do not grant access to the raw data. Researchers have access to aggregated on-screen results—e.g., the number of users who clicked on the treatment ad versus the control ad—if they wish to perform analyses themselves using for instance Chi-square tests.
The method developed in this article presents two important advantages compared to current practices. First, in contrast to most field experiments leveraging digital media, researchers can be self-reliant and do not have to depend on the willingness of a nonacademic partner to have access to user data. Second, researchers have a high degree of control over the experimental procedure, including the priming stimuli (e.g., ad format, app structure, button color or position), the behavioral outcomes that they wish to observe (e.g., engagement time, willingness to press on a button following a prime), and the types of products featured in in-app ads.
At present, the learning process involved in conducting app-based field experiments is convoluted for any researcher who does not wish to depend on a nonacademic partner. The skills involved must be effectively self-taught, requiring researchers to go through online tutorials, programming forums, blog posts, and technical documentation scattered across various sources that are typically not targeted to social scientists. While ignoring the potential of app-based field experimentation constitutes a missed opportunity, doing so without the necessary knowledge might result in wasted time and vain efforts. In the remainder of this article, we provide concrete guidelines on how to proceed and illustrate our method with a case study experiment.
Implementing an app-based field experiment
The 10-step procedure below provides an overview of how to implement an app-based field experiment. In relation to the case study experiment, we consider the case of an experiment involving in-app advertising where an additional step (Step 5) is involved.
Step 1: Developing an app
Developing an app that includes enough functionalities to run an experiment in line with specific research objectives is simpler than it sounds. Many tutorials are available on online video-sharing platforms, including the YouTube channels Coding in Flow and Aws Rh which provide detailed instructions for a wide range of actions relevant to the development of a functioning app (e.g., building an app intro, displaying a popup dialogue box following a user’s action). These tutorials often include links to example code in GitHub (i.e., a code hosting platform) that can be downloaded and adapted.
Several app development environments are available. Publishing on Apple App Store requires Apple’s software Xcode whereas one may publish on Google Play Store after developing an app with Google’s software Android Studio or others such as Unity, which is well-suited for video games. We recommend the latter option since about 70% of smartphone users own an Android device (Statista, 2022). Publishing on a single store will avoid wasted efforts since competencies are transferable from one environment to another only with great difficulty since they rely on different coding languages.
Step 2: Creating a Firebase project for the app
Firebase is a Google-owned platform enabling developers to manage their apps through numerous services including experimentation. This service is free of charge and the platform provides free data storage until 10 GB. Creating a Firebase project requires to have a Gmail account (Google’s email service) and involves a few simple steps: providing a name for the project, accepting Firebase’s terms of service, accepting to enable Google Analytics for the Firebase project (Google Analytics enables developers to access usage and behavior data for their app), and accepting Google Analytics terms. To start, one may click on the following link: https://firebase.google.com/
Next, the app must be registered in the Firebase project. While it is possible to register the app from the Firebase console, 1 the simpler option consists in using the Firebase Assistant in the app development environment—for the purpose of this tutorial, let us settle on Android Studio. The process is automatic at the time of adding Google Analytics for Firebase to the app, which we cover in the next step.
Step 3: Adding Google Analytics for firebase to the app
Google Analytics collects two types of data: events and user properties. Events refer to what is happening in the app and include errors as well as user actions (e.g., app removal, ad clicks). 2 User properties are attributes that describe users and include geographic location (e.g., city), language preference, and device characteristics. 3 Google Analytics automatically records many events and user properties as long as the app includes the Analytics software development kit (SDK—i.e., a collection of tools and libraries that enables an app to access a specific platform).
Adding the Analytics SDK is simple through the Firebase Assistant, which can be accessed from Tools > Firebase in Android Studio (Figure 1). The Assistant pane lists all the Firebase services available; “Analytics” is the one of current interest. Expanding its section and clicking on the tutorial link (“Get started with Google Analytics”) leads to detailed instructions for connecting the app to Firebase (as per Step 2), adding the Analytics SDK to the app, and recording specific events (i.e., non-automatically recorded). Calling the firebase assistant in Android Studio (step 3).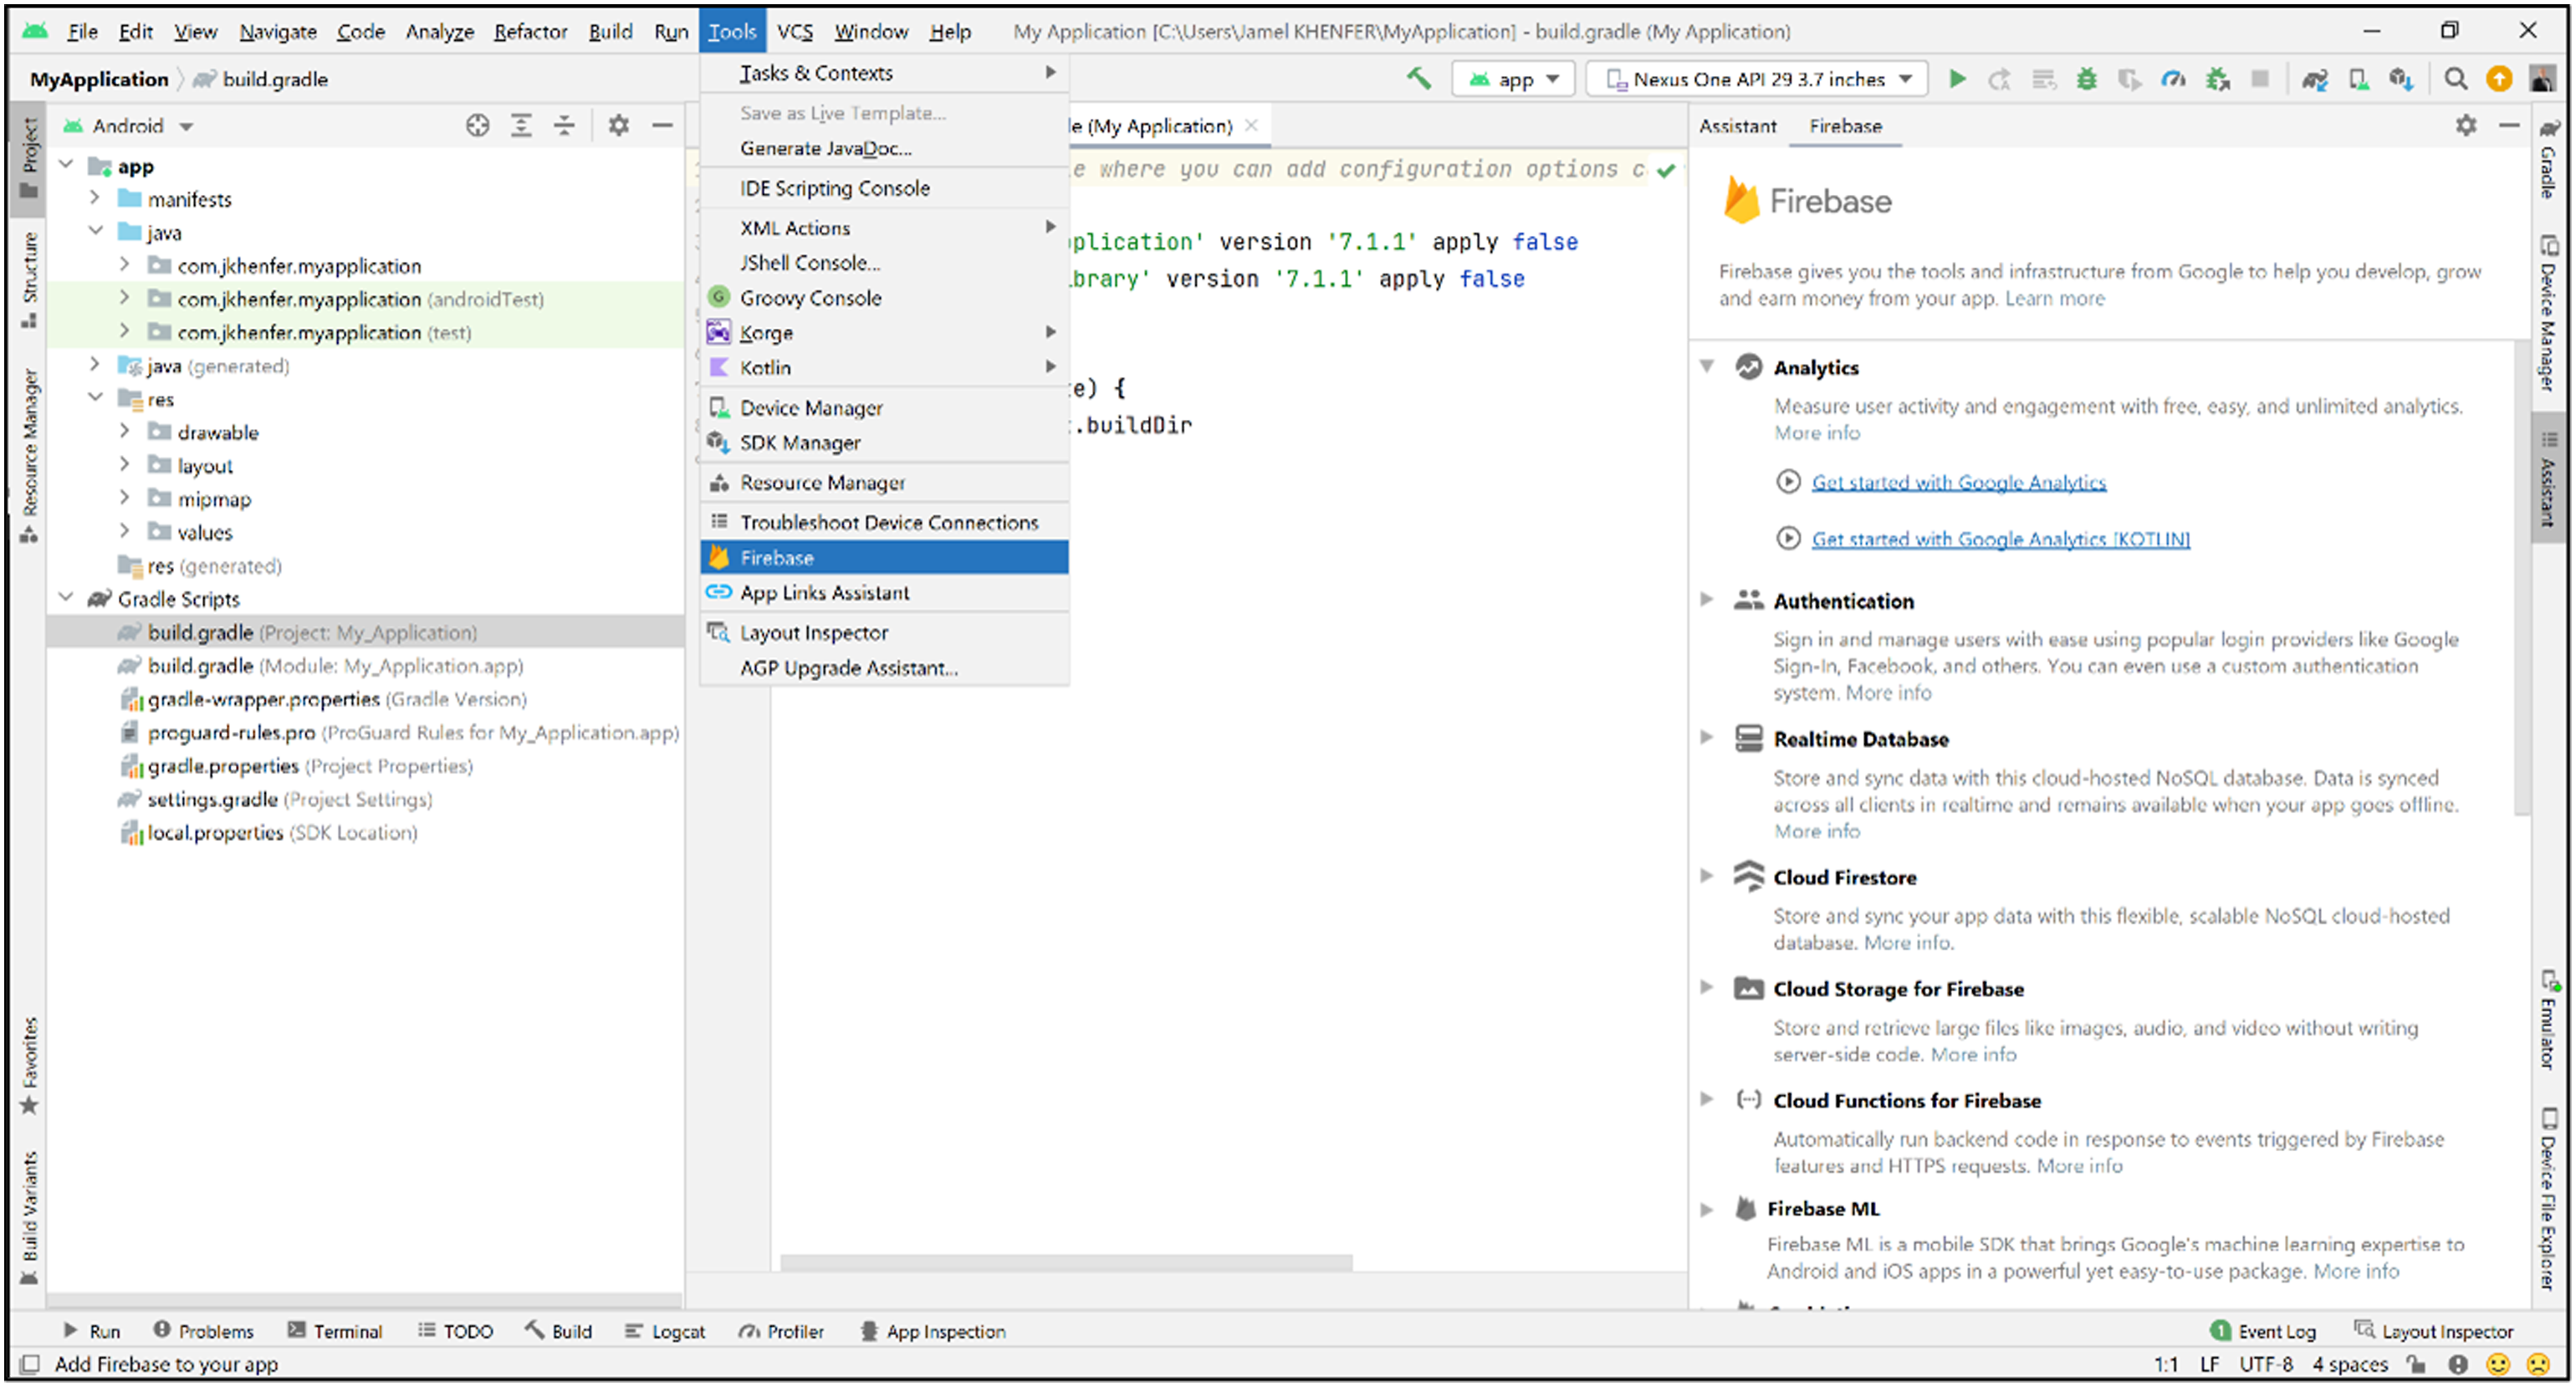
Researchers may record events of their choosing based on their app’s characteristics (e.g., game, retail) and their research objectives. For instance, the following case study experiment relied on automatically recorded events such as ad clicks but also a custom event that was designed to capture user engagement, or the extent to which people use an app (Rutz et al., 2019). Specifically, we logged an event every time a user played a game. Aside from data collected in the background, it is possible to record data willingly provided by users (e.g., personal information). This might be helpful for instance to track a panel provider’s user IDs (e.g., Prolific) from the app to an online questionnaire as part of pilot testing. One should make sure to check the logs in Android Studio (View > Tool Windows > Logcat) to verify that both automatically and manually recorded events are being logged properly.
Step 4: Adding Firebase Remote Config to the app
Firebase Remote Config is a cloud service that enables developers to make changes to the appearance and behavior of an app without having to go through coding in the app development environment and asking users to download an app update. Remote Config involves creating in-app default values in the app development environment that define the default appearance and behavior of the app. Then, developers can later override those values in the Firebase console to make changes that will automatically roll out to the app’s user base. Firebase A/B Testing service relies on Remote Config for the experimental manipulations by delivering different versions of the same app at the same time to different users. This feature makes randomization possible.
Adding the Remote Config SDK can be done through the Firebase Assistant. In the Assistant pane, expanding the “Remote Config” section and then clicking on the tutorial link “Set up Firebase Remote Config” will lead to a series of specific instructions. After adding the Remote Config SDK to the app (which merely involves clicking on a button), the process is fourfold. 4 First, one must define which aspects of the app’s behavior or appearance will change through Remote Config and translate these into the parameters that will be used in the app. For instance, in the following case study experiment, one condition included banner ads but no interstitial ads (i.e., full-screen ads displayed at natural transition points in the flow of an app’s execution) whereas the other condition displayed interstitial ads but no banner ads. Thus, we had two Boolean parameters. Second, one must set the in-app default values for the Remote Config parameters. Given the case study experiment, we elected to set both parameters to “true,” that is, the app would show both ad formats by default. Third, one must make sure that the app will fetch and activate the parameter values from the Remote Config backend, that is, the values in the Firebase console that will override the in-app default values. These three steps involve coding in the app development environment, but the Assistant pane provides a collection of source code that can be copied and pasted, along with specific guidelines as to where to do so. Fourth, one must go to the Firebase console to define the parameter values that will override the in-app default values. Note that this last step will become moot when setting up the experiment in Step 7.
Step 5: Dealing with in-app advertising (optional)
To the extent that research questions involve advertising, researchers can configure the app to call on the service of an advertising platform such as Google AdMob to deliver in-app advertising. Researchers may want to compare the effectiveness of different ad formats (e.g., banner, interstitial) or build on AdMob’s ability to control the product categories allowed to be displayed in the ads that users will be exposed to. This step is twofold.
The first set of actions must be performed in the app development environment. After adding the AdMob SDK to the app through the Firebase Assistant pane, different ad formats can be implemented. The procedure and the source code may vary significantly from one format to another since some formats need to adapt to device screen size (e.g., adaptive banner) or appear following the user’s specific actions (e.g., interstitial). 5 Once the app is set up to display ads through one or more ad formats, researchers who wish to compare ad formats should go back to Step 4 to configure Remote Config accordingly.
Next, one should go to the AdMob platform (https://apps.admob.com/) and sign in with their Gmail account. After setting up their app in the platform by following on-screen instructions, one must generate as many ad unit IDs as there are ad formats in the app. An ad unit ID allows AdMob to record events (e.g., ad clicks) in relation to the ads displayed through the relevant ad format. At this time, one may exclude product categories from being advertised in the app as needed (tab “Blocking controls”). For instance, in the following case study experiment, we blocked sensitive categories (defined as such by AdMob—e.g., dating, drugs; Google, 2022f) so that the app would receive a content rating from Google Play that would make it suitable for everyone (Step 6). Finally, AdMob needs to be linked to the Firebase project. Given that both platforms are Google-owned services, this process merely involves checking boxes (tab “App settings” in AdMob).
Step 6: Publishing the app on Google Play store
At this time, the app is ready to be deployed to Google Play Console (https://play.google.com/console), which is the necessary step to be published on Google Play Store. While the actions involved are numerous, they are essentially threefold. First, the app bundle (i.e., Android publishing format that includes the app’s compiled code and resources) must be uploaded to Google Play Console. 6 Second, one must create the store listing, or the Google Play Store page that users will see when attempting to install the app. This involves for instance providing a description of the app and uploading graphic assets. Third, the platform requests information about the content of the app to ensure that it complies with Google Play policies. Examples include setting a privacy policy, filling out a form designed to assess the app’s content ratings (which may vary across countries), declaring the presence of ads, and filling out a comprehensive form about how the app collects and shares user data.
Step 7: Setting up the experiment in Firebase
The Firebase A/B Testing service allows researchers to envision two types of experiments. They may conduct Remote Config experiments to make changes to the behavior or appearance of their app across two or more variants. They may also conduct messaging experiments to test how users respond to different in-app messages or notifications given the same appearance and behavior of a given app. However, the latter type of experiment is unlikely to yield valuable insights since it implies developing an app that people may use regularly. This is rarely the case since most people regularly use only a small subset of apps; apps are often forgotten or deleted quickly after the initial download (Appel et al., 2020; Rutz et al., 2019). The method we propose here is well-suited for “one-shot” data collection, or when users are not expected to further interact with the app after the first use.
Setting up an experiment in the Firebase console is a straightforward procedure that starts with locating the “A/B Testing” tab in the left pane and clicking on “Create experiment” (Figure 2). Then, one is prompted for the service to experiment with (here “Remote Config”) before moving on to a form that will set up the experiment in terms of targeting, goals, and variants (Figure 3). Firebase A/B Testing service (Step 7). Defining the target users (top), the goals (middle), and the variants (bottom) (Step 7).
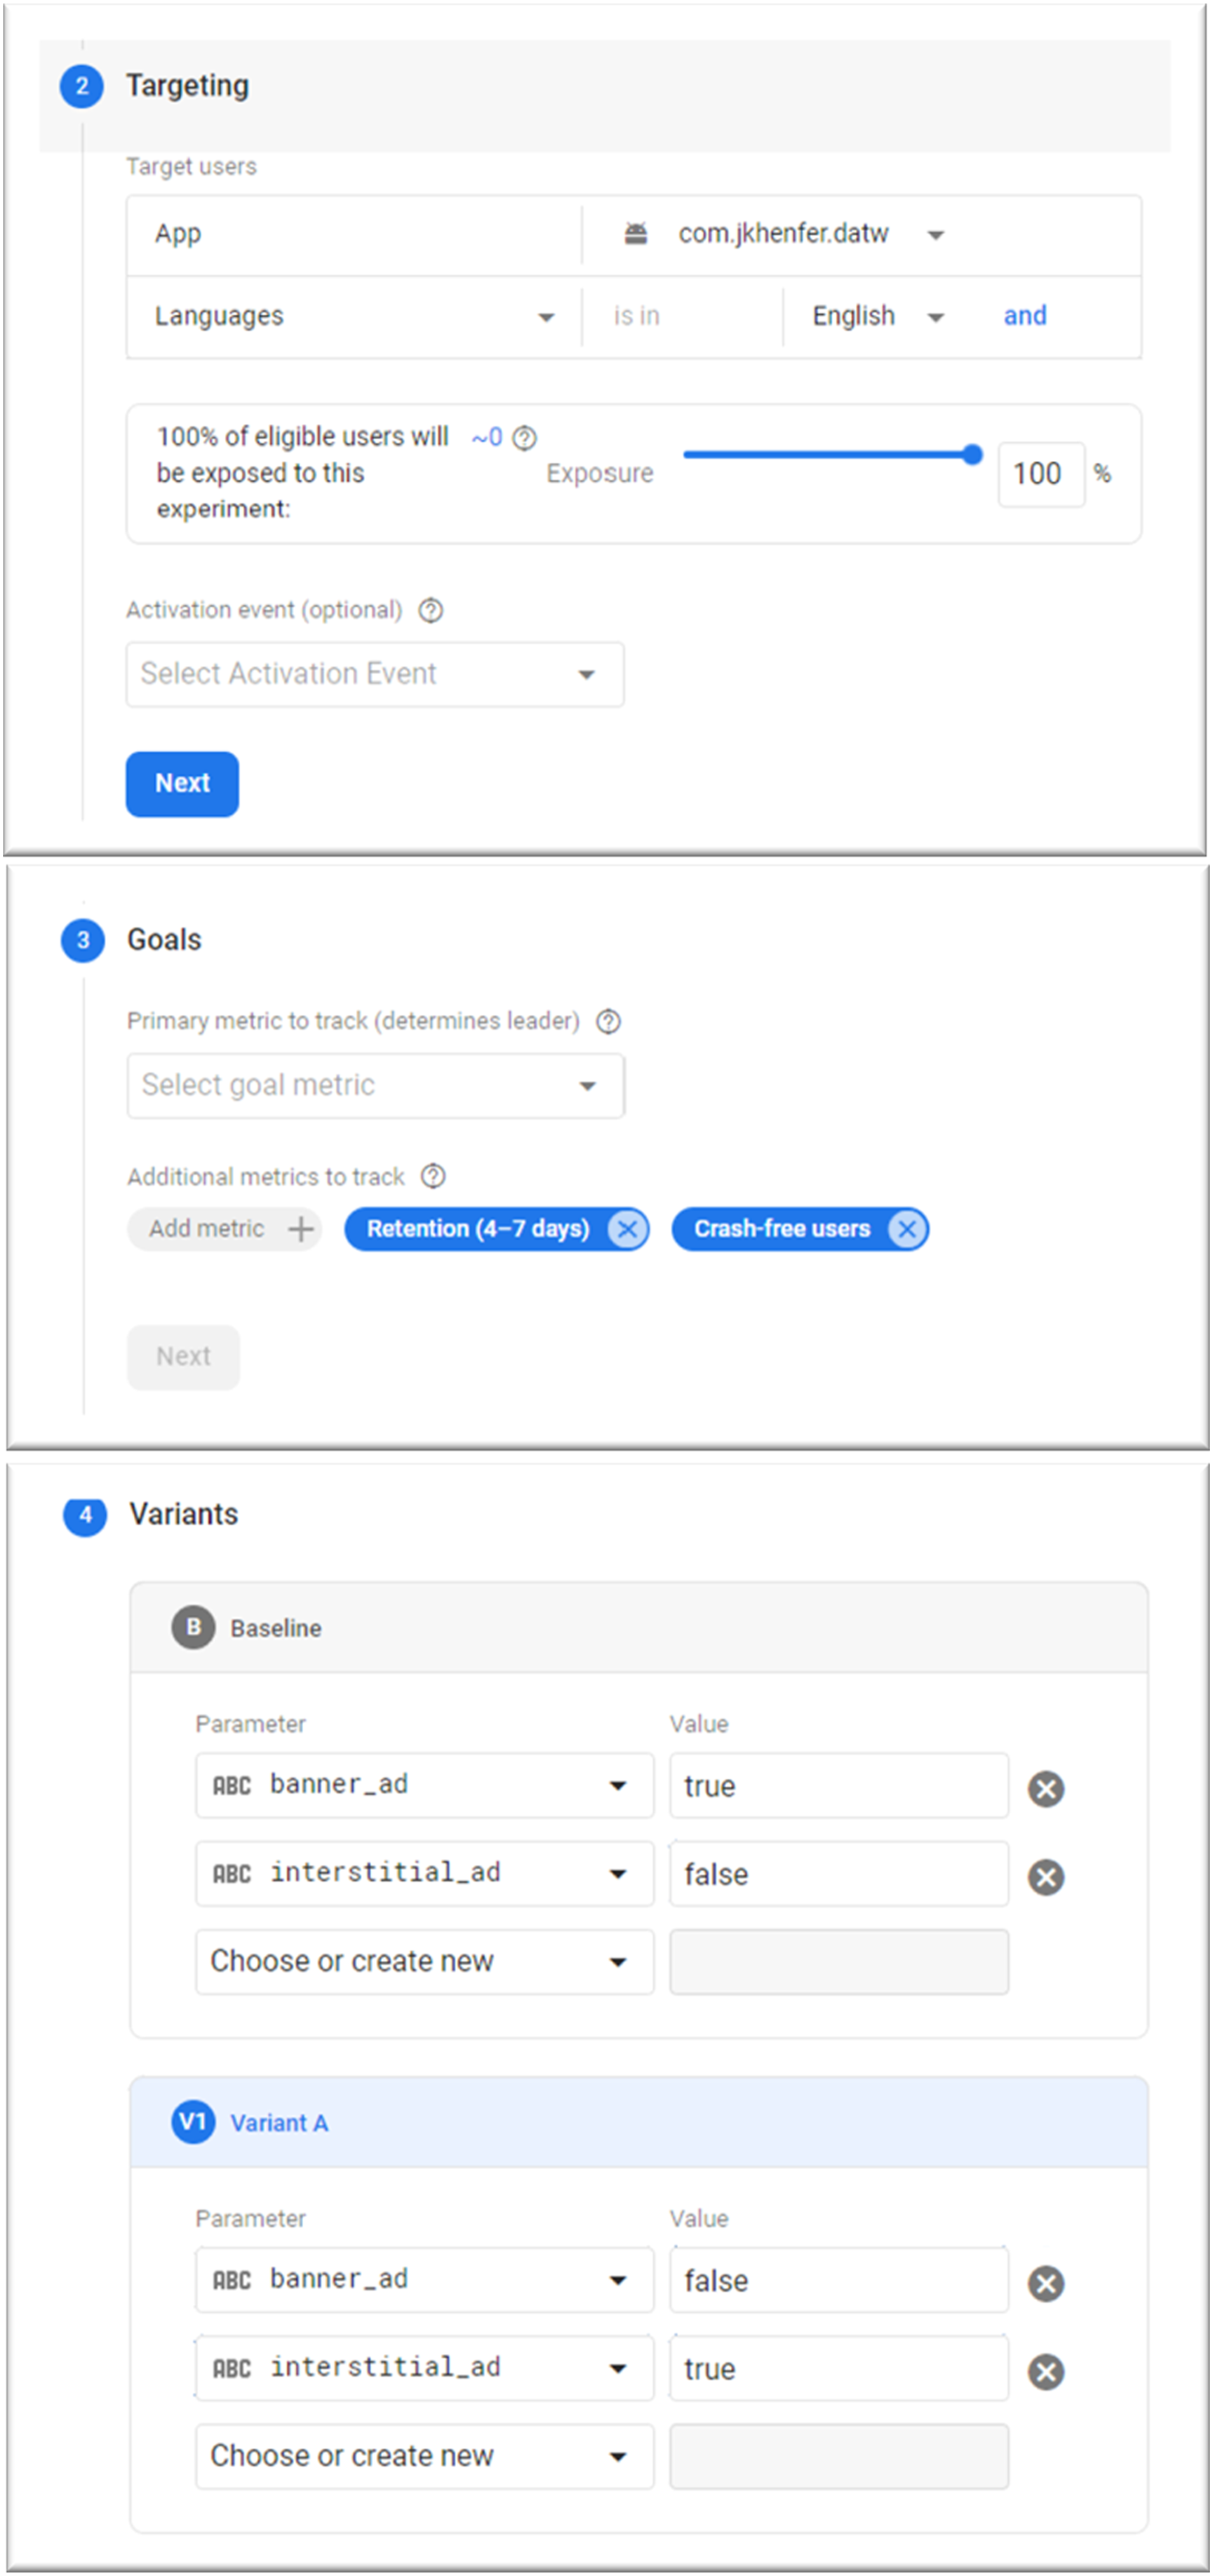
Targeting refers to the users that will be part of the experiment. It involves first selecting the app. Note that the experiment cannot run on an Android app and an IOS app at the same time since the app and/or the users may behave differently across platforms. It is possible to account for sample criteria such as language and country of residence and to allow only certain users to participate after they perform a specific action such as pressing a certain button or viewing an ad. By default, only 5% of users are set to be part of the experiment; the slider must be brought to 100%.
The Goals section involves selecting the metrics to track. Firebase A/B Testing offers to perform analyses for up to six metrics based on events either automatically or manually recorded. For events that do not pertain to advertising, the raw data can be retrieved, and researchers can perform their own analyses (Step 10).
In the Variants section, researchers must define the experimental conditions (or variants) based on the parameter values established in Remote Config. For instance, in the following case study experiment, users were exposed to either banner ads or interstitial ads; this led us to create two Boolean parameters in Step 4. At this stage, we can define the two variants whereby the baseline will deliver banner ads and “variant A” will deliver interstitial ads (Figure 3). Firebase allows up to eight variants including the baseline. Researchers may test the experiment before launch by checking the logs in the app development environment. 7
Step 8: Gaining users
This step determines the financial cost of running the field experiment. While the app may gain users through word of mouth and app store optimization (i.e., choosing relevant words for the app’s title and description to rank higher in search results), relying on online advertising might help speed up data collection. Given the following case study experiment, we relied on the advertising platform Facebook Ads and advertised on Meta-owned social media platforms, including Facebook, Instagram, and Messenger. The cost may vary significantly depending on the app itself. The app we used in our case study experiment was designed to minimize advertising costs, which did not exceed 200 euros while allowing the app to gain over one thousand users in about 4 weeks (cost per user ≈ €0.12). Other advertising platforms include Googles Ads.
Step 9: Monitoring the experiment
An experiment through Firebase A/B Testing has a maximum duration of 90 days after which it ends automatically. The Firebase console provides on-screen results about the metrics that were selected in Step 7. One may check for instance that there is no difference in crash-free users across variants. We provide guidance in the case study experiment on how to make sense of the on-screen results provided by Firebase.
Step 10: Collecting the raw data
Analytics data may be accessed through another Google-owned platform named BigQuery—a data warehouse—and exported to another cloud provider or downloaded as spreadsheets. Access to BigQuery is automatic through the Firebase A/B Testing service if the “pay-as-you-go” pricing plan is active. Given ad hoc field experiments in business and psychological research, the volume of stored data is usually too small (<10 GB) to trigger any payment. Access to the raw data has a default expiration set to 60 days. 8 Note that BigQuery needs to be integrated with Firebase before running the experiment through the Firebase console (Project Overview > Project Setting > Integration > BigQuery).
Case study experiment
In-app advertising enables developers to monetize user engagement by displaying ads. While various advertising formats are available, interstitial ads have become a preferred choice in mobile gaming. Interstitial ads are full-screen ads that cover the interface of an app until closed by the user, typically after a forced 5-second delay (Google, 2022e). This ad format is well-suited for mobile game apps since it was designed to display ads at natural transition points in the flow of an app’s execution such as between levels or before going back to the home screen after losing a game (Google, 2022e). Because interstitial ads cover the entire device screen, they are well-suited to generate ad clicks, which is the primary source of advertising revenue for developers (Google, 2022c).
However, interstitial ads may harm user experience and jeopardize user engagement considering their obtrusive nature (Grewal et al., 2016). The obtrusiveness of large-sized mobile ads is a well-known concern among both advertisers and developers (Appel et al., 2020; Grewal et al., 2016). Yet, because of their sole relevance to mobile media, interstitial ads have been an under-researched topic compared to other formats of mobile display advertising, in particular banner ads. Despite its intuitive allure, this concern is at odds with claims from advertising platforms that suggest that the interstitial format has little to no influence on user engagement (Google, 2022c). Regardless, favoring interstitial ads over less obtrusive formats may be worth the adverse effect on user engagement since past research suggests that advertising revenue can be larger than the loss from consumer avoidance of ad-loaded apps (Ghose & Han, 2014).
Thus, this study hypothesizes that given comparable amounts of ad impressions, interstitial ads (vs. banner ads) generate more ad clicks (H1) and more advertising revenue (H2) despite causing lower user engagement (H3).
Data collection details
We developed a two-dimensional arcade game designed to gain users quickly and inexpensively by building on humor. Portrayed as a parody of U.S. politics, the game humorously depicted then-president Donald Trump riding the Twitter mascot and shooting laser beams at political adversaries, other world leaders, and bats. The app was available for free on Google Play Store (Web Appendix A). Quality checks revealed a crash-free user rate of 100% in both experimental conditions (Web Appendix B).
Our experiment ran from late October 2020 to late November 2020 and relied on a sample of 1065 India-based Android smartphone users. To recruit participants, we advertised our mobile game app on Meta-owned social media platforms (i.e., Facebook, Instagram, and Messenger) in three large Indian cities: Kolkata, Mumbai, and New Delhi. We collected data in India for two reasons. First, we sought to have access to an English-speaking market while avoiding U.S. American users given the storyline of our game. Second, India constitutes one of the world’s largest markets in terms of population size and recorded a three-digit app download growth from 2016 to 2019 with 190% while worldwide growth was 45% for the same period (App Annie, 2020).
Both advertising formats were placed in a way that would not interfere directly with the gameplay. That is, users did not see ads while they were playing a game. Interstitial ads appeared once users lost a game, before returning to the home screen. Banner ads appeared at the bottom of the home screen below the start button. While ad impressions were contingent on the quality of users’ Internet connection, we found no difference between experimental conditions as discussed in the result section. We followed Google AdMob’s recommendations on appropriate ad placement (Google, 2022d). Examples include avoiding placing banner ads next to an interactive button to prevent accidental clicks.
To measure our outcome variables, we first relied on events automatically recorded by Firebase: ad clicks and AdMob revenue. Ad clicks are formally defined as the total number of times users click or tap on ads shown in an app (Google, 2022a). AdMob estimates advertising revenue proportionally based on the number of impressions each ad unit receives (Google, 2022a). Concerning user engagement, we relied on a customized event based on the number of games that users played.
Analytical approach
A drawback of the approach implemented in the present study is that Google does not share raw data about advertising (footnote 2). Nevertheless, Google offers to perform analyses for up to six metrics through its platform Optimize and to provide detailed results on Firebase. Google’s approach to measuring experiment results relies on Bayesian inference. In a nutshell, Bayesian methods consist in quantifying uncertainty as a probability by making assumptions based on the data (Rossi & Allenby, 2003). In contrast to the frequentist approach, they do not test null hypotheses based on p-values. Applied to experiments, Bayesian inference tells us which treatment has the highest chance of performing better on a specific metric. Put differently, the approach implemented herein tells us which of the two ad formats (interstitial or banner) is likely to be the best performing in terms of ad clicks, advertising revenue, and user engagement.
Although researchers cannot access the raw data on metrics about advertising, they can access the raw data that pertains to the usage of the app. To be consistent with the approach implemented by Google, we followed a similar procedure based on Bayesian inference to test the effect of in-app advertising (banner ads vs. interstitial ads) on user engagement (number of games played). Specifically, we ran a Bayesian A/B test using Python (i.e., a general-purpose programming language widely used in data analytics). The Python code and dataset used in this study are provided in Web Appendix C.
In the present case, we asked the following question: what is the probability that using the interstitial format is worse than using the banner format? In mathematical terms
Where λ A,B is the number of games played per user in variant A (interstitial format) and variant B (banner format).
Let Y
i
denote the observed number of games played per user in variant i, Y
i
= {y
i1
, …, y
iNi
} with N
i
the total number of users exposed to that variant i. To address our earlier question, we applied Bayes’ Theorem
We assumed Y
i
∼ Poisson (λ). Then, the probability mass function for count Y
i
= y
i
is
The prior distribution of the number of games played per user for each variant is modeled as

With α i and β i defined to represent our prior belief. We decided to assume no prior knowledge on how users would play the game despite the presence of in-app advertising and chose a relatively weak prior (α i = β i = 0.1). Different priors yielded similar results.
The posterior distributions for λ, given the sample data for each variant, were estimated using a Markov Chain Monte Carlo (MCMC) procedure based on 20,000 draw iterations.
Results
Figure 4 provides the results of the analyses performed and delivered by Google on ad impressions, ad clicks, and advertising revenue. Decision metrics on ad impressions (top), ad clicks (middle), and advertising revenue (bottom).aNotes. “Baseline” is the banner format, and “Variant A” is the interstitial format. In the graphs, the grey line represents the banner format, and the blue line the interstitial format. The shaded regions represent the credible intervals—i.e., there is a 95% chance that the value of a metric lies within the shaded region. Less overlap in the shaded regions implies higher confidence in the leading variant. The dashed grey line in “Modeled data” represents the median value of the posterior distribution for the banner format. If it crosses the blue boxplot (or credible interval) representing the interstitial format, one should interpret the “probability to beat baseline” as non-significant.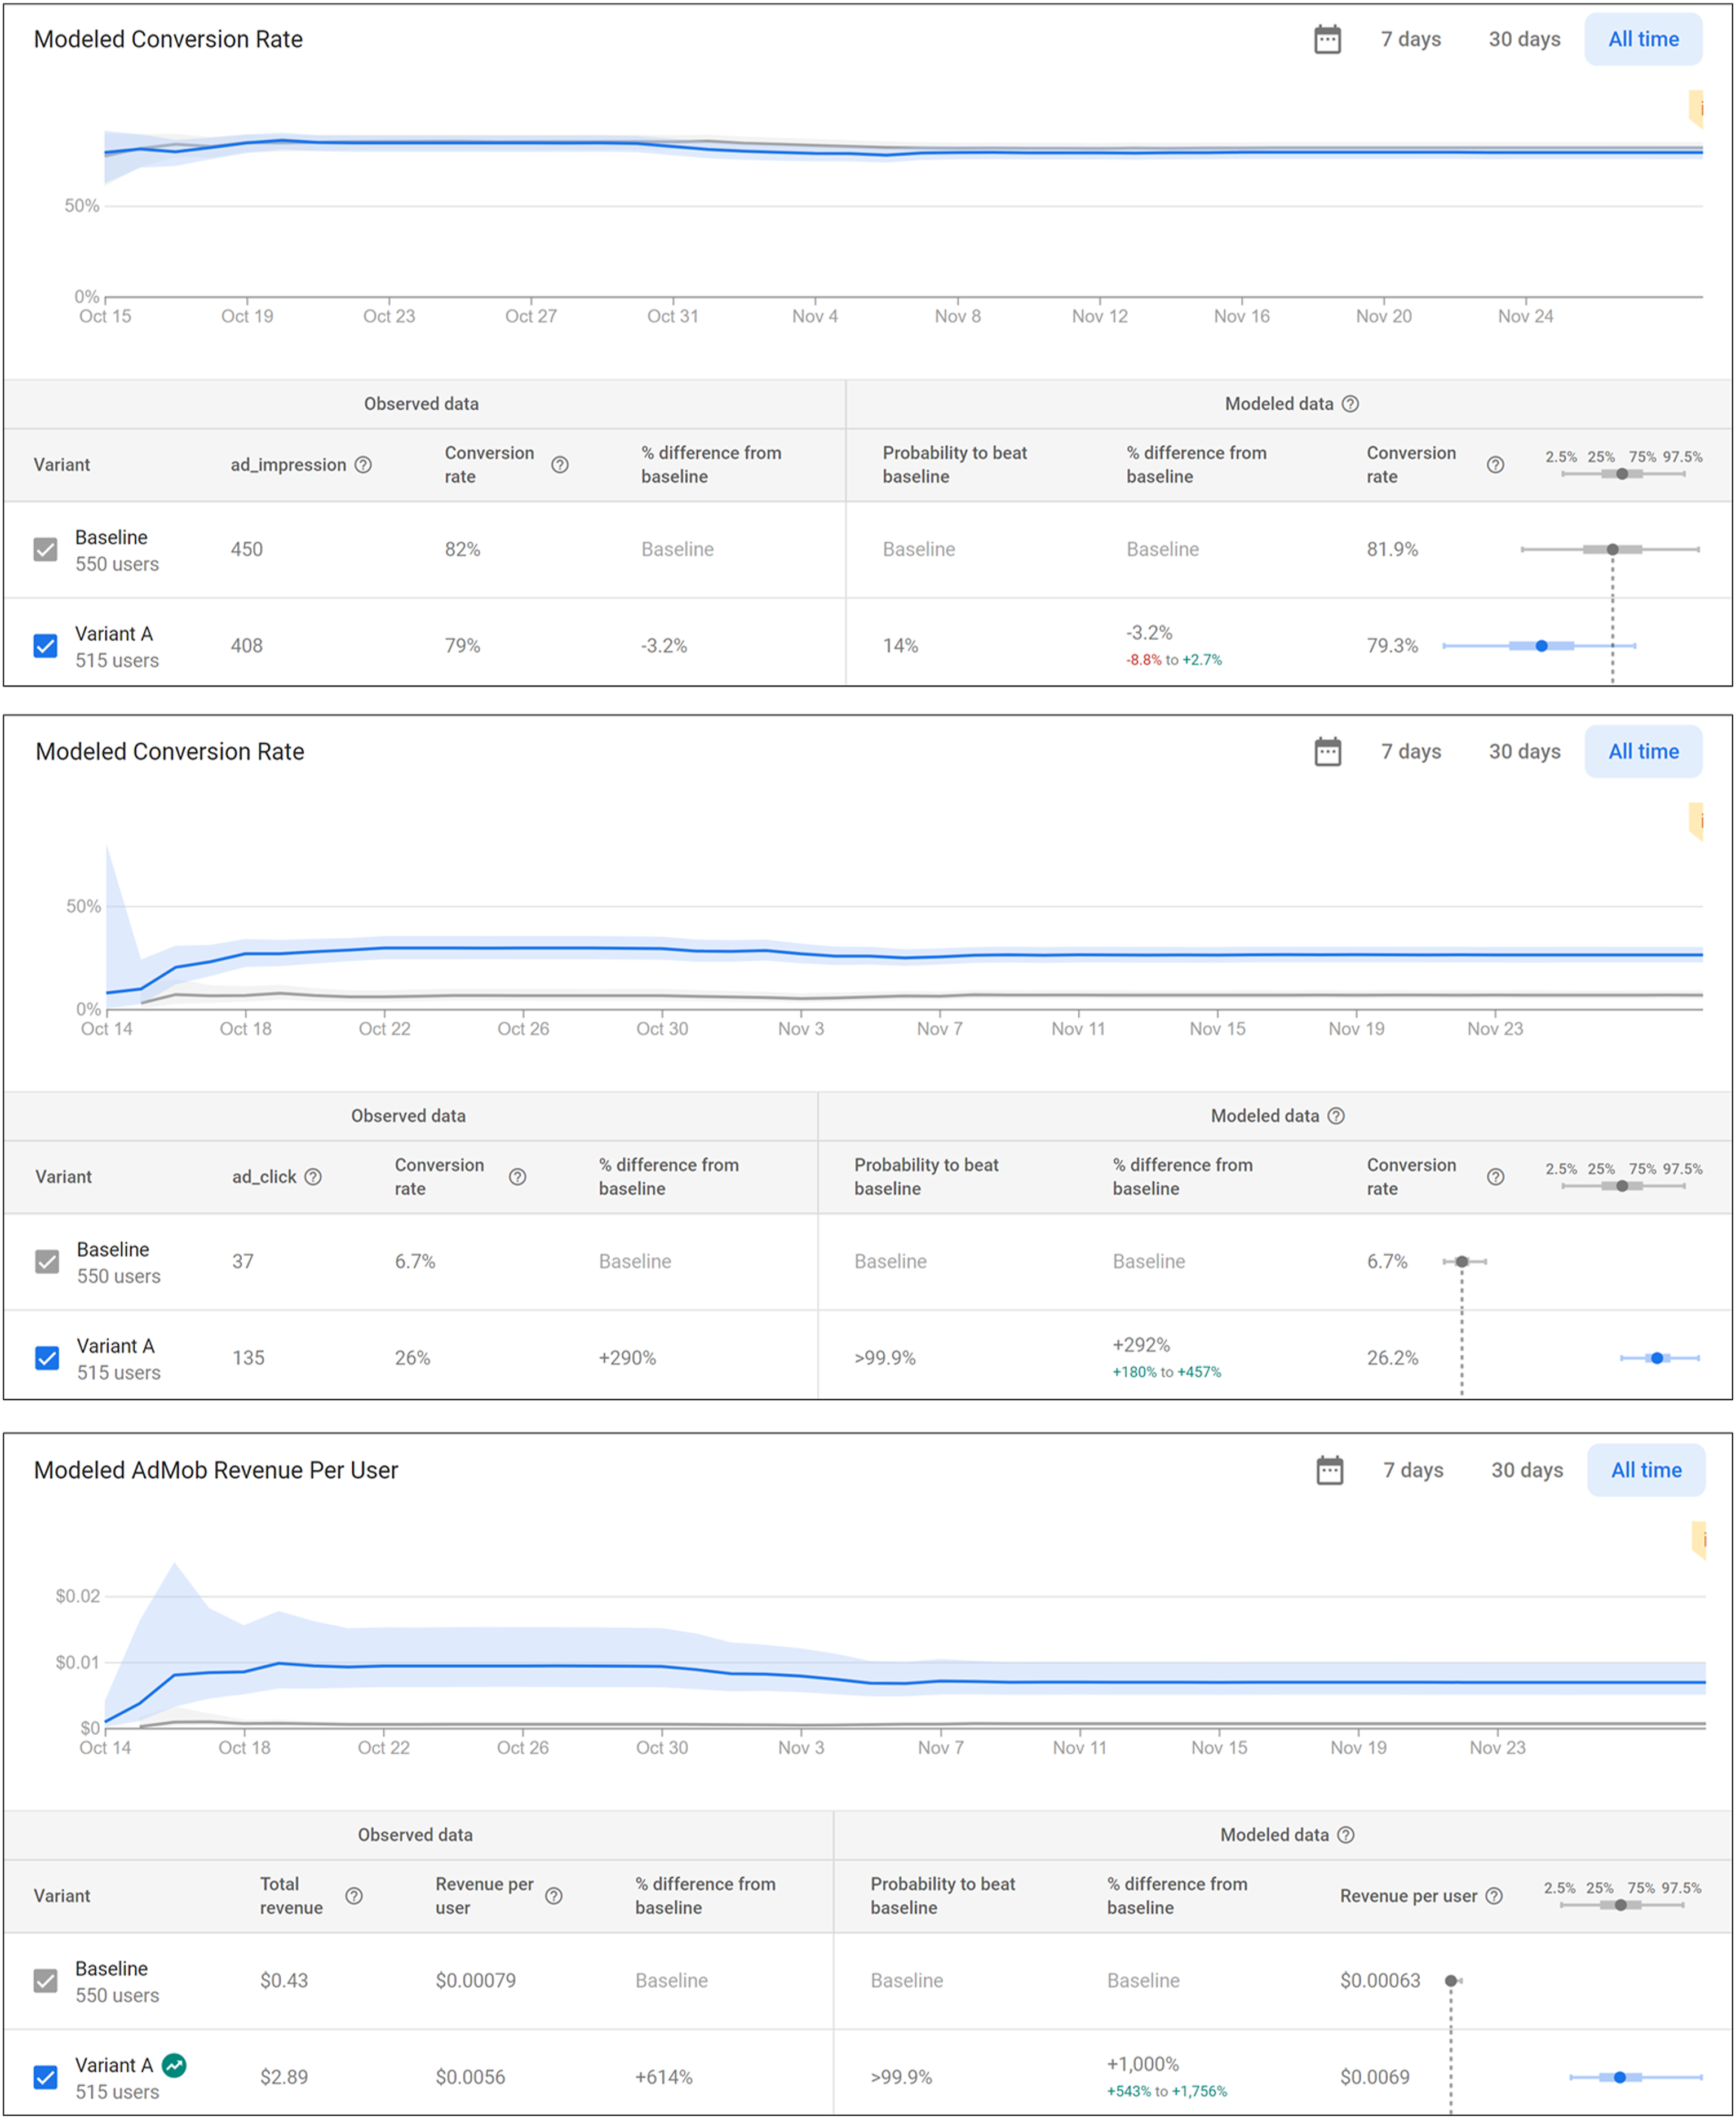
First, ad impressions did not significantly differ between conditions. Given banner (interstitial) ads, 450 out of 550 users (408 out of 515 users) saw at least one ad, that is, a “conversion rate” of 82% (79%). Put differently, the difference between the two variants was −3.2% (“Observed data” in Figure 4). Bayesian inference (“Modeled data” in Figure 4) suggests that this difference is not significant as the probability that the interstitial variant would perform better in delivering ads was only 14%. The credible interval of delta (i.e., the unknown difference between the true effectiveness of the banner and interstitial ads estimated from the modeled data) included zero (Δ = −3.2%, CI 95 [–8.8%; 2.7%]). In support of this conclusion, the credible intervals of the conversion rate for the two variants overlapped (banner: CI 95 [75.6%; 84.9%]; interstitial: CI 95 [78.0%; 82.6%]).
Second, given banner (interstitial) ads, 37 (135) users clicked at least once on an ad, that is, a conversion rate of 6.7% (26%). Put differently, the difference between the two variants was 290%. Bayesian inference suggests that this difference is significant and supports H1. The probability that interstitial ads would perform better than banner ads in ad clicks was higher than 99.9%. The credible interval of delta did not include zero (Δ = 292%, CI 95 [180%; 457%]) and the credible intervals of the conversion rate for the two variants did not overlap (banner: CI 95 [4.8%; 9.0%]; interstitial: CI 95 [22.5%; 30.1%]).
Third, given banner (interstitial) ads, advertising revenue amounted to USD 0.43, or USD 0.00,079 per user (USD 2.89, or USD 0.00,560 per user), or a 614% difference between the two variants. Bayesian inference suggests that this difference is significant and thus supports H2. The probability that interstitial ads would perform better in advertising revenue was higher than 99.9%. The credible interval of delta did not include zero (Δ = 1000%, CI 95 [543%; 1756%]) and the credible intervals of revenue per user for the two variants did not overlap (banner: CI 95 [0.00,043; 0.00,097]; interstitial: CI 95 [0.00,500; 0.00,990]).
Finally, given banner (interstitial) ads, the average number of games played amounted to 9.59, Median: 7.0 (7.60, Median: 5.0), thus making a difference of two games. Bayesian inference suggests that the difference is significant and supports H3. The probability that interstitial ads would perform worse in user engagement was higher than 99.9%. The credible interval of delta did not include zero (Δ = −1.98, CI
95
[–2.33; −1.62]). Figure 5(A) shows the posterior distribution of delta and suggests that the majority, if not all, of the distribution is below Δ = 0, implying that the interstitial format leads users to play fewer games. Figure 5(B) illustrates the posterior distributions of user engagement for each variant while Figure 5(C) provides the boxplots to mirror Firebase’s reporting. As Figures 5(B) and 5(C) suggest, the credible intervals of user engagement for the two variants did not overlap (banner: CI
95
[9.31; 9.83]; interstitial: CI
95
[7.35; 7.83]). (a) Posterior distribution of delta (user engagement). (b) Posterior distributions of user engagement for the two variants. (c) Boxplots illustrating the credible intervals of the posterior distributions of user engagement for the two variants.
Limitations and challenges
Although the procedure described above provides researchers with great opportunities to conduct field experiments, it is not without limitations and challenges. First and foremost, the method developed herein might not be suited for all researchers since they must have some familiarity with mobile app development, or at least the willingness to learn how to use the tools required to implement app-based field experiments. Android proposes free training courses for anyone without any coding experience. 9 While having an amateur programmer in the research team brings down the financial cost of the experiment, one may hire a professional independent programmer, including among computer science students. Although no-code platforms such as AppMaster and Microsoft Power Apps allow the development of apps through intuitive interfaces without coding, such options require payment and the integration of Remote Config to the app may require ad hoc negotiations.
App-based field experiments do not have to rely on sophisticated apps. For instance, Khenfer and Trendel (2023) conducted a field experiment in the context of service failure and built an app that was in appearance fully functional but was actually limited to an introduction, which they use to prime structure in the service environment, and an account creation page, which triggered a popup message announcing a failed attempt every time users pressed the sign-up button. In doing so, the authors measured users’ willingness to provide efforts to try out an Internet-based service despite a failure as a function of structure priming.
Another challenge to conducting app-based field experiments pertains to gaining users, which essentially determines the financial cost of the experiment. While Bayesian inference does not require determining a minimum sample size beforehand, higher sample sizes reduce uncertainty in results (Rossi & Allenby, 2003). The Firebase console calls experiment results—such as those presented in Figure 4—after a minimum of 2 weeks and after evidence suggests that the decision metric of interest (e.g., AdMob revenue) will not improve over the current leading variant (Google, 2022b). In our case study experiment, we sought to gain users by playing on the inherent appeal of the app. But researchers could also develop an app targeted to an existing user base (e.g., students, university staff).
A third issue relates to data management. The spreadsheets retrieved from BigQuery require extensive cleaning and restructuring. Provided by default in the long format (i.e., multiple rows represent events from the same user), they must be restructured into a wide format before undertaking analyses at the user level. While statistical software facilitates the procedure, such spreadsheets typically contain tens of thousands of rows and dozens of columns. This large amount of data requires significant preliminary work to separate the insights from the junk and implement relevant coding schemes before statistical treatment.
Internal validity constitutes another issue, but one that extends to any type of fieldwork. While app-based field experiments allow researchers to have control over the experimental protocol, unique problems may arise. User experience may vary because of differences across devices: differences in screen size may lead some users to scroll but not others, outdated operating software may lead to underperforming apps, and poor Internet connection will interfere with in-app advertising. However, randomization makes such problems inconsequential. On their own, app-based field experiments will not provide enough evidence to convincingly address research questions. Their purpose is to provide ecological validity to research findings while adding to a study package where lab experiments ensure internal validity and different contexts/settings ensure external validity.
Finally, a new data collection technique may raise the question of developing ethical standards, especially regarding dealings with participants. Keeping them unaware of their involvement in a study demands that consent cannot be asked directly. Doing so would defeat the very purpose of conducting a field experiment. Nonetheless, participants have access to a privacy policy on the app’s store page. This document should state how user data will be handled, stored, and shared with third parties in addition to informing users that installing the app signals their consent. We acknowledge that most users are unlikely to read the privacy policy, but this level of transparency—despite its flaws—is more the exception than the rule when it comes to fieldwork.
Conclusion
Despite a growing number of calls to further rely on field experiments to support research findings, researchers have been provided with very little concrete guidance (e.g., Gneezy, 2017; van Heerde et al., 2021; Viglia et al., 2021). Field experimentation typically requires substantive resources and a network that includes nonacademic partners willing to provide those resources. This article aimed at providing researchers with the tools they need to infuse their work with real-world significance despite such obstacles. App-based field experimentation takes advantage of the ubiquity of mobile media in people’s lives and the facilitated access to user data made possible by computing and development platforms such as Google’s Firebase. While the method presented herein presents some challenges, we endeavored to address all critical aspects involved in conducting an app-based field experiment, including data collection, participant recruitment, and analyses through Bayesian A/B testing.
Supplemental Material
Supplemental Material - A hands-on guide to conducting field experiments using mobile applications
Supplemental Material for A hands-on guide to conducting field experiments using mobile applications by Jamel Khenfer in International Journal of Market Research
Footnotes
Declaration of conflicting interests
The author(s) declared no potential conflicts of interest with respect to the research, authorship, and/or publication of this article.
Funding
The author(s) received no financial support for the research, authorship, and/or publication of this article.
Supplemental Material
Supplemental material for this article is available online.
Notes
References
Supplementary Material
Please find the following supplemental material available below.
For Open Access articles published under a Creative Commons License, all supplemental material carries the same license as the article it is associated with.
For non-Open Access articles published, all supplemental material carries a non-exclusive license, and permission requests for re-use of supplemental material or any part of supplemental material shall be sent directly to the copyright owner as specified in the copyright notice associated with the article.