
Abstract
Many approaches that analyse and predict results of international matches in football are based on statistical models incorporating several potentially influential covariates with respect to a national team's success, such as the bookmakers’ ratings or the FIFA ranking. Based on all matches from the four previous FIFA World Cups 2002–2014, we compare the most common regression models that are based on the teams’ covariate information with regard to their predictive performances with an alternative modelling class, the so-called random forests. Random forests can be seen as a mixture between machine learning and statistical modelling and are known for their high predictive power. Here, we consider two different types of random forests depending on the choice of response. One type of random forests predicts the precise numbers of goals, while the other type considers the three match outcomes—win, draw and loss—using special algorithms for ordinal responses. To account for the specific data structure of football matches, in particular at FIFA World Cups, the random forest methods are slightly altered compared to their standard versions and adapted to the specific needs of the application to FIFA World Cup data.
Introduction
In the last decade, an increasing interest in the modelling and prediction of major international football events can be observed. As a consequence, many different statistical techniques and approaches have been applied and adapted to deal with different types of football data. Among these, an essential class of models is based on regression methods, which incorporate covariate information of the opposing teams.
In particular, Poisson regression models have gained a lot of attention, where the numbers of goals of both competing teams can be directly linked to a set of influence variables. Early references in this context are, for example, Lee (1997) and Dyte and Clarke (2000). The latter researchers focus on scores in international football matches, treating each team's goals as (conditionally) independent Poisson variables depending on two influence variables, namely the team's FIFA ranking and the match venue. More recently, Groll and Abedieh (2013) and Groll et al.(2015) have further extended these Poisson models by incorporating a large set of potential influence variables as well as (either random or fixed) team-specific ability parameters. By using different regularization techniques they discovered a sparse set of relevant covariates, which were then used to predict the European championship (EURO) 2012 and FIFA World Cup 2014 winners, respectively. In both cases, the actual tournament winner was identified as the most likely one by the model.
Note that, implicitly, all of these models treat the two numbers of goals scored in a match as independent (conditioned on covariate information). First approaches to account for possible dependencies between the scores by using adjusted Poisson models are proposed by Dixon and Coles (1997) and Rue and Salvesen (2000). Alternatively, the bivariate Poisson distribution allows to explicitly model (positive) dependence within the Poisson framework. One of the first works dealing with this distribution in the context of football data is Maher (1982). Furthermore, an extensive study for the use of the bivariate Poisson distribution for the modelling of football data can be found in Karlis and Ntzoufras (2003). However, in Groll et al. (2018) it has been shown by the help of gradient boosting techniques that (at least for their setting of EURO data) no additional modelling of the covariance structure is necessary: for suitably designed linear predictors, which are based on highly informative covariates, two (conditionally) independent Poisson distributions are adequate.
We also want to mention a completely different approach, which is solely based on the easily available source of ‘prospective’ information contained in bookmakers’ odds, compare Leitner et al. (2010) and their follow-up papers. They obtain winning probabilities for each team by aggregating winning odds from several online bookmakers and then use inverse tournament simulation to compute team-specific abilities by paired comparison models. Based on these abilities, pairwise probabilities for each possible game at the corresponding tournament can be calculated and, finally, the whole tournament can be simulated.
In this work, we pursue a different approach and investigate an alternative tool for the prediction of the outcomes of football matches, namely random (decision) forests – an ensemble learning method for classification, regression and other tasks proposed by Breiman (2001). The method stems from the machine learning and data mining community and operates by first constructing a multitude of so-called decision trees (see, e.g., Quinlan, 1986; Breiman et al., 1984) on a training dataset. For prediction, the predictions from the individual trees are summarized, either by taking the mode of the predicted classes (in classification) or by averaging the predicted values (in regression). This way, random forests reduce the tendency of overfitting and the variance compared to regular decision trees, and, hence, are a common powerful tool for prediction. Therefore, random forests might also be a promising alternative for the prediction of football matches. In the present work, we use both random forests for metric (i.e., the number of goals) and ordinal response (i.e., win–draw–loss) as well as the combination of both. On a dataset containing all matches of the FIFA World Cups 2002–2014, we compare the predictive performance of these different types of random forests with conventional regression methods for count data, such as Poisson generalized linear models (GLMs).
The rest of the manuscript is structured as follows: In Section 2, we describe the underlying dataset covering all matches of the four preceding FIFA World Cups 2002–2014. Next, in Section 3 we explain how random forests can be used as prediction tools for the outcomes of football matches. Alternative, regression-based methods are summarized in Section 4. The main differences between the outputs of random forests and regression models for football predictions are highlighted in Section 5. Both modelling alternatives are then compared with regard to their predictive performance in Section 6. Finally, we conclude in Section 7.
Data
In this section, we provide a brief description of the underlying dataset covering all matches of the four preceding FIFA World Cups 2002–2014 together with several potential influence variables. In general, we use essentially the same set of covariates that is introduced in Groll et al. (2015). For each participating team, most of these covariates are observed shortly before the start of the respective World Cup (e.g., the FIFA ranking) or for the same year of the World Cup (e.g., the GDP per capita). Therefore, the covariate values of the teams may vary from one World Cup to another. Several of the variables contain information about the recent performance and sportive success of national teams, as it is reasonable to assume that the current form of a national team has an influence on the team's success in the upcoming tournament. Beside these sportive variables, also certain economic factors as well as variables describing the structure of a team's squad are collected. A detailed description of these variables can be found in Groll et al. (2015).
In total, this adds up to 16 variables which were collected separately for each World Cup and each participating team. For illustration, Table 1 shows exemplarily for the first four matches of the FIFA World Cup 2002 the results (1a) and (parts of) the covariates (1b) of the respective teams. In the remainder of this section, this data excerpt will be used to illustrate how the final datasets are constructed.
Exemplary table showing the results of four matches and parts of the covariates of the involved teams

Exemplary table showing the results of four matches and parts of the covariates of the involved teams
For the modelling techniques introduced in the following sections, all of the metric covariates are incorporated in the form of differences. For example, the final variable ‘Rank’ will be the difference between the FIFA ranks of both teams. The categorical variables ‘Host’, ‘Continent’, ‘Confederation’ and ‘Nationality’, however, are included as separate variables for both competing teams. For variable ‘Confederation’, for example, this results in two columns of the corresponding design matrix denoted by ‘Confed’ and ‘Confed.oppo’, where ‘Confed’ is referring to the confederation of the first-named team and ‘Confed.oppo’ to the one of its opponent.
In general, we will consider two different types of response variables which will lead to two fundamentally different datasets. For the first type, the number of goals is directly used as response variable. Therefore, each match corresponds to two different observations, one per team. The second type uses the ordinal variable with categories 1 (win), 2 (draw) and 3 (loss) from the perspective of the first-named team. Therefore, in this case each match represents one observation in the dataset. Also the covariate differences are computed from the perspective of the first-named team. For illustration, the resulting data structures for the exemplary matches from Table 1 are displayed in Table 2, separately for count data response in Table 2a and for ordinal response in Table 2b.
Exemplary tables illustrating the data structure for both response types

In this work, we propose to use random forests as prediction tools for the outcomes of football matches. Before introducing possible specific strategies for the application of random forests to football data we start with a general introduction into the basic ideas of random forests.
Random forests
Random forests were introduced by Breiman (2001) as an extension of the method proposed by Ho (1998). The underlying principle of random forests is the aggregation of a (large) number of classification or regression trees and, therefore, the method can be used both for classification and regression purposes. The single trees are grown independently from each other. To get a final prediction, predictions of single trees are aggregated, either by majority vote (for classification) or by averaging (for regression).
Before going into further details of the principles of random forests we shortly sketch the main essence of classification and regression trees (Breiman et al., 1984). In general, the term classification tree is used for trees with categorical (or binary) response variables, while trees for metric responses are called regression trees. With classification and regression trees the feature space is partitioned, each partition has its own prediction (or its own model, see, e.g., Zeileis et al., 2008). The partitioning of the predictor space is done recursively and can follow different criteria. However, the main goal is always to find the split which provides the strongest difference between the two new partitions with respect to the chosen criterion. Observations within the same partition are supposed to be as similar as possible, observations from different partitions are supposed to be very different (with respect to the response variable). The splits are performed subsequently, each partition can be further partitioned in the following step. The consecutive splitting steps can be visualized using a dendrogram.
For illustration we exemplarily fit a regression tree. We use (a part of) the data introduced in Section 2, which we will use later for an in-depth comparison of the predictive power of different methods. The data contain all matches from the FIFA World Cups 2002–2014. As response, we consider all final scores of the teams, that is, we have two observations per match. For simplicity, we only use three predictor variables, which are the differences between the ‘FIFA Rank’, the bookmakers’ probabilities ‘Oddset’ and the ‘Age’ of both teams.
Exemplary regression tree for FIFA World Cup data. Number of goals is used as response variable, FIFA Rank, Oddset and Age are used as predictors

Exemplary regression tree for FIFA World Cup data. Number of goals is used as response variable, FIFA Rank, Oddset and Age are used as predictors
Figure 1 shows the resulting regression tree using the function
Random forests are grown by repeatedly growing different classification/ regression trees and applied to new observations by combining the different predictions from the single trees. The main goal is to decrease the variance compared to single trees. Therefore, it is necessary to decrease the correlation between the single trees. For that purpose, two different randomization steps are applied. First, the trees are not applied to the original sample but to bootstrap samples or random subsamples of the data. Second, at each node a (random) subset of the predictor variables is drawn which are used to find the best split. But, in contrast to regular trees, in random forests the single trees are commonly not pruned. Pruning leads to a lower variance but also increases the bias. Accordingly, an unpruned tree has the advantage of being nearly unbiased but the disadvantage of having a high variance. However, the combination of many trees compensates for the high variance of the individual trees. Therefore, by de-correlating and combining many trees, predictions with low bias and reduced variance can be achieved.
In this section, we explain how random forests can be used on football data. In principle, we distinguish between two fundamentally different approaches depending on the type of response (as already described in Section 2). Similar to the methods introduced in the following section, the first approach uses the number of goals as response. Here, in the dataset each match is represented by two rows, one per team. The response is treated as a metric variable and the forest is built using regression trees. However, no explicit distribution assumption is necessary for the application of random forests. The second type of random forests directly tries to classify the ordinal outcomes (win–draw–loss; always from the perspective of the first-named team) of a match. Therefore, each match is represented by a single row in the dataset.
Random forest for the prediction of the number of goals
When the metric variable ‘Number of Goals’ is considered as the response, we use regression trees for the single trees which are then combined into a random forest. The basic principle is that a predefined number of trees
We use two slightly different variants of random forests for this approach. First, we use the variant of the classical random forest algorithm proposed by Breiman (2001) from the
However, the point estimates for the numbers of goals can not directly be used for the prediction of the outcome of single matches or a whole tournament. Simply plugging in both predictions corresponding to one match does not deliver an integer outcome (i.e., a result) for the match. For example, one might get predictions of 2.3 goals for the first and 1.1 goals for the second team. Furthermore, as no explicit distribution is assumed for these predictions it is not possible to randomly draw results for the respective match. Hence, similar to the regression methods described in the next section, we will use the predicted expected value for the number of goals as an estimate for the event rate
Random forest for the prediction of ordinal match outcomes
If instead of the number of goals the ordinal match outcomes are used as response variable, random forests specifically designed for ordinal responses are applied. They can be seen as an in-between technique of regression and classification forests. In principle, forests for ordinal responses are built as regression forests where the ordinal categories are replaced by metric score values. The determination of the exact score values depends on the type of algorithm, but the score values can also be set by the user. The aggregation of the single trees is then executed analogously to the case of classification forests. This means that the final prediction is determined by majority vote over the single regression tree predictions.
Again, two different variants are used. The first variant is the function
When the ordinal response is considered, it is essential which team is the first-named team. If the order of the teams was reverted, a value of 1 would be replaced by 3 and the other way around. Of course, such an inversion also needs to be accompanied by a redefinition of the covariates. However, even though 1 and 3 are somehow interchangeable, it turns out that across all four tournaments the relative frequencies of the three results are not balanced. While
Build Learn a separate random forest for each of the Build a second version of the test dataset which contains each match from the original test data with the inverted order of the competing teams. Using each of the
Obviously, the random forests for ordinal match outcomes cannot directly be used for the simulation of exact match outcomes. Therefore, we propose to combine an ordinal random forest with a random forest predicting the number of goals from Section 3.2.1. In that case, for the simulation of a match result we first randomly draw one of the three match outcomes based on the probabilities obtained from the ordinal forest. Subsequently, we randomly draw exact scores for both teams using the predictions from a random forest for the number of goals as described in Section 3.2.1. Then the first match result which coincides with the drawn match outcome is accepted. For example, if in the first step we draw a win of the first-named team we accept the first result where the first-named team scores more goals than the second-named team.
Alternative approaches
We want to compare the described random forest approaches to more traditional modelling approaches which have already been used for modelling football results, at least in a similar way. In general, the most frequently used modelling approach for football results is to treat the scores of the competing teams as (conditionally) independent variables following a Poisson distribution (possibly conditioning on certain covariates). Especially the works of Dixon and Coles (1997) and Maher (1982) set the basics for this modelling approach. Therefore, all methods described in this section use the number of goals scored by single teams as response variables (compare Table 2a). If, as in our case, one wants to include several covariates of the competing teams into the model it is sensible to use regularization techniques when estimating the models to allow for variable selection and to avoid overfitting. In the following, we will apply three different regularization approaches.
Lasso
The most simple approach will be to use a conventional Lasso (Tibshirani, 1996) penalty for the covariate parameters. In this model, the single scores are used as response variable and (conditionally on the covariates) a Poisson distribution is assumed. Each score is treated as a single observation, so that per match there are two observations. Accordingly, for 
For estimation, instead of the regular likelihood 
In addition to the conventional Lasso solution that minimizes the 10-fold CV error, the
Gamboost
Compared to the Lasso approach presented earlier, in the Gamboost approach the previous model is extended from linear to smooth covariate effects
Group Lasso
Finally, we use a Group Lasso approach which is a different extension of the Lasso approach presented earlier. This approach corresponds to the approach proposed by Groll et al. (2015) where it was used to predict the FIFA World Cup 2014. Here, the linear predictor from (4.1) is extended by team-specific attack and defense effects for all competing teams and has the form 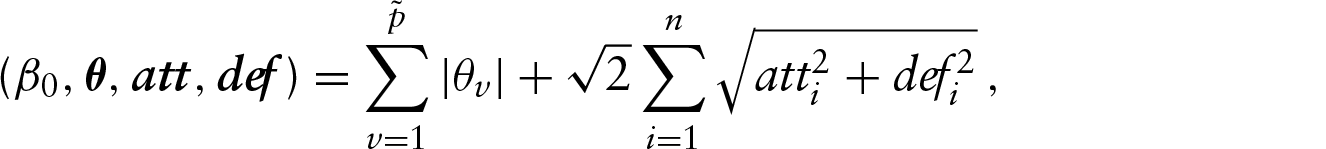
When considering distributions for count data, an alternative to the Poisson distribution is the negative binomial distribution. In general, it is less restrictive than the Poisson distribution, as it overcomes the rather strict assumption of the expectation equating the variance. For this project, we also investigated two different modelling alternatives based on the assumption of negative binomially distributed responses. First, we again used the function
There are fundamental differences between random forests and regression models with respect to their respective model outputs and the interpretations that these models allow for. Therefore, we want to shortly elaborate on these differences in a rather general manner. Exemplarily, we only pick one random forest for the number of goals and one for the ordinal match result (both based on the
The main goal of random forests is prediction. In contrast to regression models, they are harder to interpret because no explicit relationship between dependent and independent variables can be extracted. In particular, in contrast to the regularized regression methods they do not perform variable selection. Nevertheless, the importance of the single variables can be measured. Typically, this is done by permuting each of the variables separately in the out-of-bag observations of each tree and measuring the prediction accuracy. In this context, permuting a variable means that in the variable each value is randomly assigned to a location within the vector. If, for example, ‘Age’ is permuted, the average age of the German team in 2002 could be assigned to the average age of the Brazilian team in 2010. When permuting variables randomly, they loose their information with respect to the response variable (if they have any). Then, one measures the loss of prediction accuracy compared to the case where the variable is not permuted.
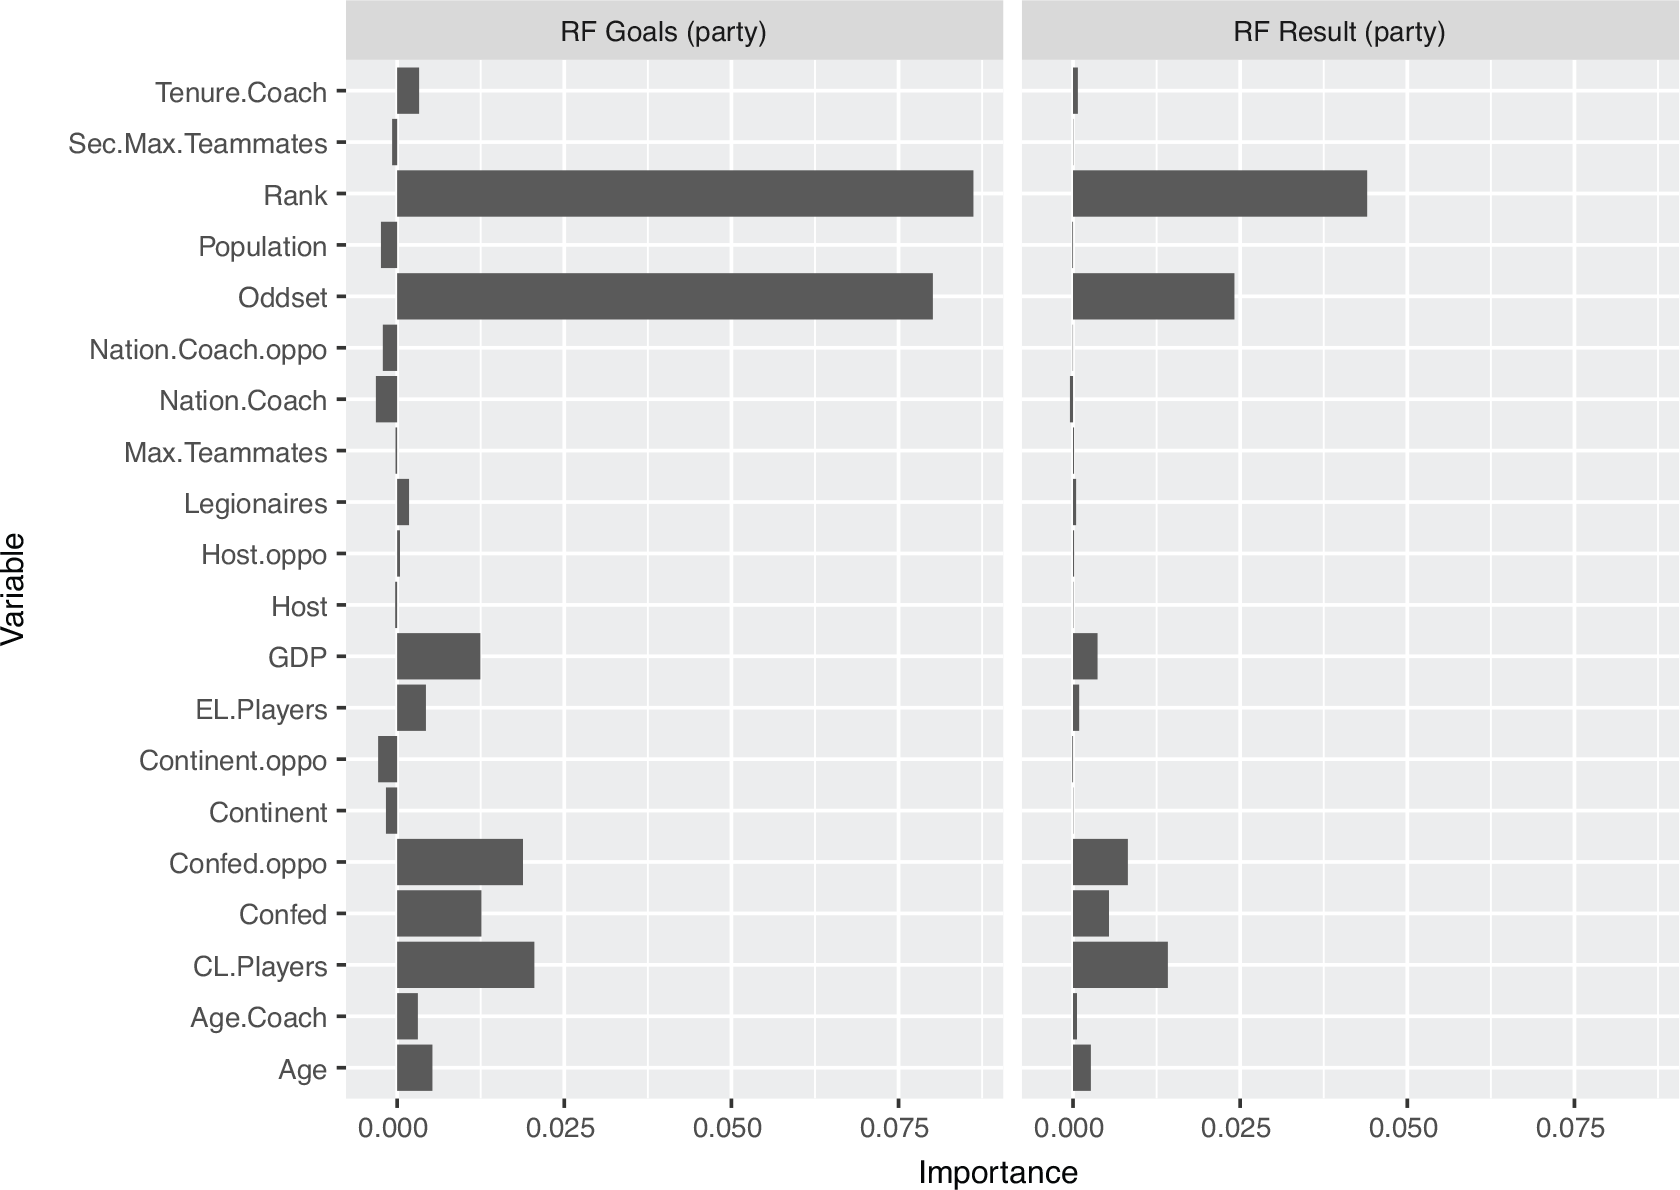
Variable importance for random forests with goals (left) and match results (right) as response variables for World Cup data from 2002–2014
Variable importance for random forests with goals (left) and match results (right) as response variables for World Cup data from 2002–2014
Figure 2 shows the respective values for the variable importance of each variable, separately for random forests predicting the number of goals and ordinal match outcomes. In the case of ordinal match outcomes we average over the values from the different (permuted) datasets, see Section 3.2.2. It can be seen that the domains of the importance values differ strongly between ‘RF Goals’ and ‘RF Result’, which is simply due to the fact that both models use different response types with different scalings. Besides that, the main outcomes are rather similar. The most important variables are ‘FIFA Rank’, ‘Oddset’ and ‘# CL Players’. Also, GDP and the ‘Confed’ variables seem to have some explanatory power. The remaining variables show very small or even negative values with respect to their variable importance and, therefore, do not provide additional explanatory power. However, the distinction between influential and non-influential variables is rather heuristic.
In contrast to random forests, regression models can estimate explicit and interpretable relationships between the covariates and the response and, in our case of regularized regression, can explicitly discriminate between influential and non-influential variables. While the estimated relationships between the covariates and the response are strictly linear in the case of Lasso, Gamboost allows for smooth functions. Table 3 shows all parameter estimates for the Lasso approach which are different from zero.
Standardized parameter estimates for Lasso on World Cup 2002–2014 data

Partial effects for all (selected) covariates in the Gamboost approach for World Cup data from 2002–2014

It can be seen that the final model is rather sparse with only three selected covariates. Interestingly, these variables coincide with the three most influential variables from both forest approaches. ‘FIFA Rank’ exhibits the strongest effect, followed by ‘Oddset’ and ‘# CL Players’. The ‘FIFA Rank’ has a negative effect because, obviously, high values of this variable are supposed to indicate rather weak teams.
In contrast to the simple linear model assumed for Lasso estimation, in Gamboost the effects can also be non-linear (smooth) functions. The estimated (partial) effects for all selected variables are depicted in Figure 3. It can be seen that, with 15 variables included in the final model, the Gamboost model is clearly less sparse compared to the Lasso solution. However, only the variables ‘# CL Players’ and ‘Legionaires’ explicitly show non-linear effects. Here, the effect sizes are somewhat harder to determine. Nevertheless, comparing the domains of the effects again shows that ‘Oddset’, ‘FIFA Rank’ and ‘# CL Players’ are (among) the most important variables.
Overall, it turns out that, although the results obtained by either random forests or regression models need to be interpreted fundamentally differently, a coinciding set of major influence variables can be identified for both approaches. In particular, the sportive success of national teams in matches of the FIFA World Cups 2002–2014 is mainly determined by the ‘Oddset’, the ‘FIFA Rank’ and the ‘# CL Players’.
In the following, we want to perform an in-depth comparison of the predictive power of all methods introduced in Sections 3.2 and 4. In particular, we are interested in the question whether the random forest approaches or the more traditional regression approaches perform better. This will be done by using the FIFA World Cup 2002–2014 dataset introduced in Section 2. We apply the following procedure:
Form a training dataset containing three out of four World Cups. Fit each of the methods to the training data. Predict the left-out World Cup using each of the prediction methods. Iterate Steps 1–3 such that each World Cup is once the left-out one. Compare predicted and real outcomes for all prediction methods.
This guarantees that each match from the total dataset is once part of the test data. Therefore, we get out-of-sample predictions for all matches. In step 5, different performance measures for the quality of the predictions are investigated, separately for the prediction of the (ordinal) match outcomes and the number of goals.
Prediction of match outcomes
In the following, let
A classical performance measure for categorical responses is the multinomial likelihood, which for a single match outcome is defined as
Furthermore, to later calculate the classification rate of each method we consider whether match
(Gneiting and Raftery (2007)) proposed to use the so-called ‘rank probability score’ (RPS) as a performance measure which, in contrast to both measures introduced earlier, explicitly accounts for the ordinal structure of the responses. For our purpose, it can be defined as
As a natural benchmark for these predictive performance measures the predictions based on bookmakers’ odds can be considered. For this purpose, we collected the so-called ‘three-way’ odds for (almost) all matches of the FIFA World Cups 2002–2014. Three-way odds consider only the match tendency with possible results victory of team 1, draw or defeat of team 1 and are usually fixed some days before the corresponding match takes place. The three-way odds were obtained from the website
Table 4 displays the results for these (ordinal) performance measures for all methods introduced in Sections 3.2 and 4 as well as for the bookmakers’ odds, averaged over 250 matches from the four FIFA World Cups 2002–2014. It turns out that in terms of the mean multinomial likelihood score, all forest-based methods and also the conventional Lasso achieve a fit that is close to the one obtained by the bookmakers, which here fulfill their role as a benchmark. With respect to the classification rate, the four forest-based methods clearly outperform all other approaches, remarkably even the bookmakers in this case. Again, the conventional Lasso is best performing among the regression methods with a performance equal to the bookmakers. Finally, in terms of the RPS again the four forest-based methods perform best, yielding clearly lower values than all regression approaches. In particular, the two random forests that directly model the number of goals achieve error rates very close to those of the bookmakers, which here again serve as the benchmark. The regression methods (except for Lasso (1se)) on the contrary yield all very similar results for RPS.
To sum up, all methods based on random forests provide very satisfactory results, which are either close to or even outperforming those obtained by the bookmakers, which can be seen as a natural benchmark. Altogether, the random forests that directly model the number of goals slightly outperform those for ordinal responses. Among the regression approaches, conventional Lasso clearly performs best and overall seems to be a convincing competitor to the forest-based methods.
Comparison of the different prediction methods for the ordinal match outcome based on multinomial likelihood, classification rate and ranked probability score (RPS)

Comparison of the different prediction methods for the ordinal match outcome based on multinomial likelihood, classification rate and ranked probability score (RPS)
Beside the ordinal match outcome (win, draw, loss), we are also interested in the performance of the regarded methods with respect to the prediction of the exact number of goals. This is important, for example, if one wants to predict the whole tournament course or the winning probabilities for a FIFA World Cup before the start of the tournament. The reason is that in order to identify the teams that qualify for the knockout stage, one has to determine the precise final group standings. To be able to do so, the precise results of the matches in the group stage play a crucial role. The final group standings are determined by (a) the number of points, (b) the goal difference and (c) the number of scored goals. If several teams coincide with respect to all of these three criteria, a separate chart is calculated based on the matches between the coinciding teams only. Here, again the final standing of the teams is determined following criteria (a)–(c). If still no distinct decision can be taken, the decision is induced by lot.
For this reason, we also evaluate the performance of all introduced methods with regard to the quadratic error between the observed and predicted number of goals for each match and each team, as well as between the observed and predicted goal difference. Let now
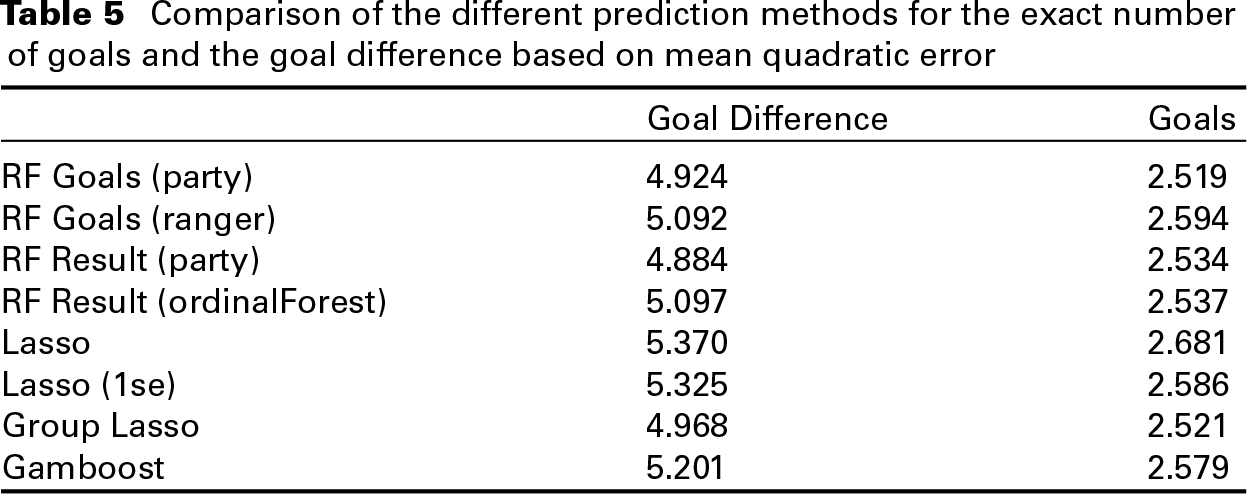
Comparison of the different prediction methods for the exact number of goals and the goal difference based on mean quadratic error
Comparison of the different prediction methods for the exact number of goals and the goal difference based on mean quadratic error
Table 5 summarizes the corresponding results. In general, the overall trend that the random forest methods outperform the regression-based approaches is confirmed. However, in contrast to the results from the previous subsection, here the disparities between the forest-based methods are less evident. Now, the best-performing method with respect to the quadratic error of the goal difference is based on a random forest for ordinal responses, namely the one implemented in the
Further insight into the predictive performance of the different fitting procedures can be obtained by analysing the success of certain betting strategies. The betting strategy presented in the following is again based on the three-way odds from the website
Betting returns (in
) for different prediction methods

Betting returns (in
) for different prediction methods
It turns out that, altogether, the differences between the returns are relatively high across the different methods. Among the random forests, those from the
In the present work we compared two fundamentally different, covariate-based approaches for the modelling and prediction of matches in international football tournaments, namely random forests and regression methods. We describe the methods and, on a dataset containing all matches of the FIFA World Cups 2002–2014, compare the predictive performance of random forests for both ordinal and metric response to conventional regression methods for count data, such as Poisson GLMs.
In order to evaluate the performance of the methods, several different performance measures for both ordinal match outcomes and the precise number of goals were investigated. For ordinal match outcomes, all methods based on random forests provided very satisfactory results, which were either close to or even outperforming those obtained by the bookmakers (serving as natural benchmark). Moreover, the forest-based methods outperformed the regression approaches. Only conventional Lasso turned out to be a convincing competitor to the forest-based methods. Within the forest-based methods, random forests that directly model the number of goals slightly outperformed those based on ordinal responses.
In terms of the quadratic errors for the precise number of goals, the overall trend that the random forest methods outperform the regression-based approaches was confirmed. However, disparities between the forest-based methods were less clear: while the best-performing method with respect to the goal difference was based on a random forest for ordinal responses, the best approach for the goals was a random forest directly modelling the number of goals. So here it was not possible to clearly identify a best-performing class of random forests, that is, forests for either ordinal or metric responses. The only regression approach able to compete with the forest-based methods was the Group Lasso, while the conventional Lasso performed rather bad.
Finally, we also analysed the performance of the methods in terms of the success of a simple betting strategy. In general, we found relatively high differences between the returns across the different methods. The highest returns among the tree-based methods were obtained by the
Overall, our analyses showed that generally random forests slightly outperform regression-based approaches with respect to a variety of prediction performance measures. Only conventional Lasso turned out to be a promising competitor. Based on these findings, we plan to establish a random forest-based prediction model for simulating the FIFA World Cup 2018 tournament, which takes place in Russia. However, as several of the underlying covariates are based on the final squads nominated for the FIFA World Cup 2018, we need to wait until the final official squad announcements, which the national coaches need to provide by 4th of June 2018.
Acknowledgments
The authors received no financial support for the research, authorship and/or publication of this article.
Declaration of conflicting interests
The authors declared no potential conflicts of interest with respect to the research, authorship and/or publication of this article.
Funding
The authors received no financial support for the research, authorship and/or publication of this article.