




Abstract
This article introduces a flexible modelling strategy to extend the familiar mixed-effects models for analysing longitudinal responses in the multivariate setting. By initiating a flexible multivariate multimodal distribution, this strategy relaxes the imposed normality assumption of related random-effects. We use copulas to construct a multimodal form of elliptical distributions. It can deal with the multimodality of responses and the non-linearity of dependence structure. Moreover, the proposed model can flexibly accommodate clustered subject-effects for multiple longitudinal measurements. It is much useful when several subpopulations exist but cannot be directly identifiable. Since the implied marginal distribution is not in the closed form, to approximate the associated likelihood functions, we suggest a computational methodology based on the Gauss–Hermite quadrature that consequently enables us to implement standard optimization techniques. We conduct a simulation study to highlight the main properties of the theoretical part and make a comparison with regular mixture distributions. Results confirm that the new strategy deserves to receive attention in practice. We illustrate the usefulness of our model by the analysis of a real-life dataset taken from a low back pain study.
Keywords
Introduction
Linear mixed-effects (LME) models have been progressively extended in recent studies to analyse some correlated data, including longitudinal or clustered, wherein a set of subjects has repeatedly measured on different conditions or periods (Laird and Ware (1982)). A routine assumption in fitting various mixed models is the normality of underlying subject-effects though it may be violated in practical applications. For example, at the presence of outliers, the random-effects may follow a structure with heavier tails than the normal distribution. Another realistic situation involves the existence of latent subpopulations in the data generating process, mainly when significant categorical covariates have omitted by mistake in the fixed part of the models.
Although the conventional likelihood-based estimates of fixed effects might be robust to non-normality of random-effects (Butler and Louis (1992)), the same is invalid for the prediction of random-effects (Zhang and Davidian (2001)). Also, the maximum likelihood estimate of model parameters, including variance components, suffers from the loss of efficiency and incorrect computation of standard errors (Pinheiro et al. (2001)). In recent years, the main aim of several types of research has been centering on choosing suitable distributions for the random-effects and calibrating them efficiently to the observed data. In some applications, to avoid misleading inference, it is suggested that the collected measurements must be classified based on the adoption of a multimodal distribution for random-effects.
The choice of statistical methods in the literature to set up a multimodal structure has mostly focused on a mixture of multiple unimodal components. An example of a finite mixture of normal distributions in LME models is given by (Verbeke and Lesaffre (1996)) and detailed further by (Verbeke and Molenberghs (2000)). Another application, using the skew-t components, is proposed by (Lin (2010)) to allow the accommodation of both skewness and thick tails for random-effects.
In this article, we extend the familiar mixed-effects models to the analysis of multiple longitudinal responses by utilizing an innovative modelling strategy to cover possible multimodality of data. We fit separate LME models to all response variables and join them by allowing a suitable multivariate multimodal distribution for the random-effects.
There are several issues in the application of mixture distributions to fit LME models for multiple responses. One is the identifiability (Hennig (2000)) due to the unstructured forms of covariance matrices and a large number of unknown parameters that make the use of traditional estimation procedures complicated. Any mixture distribution intending to simplify the execution of computational techniques requires convincing prior information on the choice of the number of components. Adopting this number to be fixed to avoid overfitting with the same distribution for all clusters sound to be strict restrictions. Other constraints comprise the linearity of dependence structure between variables and the similarity of all marginal distributions.
The importance of dealing with these challenges motivated us to investigate alternative strategies that offer great flexibility in jointly modelling of multimodal data. We construct a new multivariate distribution by a combination of copula functions (Sklar (1959)) and a member of elliptical distributions (Fang et al. (1990)) called the double Gamma (DG) distribution. It is a suitable choice for analysing longitudinal data that exhibit multimodality since it can cover most distributional peaks through a limited number of parameters without the need for strong prior information. Moreover, this option overtakes mixture distributions that tend to enforce additional components or parameters to capture more peaks. Furthermore, the use of copulas can separate the dependence structure of a multivariate distribution from the individual marginal distributions by looking at its underlying copula form. During the data analysis using the copula system, the analyst should be aware of various associations between variables and recognize tails of the related distributions (Joe (2014); Durante and Sempi (2015)). For instance, a copula may be useful to observed data indicating correlation in the extreme tails but not elsewhere in the distribution.
The proposed strategy constructs a multimodal structure for the underlying random-effects based on the DG distribution and a suitable copula. It has several key advantages, such as (a) facilitating the fitness of general mixed models with multiple responses, (b) presenting great flexibility for modelling the non-linear correlations between responses, (c) allowing divers margins for each response variable, (d) joining various types of response variables with multimodal behaviours, (e) managing the impact of hidden subpopulations with different characteristics in terms of peaks that cannot be directly observable through the value of responses, (f) being useful for analysing clustered data, (g) avoiding incorrect inference when the normality of random-effects is violated, clustering of measurements occurs, and some significant categorical covariates have omitted accidentally.
We use the maximum likelihood approach to fit the proposed models. The likelihood functions do not appear in closed-form expressions due to complicated integrals. Thus the advantage of advanced numerical techniques is undertaken to jointly approximate integrals and maximize underlying likelihoods. The estimation process for the proposed joint mixed model with non-normal random-effects is a difficult task. A useful procedure for fitting complex mixed models is NLMIXED in SAS (High and Elrayes (2017); SAS Institute (2018); Toenges and Jahn-Eimermacher (2020)). First, the process carries out by the Gauss—Hermite quadrature technique to approximate involving integrals over the random-effects distributions. Then, the model fitting strategy reiterates for non-normal random-effects by reformulating the integrated likelihood function (Liu and Yu (2007); Liu and Huang (2008)). It delivers the SAS programming statements that remain similar to the general mixed models. At each iteration of the process, computation of the gradient vector and the approximate Hessian matrix for the likelihood function is accomplished by summing over subjects and quadrature points along with updating parameters estimate via the Newton–Raphson algorithm. The entire procedure is repeating until successful convergence. Finally, this procedure results in parameter estimates along with their approximated standard errors based upon the diagonal elements of the inverse observed-Hessian matrix. The normal approximation theory is then convenient for the statistical inference (Pinheiro and Bates (1995); Molenberghs et al. (2009); Jiang (2017)).
We examine the usefulness of our methodology in the analysis of low back pain (LBP) and its related disabilities, which have grown in most industrialized countries and are amongst the most frequent reasons for consulting a primary care physician. Prevention of LBP in primary stages is a principal public health problem worldwide since it contributes to the prevention of disabilities because of back pain in progressive stages. To evaluate the contributions of some factors to the acute LBP, we apply our strategy to re-analyse a real-life dataset taken from a prospective cohort study on LBP (Park et al. (2010)).
The remainder of the article is organized as follows. Section 2 introduces the proposed univariate DG distribution and reports its main properties. Section 3 presents a short introduction of copula functions with the construction of a new multivariate multimodal distribution using copulas. Section 4 specifies the multivariate mixed-effects models and extends strategies to jointly analysing multiple multimodal responses. Section 5 provides a simulation study to evaluate the performance of our proposed model. Section 6 illustrates our methodologies to analyse a real-life dataset taken from the LBP study and makes a comparison of our proposed model with several competitors.
Double Gamma distribution
A special case of elliptical distributions (Fang et al. (1990)) is the DG distribution (Johnson et al. (2004); Nguyen and Chen (2009)), defined as follows.


where The density plot of
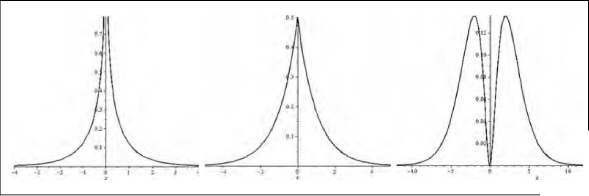
The univariate DG distribution is symmetric about
Consider the random vector

As already mentioned, closed-form expressions are available for the PDF and CDF of the univariate DG distribution. Thus, we introduce at least one DG distribution as the marginal of copula to consequently provide a collection of multivariate multimodal distributions. The dependence between related variables is then specified by making use of an assigned copula.
An attractive feature of copulas is to facilitate constructing scale-invariant measures of dependence that remain unchanged under monotonically increasing transformations of the marginal distributions. Thus, the specialist can express any scale-invariant dependence measure in terms of the underlying copula (Trivedi and Zimmer (2007); Durante and Sempi (2015)). A well-known type of these measures is Kendall's

If the copula

The proposed approach can accommodate multimodality. To show this case, we present in Figure 2, the contour plot of familiar Archimedean copulas (Nelsen, 2006) coupled with DG and normal margins.
Note that the value of Kendall's
The density plot of the copula with the standard normal as both margins (left), the DG as one of two margins (centre), and the DG as both margins (right)

The multivariate linear mixed-effects (MLME) modelling is an appropriate technique to describe the variation in multiple responses that are measured repeatedly over time periods for each subject in terms of a set of fixed covariates. Let

In this article, we propose an extension of MLME models that promote to analyse the multiple clustered responses. We construct a new model by allowing the response vector
In the regression modelling methodology, the marginal expectation of responses is commonly assumed to depend only on the covariates, that is,
For illustration, consider the following simple model



The above expressions reveal that the correlation between measurements of responses is directly related to the correlation measure between responses-specific random-effects. It also shows that measures within each response variable may be correlated even if measures between two mixed responses are uncorrelated.
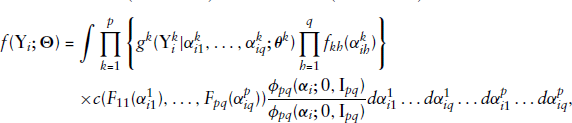
The inference for the vector of unknown model parameters

To carry out the inference of
In fitting LME models for non-normal responses, the Gaussian quadrature technique can approximate the marginal density function by a weighted average of the integrand directly when the random-effects follow a normal distribution and the dimension of the random-effects vector is not large (Lesaffre and Spiessens (2001); McCulloch and Searle (2001); Gueorguieva (2001)). Thus, the estimation process is not straightforward when we use the Gaussian quadrature for fitting our proposed model.
Nevertheless, using a statistical trick followed by (Liu and Yu (2007)), we can multiply and divide the integrand in (4.1) by a standardized multivariate normal density and reformulate the resulting function over the vector of normal random-effects

Simulation studies
We conduct two simulation studies to highlight the performance of our modelling methodology in comparison to normal and mixture models. To obtain the maximum likelihood estimation of model parameters, we use the Gauss–Hermite quadrature, implemented in the NLMIXED procedure of SAS (SAS Institute (2018)).
To design the first simulation study a specific mixed-effects model is considered for illustrative purposes. In particular, we generate 100 datasets from the bivariate LME model

To generate Generate two independent uniform random variables Set
Then, we generate
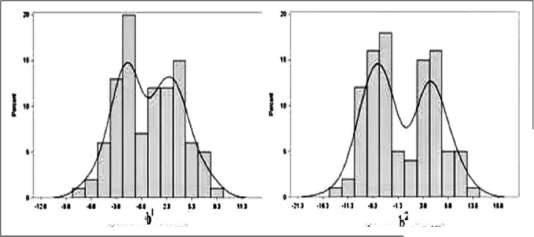
Histograms of the generated random intercepts in Figure 3 demonstrate the existence of two modes for each one. Also, in Figure 4 (left) and (centre), the scatter plot and the distribution surface of random intercepts show that two partitions exist and the non-linearity of the dependence structure is present.
Histograms of the generated random-effects from the Clayton copula with DG margins
The scatter plot (left), the surface plot (centre) and the contour plot (right) of the generated random-effects from the Clayton copula with DG margins

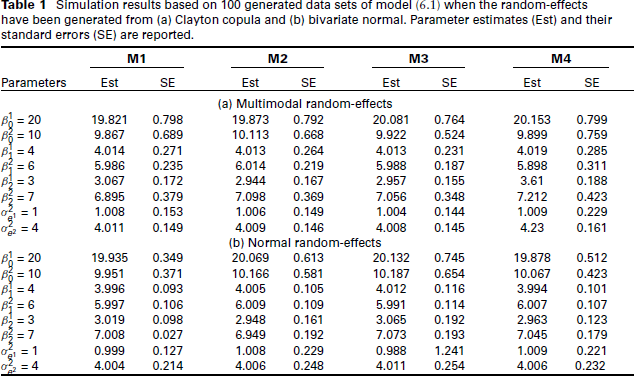
Simulation results based on 100 generated data sets of model (6.1) when the random-effects have been generated from (a) Clayton copula and (b) bivariate normal. Parameter estimates (Est) and their standard errors (SE) are reported.
For each of 100 generated datasets, Model (6.1) was fitted by assuming that the bivariate normal the mixture distribution the Clayton copula with margins the Gaussian copula with margins
To make a comparative study, we report the parameter estimates and their standard errors of each model in Table 1(a). We also compute the Akaike information criteria (AIC) and the Bayesian information criteria (BIC) to select the best-fitted model. These values show that M3 is the best-fitted model for the generated dataset. The estimate of shape parameters for the DG margins is also significant.
A comparison of various models shows that the most parameter estimates are nearly unbiased and the same for all fitted models. In model M3, biases and standard errors are small. The efficiency of
Figure 4 (right) displays the scatter plot of predicted random intercepts from model M3, with the super-imposed contour plots of the fitted Clayton copula with DG margins. It demonstrates that the additional flexibility provided by the proposed distribution is sufficient to capture quite accurately the true multimodality of random intercepts.
Afterward, we design the second simulation by assuming that the random intercepts follow a bivariate normal and illustrate that the proposed model still provides reasonable estimation results. The evidence reveals that the proposed model deserves to be adopted in practical applications as a preferred substitution even if the classical model is correct. Specifically, we let
For each of 100 generated datasets, we again, fit Model (6.1) by assuming that
We reanalyse a real-life dataset, which is taken from a prospective cohort study on LBP (Park et al. (2010)), to illustrate the usefulness of our proposed MLME model. The main aim of the study was to explore the effect of a treatment package composed of herbal medicine, acupuncture, bee venom acupuncture and a Korean version of spinal manipulation (Chuna) on LBP. We show that our methodology is useful when a complex structure involving the multimodality of bivariate responses is to be analysed.
Data description
The institutional review boards (IRBs) of both the University of North Carolina and Jaseng hospital in Korea has organized the LBP study. The dataset, collected from November 2006 to October 2007, includes a sample of 127 patients in total. They have not being previously treated for LBP at the Jaseng hospital. We delete some specific cases from the original sample due to some exclusion criteria, such as back pain caused by non-spinal or soft tissue issues, pregnancy, spinal tumour, rheumatoid arthritis, the history of back surgery, vertebral fracture, dislocation, suspected concurrent severe neurological symptoms and major organ transplantation (such as the heart, kidney or liver). The control of treatment was at baseline, and followed-up measurements were at weeks 4, 8, 12, 16, 20 and 24. Patients were
In our modelling process, we will jointly analyse the visual analogue scale (VAS) (0-10) of back pain (Jensen et al. (1986)) and the Oswestry Disability Index (ODI) (Beurskens et al. (1996)). The model includes several medical and demographic factors such as the patients’ age, sex, body mass index (BMI), surgery recommendation (0 = recommended and 1 = not recommended), baseline measures of two responses, and the quality of life variables according to different subcategories mental health and physical health. These two main summary measures have aggregated from eight subscale items (physical functioning, role-physical, bodily pain, general health, vitality, social functioning, role-emotional and mental health) of the SF-36 Health-Related Quality of Life Questionnaire (Ware et al. (1995)) and are defined as scores ranging from 0 to 100 wherein the higher score indicates an improved level of health.
A preliminary descriptive analysis shows that the number of patients who are in the normal BMI category (18.5–23), overweight (
Data analysis
The individual profiles plot, not shown here, shows that both ODI and VAS levels increase over time for most patients and substantial inter-patient variation exists. Thus, we consider the following random-intercepts models for responses 
Next, to verify whether a correlation exists between two responses in Model (7.1), we present a preliminary correlation structure. The empirical correlation between the pair (ODI, VAS) was 0.62, suggesting that a bivariate model may significantly fit better than two separate univariate LME models. Results of the fitted models show that the correlation between the prediction of random intercepts of two separated models for the ODI and the VAS is close to one (0.83), which may suggest that a model with one shared random intercept should also fit well. A comparison of two fitted models with shared and separated random-intercepts shows that the sharing strategy makes no better fit based on the smallest AIC and BIC values. Thus, our preliminary data analysis process verifies that a plausible model should assume that
As a preliminary bivariate mixed-effects model, we let
Histograms of the predicted random intercepts from model (7.1) in low back pain study

The scatter plot (left). The surface plot of the predicted random intercepts from the bivariate mixed model M1 (centre). The contour plots of the Clayton copula with DG margins in the low back pain study (right).

The above evidence motivates us to examine the ability of our proposed strategy to classifying patients, without any prior information to the group's structure.\\ The strong dependence observed in the lower-left region of the predicted random intercepts from model (7.1) may be covered by the Clayton copula. Thus, we specify a multimodal bivariate distribution for the random intercepts by utilizing the univariate DG distribution for each random intercept and the Clayton copula to join them. Because the joint distribution of random intercepts is multimodal, we fit a bivariate LME model specified by a finite mixture of normal components and the bivariate DG distribution for random intercepts.
For comparison, we fit the mixed-effects model (7.1) by assuming that the random intercepts be distributed as the already introduced specification for Models M1–M3 and two following models. The Clayton copula with margins The Clayton copula with margins
Table 2 shows the estimation results. We report the SAS code for M5, as an example, in Appendix. The values of model selection criteria show that M5 is the best-fitting model, while M3 is the second-best one. The dependence parameter of Clayton copula with the shape parameter of the DG margin in M5 are both significant. We observe that the standard errors of fixed effects associated with most covariates in the normal model M1 are larger than those models assuming multimodality and are smaller in the selected model M5. The same is true for the estimate of random-effects variances.
Figure 6 (right) displays the scatter plot of the predicted intercepts with the super-imposed contour plots of the fitted model M5. This figure indicates that our proposed model can flexibility capture the multimodality and the non-linear dependence between the random intercepts.
Estimate (standard error) of model parameters under the fitted models M1–M5 for the low back pain study. ODI = Oswestry Disability Index; VAS = Visual analogue scale
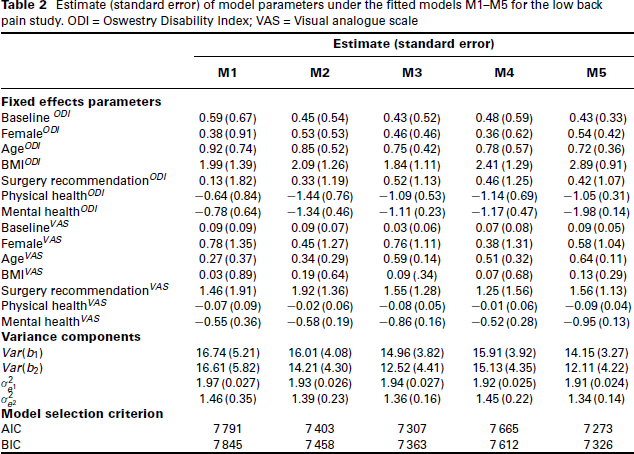
Results of the best-fitted model show that both responses significantly unrelated to the gender and surgery recommendation with a considerable amount of pain or disability at the beginning of the study. An intervention may be associated with the degree of patient improvement, according to the VAS and ODI changes in the follow-up values. Previous researchers have already addressed this result (Karaman et al. (2011)).
As expected, our analysis shows that a significant positive relationship exists between age and both ODI and VAS. It means that an increase in age leads to higher disability and pain severity. We can show that the risk of disabling back pain rises in older-ages. Accordingly, it is much appreciated to find a desirable policy for LBP in elderly patients. Another finding of our study is the significant positive relationship between BMI and both ODI and VAS. It means that the pain severity and the risk of disabling back pain rise in the overweight category. We also observed a relationship between the disability of patients with chronic pain and a significant negative relationship between physical and mental health with both ODI and VAS. These show that a correlation exists between the reduction in pain and the improvement in disability simultaneously. Also, an increase in quality of life is noticeable when excluding the effect of other factors. The negative correlation of quality of life with chronic low back pain is in concordance with other studies (e.g., (Di Iorio et al. (2007))). As expected, decreased disability also had an impact on the physical and mental components score of the quality of life given the bilateral relationship. However, we omitted it in our study and only investigated the effect of quality-of-life components on the pain severity and disability of patients.
Discussion
A primary requirement of analysing multiple responses in mixed-effects modelling is to construct a multivariate distribution from desired marginal distributions with a given dependence structure. A flexible tool is a copula model, which extends the MLME models in an adaptable alternative that the dependence between multiple correlated responses is not necessarily limited to be in linear dependence structure. Furthermore, the proposed methodology is useful when the marginal distributions of responses are non-normal. Besides, it is convenient to model heterogeneous data with some unobserved subpopulations. The strategy was to specify the separate LME models with random intercepts with each response distributed as the DG. Then, we used a copula function to join the random intercepts of two response variables. Since the copula eliminates the effect of univariate margins from their dependence structure, the strategy causes greater flexibility in designing mixed-effects models that are applicable in real empirical applications. It is also helpful when several peaks exist in joint or each one of the marginal distributions of responses but is not directly detectable. A simple extension is to allow controlling of the unobserved subject heterogeneity by letting some regression coefficients being heterogeneous across subjects and consequently fit random slopes models. It is a topic of our future research.
We should mention that our proposed strategy to jointly modelling clustered data differs in methodology in comparison to other tools in the literature. In the analysis of binary and continuous responses, (Gueorguieva and Agresti (2001)) proposed a correlated probity model without using the copula approach. (Lambert and Vandenhende (2002)) offered an adaptable way of modelling the dependence between the components of non-normal multivariate longitudinal data by using the copula but without any notice on the multimodal structure of data. Also, to relax the normality assumption in the multivariate longitudinal setting, (Nai Ruscone and Osmetti (2017)) introduced the implementation of the D-vine copula function. Our proposed strategy uses familiar copulas to illustrate how two types of dependence between variables and time appear in the multivariate-clustered longitudinal data framework.
Our proposed strategy can be used suitably as an attractive alternative to the multivariate mixture modelling since it can cover multimodality via a fewer number of parameters without employing any selection method to determine the number of mixture components. It is not, however, applicable to research studies with aims concentrated only on classification, clustering, or discrimination of population under investigation. Although our simulation studies show that the proposed strategy is convenient for the analysis of multimodal correlated data, further research is required to illustrate the strengths and weaknesses of our modelling strategy when comparing with finite mixture models.
We employed a numerical integration technique using the Gauss–Hermite quadrature to carry out statistical inference through the maximum likelihood approach. Although most commonly available software packages, such as SAS or R, are useful to implement the technique, in our experience, fitting multiple mixed-effects models with several responses is somehow complicated. The optimization algorithms may terminate due to non-convergence. The analyser requires some carefully selected initial values. Thus, for future work, we suggest performing other estimation approaches based on Bayesian computation. It can be implemented easily in software packages, such as OpenBUGS, STAN, or JAGS in R.
Footnotes
Appendix
A sketch of the SAS programme is available below. The maximization of a general log-likelihood function proceeds by option ‘general\rq to ‘model\rq statement. The variable ‘lastid\rq is set to 1 for the last record of the same patient and zero otherwise.
Acknowledgments
Authors are grateful to the Editor and anonymous reviewers for positive comments. The first author is also grateful to the Graduate Office of the University of Isfahan for the support.
Declaration of conflicting interests
The authors declared no potential conflicts of interest with respect to the research, authorship and/or publication of this article.
Funding
The authors received no financial support for the research, authorship and/or publication of this article.