
Abstract
Motivated by a longitudinal oral health study, the Signal-Tandmobiel® study, an inhomogeneous mixed hidden Markov model with continuous state-space is proposed to explain the caries disease process in children between 6 and 12 years of age. The binary caries experience outcomes are subject to misclassification. We modelled this misclassification process via a longitudinal latent continuous response subject to a measurement error process and showing a monotone behaviour. The baseline distributions of the unobservable continuous processes are defined as a function of the covariates through the specification of conditional distributions making use of the Markov property. In addition, random effects are considered to model the relationships among the multivariate responses. Our approach is in contrast with a previous approach working on the binary outcome scale. This method requires conditional independence of the possibly corrupted binary outcomes on the true binary outcomes. We assumed conditional independence on the latent scale, which is a weaker assumption than conditional independence on the binary scale. The aim of this article is therefore to show the properties of a model for a progressive longitudinal response with misclassification on the manifest scale but modelled on the latent scale. The model parameters are estimated in a Bayesian way using an efficient Markov chain Monte Carlo method. The model performance is shown through a simulation-based example, and the analysis of the motivating dataset is presented.
Keywords
Introduction
The diagnosis of caries lesions is still a matter of concern in dentistry. Dental caries is one of the most prevalent chronic diseases worldwide, affecting people in all age groups. Many epidemiological surveys and clinical studies have been carried out to establish risk factors for caries experience (CE; present and past caries). However, the process of detecting CE is not obvious. Indeed, CE can be misdiagnosed, leading to misclassified outcomes.
Caries lesions are typically classified into four levels (Reis et al., 2006):
The CE process has a progressing behaviour since CE includes present but also past caries. To analyse CE of several teeth jointly in time, a statistical approach is needed that allows for a multivariate monotone non-decreasing binary process subject to misclassification since: (a) CE is a progressive or monotone non-decreasing disease; (b) events on teeth of the same person are dependent; and (c) dental examiners may not detect the tooth's true condition.
Most often, when measurement error or misclassification occurs, additional parameters are necessary to correct the bias yielded by the use of error-prone data. Gustafson (2003), Carroll et al. (2006) and Buonaccorsi (2010) presented reviews on the effects of misclassification and measurement error on model estimates. Ignoring measurement error or misclassification will cause the data and thus the information perceived as too accurate, leading, in many cases, to non-optimal decisions. Therefore, statistical models should incorporate correction mechanisms for measurement error or misclassification to produce proper inference.
Statistical models for correlated binary responses subject to misclassification have been suggested (Roy and Banerjee, 2009; Poon and Wang, 2010). While Roy and Banerjee (2009) worked on binary responses, Poon and Wang (2010) and Roy et al. (2016) addressed ordinal responses. In cross-sectional studies, several analysis strategies have been proposed for correcting for misclassification. From overview articles such as Neuhaus (1999), Neuhaus (2002), Mwalili et al. (2005) and Küchenhoff et al. (2006), one can see that the scientific literature has produced basically two approaches.
In the first approach, a validation dataset is used that contains the true and possibly misclassified data enabling to estimate the sensitivity and specificity of the observed process. This validation dataset can be internal (part of the main dataset) or external (obtained outside the main dataset). Correction for misclassification is done via the estimated sensitivity and specificity preferably taking into account also the estimation error. In the second approach, multiple possibly misclassified observations are available for each true, but unobserved, measurement. In that case, no validation dataset is needed to correct for misclassification given that the observed measurements are conditionally independent given the true measurement. Examples of this approach can be found in Vacek (1985), Duffy et al. (1992) and Richardson and Gilks (1993). For possibly misclassified longitudinal univariate categorical responses, generalized linear mixed models (Neuhaus, 2002), generalized estimating equation (GEE)’based approaches (Neuhaus, 2002; Wang et al., 2008; Chen et al., 2014), structural equations (Palta and Lin, 1999) and transition models (García-Zattera et al., 2010; García-Zattera et al., 2012) have been proposed in combination with the second approach.
Caries is developed over time in a continuous manner. The above four stages of caries help the scorer to classify the damage caused by the caries process. However, the distinction between stages
Hidden Markov models (HMMs) are appropriate to model misclassification in some context. For the analysis of misclassified non-monotone longitudinal responses, HMM have been considered in the literature by some authors (Nagelkerke et al., 1990; Cook et al., 2000; Rosychuk and Thompson, 2001; Rosychuk and Thompson, 2003; Rosychuk and Islam, 2009; Benoit et al., 2016), whereas others (Espeland et al., 1988, 1989; Schmid et al., 1994; Singh and Rao, 1995; Albert et al., 1997; García-Zattera et al., 2010; García-Zattera, 2011; García-Zattera et al., 2012) addressed the problem of misclassified monotone longitudinal responses. HMMs with random effects (Altman, 2007), also called MHMMs, have been used to cope with misclassification in multilevel data by Zhang and Berhane (2014) and longitudinal data by Dedieu et al. (2014). The model parameters of HMM and MHMM for true monotone responses may be estimated without the use of external information on the misclassification parameters, being examples of the second class of approaches to correct for misclassification. Vacek (1985) notes that the conditional independence assumption for binary outcomes may be not realistic when the binary outcome is actually obtained by discretizing a continuous latent score, as is the case here.
In this article, we propose an inhomogeneous MHMM with continuous state-space (CS-MHMM) for the analysis of longitudinal CE data collected in the Signal-Tandmobiel® study. In our approach, the true but latent correlated responses are subject to an unconstrained misclassification error process and have a monotone non-decreasing behaviour. The same dataset has already been analysed by García-Zattera et al. (2012). These authors assumed conditional independence of the multivariate binary CE responses on the manifest level. Instead, our approach makes use of a random effects model, but, most importantly, conditional independence is now assumed on the latent continuous CE variables. More specifically, it is assumed that the binary CE outcome is realized by discretizing a continuous latent score that expresses the actual disease process. Assuming conditional independence on the latent continuous variables is a weaker restriction than the one considered by García-Zattera et al. (2012). Thus, in our approach, latent continuous responses describe the CE process. When binarized, they yield the possibly misclassified binary CE outcomes. Further, they are related to covariates through a continuous monotone non-decreasing process. Random effects describe the relationship among teeth for each subject. The measurement error assumption is defined on these latent continuous variables by using the classical additive measurement error model. The proposed model is analysed with a Bayesian approach.
The outline of this article is as follows. The Signal-Tandmobiel® study is introduced in Section 2, illustrating the need to address measurement error. The proposed approach is presented in Section 3. In Section 4, the prior distributions are described and the posterior distributions are explored. Section 5 shows the model performance by considering a simulation-based experiment, whereas the analysis of the Signal-Tandmobiel® data is presented in Section 6. Concluding remarks can be found in Section 7. The Appendix shows our conditional independence assumptions. Finally, a supplementary material document for properties about conditional independence, identifiability of the parameters, and a sensitivity analysis is presented.
The motivating dataset and problem
In the Signal-Tandmobiel® study, children between 7 and 12 years of age from Flanders (North of Belgium) were examined annually between 1996 and 2001 on the premises of their school. In total, 4 468 Flemish children (2 315 boys and 2 153 girls) were randomly drawn through a stratified cluster sampling design without replacement. First the schools were selected, stratified by province (five provinces) and educational system (three systems), with a probability proportional to the number of children in the first year of primary school. In a second step, all children in the first class of the school were included in the study.
The clinical examinations were based on visual and tactile observations in a mobile dental clinic, with a standard dental chair and artificial dental light, but no X-rays were taken. Apart from the dental information also information on oral hygiene and dietary habits were obtained through structured questionnaires completed by the parents or the children (at age of 12 years). Scoring was done by 16 trained dentists (examiners). Caries on primary teeth, emergence of permanent teeth and also caries on permanent teeth were assessed.
In this study, we look at the emergence and CE of the four permanent first molars. These are teeth 16 and 26 on the maxilla (upper quadrants), and teeth 36 and 46 on the mandible (lower quadrants). The coding of teeth is based on the notation of the Federation Dentaire Internationale (
To train the dental examiners, calibration exercises were organized at regular intervals according to the guidelines of training and calibration published by the British Association for the Study of Community Dentistry (Pitts et al., 1997). The dental examiners were calibrated by comparing their scoring on a group of children with relatively high probability of caries to those of a benchmark examiner. There exists no gold standard for scoring CE. In fact, there cannot exist a gold standard, since caries is not really a process in the mouth with mineralization and demineralization constantly in action. Alternatively, one could opt for a very experienced dental examiner, as we have done here. This benchmark scored is assumed to be error-free or is nearly so (Wacholder et al., 1993). Calibration exercises were carried out twice a year for all sixteen examiners to maintain a high level of intra- and inter-examiner reliability. Three exercises were organized to calibrate the scoring of CE (1996, 1998, 2000), involving 92, 32 and 224 children, respectively. More details on the Signal-Tandmobiel® can be found in Vanobbergen et al. (2000).
In our statistical analyses, we considered CE as a binary outcome indicating whether the tooth is decayed, at least, at a
Since CE expresses a progressive disease, observed reversals CE = 1 followed by CE = 0 represent misclassification. To obtain the true value for CE might be difficult since nowadays composite materials can hardly be differentiated from the natural enamel. But also the location of the cavity can make correct scoring difficult, for example, when the tooth is in the back of the mouth. Discolorations of the enamel might be classified as CE. The calibration sessions aim to minimize the misclassification rates, and the results during the exercises indicate that examiners score relatively well.
In Figure 1 patterns are shown with reversals that indicate misclassification. The problem is now to find out when misclassification occurs. In other words, was scoring CE = 0 after CE = 1 wrong, or was the first scoring of CE = 1 wrong?
Patterns in Signal-Tandmobiel® data showing misclassification errors. Symbols • and • represent absence and presence of caries, respectively

Patterns in Signal-Tandmobiel® data showing misclassification errors. Symbols • and • represent absence and presence of caries, respectively
Ignoring misclassification will almost always lead to biased estimates of the model parameters, and, therefore, possibly leads to wrong scientific conclusions. The presented problem motivates the development of the statistical approach proposed in the next section, addressing misclassification in a multivariate continuous monotone disease process.
The approach considers a time-dependent process which is continuous and monotone non-decreasing. It addresses the measurement errors in the response, and it takes into account several conditional independence assumptions. The following subsections describe the approach.
A multivariate continuous monotone non-decreasing process
Suppose that
Let
In our model we assume that
The response variable
The following assumptions on random effects and residual correlation among teeth were made. Let


where
Assume that for the first time point,

For the next time points,

where
In García-Zattera et al. (2007), it is shown that the association structure on the latent continuous scale is not transferable to the observed binary scale. More specifically, conditional independence on the latent scale does not imply conditional independence on the observed scale (see details in García-Zattera et al., 2007). They illustrated this on data from the same Signal-Tandmobiel® study, and highlighted a possible reason why conditional independence is not invariant to the scale used for the analysis. The model suggested in García-Zattera et al. (2012) was able to analyze the multivariate CE data subject to misclassification, but in order to estimate all model parameters together with the misclassification probabilities conditional independence on the manifest scale was assumed. Here, a different approach is proposed for the same problem, but now the conditional independence assumptions are defined on continuous variables on the latent level, which means weaker independence assumptions. In addition, the assumed measurement model is different involving random effects.
The latent response variables

In the Signal-Tandmobiel® study,
Measurement error is here assumed to occur on the latent continuous variable. We now assume that the latent continuous variable subject to measurement error

Equation (3.6) is the usual expression for defining the classical additive measurement error model (Carroll et al., 2006; Buonaccorsi, 2010), that is,
Additional assumptions are needed to estimate the model parameters. These are similar to those specified in García-Zattera et al. (2012), but now they are specified on the latent scale rather than the manifest scale. For completeness, these identifiability conditions are given in the Appendix. Note that assumptions (A.1)–(A.6) represent natural extensions of the commonly used assumptions for the analysis of univariate and multivariate misclassified binary data (Neuhaus, 1999, 2002; García-Zattera et al., 2012).
The full model is an inhomogeneous MHMM with continuous state-space that comprises Equations (3.3), (3.4), (3.5) and (3.6). Figure 2 displays the probabilistic graphical model showing the dependencies among the variables in the proposed model, with the usual convention of graphical models where square boxes represent observed variables and ovals represent latent variables. The direction of the arrows indicates conditional dependence.
Graphical representation of the proposed model

This section presents the prior distributions, which together with the posterior distribution making use of the conditional independence assumptions (A.1) to (A.6). Markov chain Monte Carlo (MCMC) sampling techniques allow to sample from the posterior distribution of interest (Gilks et al., 1996).
The prior distributions
Some components of the prior are conditionally conjugate distributions. For the coefficients of the covariates in the linear predictor, normal distributions are considered, that is,
For the covariance matrices
In addition, for the regression coefficients in the linear predictor and for the intercept parameters, the Laplace prior (also called Bayesian LASSO prior) defined by Park and Casella (2008) could be used (also see Lesaffre and Lawson, 2012). Note that with the Laplace prior too extreme parameter estimates are penalized.
Note that for all above priors the posterior distributions are obtained easily. Moreover, if initial information is available, informative priors can be elicited. See, for instance, O'Hagan et al. (2006), and the approach proposed by Bedrick et al., 1996) for the misclassification context.
Exploring the posterior distribution
Under the conditional independence assumptions defined in the Appendix, the likelihood function considering the observed and latent variables is given by

The joint posterior distribution of the unobservable latent variables
To estimate the model parameters, MCMC sampling is required. The algorithm has been developed and implemented in the R language (
Doodle BUGS-based graphical representation for the proposed model

A graphical representation of our Bayesian model is presented in Figure 3. This is in fact a direct acyclic graph similar to what is used by, for example, WinBUGS (Lunn et al., 2000), where the nodes are the model variables and the arrows show the dependencies between them.
Validating our proposed model analytically is hard, but also a large-scale simulation study is difficult to realize because of the complexity of the model requiring a large dataset and therefore becomes computationally quite demanding. Instead, we have opted for a compromise and have done a limited simulation experiment based on 100 relatively large datasets. The simulated data approximately mimic the motivating Signal-Tandmobiel® data. In fact, our simulation experiment is similar to what was done in García-Zattera et al. (2012). Since we wish to compare our results to those in García-Zattera et al. (2010, 2012), the same covariates were taken here.
A set of
The selection of the values of the parameters were close to the estimates obtained in the analysis of the Signal-Tandmobiel® data, see Section 6. Linear predictors of Equations (3.1) and (3.2) were computed by using the following regression parameter values:
The true unobserved continuous responses
From the true model, 100 datasets with true responses were simulated. Our simulation strategy generated a classification table:
The following prior distributions have been considered,
Results are summarized in Tables 1, 2 and 3. Table 1 presents the estimated summary measures for the posterior distribution of the regression coefficients associated to the prevalences and incidences for CE in permanent first molars. Table 2 shows the estimated summary measures for the posterior distribution of the covariance matrix
Simulated data: Means, standard deviations (SD), MAE and MSE of the posterior estimates for the regression coefficients associated to the prevalences and incidences for CE in permanent first molars

Simulated data: Means, standard deviations (SD), MAE and MSE of the posterior estimates for the regression coefficients associated to the prevalences and incidences for CE in permanent first molars
The results show that the regression parameters and the covariance matrix associated to the random effects can be estimated with a minimal bias and with a good precision. The signs of the parameters were correctly estimated. Notice that the intercept parameters were estimated with greater error towards the end of the study. We argue that the relative bias of the intercept parameters towards the end of the study is mainly because the classification errors are accumulated from the first periods. Note also that their standard deviations are larger than those for the first periods. Taking the statistical uncertainty into account, the true values are still in the 95% interval.
Besides, the proposed model is able to recognize the existence of misclassification when there are decreasing patterns
For the measurement error parameters, the results are close to the true values. The results show that prior information on the measurement error parameters is not needed to obtain nearly unbiased and precise estimates for the parameters. Thus, the model parameters can be estimated from the data without extra information about the measurement error parameters.
Simulated data: Means, standard deviations (SD), MAE and MSE of the posterior estimates for the covariance matrix

Simulated data: Means, standard deviations (SD), MAE and MSE of the posterior estimates for the dental examiner's measurement error standard deviation

We now apply the proposed approach to the longitudinal evolution of CE in four molars from the Signal-Tandmobiel® dataset. Interest lies in evaluating the impact of oral hygiene and geographical information on the presence of CE taking into account the longitudinal character of the data, possible misclassification and the natural progressive process of the disease. Note that the traditional statistical models dealing with longitudinal binary data can not be used here, since they are unable to deal with all aspects of the data.
The prevalence and incidence of CE on teeth 16 and 26 on the maxilla (upper quadrants), and teeth 36 and 46 on the mandible (lower quadrants) are analysed. Thus, we evaluate
Prior information was not available for the model parameters, therefore vague prior distributions were taken. Specifically, we have taken as prior distributions:
A total of
Table 4 presents the estimated posterior summary measures for the posterior distributions of the regression coefficients associated to the prevalence and incidence for CE in the four permanent first molars.
Estimated posterior means, medians, standard deviations (SD), and
and
centiles, for the regression coefficients associated to the prevalences and incidences for CE in permanent first molars

Estimated posterior means, medians, standard deviations (SD), and
Regarding the prevalence and incidence of CE in permanent molars, the results show the following. For categorical covariates, positive regression coefficients reflect higher probabilities of CE compared to the reference level. We obtained that girls have a higher probability of having CE than boys, that is, the prevalence and incidence of CE is higher in girls than in boys. The reason is that the permanent teeth emerge earlier in girls than in boys, and hence teeth of girls are longer at risk at the same age as those of boys. The prevalence of CE in permanent molars (evidently) increases as children get older. For the incidence of CE, the posterior mean is almost zero, and the
Note that the estimated intercept at the
Number of decreasing patterns

Estimated posterior means, medians, standard deviations (SD), and

Estimated posterior means, medians, standard deviations (SD), and

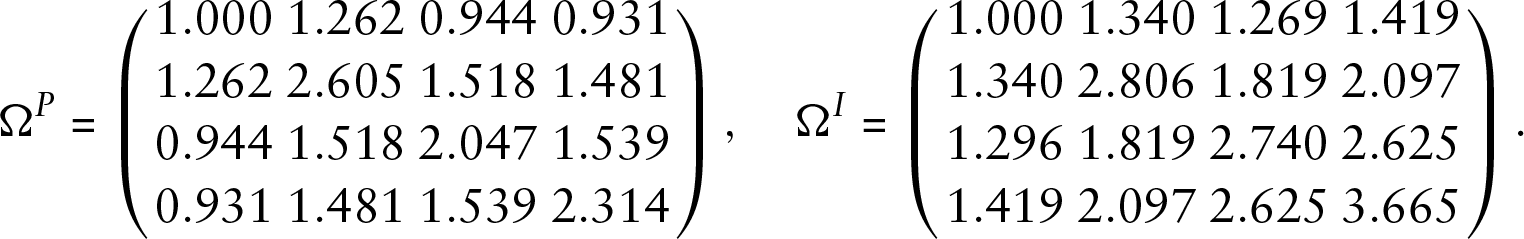
Tables 6 and 7 summarize the estimated statistics for the posterior distributions of the covariance matrix
The estimated posterior distributions for the standard deviation parameters
Estimated posterior medians, and
and
centiles for dental examiner's measurement error standard deviations

The Signal-Tandmobiel® study has been the inspiration to develop many novel statistical approaches. For example, triggered by the misclassifications in the Signal-Tandmobiel® study, Küchenhoff et al. (2006) suggested the SIMEX (SIMulation EXtrapolation) for categorical outcomes. On the other hand, García-Zattera et al. (2007) examined the association structure of CE in the mouth thereby exploring conditional independence in multivariate binary data. García-Zattera et al. (2010) evaluated the performance of binary Markov models in which the response variable is subject to an unconstrained misclassification process, following a monotone or progress behaviour. However, the approach is only applicable to univariate processes, and therefore the analyses were performed for each tooth separately. Later, García-Zattera et al. (2012) proposed an extension of the approach in García-Zattera et al. (2010) to tackle the multivariate case. Specifically, they proposed a multivariate binary inhomogeneous Markov model in which unobserved correlated response variables are subject to an unconstrained misclassification process and have a monotone behaviour. Mutsvari et al. (2013) investigated the hypothesis that CE outcomes recorded at surface level are spatially correlated and that the dental examiners score CE at surface level in a spatial behaviour. They showed a spatial dependency on the examiners’ scoring behaviour and on the prevalence of CE at surface level.
In this article, we revisit the research question addressed in García-Zattera et al. (2012). Based on the observation that conditional independence on the binary scale is a stronger assumption than conditional independence on the latent scale, as shown and illustrated in García-Zattera et al. (2007), we developed a statistical model for the latent continuous outcomes. Because we worked on the latent scale misclassification is thought to be generated via measurement error. Our model could be criticized because both measuring caries as well the distortion process are defined on a latent scale, and therefore not observable. However, the result of both processes is observable. This is a common phenomenon in statistical models. Having said this, one may criticize the current approach for the current data in that we assumed only one type of measurement error. When misclassification is due to extracted teeth due to wrongly assuming a caries process, or when CE is not seen because of perfect filling material, it may be argued that likely a different misclassification process corrupted scores than the one described above. However, at this age there are only very few extracted permanent teeth and the decision to fill a cavity in the past can be also the result of an underlying measurement process combined with a measurement error process. Another critique could be about the choice of the latent distributions. We have chosen normal distributions for the random effects, basically for computational reasons. But, evidently, our approach can easily be adapted to other distributions.
Although our proposed approach has been motivated by and applied to a concrete longitudinal oral health study, it can be useful in other contexts where multivariate responses are subject to measurement errors.
As conclusion we argue that for the first time, CE disease has been modelled by using an inhomogeneous MHMM with continuous state-space. The proposed Bayesian approach fills in a gap on modelling multivariate monotone disease process in the presence of measurement errors by considering the assumptions that the true process is continuous, the multivariate response variables are correlated and subject to a measurement error process having monotone behaviour. Conditional independence assumptions have been relaxed by defining them on the continuous variables on a latent level. The model allows to consider that different examiners have been involved in the scoring, and external information is not needed about the measurement error model parameters. The modelling proposed in this approach matches the right experimental design of ST study.
Footnotes
Supplementary materials
Supplementary materials for this article, for properties about conditional independence, identifiability of the parameters, and a sensitivity analysis, are available from
Acknowledgements
The Signal-Tandmobiel® study comprises the following partners: D. Declerck (Dental School, Katholieke Universiteit Leuven), L. Martens (Dental School, University of Ghent), J. Vanobbergen (Dental School, University of Ghent), P. Bottenberg (Dental School, University of Brussels), E. Lesaffre (L-BioStat, Katholieke Universiteit Leuven), and K. Hoppenbrouwers (Youth Health Department, Katholieke Universiteit Leuven, and Flemish Association for Youth Health Care). We thank Dr. María José García-Zattera and Dr. Alejandro Jara from the Department of Statistics, Pontificia Universidad Católica de Chile (Santiago de Chile, Chile), for their critical remarks and interesting discussions on an earlier version of the article. We also thank Dr. María José García-Zattera for handing over the dataset upon which she performed her analysis.
Declaration of conflicting interests
The authors declared no potential conflicts of interest with respect to the research, authorship and/or publication of this article.
Funding
This work was supported by Ministerio de Economía, Industria y Competitividad}, Spain (Project MTM2014-56949-C3-3-R and MTM2017-86875-C3-2-R); Junta de Extremadura, Spain (Project IB16054 and GRU18108); and European Union (European Regional Development Funds). Lizbeth Naranjo has also been partially supported by Sociedad Matemática Mexicana, Fundación Sofía Kovalévskaia, and UNAM-DGAPA-PAPIIT (Project IN118720), Mexico.