



Abstract
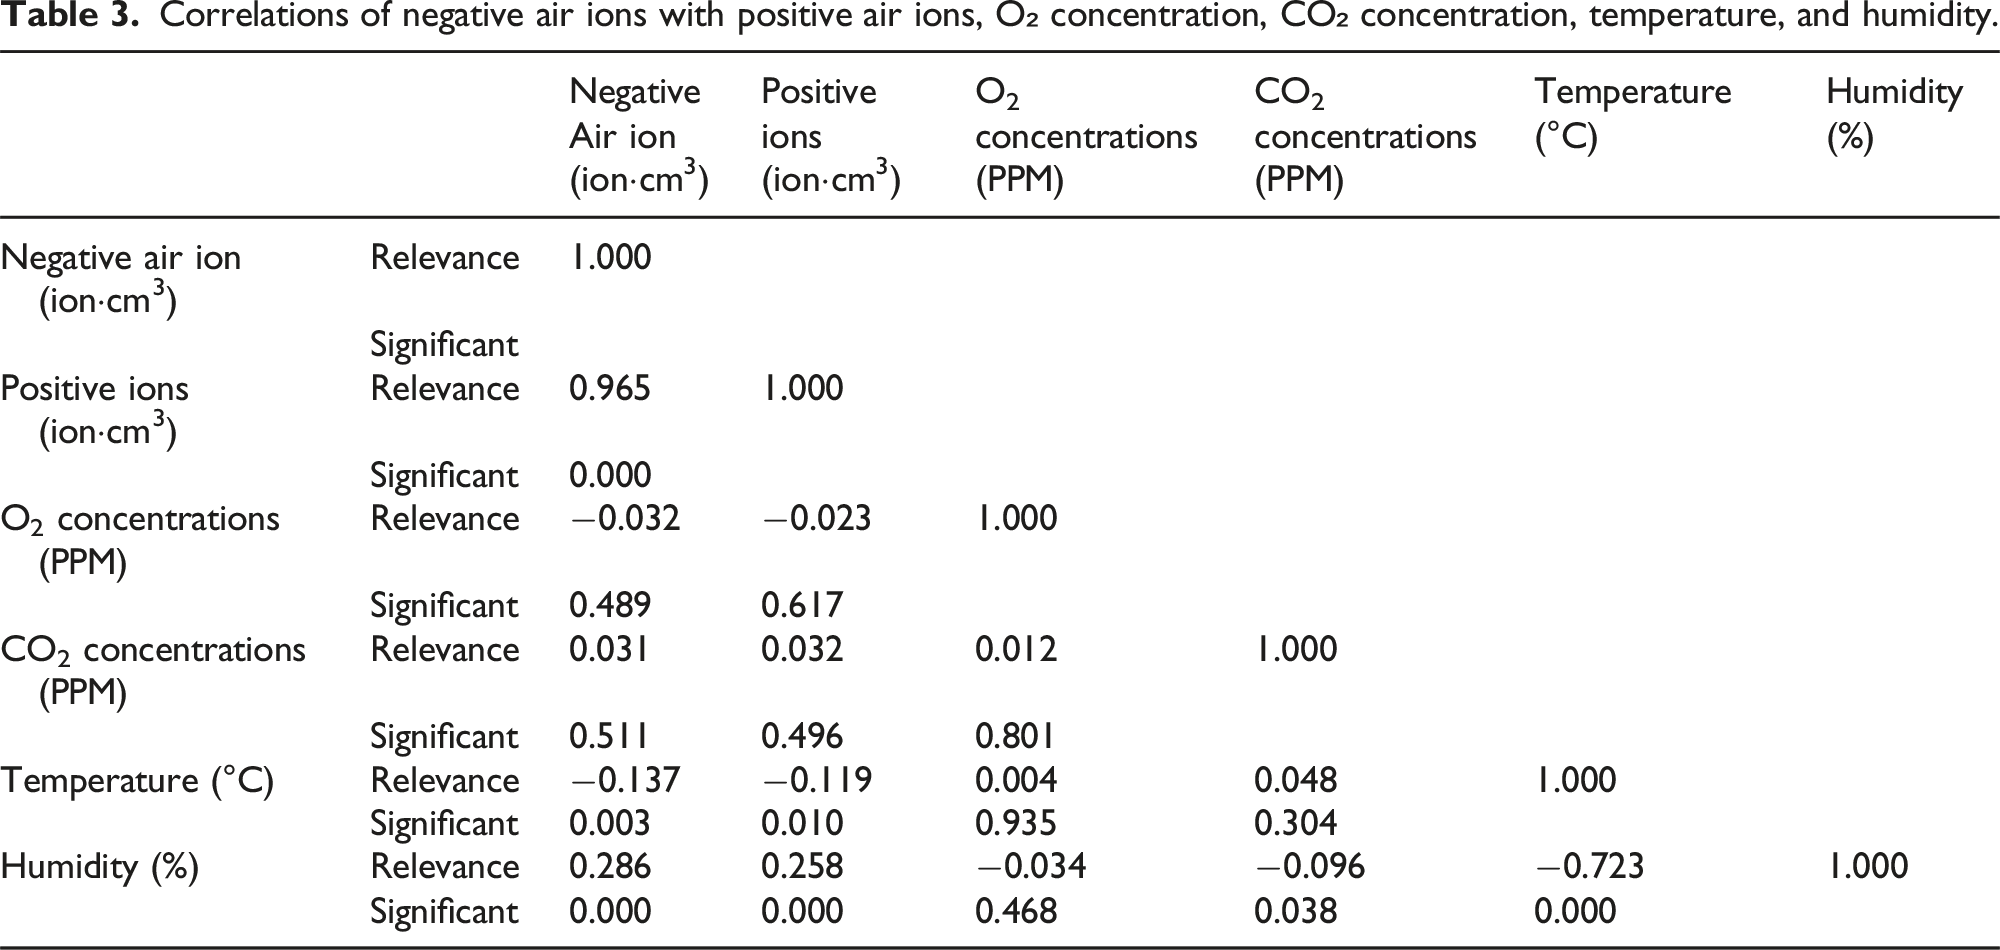
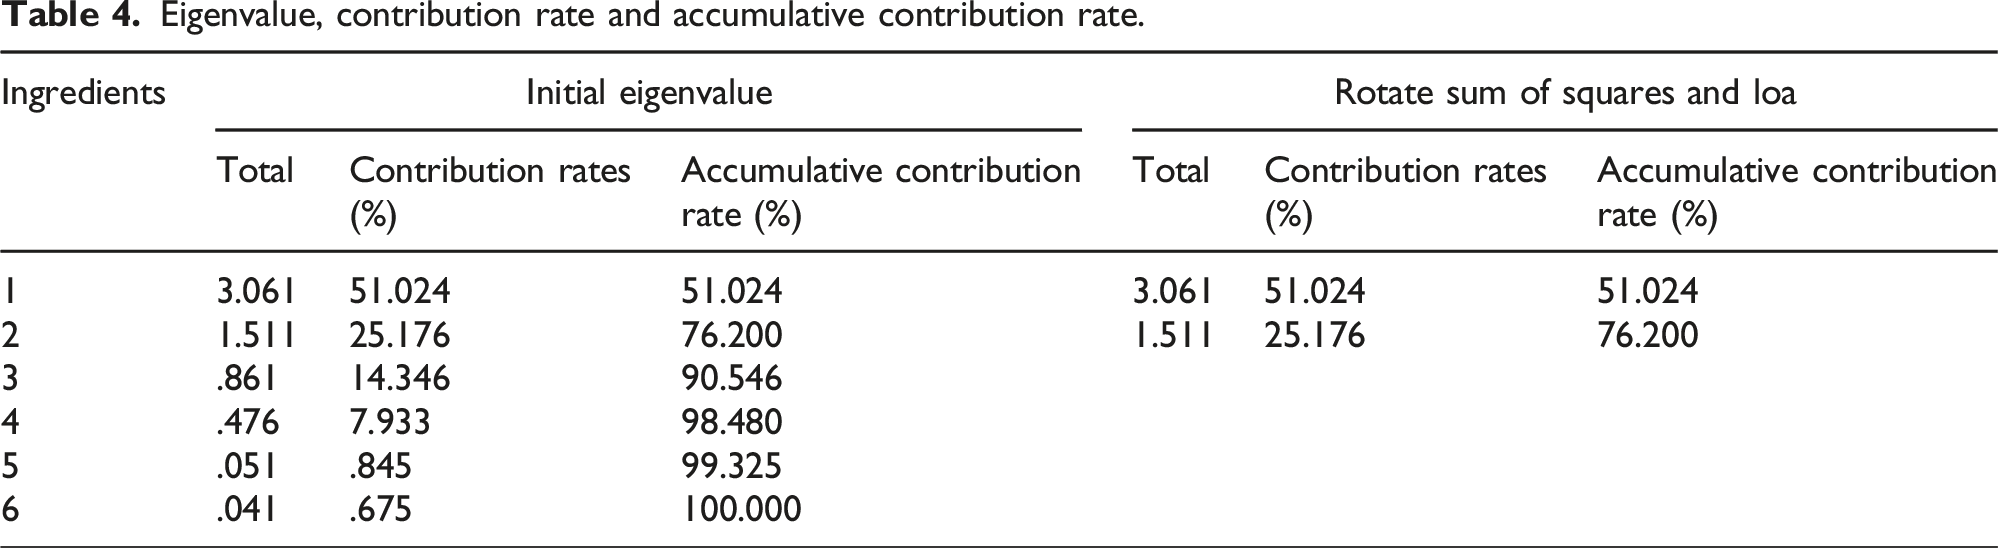
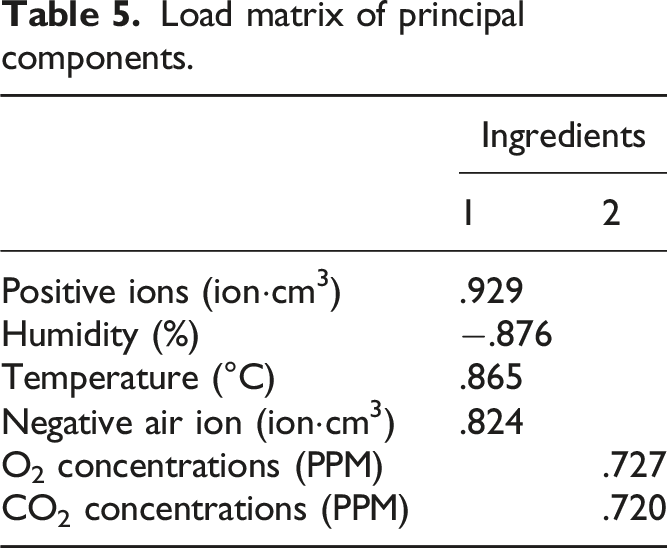
Taking Nyingchi City as an example, this study explored the distribution of negative air ions (NAIs) in urban green spaces of plateau. Six representative areas of different types of urban green spaces in the main urban area of Nyingchi City were selected for NAIs observation and measurement. The results demonstrated that the NAI concentration in summer was significantly higher than the other three seasons in the study area. The NAI concentration in Fujian Park was significantly higher than the other observation sites, in the order of Fujian Park > the green space of Guangfu Avenue > Wetland Park of Happiness Community > the ecological scenic area of Biri Holy Mountain > Gala Peach Blossom Village > the scenic area of Cypress King’s Garden. Pearson’s correlation analysis showed that the NAI concentration was positively correlated with positive air ions and humidity, while humidity was positively correlated with NAIs and positive air ions, but negatively correlated with temperature and CO2 concentration (p < 0.05). The correlations between the other variables all have p > 0.05, indicating no statistically significant correlations among them. PCA analysis showed that the highest loading was positive ions with a value of 0.929, and the loading of humidity was −0.876, positively and negatively correlated, respectively.
Keywords
Introduction
Negative air ions (NAIs) are called “negative oxygen ions” because oxygen molecules capture the free electrons from the ionized air molecules which quickly combine with neutral atoms in the air under the action of high pressure or high-intensity radiations. 1 These ions could speed up metabolism, 2 boost immune system, and relieve fatigue. 3 In addition, they can also suppress the growth of viruses and bacteria, remove dust and smoke in the air, purifying the air, and improving physical function. 4 Because of their various abilities and effects, 5 it is called “lifespan elongation elements,” 6 and “Vitamins of the Air.” The concentration of NAIs directly affects the comfort and health of people’s lives and is related to the quality of local air. 7
The earliest record of people’s formal research on NAIs is their discovery by German scientists Elster and Gertel in 1889. 8 Later, Asamas et al. analyzed and confirmed the biological significance of the presence of NAIs in 1902, 9 for the first time Russian scientist A. B. C. Okosob published a journal article of using NAIs to treat diseases. In 1932, Hamson from the United States invented the world’s first medical NAI generator. Since then, many countries have been conducting numerous studies on NAIs.10,11 The research fields mainly included the ambient air ion concentration measurement, the biological effects of air ions on biological organisms and their stress responses. 12
Studies have shown that by the production methods, there are three main types of NAIs: Natural NAIs, Corona NAIs, and Lenard NAIs. Since the evolution of NAIs is related to the surrounding air composition, 13 the collisions between molecules in the air are constantly changing, and NAIs such as CO3−, HCO3−, O3−, NO3−, and CO4− are formed during this dynamic evolution process.14,15 Some studies have also found that NAIs exhibited clear daily, monthly, and annual changes, 16 and they were also related to factors such as temperature, humidity, precipitation, 17 PM2.5, PM10, 18 and particulate matter.19,20 However, since NAIs are greatly affected by the surrounding environment, there are large differences in the observation results under different conditions.
In recent years, as the continuous attention to the ecological environment in society, the study on NAIs has shifted from basic theoretical research to applied research. For instance, it is widely involved in the areas of forests, 21 health resorts, 22 rural areas, and cities. 23 It also shifted from the field of biology to the field of landscape ecology. Scholars explored the relationship and distribution of influencing factors and NAIs by studying the vegetation characteristics, 24 climatic factors, and local morphological characteristics of research sites. 25 Some scholars also adopted the time series model (AutoRegressive Integrated Moving Average ARIMA) to predict the concentration of NAIs. 14 In summary, the research methods on NAIs are diverse and involved a wide range of fields. 26 However, there has been little research on NAIs in plateau cities and cold temperate climate zone. The Qinghai-Tibet Plateau is an important ecological security barrier and the “world’s water tower.” It has rich biological resources and ecosystem service value. Therefore, this study explored the dynamic changes of NAI concentration in each season and its correlation with environmental factors. 27 With the development of cities, some scholars have begun to pay attention to the relationship between NAI and urban environment, and the study of human settlements has a great significance. In summary, there are various research methods and extensive research content on NAI, providing guidance value for this study.
Nyingchi City is an important node city in the Yarlung Zangbo River Basin, the current ecological environment is good, and urban greening, forest protection is inseparable, it is not clear, the plateau city NAI in the natural, artificial and semi-natural ecosystem network green space differences, and the correlation with environmental phenological factors, the primary purpose of urban planning is to provide local residents with a good living environment, reasonable spatial layout, plant configuration, is the key to urban green space planning. Therefore, this study explores the distribution of air anion concentration, the dynamic change of NAIs concentration in various seasons and the correlation between this study and environmental factors, which is of great practical significance for the protection and utilization of the ecological environment in plateau cities, regional economic development, plateau forest ecotourism, and the air quality of human settlements. At the same time, the conclusions of this study can provide a theoretical basis for quantifying and evaluating the microclimate and environmental effects of plateau urban green space and provide relevant theoretical support for the research on urban planning and landscape architecture.
Materials and methods
Nyingchi City is located in the southeast of the Tibet Autonomous Region, the middle and lower reaches of the Yarlung Zangbo River, with a geographical location of 26°52′30°40′N, 92°09′-98°47′E, and a forest coverage of 46.09%. It is the third largest forest area in China. It has an altitude of approximately 3100 m, an annual rainfall of about 650 mm, an annual average temperature of 8.7°C, an average annual sunshine of 2022.2 h, and a frost-free period of 180 d. 28 Nyingchi City has rich landscape plant resources and above 35% urban green area.
Selection of observation sites
Based on the theme of this study, combined with the environmental characteristics of the surrounding area of Nyingchi City, explore different forms of green space as research areas, and ultimately determine Fujian Park (artificial + in a confined space), Happy community Wetland Park (artificial + in a confined space), Affiliated green space of Guangfu Avenue (artificial + wide-open space), Biri divine mountain ecological scenic area (natural + wide-open space) Cypress King Garden Scenic Spot (natural + semi-confined space) and Peach Blossom Village Gala (semi natural + semi-confined space) serve as observation points (as shown in Figure 1). Distribution of observed sample plots (the map image is from Planning Cloud).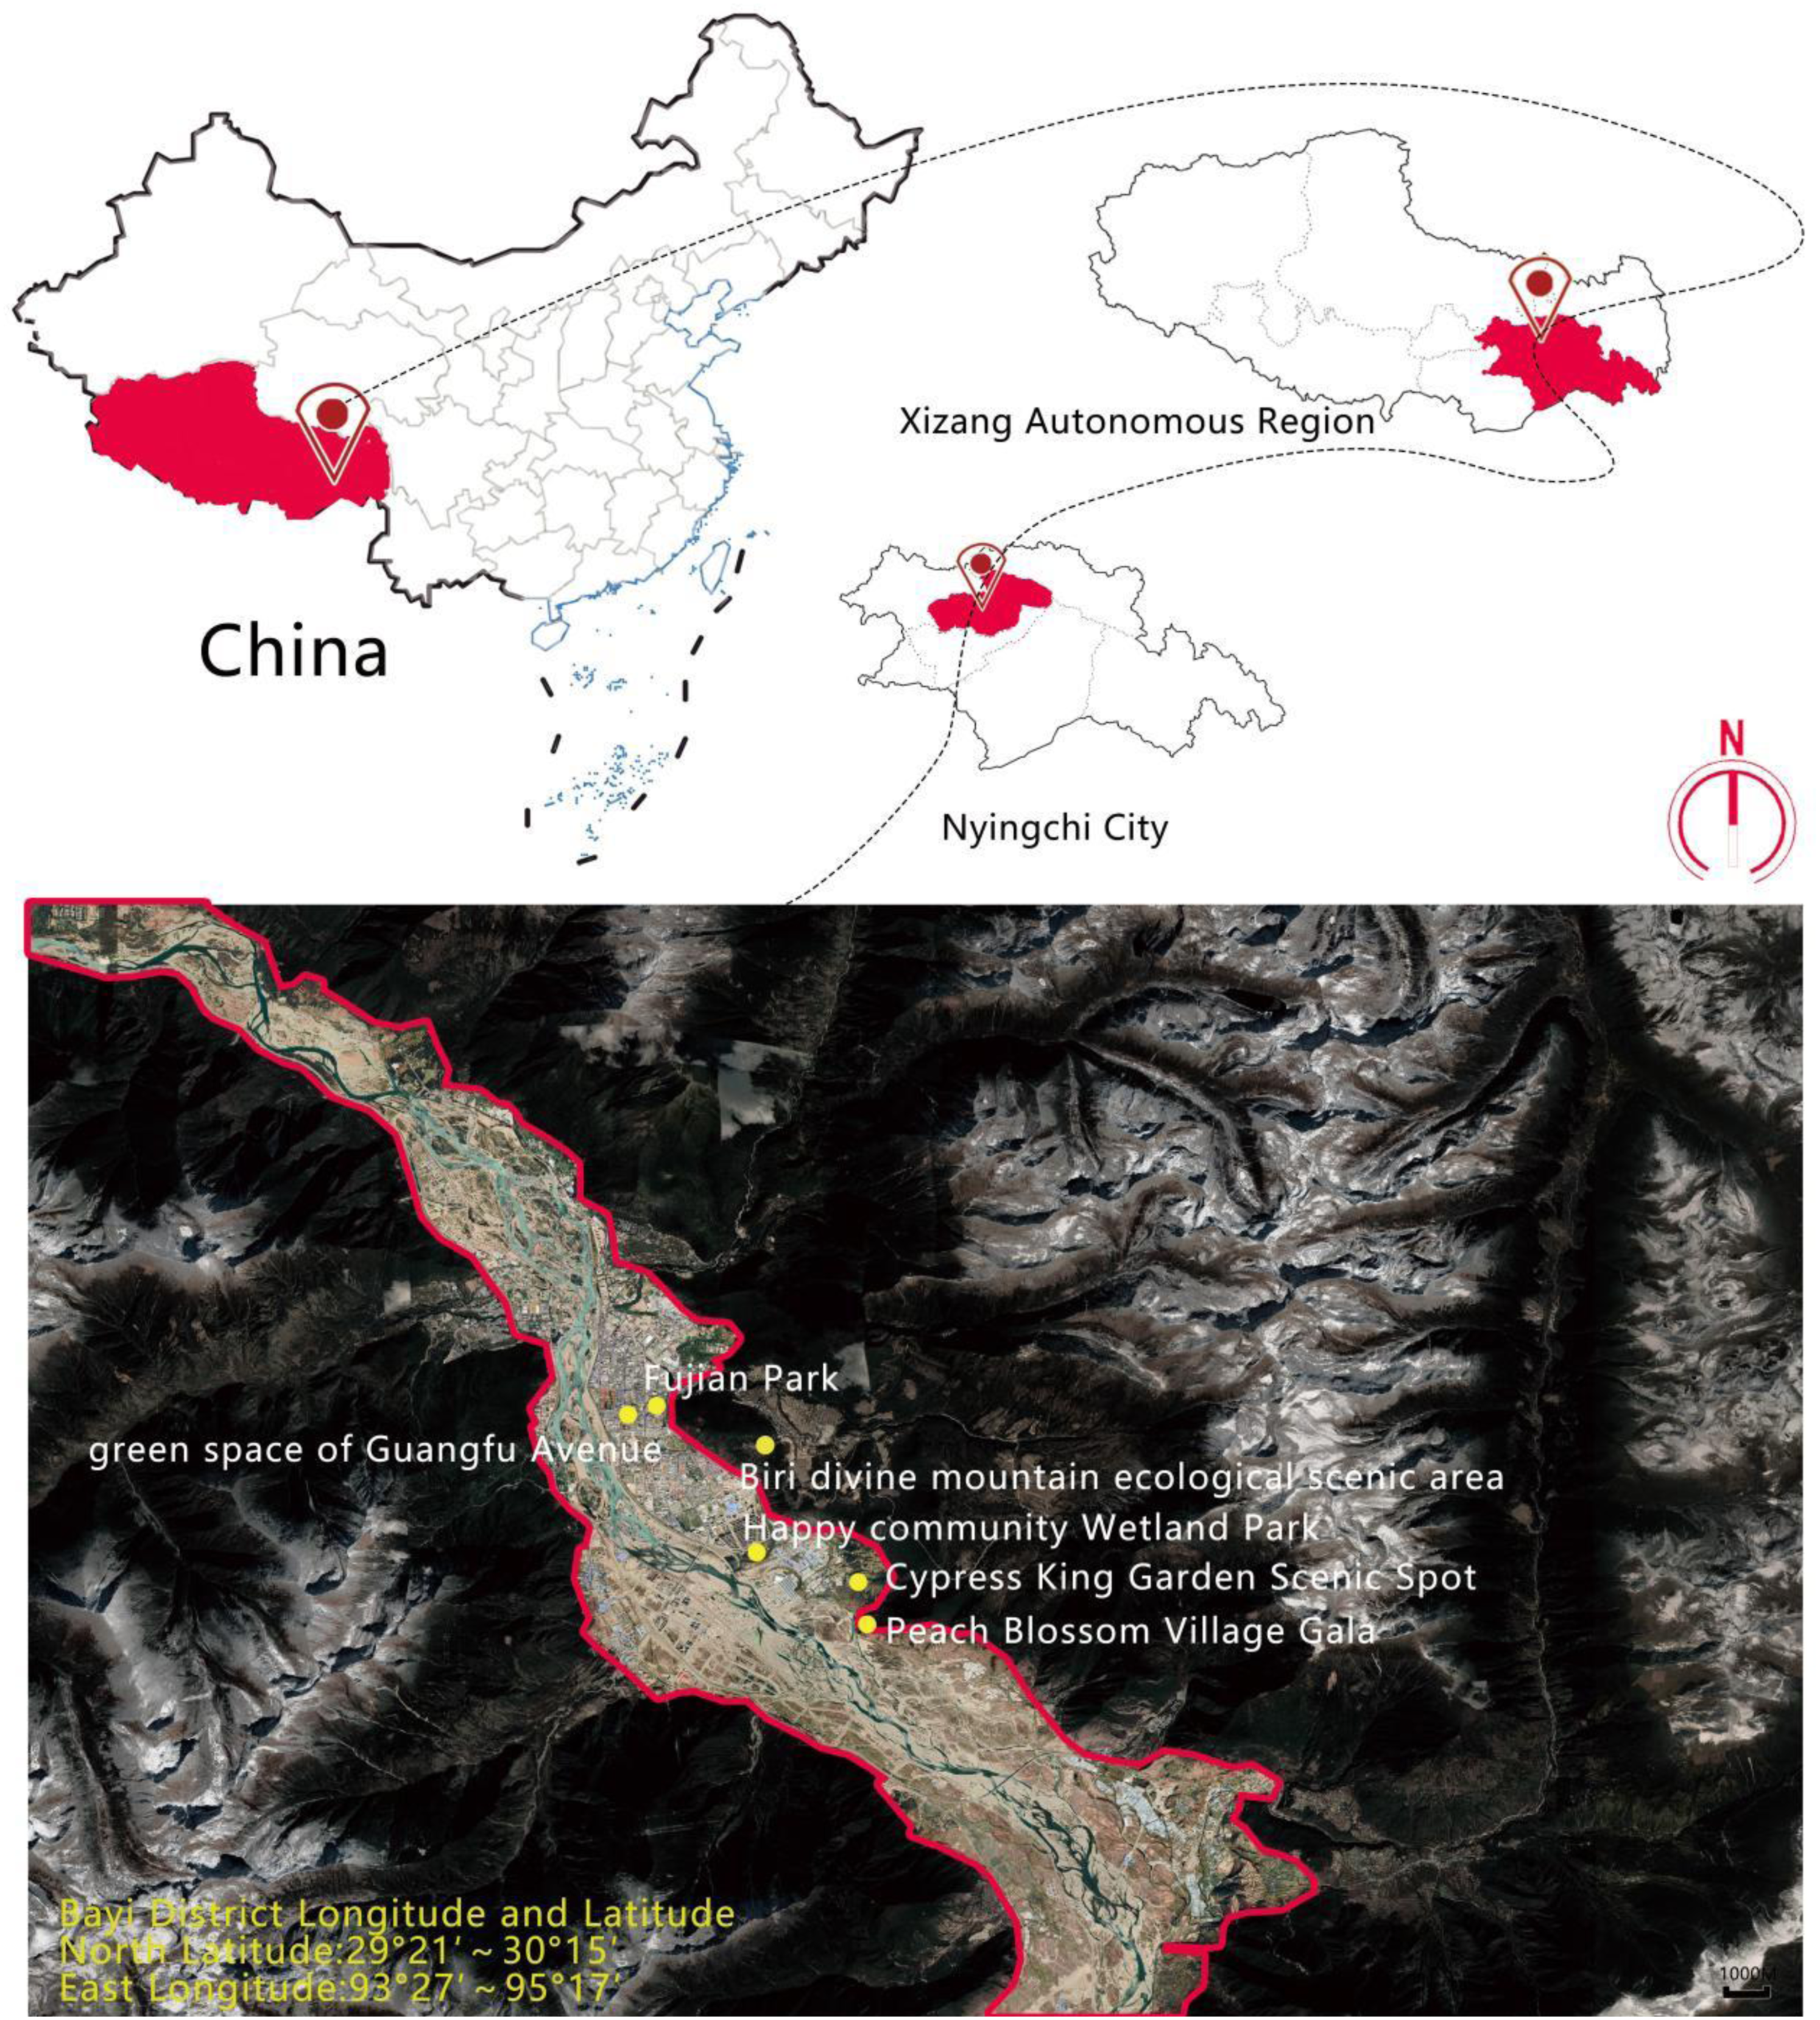
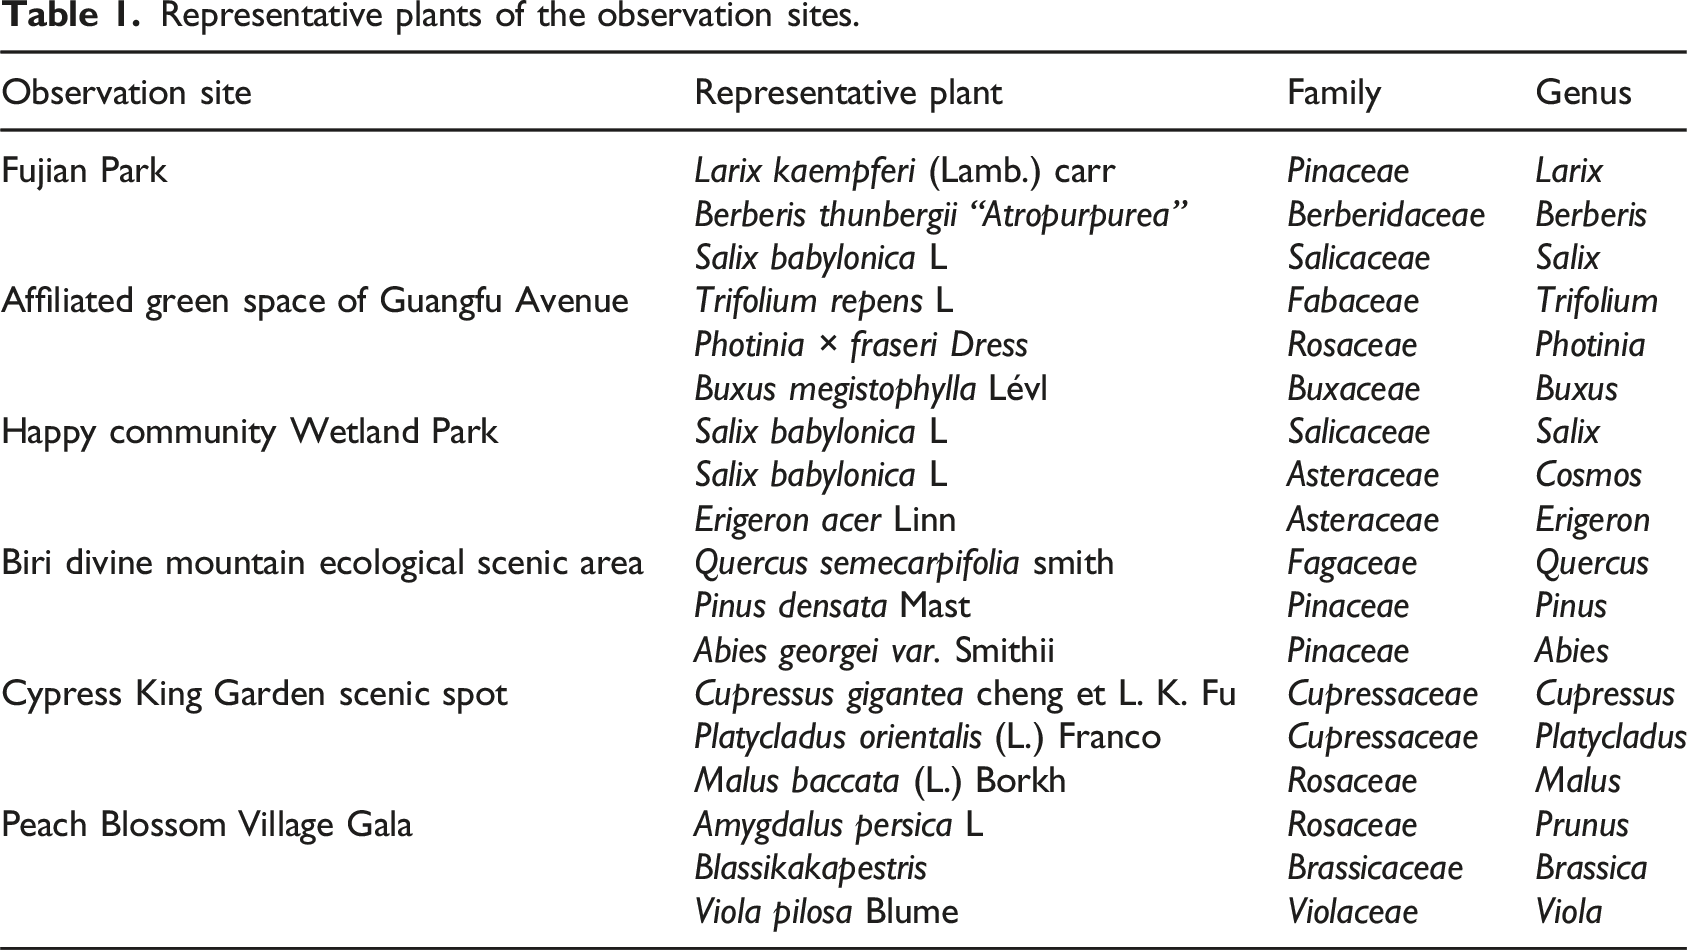
Representative plants of the observation sites.
Observation indicators and methods
Observation equipment
The air negative oxygen ion detector is KEC-990M (Japan), with a range of 10–1999×105 (ion·cm3), accuracy ±20%, O2 concentration detector is AR8100 type (Sigma, China), range: 0%–25%, resolution 0.1%, CO2 concentration detector is AR8200 type (Sigma, China), range: 350ppm–9999ppm, temperature and humidity detector is AS847 type (Sigma, China), temperature measurement range: 10°C–50°C, humidity range: 10%–99% RH, and accuracy<±2%.
Observation methods
The measurements were conducted at fixed sites from 8 a.m. to 8 p.m. every day from October 2021 to October 2022. A relatively flat place in each of the observation area was selected, and then a tripod was set up and the height was adjusted to approximately 1.5 m from the ground. Taking 5 min as an observation unit, and the concentration was set in the range of 100–1999,000 ion·cm3. The initial reading was adjusted to zero using the zero-adjustment knob. After 0.00 appeared on the screen, the air intake switch was turned on and the 5-min reading was conducted. The NAI concentration was recorded when the reading was stable. The measurement was repeated at an interval of 1 hour. The average value of each observation unit was calculated. At the same time and the same site, a negative oxygen ion tester was used to measure the positive oxygen ion concentration, a thermo hygrometer was used to measure the real-time temperature and humidity, 23 and the oxygen and carbon dioxide meters were used to determine the real-time concentrations of O2 and CO2. 6
Data processing
The data was tested for normality. 29 Normally distributed measurement data was represented by (±s), and the analysis of variance was used for between-groups comparison, followed by LSD-t test for comparison between two groups. While M was used to represent the non-normal measurement data, and the independent sample Kruskal-Wallis test was performed for between-groups comparison, and the Bonferroni method was used to adjust the p value for pairwise comparison. The correlation between two variables was analyzed by Pearson’s and PCA correlation.30–33 The software SPSS25.0 and Graph Pad Prism 8.2.0 were used for data processing and analysis. A significance level of α = 0.05 was chosen.
Results and analysis
Daily variation of NAI concentration
Daily changes of NAIs in various areas were different (as shown in Figure 2). Basically, an upward trend was displayed in the morning with a peak/peaks, and fluctuation was shown over the afternoon. The NAI concentration in Fujian Park was the highest, presenting a three-peak pattern. The peaks appeared at 12 a.m–1 p.m., at 4 p.m., and at 6 p.m., and the valleys were shown at 9–10 a.m., at 2 p.m., and at 5 p.m. The NAIs in the green space of Guangfu Avenue varied in an irregular way. The peaks appeared at 2 p.m. and at 5 p.m., and the valley was shown at 4 p.m. The Wetland Park of Happiness Community had three peaks, shown at respective 11 a.m., 2 p.m., and 5 p.m., while the valleys were at 12 p.m. and 3 p.m. Similarly, the ecological scenic area of Biri Holy Mountain had three peaks for NAIs too, respectively, 10 a.m., 2 p.m., and 7 p.m., while the valleys were shown at 11 a.m. and 6 p.m. The scenic area of Cypress King’s Garden was quite different from the other areas that it had two peaks, at 11 a.m. and at 3 p.m., and only one valley at 12 p.m. The Gala Peach Blossom Village had a single peak at 2 p.m., and no valley at all. Daily changes of NAI concentrations in various green spaces.
Differences in NAI concentration
Differences in NAI concentration between different areas
The differences in NAI concentration in the observation sites in different green spaces were investigated based on the measured data (Figure 3 and Table 2). It can be seen that the NAI concentration of Fujian Park was the highest, and that of the scenic area of Cypress King’s Garden was the lowest. The NAI concentrations in the observation sites were ordered as follows: Fujian Park (32,570 ion·cm3) > the green space of Guangfu Avenue (15,981 ion·cm3) > Wetland Park of Happiness Community (15,025 ion·cm3) > the ecological scenic area of Biri Holy Mountain (14,987 ion·cm3) > Gala Peach Blossom Village (14,692 ion·cm3) > the scenic area of Cypress King’s Garden (14,603 ion·cm3). From the observation data, there is a significant difference in the negative oxygen ion concentration of Fujian Park compared to the green land of Guangfu Avenue, the Wetland Park of Happiness Community, the ecological scenic area of Biri Holy Mountain, the scenic area of Cypress King’s Garden, and the Gala Peach Blossom Village (p<0.05). There was no significant difference in the concentration of negative oxygen ions in the green land of Guangfu Avenue, the wetland park of Xingfu Community, the ecological scenic area of Biri Holy Mountain, the scenic area of Cypress King’s Garden, and the Gala Peach Blossom Village (p>0.05). We think that Fujian Park has a bigger water area than other places, with a total of 15,960m2. The space is enclosed, which affects how negative ions gather. Differences in NAI concentration between various green spaces in Nyingchi City. Note: different letters indicate the significant difference (p<0.05). Correlation between indicators regarding different areas. aMeans that compared with Fujian Park, adjusted p < 0.05. bMeans that compared with the green space of Guangfu Avenue, adjusted p < 0.05. cMeans that compared with Wetland Park of Happiness Community, adjusted p < 0.05. dMeans that compared with Biri Holy Mountain, adjusted p < 0.05. eMeans compared with the Cypress King’s Garden, adjusted p < 0.05. fMeans that compared with Gala Peach Blossom Village, adjusted p < 0.05.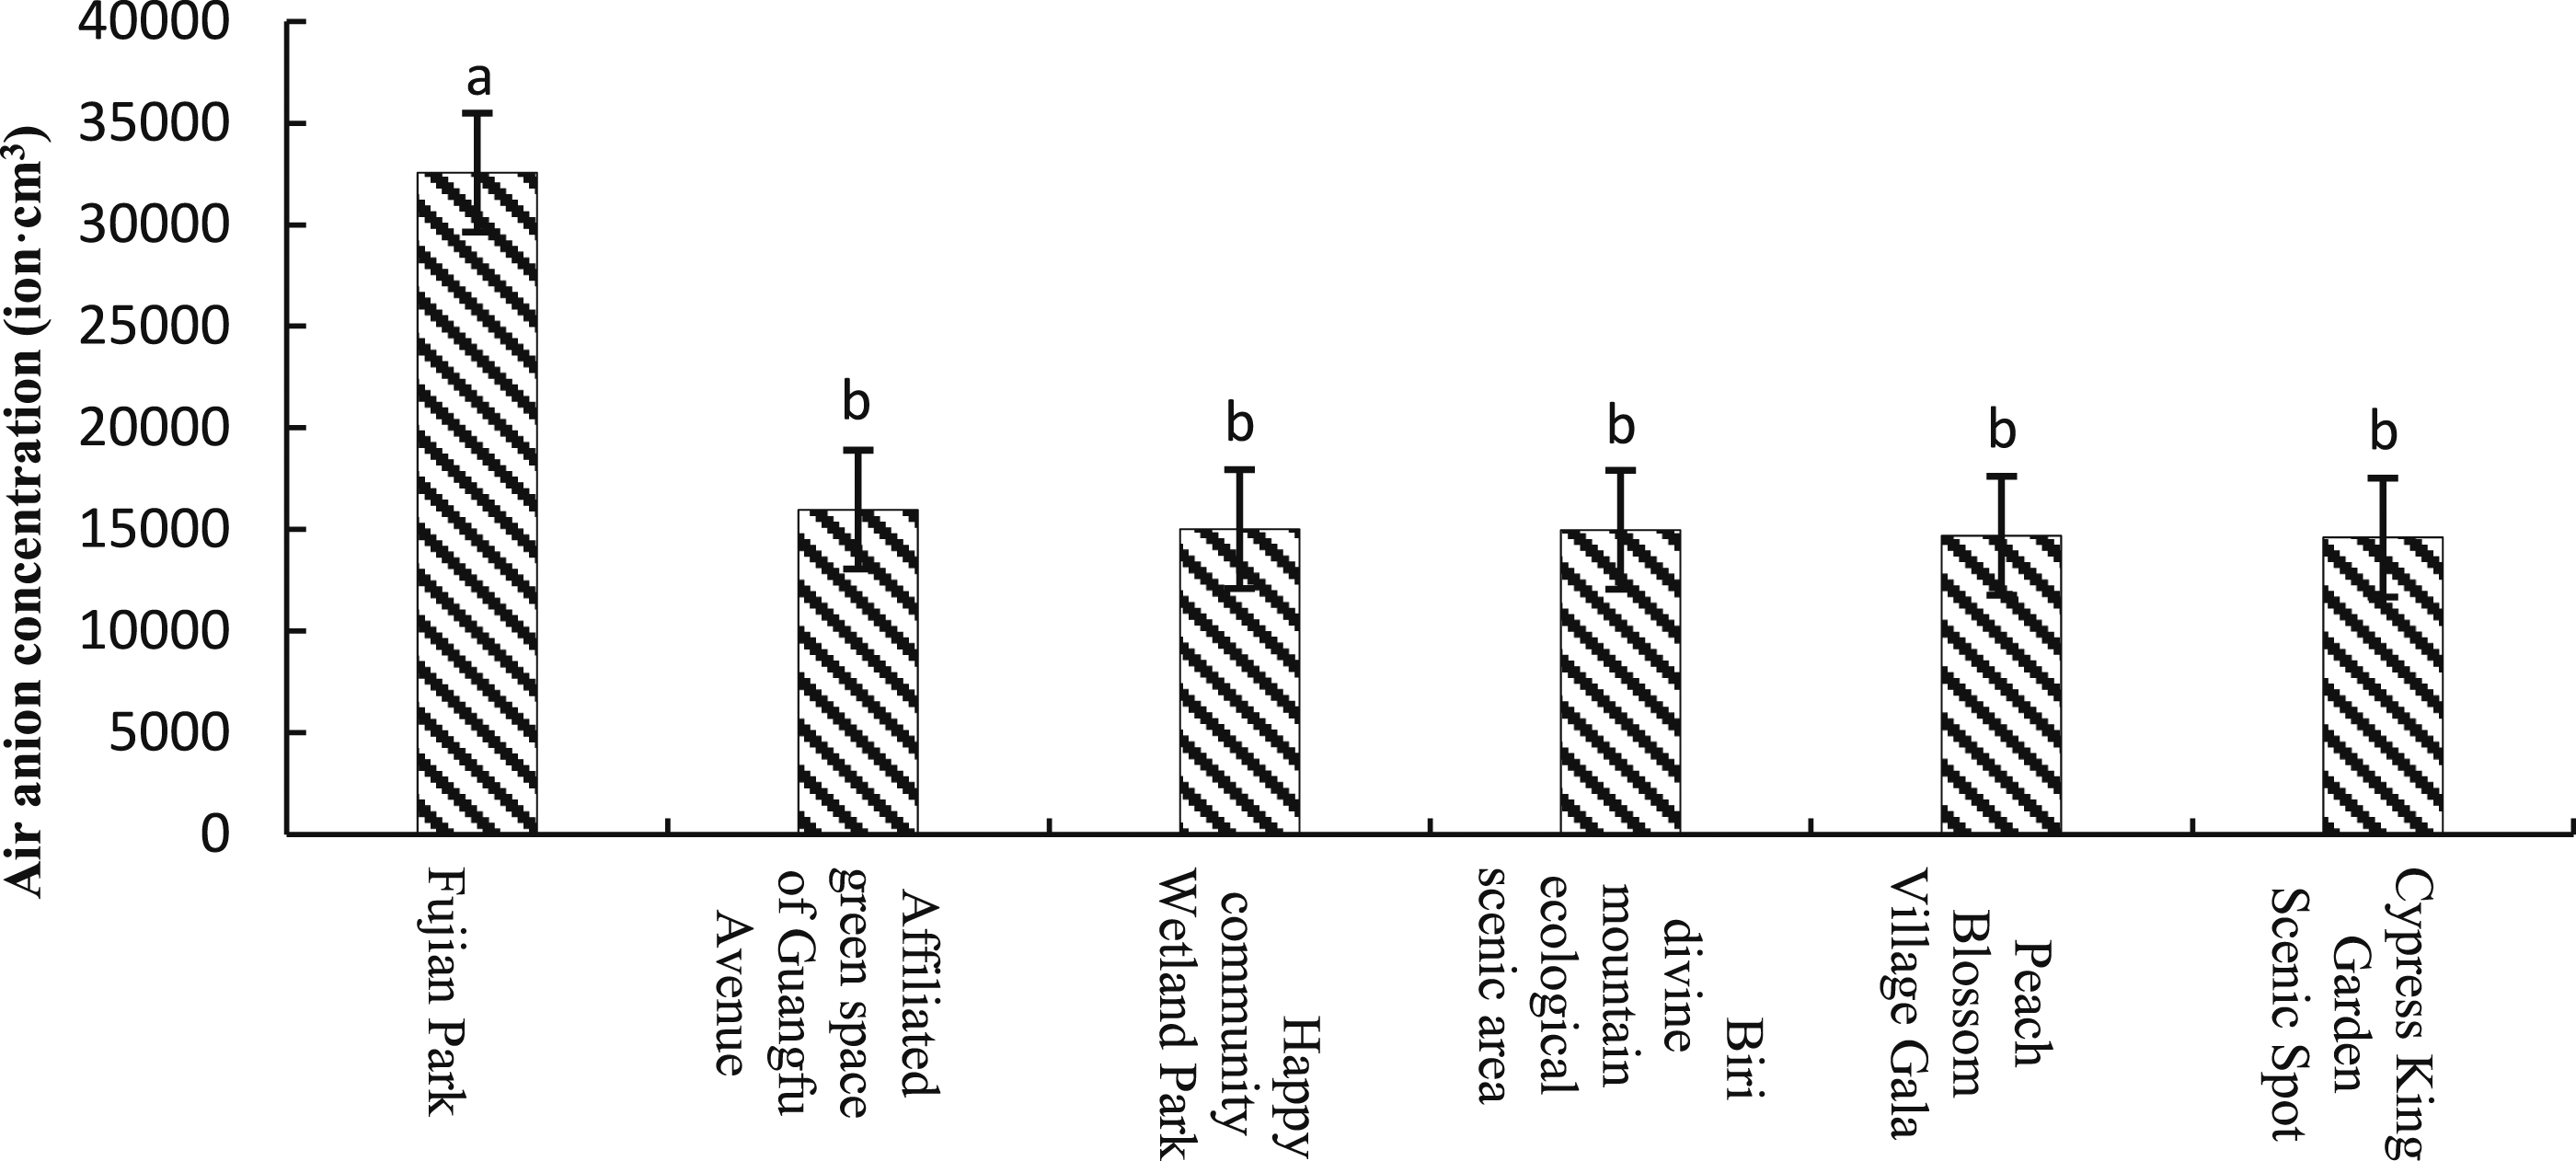

Correlation of indicators between different areas
According to the indicators of the observation sites in the six green spaces, the correlations between the indicators regarding different areas was investigated. It can be seen from Table 2 that statistically significant differences were shown in the negative ions, positive ions, O2 concentration, CO2 concentration, temperature, and humidity among the six green spaces. Regarding to the NAIs, Fujian Park was higher than the green space of Guangfu Avenue, Wetland Park of Happiness Community, Biri Holy Mountain, Cypress King’s Garden, and Gala Peach Blossom Village.
Pearson’s correlation analysis
Correlations of negative air ions with positive air ions, O₂ concentration, CO₂ concentration, temperature, and humidity.
PCA (Principal component analysis)
Eigenvalue, contribution rate and accumulative contribution rate.
Load matrix of principal components.
Seasonal changes in NAI concentration
Comparison of NAI concentrations in Fujian Park between four seasons
The NAI concentrations in four seasons, spring, summer, autumn, and winter in Fujian Park were compared, as the NAI concentration in summer (34,872 ion·cm3) > in autumn (33,795 ion·cm3) > in spring (32,103 ion·cm3) > in winter (29,513 ion·cm3) (as shown in Figure 4). Nevertheless, similar daily patterns were shown in all the four seasons, with a rising from morning to noon and fluctuations from noon to afternoon. Three peaks were shown in summer, autumn, and winter, only that the peak and valley time points were different. Two peaks were shown in spring. Comparison of NAI concentrations in Fujian Park between four seasons.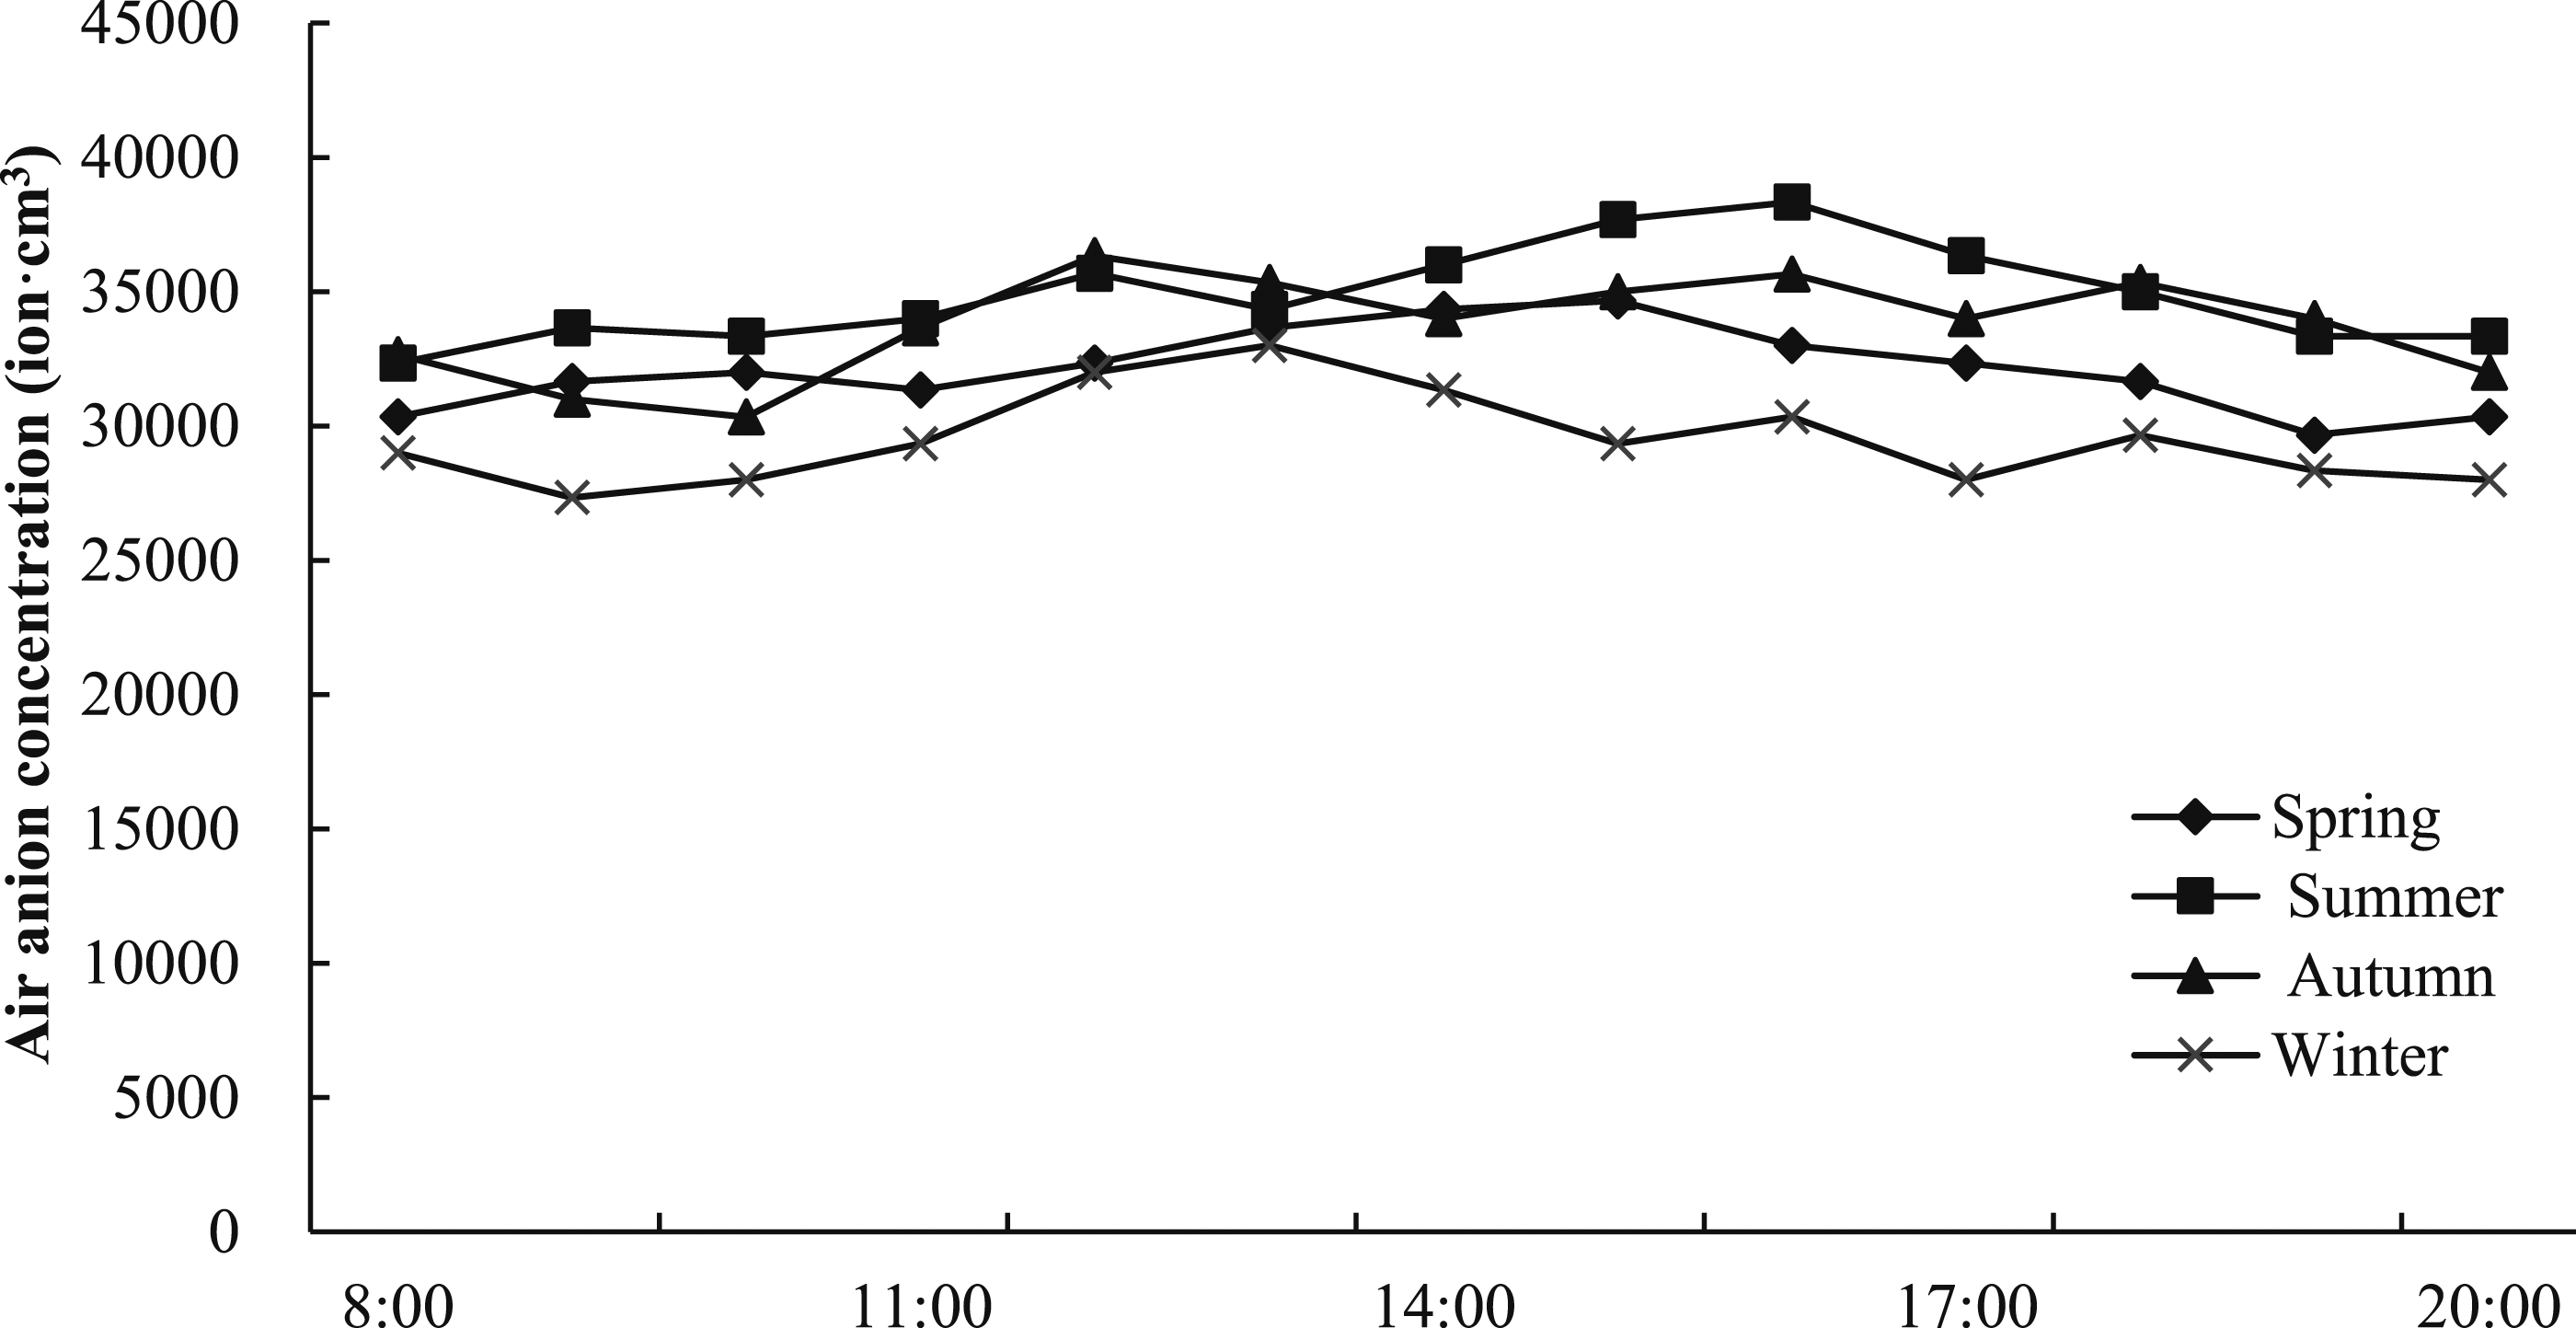
Comparison of NAI concentrations in the green space of Guangfu Avenue between four seasons
The NAI concentrations in the green space of Guangfu Avenue between four seasons were compared, details as follows: the NAI concentration in summer (17,590 ion·cm3) > in autumn (16,462 ion·cm3) > in spring (15,692 ion·cm3) > in winter (14,179 ion·cm3) (as shown in Figure 5). It can be seen that in this area there were three peaks in spring and winter, two peaks in summer, and the most peaks of four in autumn. Comparison of NAI concentrations in the green space of Guangfu Avenue between four seasons.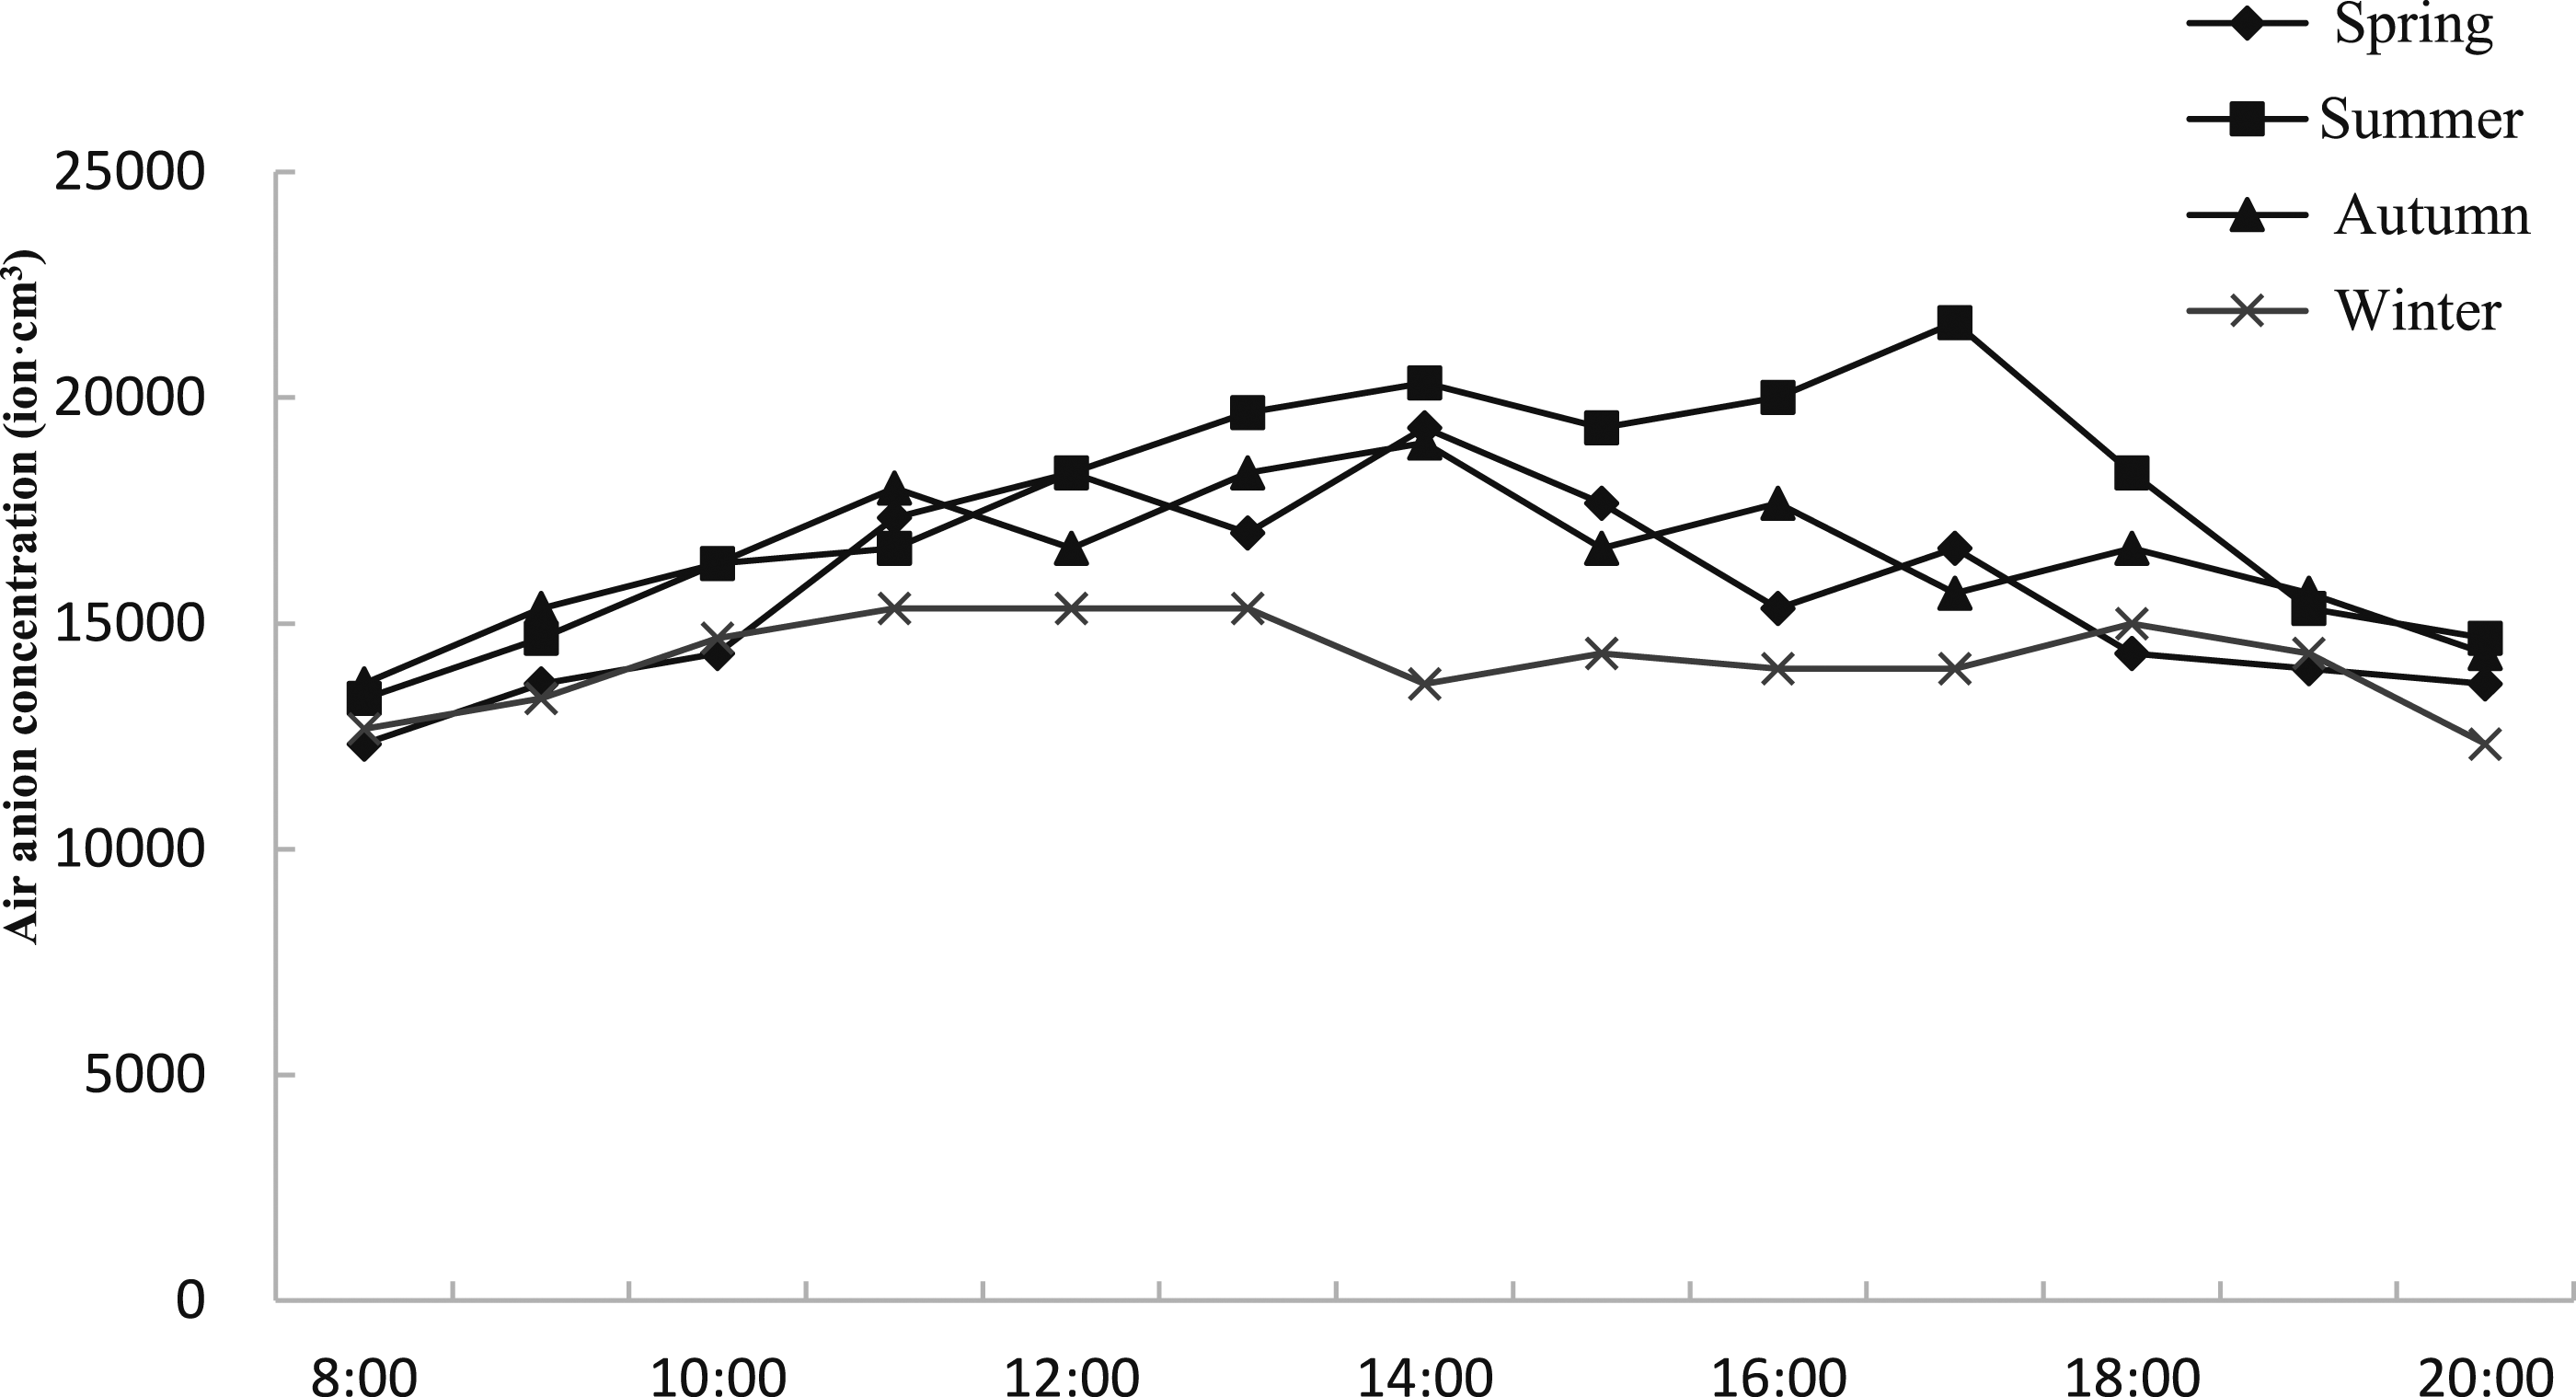
Comparison of NAI concentrations in Wetland Park of Happiness Community between four seasons
The comparison of NAI concentrations in Wetland Park of Happiness Community between four seasons was as follows: in summer (16,846 ion·cm3) > in spring (14,875 ion·cm3) > in autumn (14,308 ion·cm3) > in winter (14,051 ion·cm3) (as shown in Figure 6). There were three peaks in spring and summer, and four peaks in autumn and winter, and the peak values were very different. Comparison of NAI concentration in Wetland Park of Happiness Community between four seasons.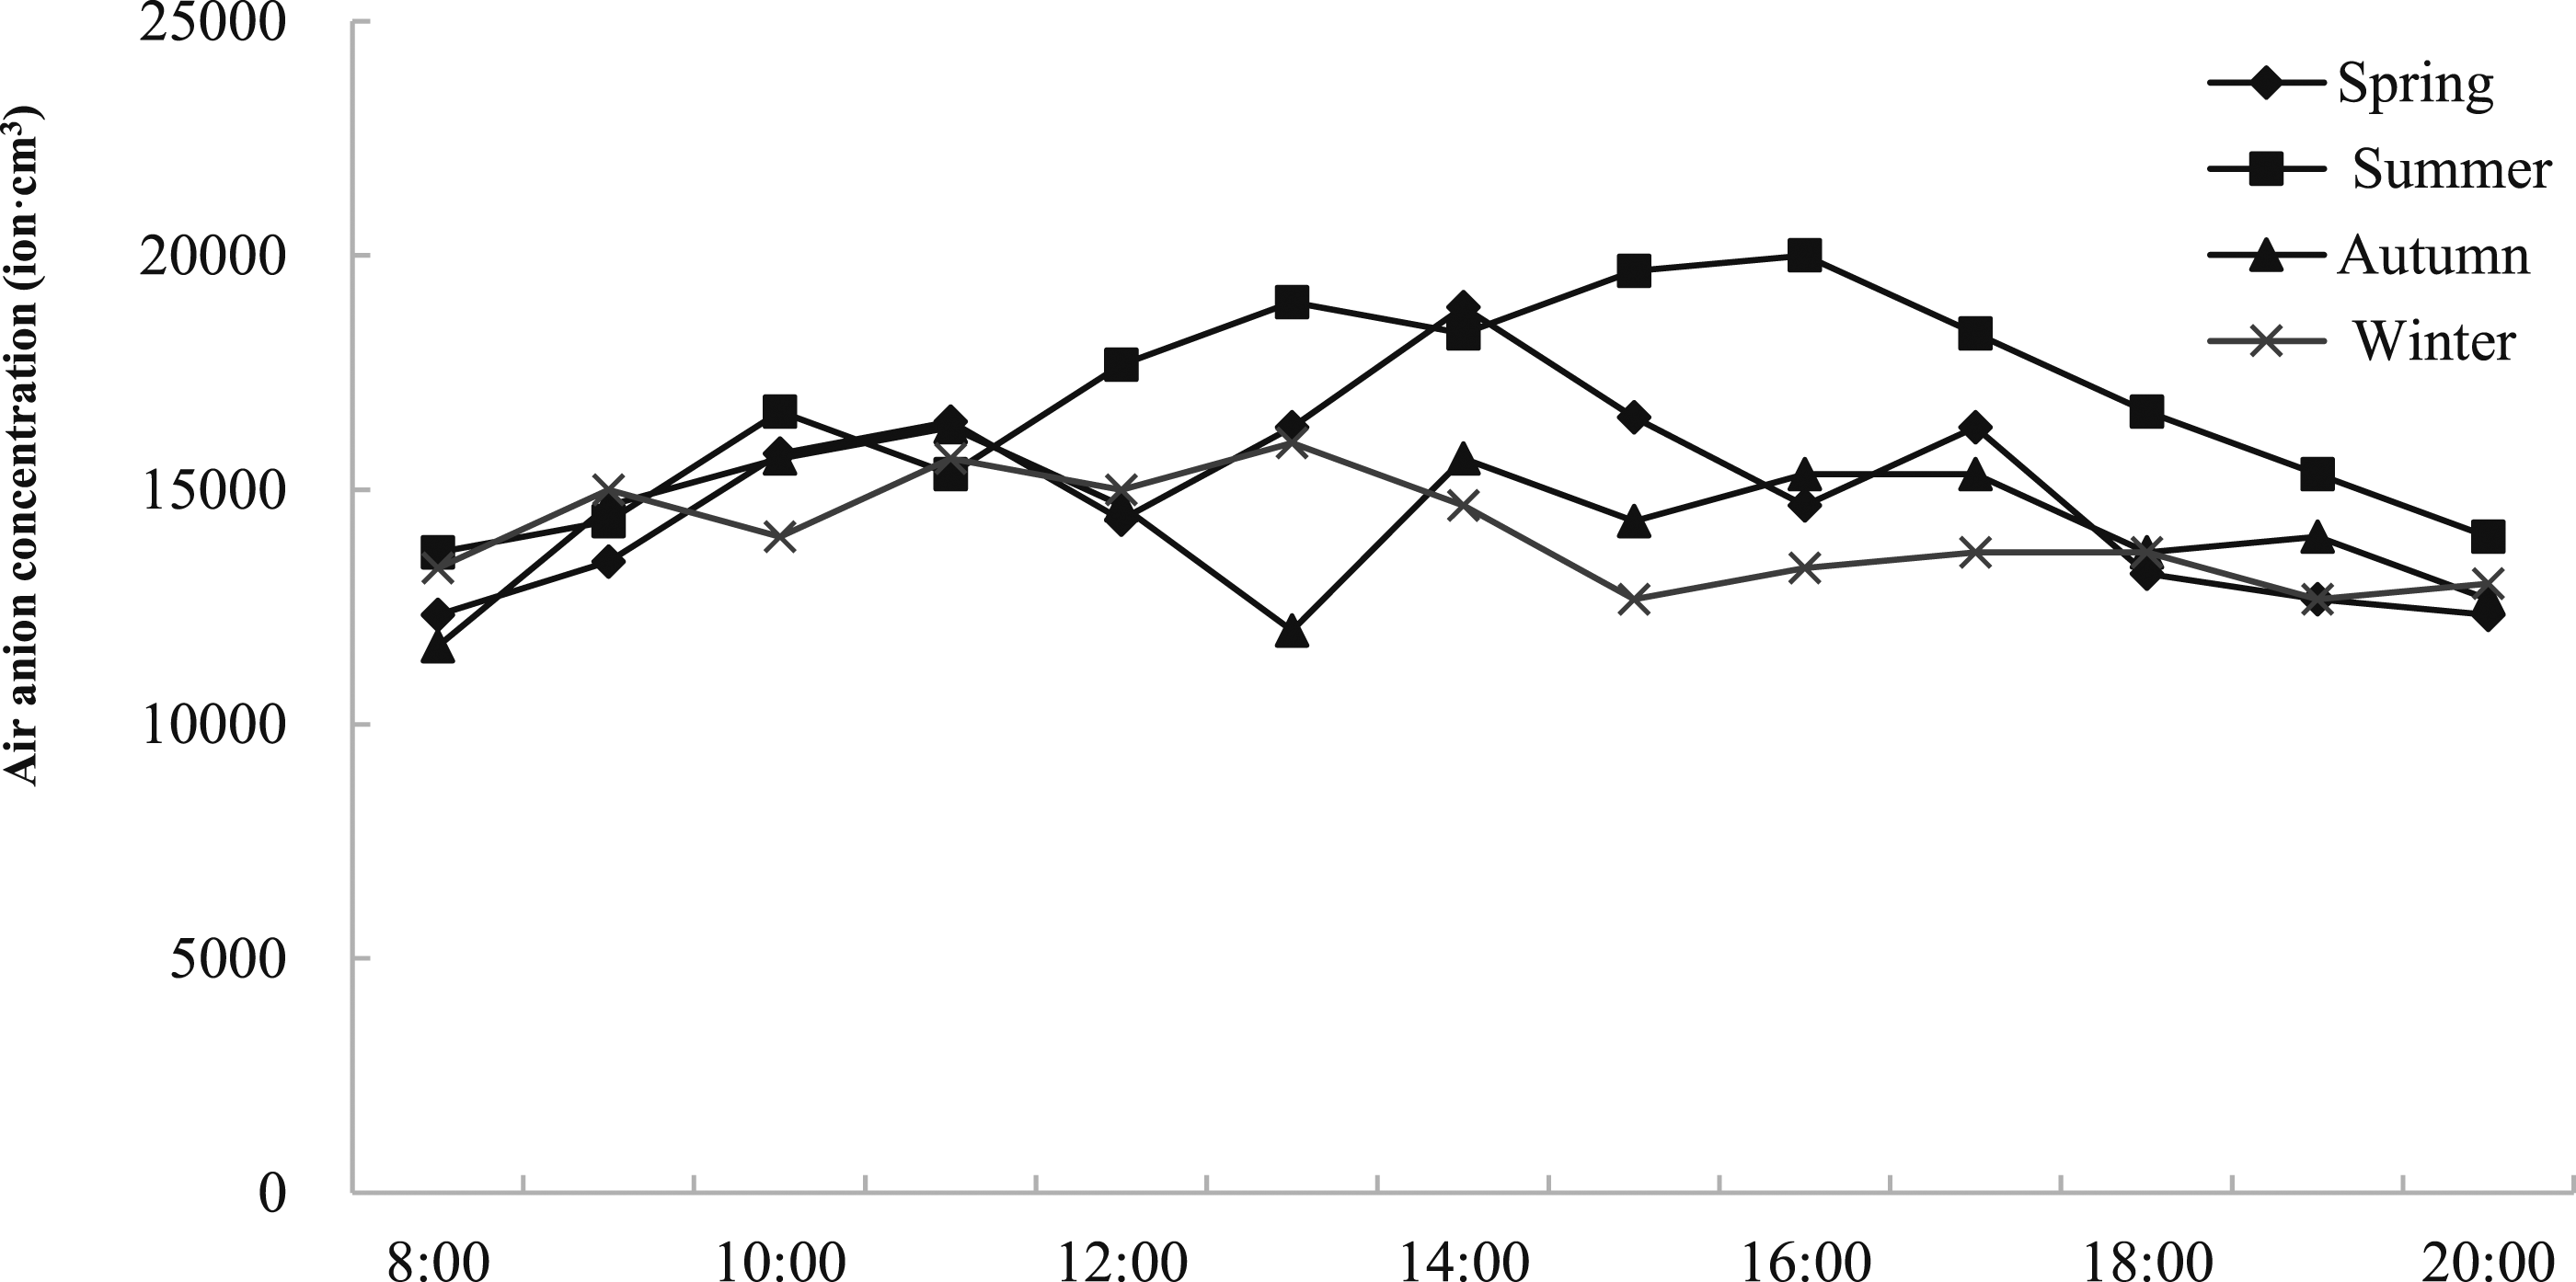
Comparison of NAI concentration in the ecological scenic area of Biri Holy Mountain between four seasons
The NAI concentrations in the ecological scenic area of Biri Holy Mountain between four seasons were compared. In detail, the NAI concentrations in summer (16,051 ion·cm3) > in spring (15,205 ion·cm3) > in autumn (14,538 ion·cm3) > in winter (14,154 ion·cm3) (as shown in Figure 7). The number of peaks in the four seasons was different, with three peaks in spring and winter, and the least in summer that only two peaks here, and four peaks in autumn. Comparison of NAI concentration in the ecological scenic area of Biri Holy Mountain between four seasons.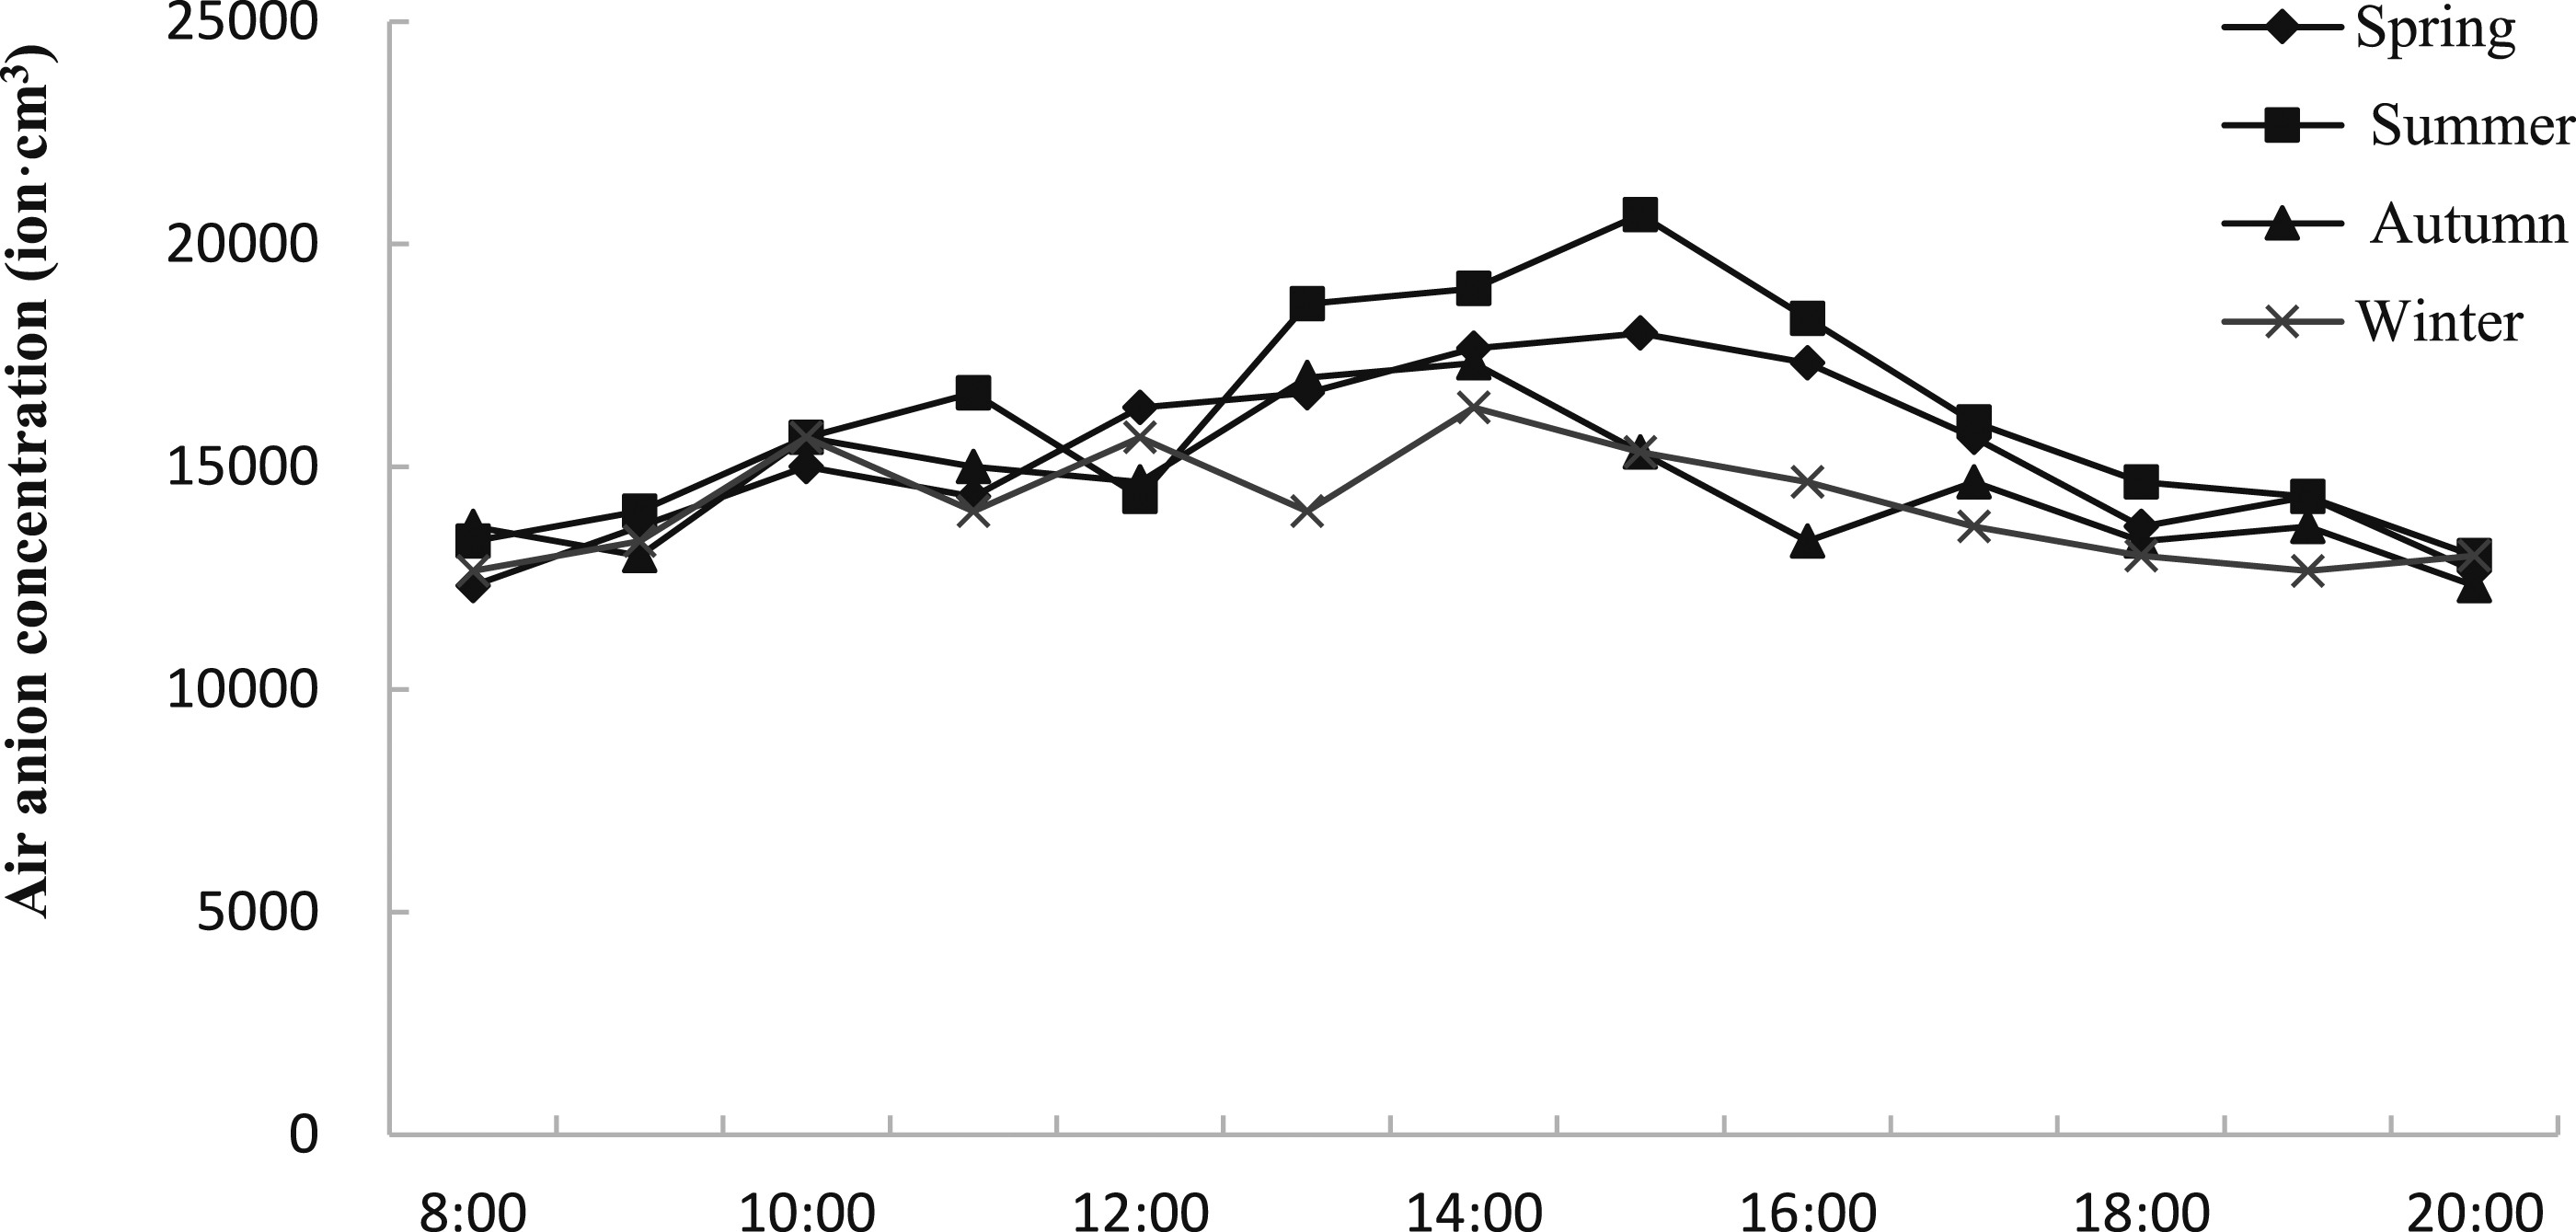
Comparison of NAI concentration in the scenic area of Cypress King’s Garden between four seasons
The NAI concentrations in the ecological scenic area of Biri Holy Mountain between four seasons were compared as follows: in summer (15,436 ion·cm3) > in spring (14,667 ion·cm3) > in winter (14,359 ion·cm3) > in autumn (13,949 ion·cm3) (as shown in Figure 8). There were two peaks in spring, and three peaks appeared for NAI concentration curves in summer, autumn, and winter. Comparison of NAI concentration in the scenic area of Cypress King’s Garden between four seasons.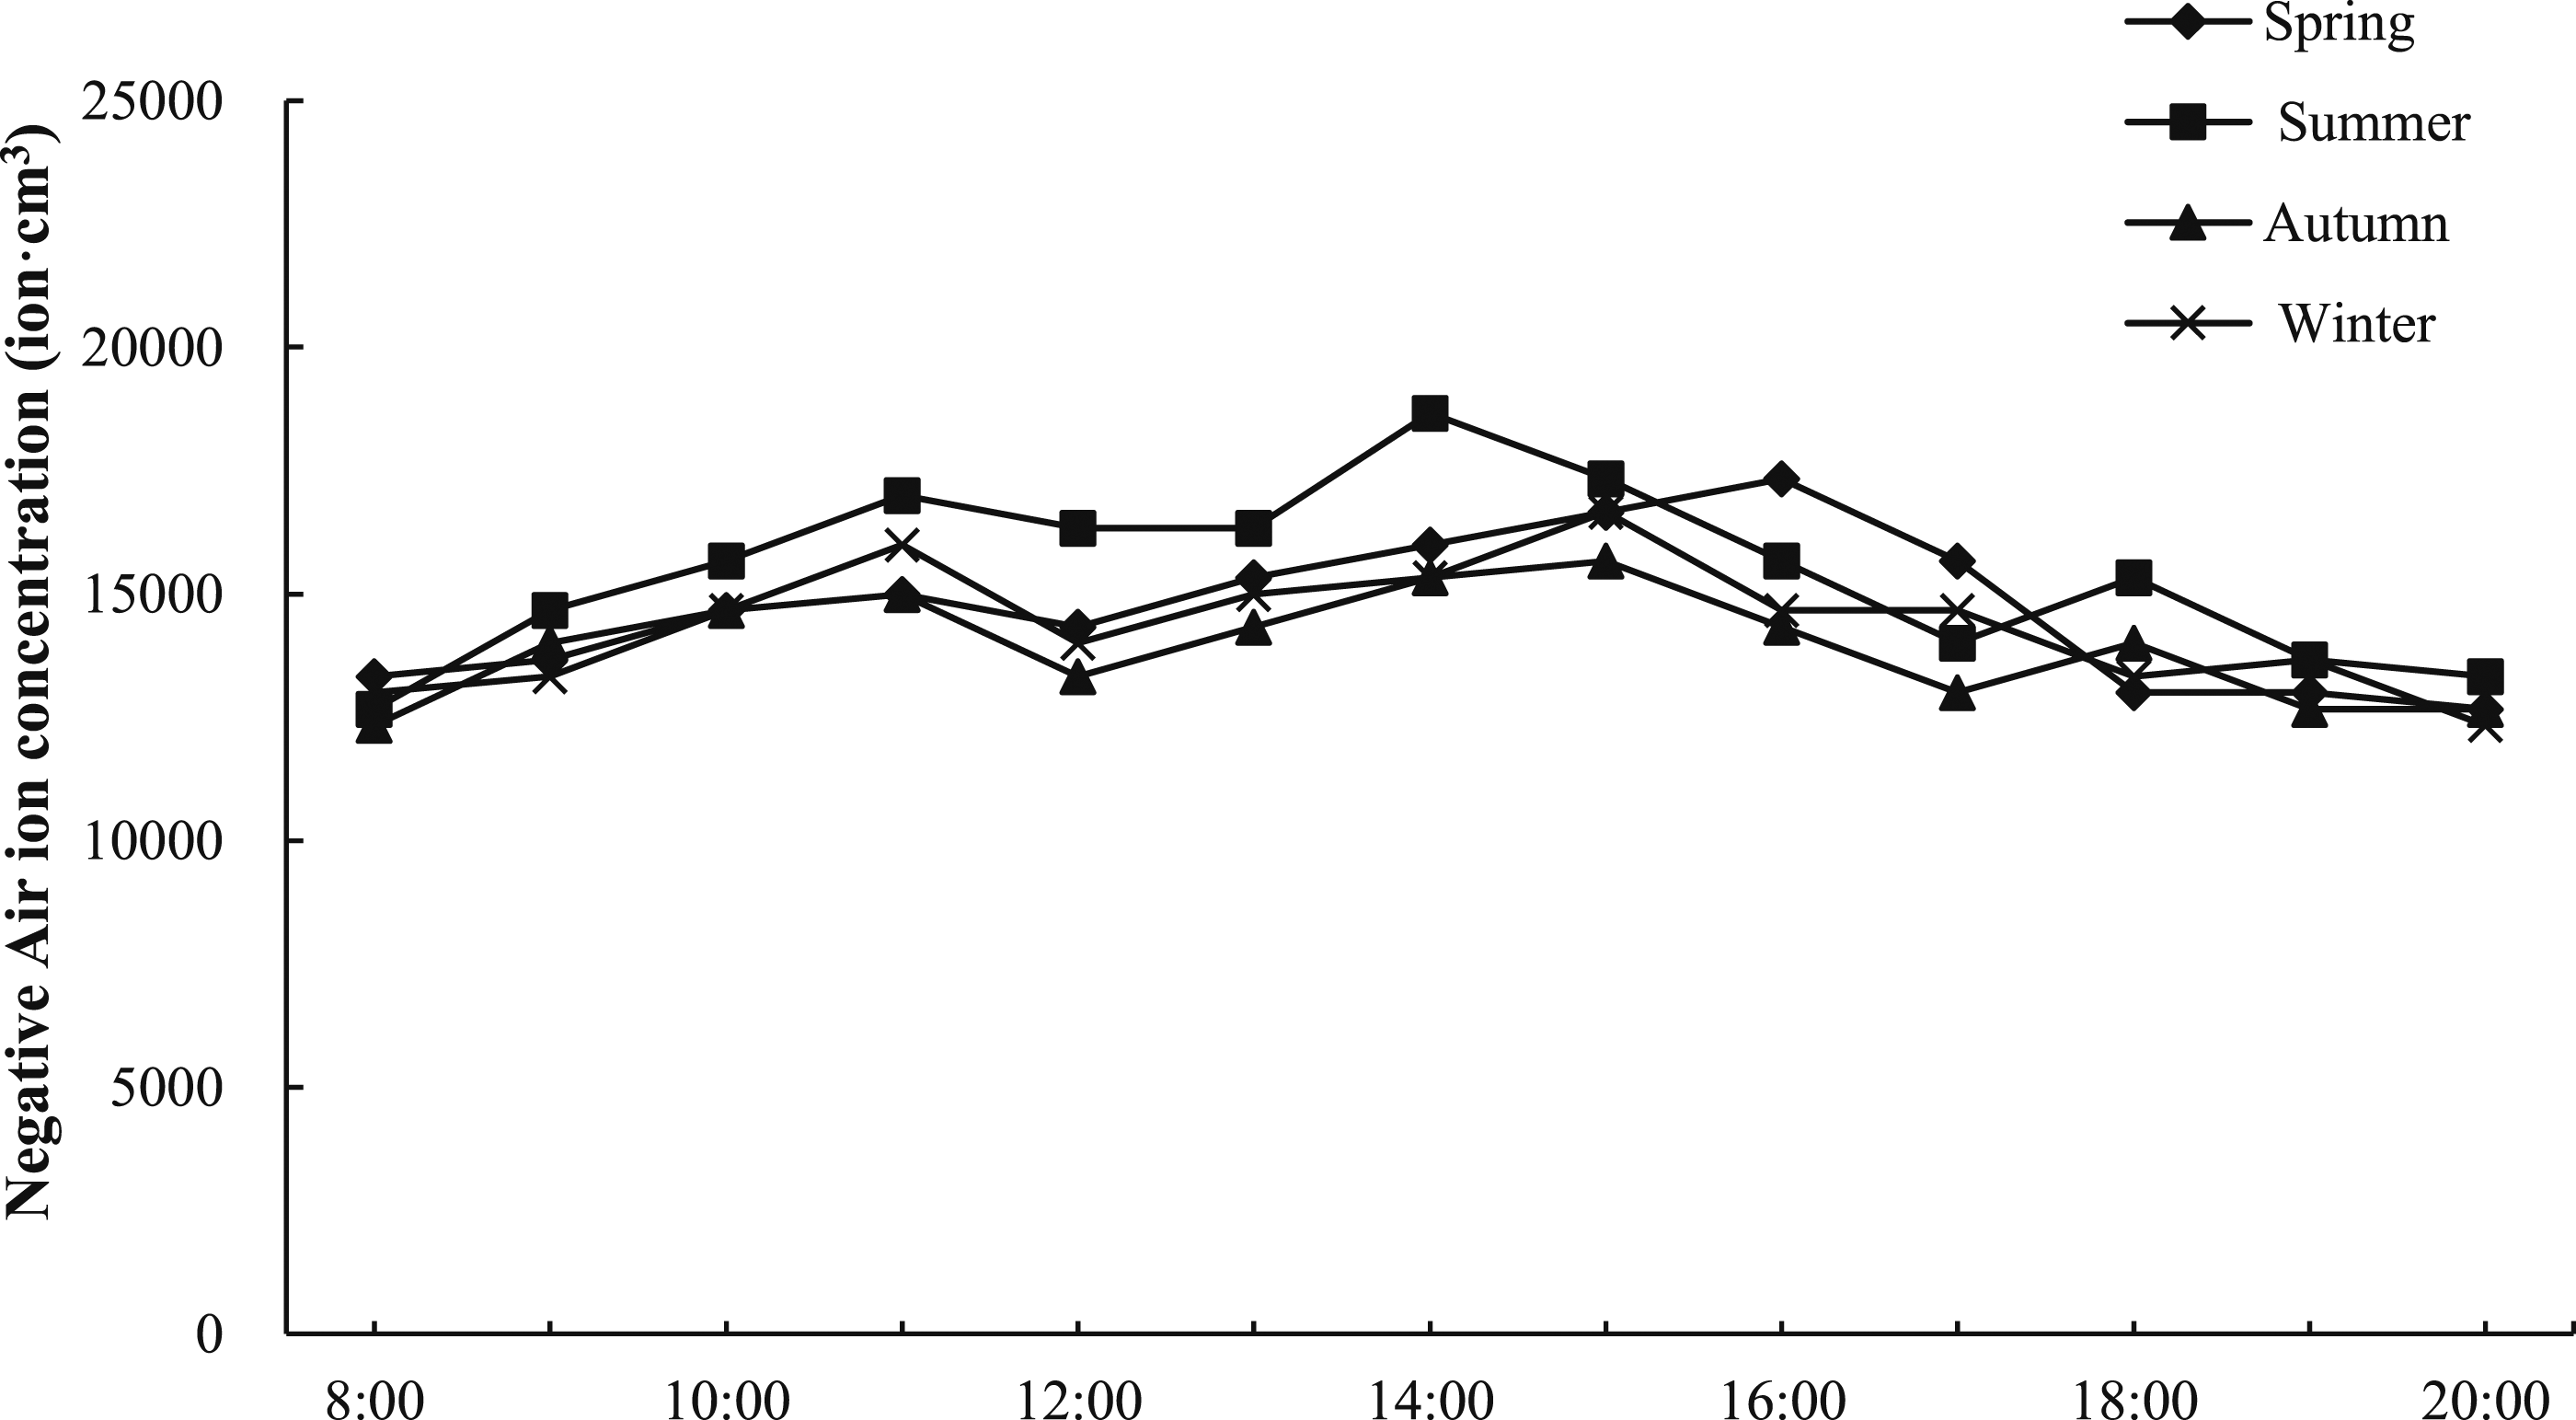
Comparison of NAI concentration in Gala Peach Blossom Village between four seasons
The NAI concentrations in Gala Peach Blossom Village between four seasons were compared that the NAI concentration in summer (15,538 ion·cm3) > in autumn (14,950 ion·cm3) > in spring (14,359 ion·cm3) > in winter (14,282 ion·cm3) (as shown in Figure 9). There were three peaks for NAI concentration curves in spring, summer, and autumn and four peaks in winter. Comparison of NAI concentration in Gala Peach Blossom Village between four seasons.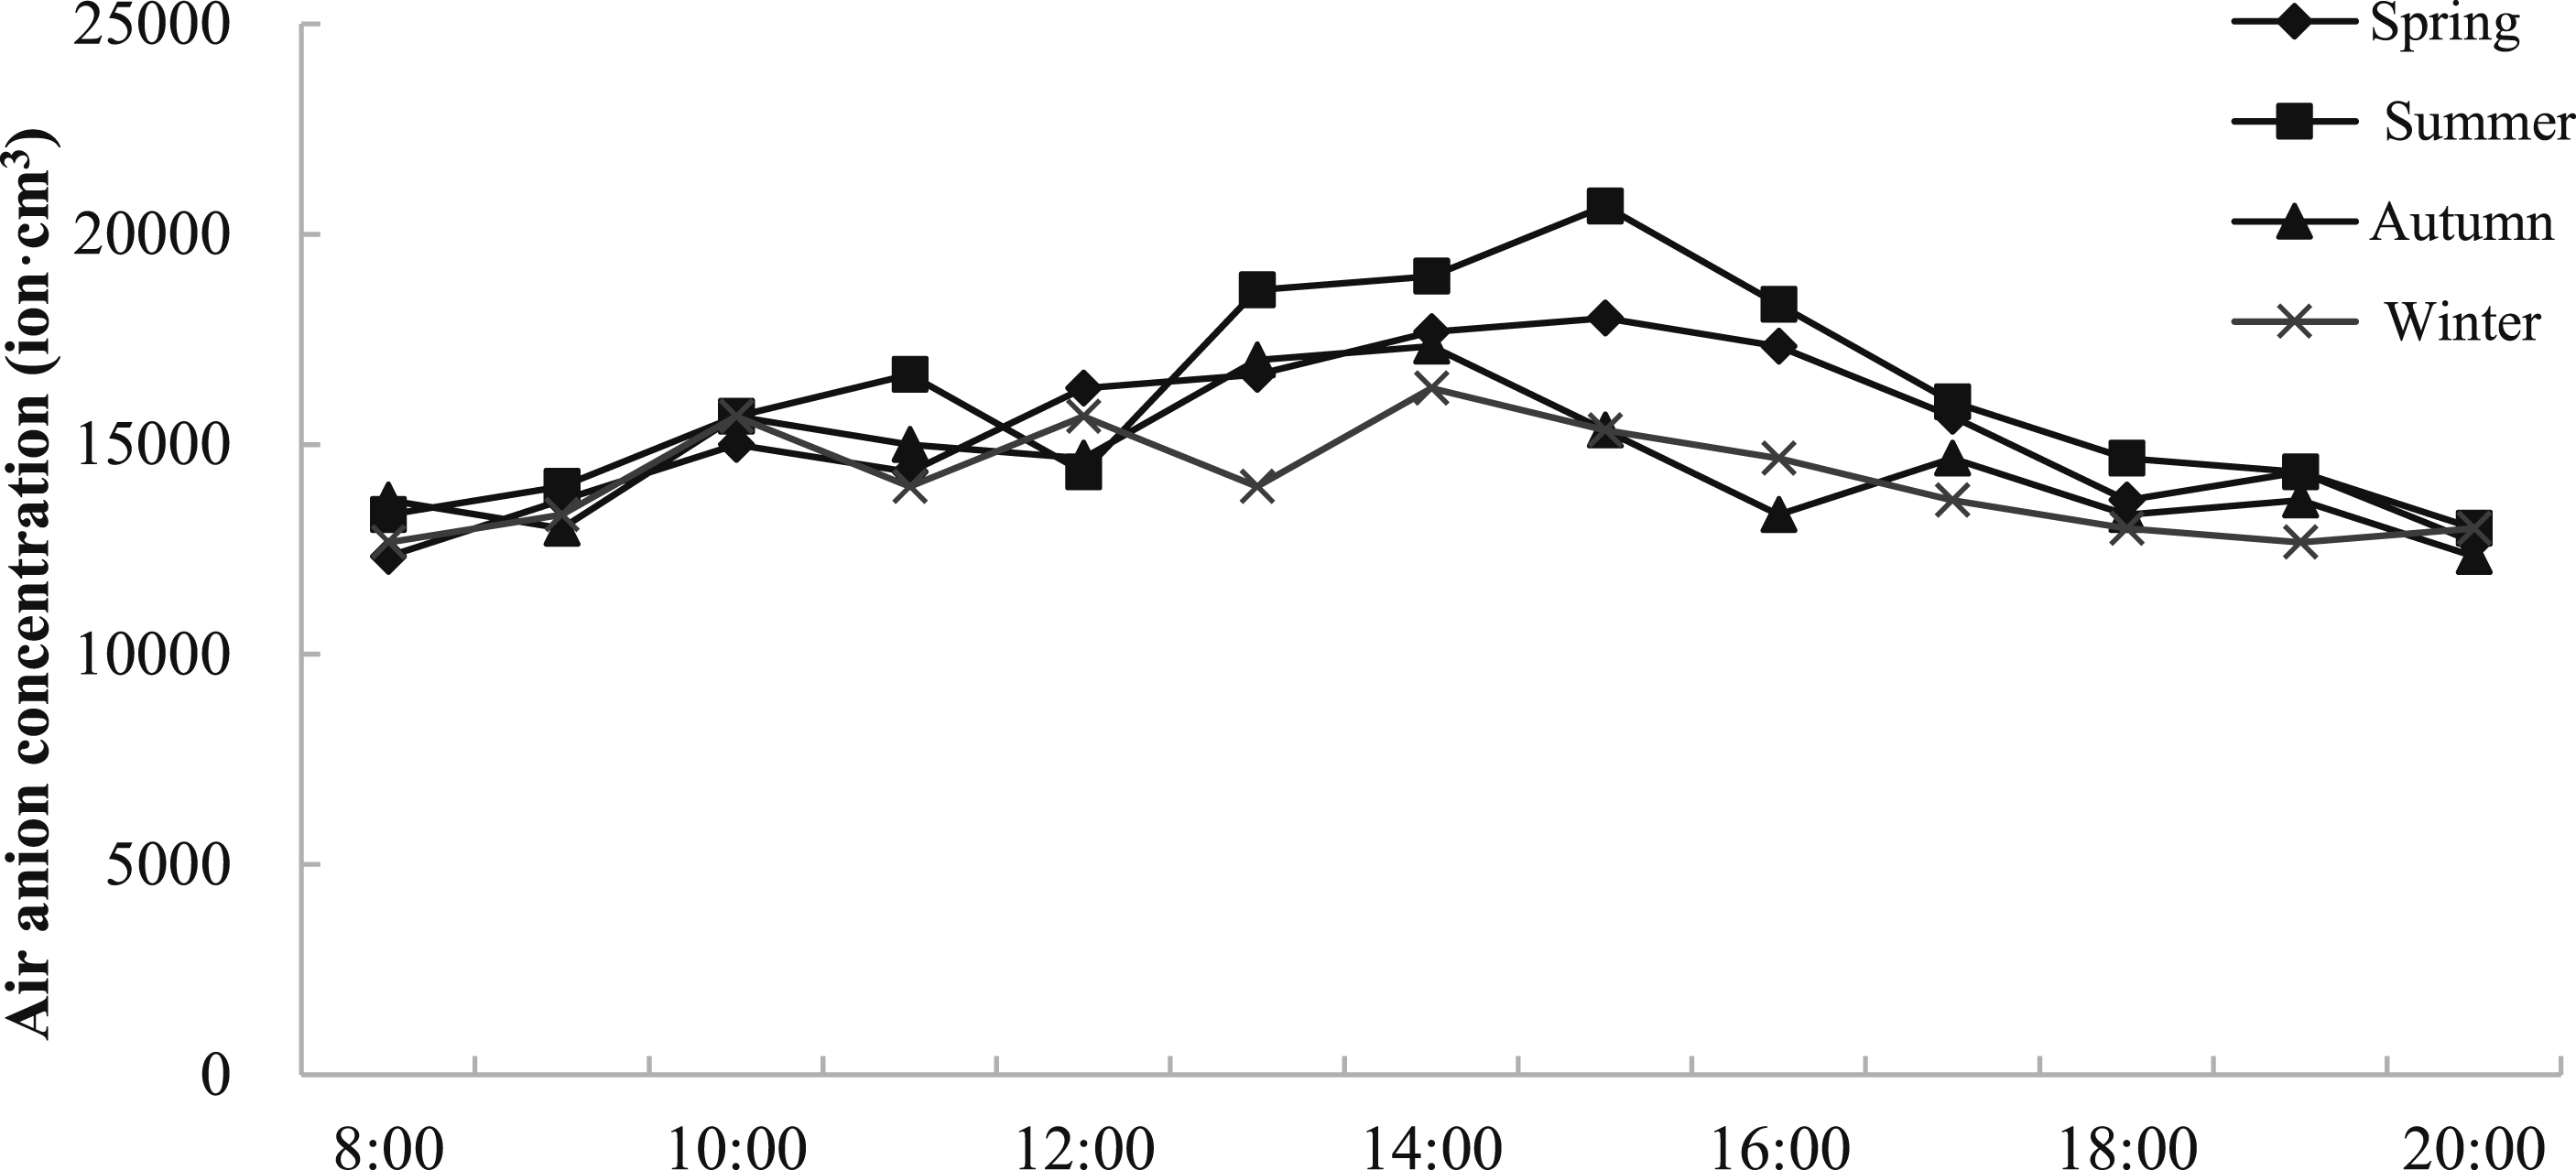
Comparison of NAI concentrations between different urban green spaces in the same season
In the same season, the NAI concentrations in various urban green spaces were different. In detail, in spring, the NAI concentration in Fujian Park > the green space of Guangfu Avenue > the ecological scenic area of Biri Holy Mountain > Wetland Park of Happiness Community > the scenic area of Cypress King’s Garden > Gala Peach Blossom Village. In summer, the NAI concentration in Fujian Park > the green space of Guangfu Avenue > Wetland Park of Happiness Community > the ecological scenic area of Biri Holy Mountain > Gala Peach Blossom Village > the scenic area of Cypress King’s Garden. In autumn, the NAI concentration in Fujian Park > the green space of Guangfu Avenue > Gala Peach Blossom Village > the ecological scenic area of Biri Holy Mountain > Wetland Park of Happiness Community > the scenic area of Cypress King’s Garden. In winter, the NAI concentration in Fujian Park > the scenic area of Cypress King’s Garden > Gala Peach Blossom Village > the green space of Guangfu Avenue > the ecological scenic area of Biri Holy Mountain > Wetland Park of Happiness Community.
Discussion
This study monitored the NAI concentrations in six urban green spaces in the main urban areas of Nyingchi City. The results demonstrated significant differences in NAI concentrations between different observation sites in different seasons. The NAI concentrations in summer were significantly higher than those in the other seasons. In spring, vegetation just begins to germinate and grow, the temperature is relatively low, the photosynthesis capacity of plants is weak, and there are fewer NAIs; while in summer, 34 the vegetation grows lushly, the water and heat supply are sufficient, the humidity is increased, and the solar radiation is strong, providing energy for the production of NAIs. In addition, the photosynthesis of plants is strong, and the number of O2 molecules released into the air is increased, and the adsorbed NAIs are increased, resulting elevated NAI concentrations. In autumn and winter, the water and heat supply are reduced, the vegetation shed leaves, and the photosynthesis capacity of plants is weakened, resulting decreased NAI concentrations accordingly.
Daily variations in NAI concentration in different types of green spaces in Nyingchi City were quite different. In general, most of the peaks appeared between 11 a.m. and 3 p.m. 11 The light supply is adequate between 11 a.m. and 3 p.m. in Nyingchi City; solar radiation is strong and creates good conditions for the production of NAIs, so the NAI concentrations during this period of time are high.
The results of this study indicated that the NAI concentration was negatively correlated with temperature. Consistent with the results of other studies, 35 higher temperature affected the physiological activities of plants that plants reduced the release of NAIs, resulting declined concentration of NAIs. The results of this study demonstrated a positive correlation between relative humidity and NAIs. Our result was consistent with the reported findings that the higher the relative humidity, the higher the NAI concentration.34,36
The NAI concentration in Fujian Park was significantly higher than the other observation sites. There are rich vegetation types in Fujian Park, and there is a large area of water in Fujian Park, increasing the humidity of the surrounding air and is conducive to the production of NAIs. 36 Furthermore, Fujian Park is a relatively closed environment that could keep NAIs from escaping. The vegetation types in the other observation sites are relatively simple. Therefore, as a result, the annual NAI concentration in Fujian Park is higher than that in the other areas.
There are a variety of sources for NAIs, and NAI concentration is easily affected by external factors. This study did not carry out observations for 24 consecutive hours and thus errors may exist. In our study, we found that wind had a great impact on NAIs and the measured data differed a lot with respect to windy weather or no wind weather, with values significant larger when windy.
Conclusion
The NAI concentrations in different types of green space in the main urban area of Nyingchi City were different. The richer the vegetation types and the more diverse the urban green spaces, the higher the NAI concentration.
The NAI concentration exhibited a clear daily changing pattern in various types of green spaces in the main urban area of Nyingchi City, mostly with peaks at 11 a.m. and at 2 p.m. and big fluctuations in the afternoon. The daily variation pattern of NAI concentration in Nyingchi City was as follows. It started to rise from sunrise to reach a peak, then gradually decreased as the temperature elevated and the humidity declined. The peak appeared at different time points regarding various observation sites, but usually appeared between 11 a.m. and 2 p.m. In addition, the changes showed different patterns with respect to different observation sites. In detail, the daily variation of NAI concentration in Fujian Park was presented as a three-peak pattern, with the peaks at 12 a.m.-1 p.m., at 4 p.m., and at 6 p.m., and the valleys was at 9–10 a.m., at 2 p.m., and at 5 p.m. The NAI change pattern was irregular in the green space of Guangfu Avenue, with peaks at 2 p.m. and at 5 p.m. and a valley at 4 p.m. The Wetland Park of Happiness Community had three peaks, at 11 a.m., at 2 p.m., and at 5 p.m., and two valleys at 12 p.m. and at 3 p.m. Similarly, the ecological scenic area of Biri Holy Mountain had three peaks at 10 a.m., at 2 p.m., and at 7 p.m., and two valleys at 11 a.m. and at 6 p.m. The scenic area of Cypress King’s Garden was quite different from the other sites, with two peaks at 11 a.m. and at 3 p.m., and a valley at 12 p.m. The Gala Peach Blossom Village had a single peak at 2 p.m., and no valley.
The NAI concentrations in various types of green spaces in the main urban area of Nyingchi City exhibited distinct seasonal variations. In general, with sufficient temperature and humidity in summer, the NAI concentration was the highest among four seasons. However, during the winter season, where temperature and humidity conditions were poor, the concentration of NAI was the lowest of the four seasons. The research findings suggest a close correlation between the green space area, temperature, humidity, water area, and changes in the concentration of negative oxygen ions. In the area of urban planning, it is imperative to expand the green space, enhance the hierarchical arrangement of flora, achieve a blend of trees, shrubs, and grass, and enable plants to have a constructive impact. To expand the green space area, the “three-dimensional” planting method can also be implemented to enhance the green space ratio. Enclosed and semi-enclosed spatial layouts should be employed to enhance the negative oxygen ion aggregation in terms of spatial arrangement. It is also essential to fortify the planning and design of water systems in urban planning, set up a model of water systems + plant structures + spatial layout, and produce a landscape design that elevates the plateau city’s living environment quality. To fully take advantage of the potential benefits of negative oxygen ions, decision-making departments should leverage existing resources to conduct “health tourism” and “forest health” initiatives in Nyingchi City. This will enhance the city’s overall quality.
Statements and declarations
Footnotes
Declaration of conflicting interests
The author(s) declared no potential conflicts of interest with respect to the research, authorship, and/or publication of this article.
Funding
The author(s) disclosed receipt of the following financial support for the research, authorship, and/or publication of this article: This work was supported by the Ministry of Education Humanities and Social Sciences Research Tibet Project-Planning Fund Project (23XZJA840001), Tibetan Human Settlements Teaching Team Project (XJJXTD-12272), Key Laboratory of Ecology and Energy Saving Study of Dense Habitat, and Ministry of Education (20210111).