



Abstract
This study designs a crop planting strategy based on deep learning, applied to optimize crop planting decisions in a specific rural area from 2024 to 2030. It aims to maximize profit by utilizing limited arable land resources under multiple uncertainties and constraints. This paper uses data preprocessing techniques and multi-objective optimization algorithms, with mixed-integer linear programming (MILP), QP-free, genetic algorithm (GA), and NSGA-II as core algorithms, to optimize planting strategies from both linear and nonlinear perspectives. In model design and validation, the performance of different algorithms is systematically compared, analyzing differences in runtime, resource usage, and accuracy. Experimental results show that NSGA-II better balances profit and resource efficiency under multi-objective conditions, while the QP-free model is suitable for cost-sensitive scenarios. The findings provide a highly efficient, intelligent decision support method for modern agriculture, with the potential to enhance crop production efficiency and achieve sustainable development.
Introduction
Research status at home and abroad
In the field of crop planting strategy design and research, the research results of domestic and foreign scholars are quite rich. In terms of algorithm design and application, Liu Zhenhuan et al. 1 used SPAM model to deeply analyze the spatio-temporal changes of rice planting, which not only provided valuable data support for planting decision-making but also pointed out that the model may be limited by data quality and regional special factors. Wang Zhipeng et al. 2 systematically reviewed the optimization method of planting structure based on water constraint, which provided a solid theoretical basis for water resources management. Wang Yang and Wang Xinjiang 3 analyzed the driving factors of the evolution of planting structure in Jilin Province from multiple dimensions, highlighting the key role of regional differences in the change of planting structure. Deng Zongbing et al. 4 revealed the characteristics of planting geographical agglomeration through index measurement, pointed out the limitations of existing methods, and emphasized the necessity of index selection and calculation method improvement. Yin Linlin et al. 5 constructed a regional priority evaluation model for planting structure adjustment based on the water footprint of crop production and the water resource scarcity index, but more complex factors should be considered in practical application. The model proposed by Massimo T et al. 6 is of great value in irrigation decision support, but it needs to be calibrated according to crop and soil characteristics in different regions, and there are certain challenges in the acquisition and processing of remote sensing data. Foreign methods combining genetic algorithm and deep learning 7 show significant advantages in predicting crop yield but face challenges such as parameter setting, computing resource requirements, and model interpretability. The multi-objective algorithm proposed by Sonal J et al. 8 has potential in optimizing crop patterns, but in practical applications, the weight of the algorithm needs to be adjusted according to the objective emphasis of different regions. Research related to climate change9–11 is crucial for building a climate change-adapted planting decision-making system, but it needs to be constantly updated to cope with the complexity and uncertainty of climate change. In general, studies at home and abroad have deeply explored planting strategies from different perspectives, which provides a solid theoretical basis and technical support for the construction of efficient and reliable crop planting decision systems.
Research direction and significance
Amidst swift scientific and technological advancements, agriculture confronts challenges including escalating population growth, tightening resource constraints, and escalating quality demands for agricultural produce. Deep learning, a pivotal branch of artificial intelligence, offers innovative methodologies for optimizing agricultural planting strategies through its prowess in data analysis and pattern recognition. This technology is capable of forecasting crop development, thereby enabling farmers to make informed decisions, enhancing crop yields, and fostering the sustainability of agriculture.
Within the agricultural domain, the judicious exploitation of arable land and the cultivation of organic practices tailored to local conditions are crucial for the economic viability and sustainability of rural regions. The refinement of planting strategies not only augments operational efficiency but also mitigates risks and bolsters profitability. Leveraging data from the 2024 National Mathematical Modeling Competition for College Students (Problem C), this research delves into the planting plans for a specific rural area from 2024 to 2030, with a particular emphasis on optimization under multifaceted constraints.
Overall design
This research aims to develop an efficient and reliable crop planting decision-making system that takes into account multiple factors, such as economic benefits and resource utilization efficiency. Using advanced data processing techniques and multi-objective optimization algorithms, the system provides optimal planting decisions for various plots from 2024 to 2030. The overall design starts with data processing to build a robust dataset, followed by selecting suitable algorithms for model construction and optimization, and finally, performing comparative analyses of different algorithm performances to ensure the system’s effectiveness and practicality.
Data processing
Data dimensionalization rules.

Sample data after dimensionalization.

Based on the actual situation assumption, the future expected sales of wheat and corn have a trend of growth, with an average annual growth rate between 5% and 10%, and the future expected sales of other crops have a change of about ±5% per year compared to 2023. The per mu yield of crops is often affected by climate and other factors, and there will be a change of ±10% per year. Due to the influence of market conditions, the cost of growing crops increases by about 5% per year on average. The selling prices of grain crops were basically stable. The sales price of vegetable crops has a growing trend, with an average annual increase of about 5%. The sales price of edible mushrooms is stable and has fallen about 1%–5% per year, especially the sales price of morel mushrooms has fallen by 5% per year. Based on this foundation, the DLMCTS algorithm was chosen as the data generation tool. This algorithm is adaptable to dynamic constraint conditions, intelligently guides the search direction, and can learn from prior knowledge, allowing it to flexibly respond to fluctuating market conditions and accurately reflect sales changes. Moreover, it supports consistent random number generation across different platforms, greatly enhancing the reproducibility of the research. Consequently, this study uses the DLMCTS algorithm to generate data for each plot from 2024 to 2030.
Model construction and selection
In modern agricultural production planning, multiple conflicting objectives need to be optimized simultaneously, such as economic benefits and resource use efficiency. The optimization problem in this study includes two primary objectives: profit maximization and minimization of water resource usage, along with related constraints. These constraints involve factors such as plot regulations, crop legality restrictions, seasonal rules, and crop water requirements. Subsequently, by defining decision variables, a mixed-integer linear programming model was constructed from a linear optimization perspective. However, as the number of variables and constraints increased, the complexity of solving this model also rose. Therefore, a linear QP-free model was further developed for the multi-objective optimization problem.
From a nonlinear optimization perspective, a preliminary genetic algorithm (GA) model was constructed. However, this algorithm converges slowly, is sensitive to parameter settings, and is prone to getting trapped in local optima. To address this, a multi-objective genetic algorithm model was introduced. After using various algorithms to solve the optimal planting decisions for each year, a systematic comparative analysis of planting plans across different years was conducted to balance all indicators. Finally, a rigorous verification and evaluation of the solution results was performed to analyze the feasibility and optimization effectiveness of the planting strategies under different algorithms (Figure 1). Algorithm flowchart.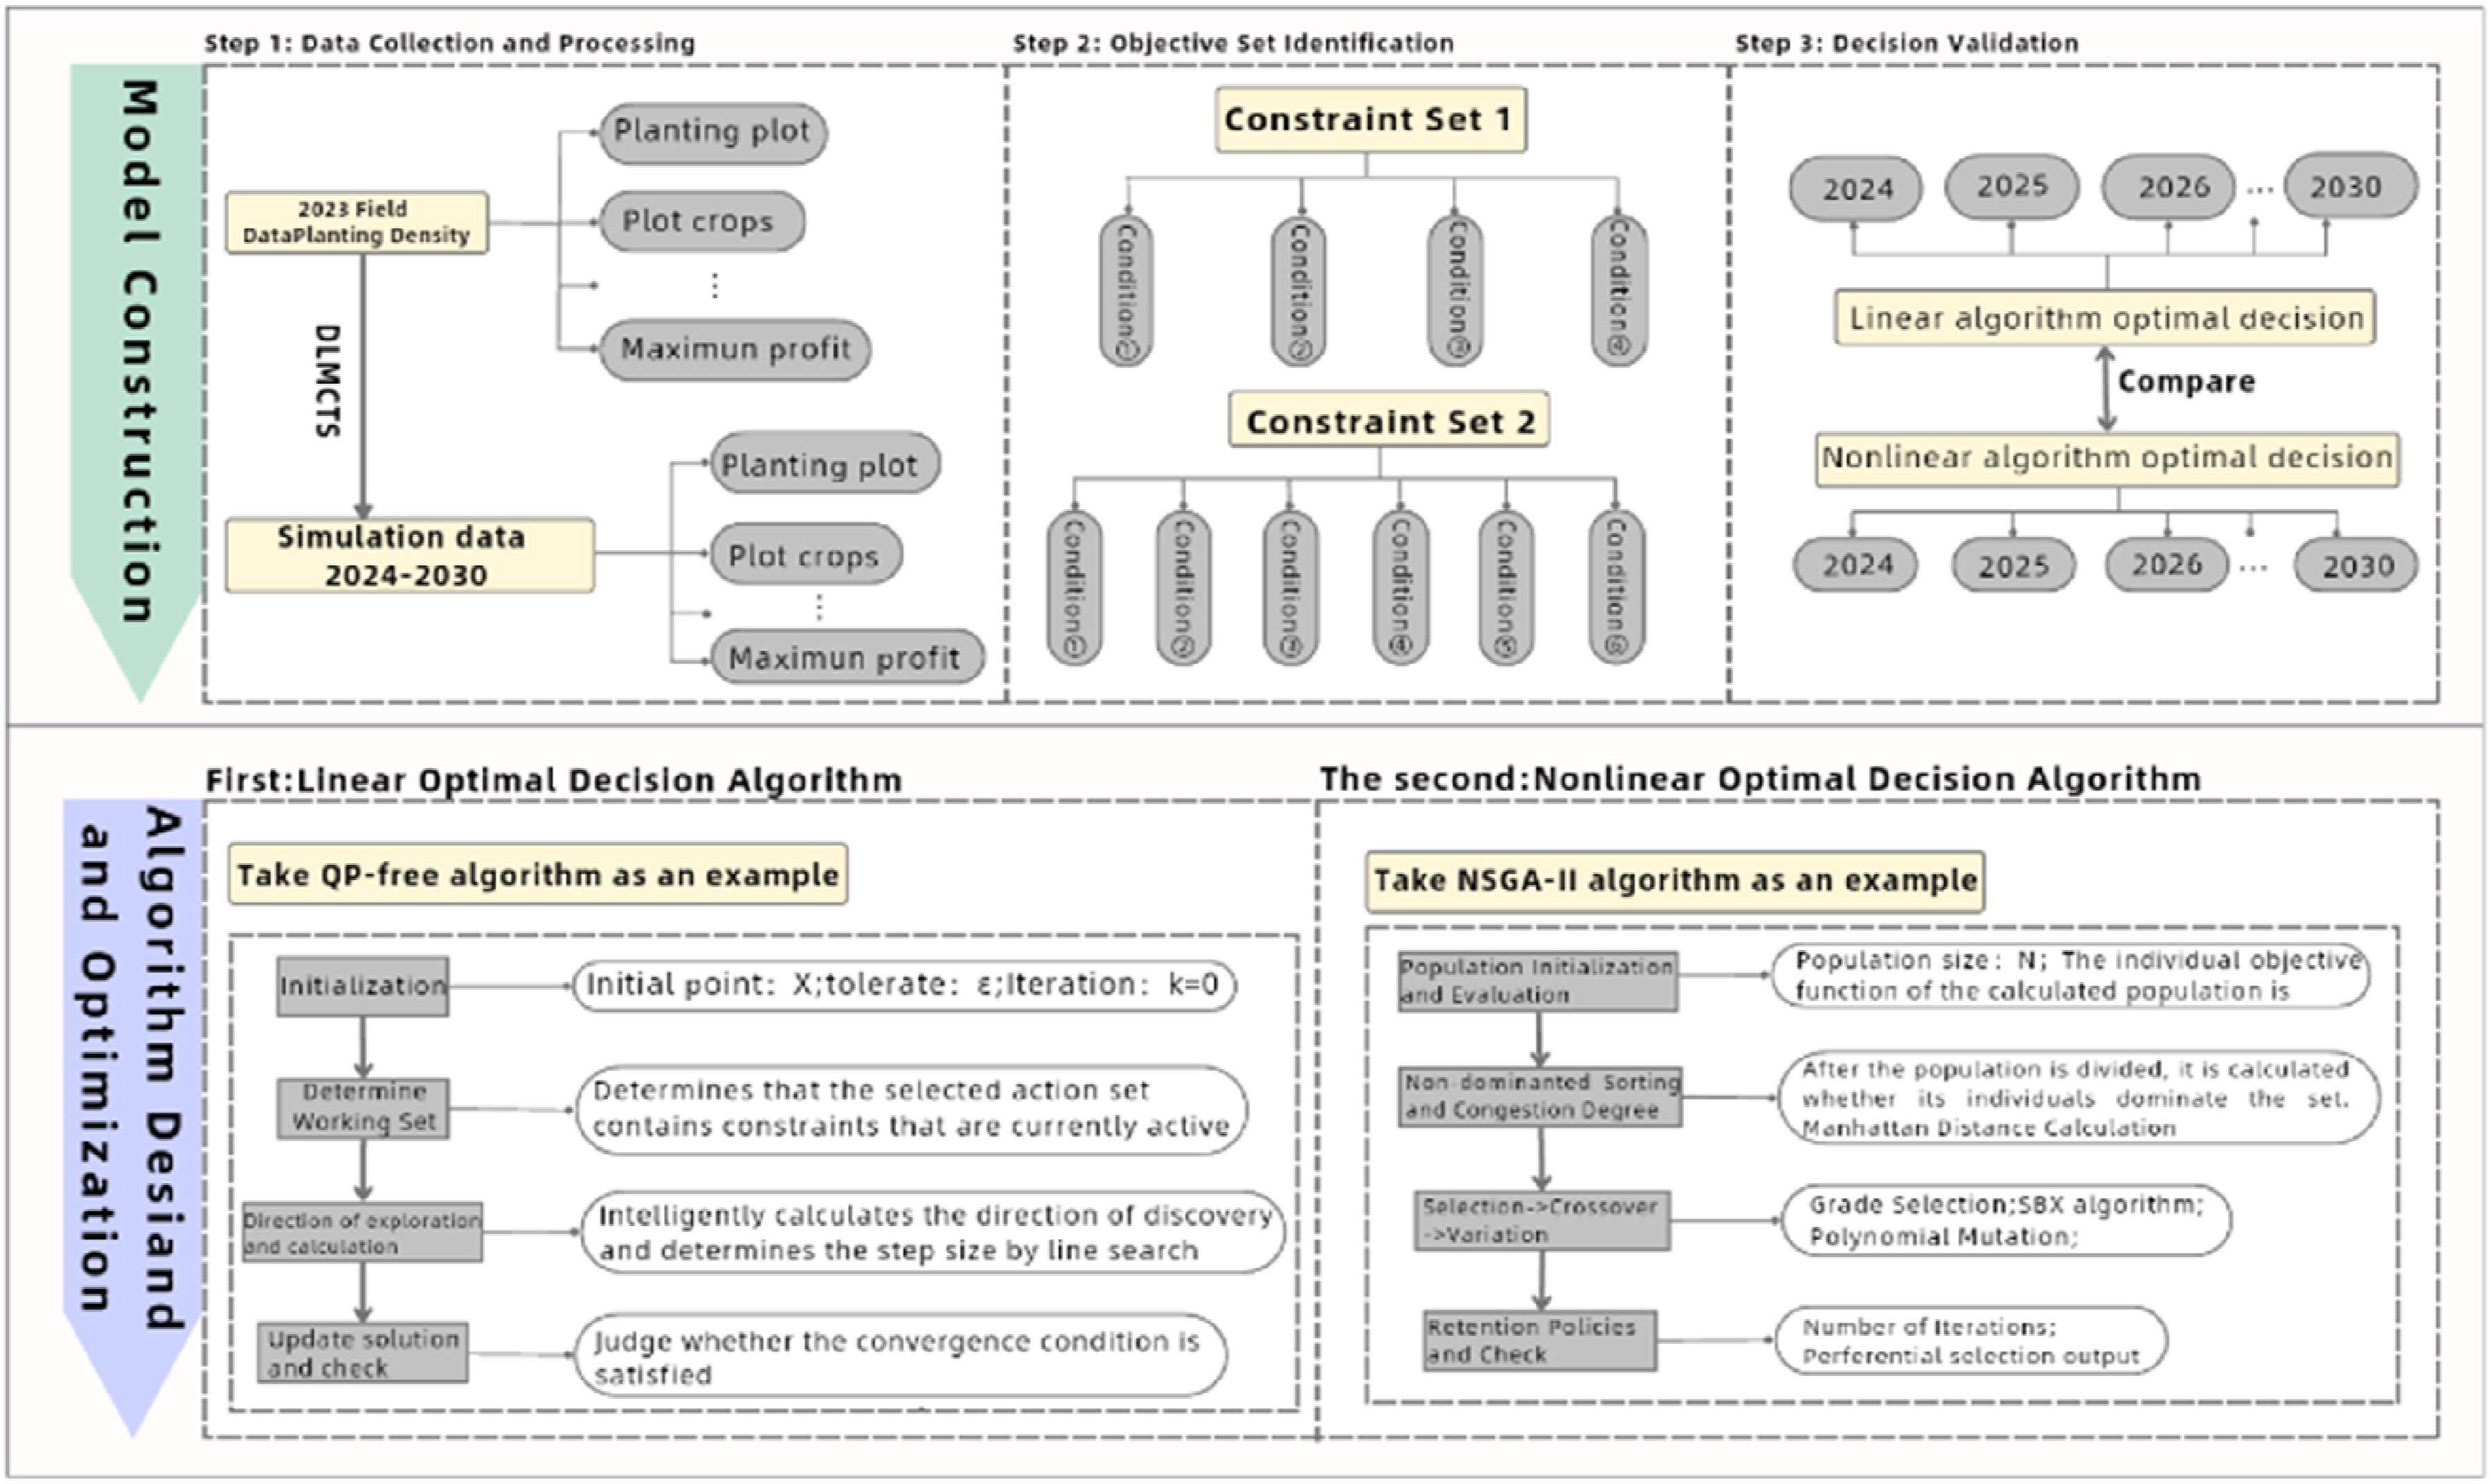
Algorithm design and analysis
QP-free algorithm


NSGA-II algorithm
NSGA-II is a popular multi-objective optimization algorithm that improves upon the original NSGA by using fast non-dominated sorting to rank individuals in the population. For each individual in the population, two variables are calculated: the number of individuals it dominates and the set of individuals it is dominated by. The crowding distance is used to maintain the diversity of the population.
The formula for calculating the crowding distance is as follows: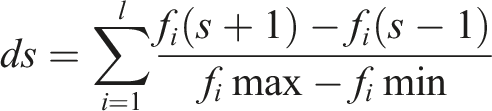

Algorithm performance comparison
Runtime comparison
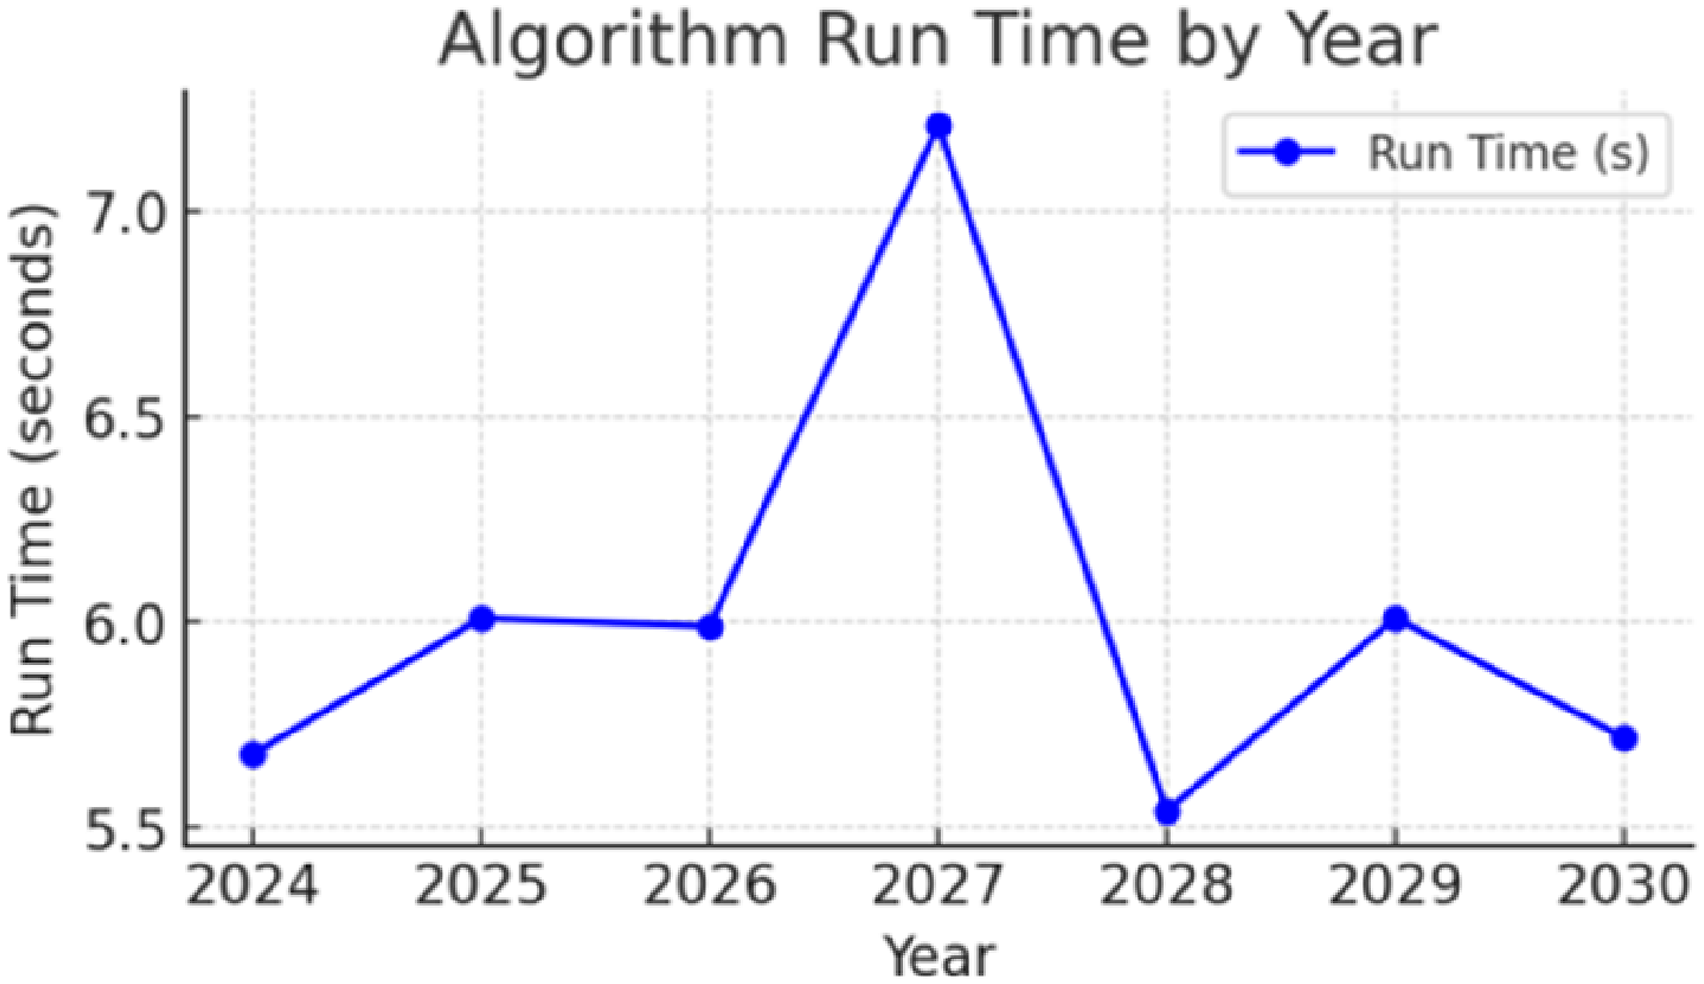
The runtime of the QP-free model remains relatively stable, with minor fluctuations that are smaller in magnitude than the NSGA-II model. The runtime of the NSGA-II model exhibits more significant fluctuations, but its average runtime is shorter overall. In the long term, from 2024 to 2030, the QP-free model’s runtime shows no significant upward or downward trend and remains stable. In contrast, the NSGA-II model’s runtime increases in fluctuations from 2024 to 2027 and then gradually decreases from 2027 to 2030. This trend difference reflects the varying internal mechanisms of the two algorithms as they process yearly data.
Resource usage comparison
Memory Usage: During data processing and model calculations, the NSGA-II algorithm, due to its population evolution mechanism, may consume more memory when the population size is large, as it needs to store individuals and their attribute information. In contrast, the memory usage of the QP-free algorithm is relatively stable, primarily depending on the data volume and the complexity of the processing steps.
CPU Usage: During peak computation periods, the NSGA-II algorithm, which involves operations such as non-dominated sorting and crowding distance calculation, may cause CPU usage to spike. On the other hand, the QP-free algorithm generates relatively stable but continuous CPU load due to its search strategy and iterative process, particularly when handling complex constraints and objective functions.
Accuracy of Results comparison
Short-term Results: In the short term (1–2 years), there is little difference between the QP-free and NSGA-II models in terms of objectives such as profit and resource utilization efficiency. In the short term, planting decisions are less influenced by dynamic factors, and both algorithms can make reasonable decisions based on current data.
Long-term Results: In the long term (2024–2030), the NSGA-II model, with its multi-objective optimization advantages, shows an increasing gap in profit optimization compared to the QP-free model. However, the profit advantage comes with increased costs, such as resource and computation costs. The QP-free model shows a more gradual profit increase but performs better in cost control, with relatively stable resource utilization efficiency (Figures 2 and 3). QP-free model time performance. NSGA-II model time performance.
Results analysis
This section presents a detailed analysis of the results obtained from the linear and nonlinear models, comparing the performance of MILP, QP-free, GA, and NSGA-II algorithms. The analysis focuses on profit changes, cost comparisons, and the adaptability of the models to different agricultural conditions. The limitations of the model, including data availability, computational cost, and adaptability to different agricultural conditions, are also discussed.
Linear simulation results comparison
Figure 4 shows the profit changes for the MILP and QP-free models. In 2027, the MILP model experiences significant fluctuations in profit but quickly recovers, surpassing the QP-free model by 2030. In contrast, the QP-free model has a steady and gradual profit growth. The cost comparison on the right indicates that from 2026, the MILP model’s costs steadily rise, while the QP-free model stabilizes after 2027. This suggests that while the MILP model offers a profit advantage, its rapidly increasing costs require careful consideration of input-output balance. Comparison of linear simulation.
Nonlinear model results comparison
In Figure 5, the comparison of total profit and cost between the NSGA-II and GA algorithms reveals a clear profit advantage for NSGA-II, but its costs increase year by year. Throughout the period, NSGA-II consistently outperforms GA in terms of profit, while GA shows a steadier performance with a declining cost trend. Although NSGA-II optimizes profit, it has poor cost control. In contrast, GA manages costs well and is suitable for scenarios where long-term cost efficiency is emphasized. Comparison of nonlinear model results.
NSGA-II vs QP-free model results comparison
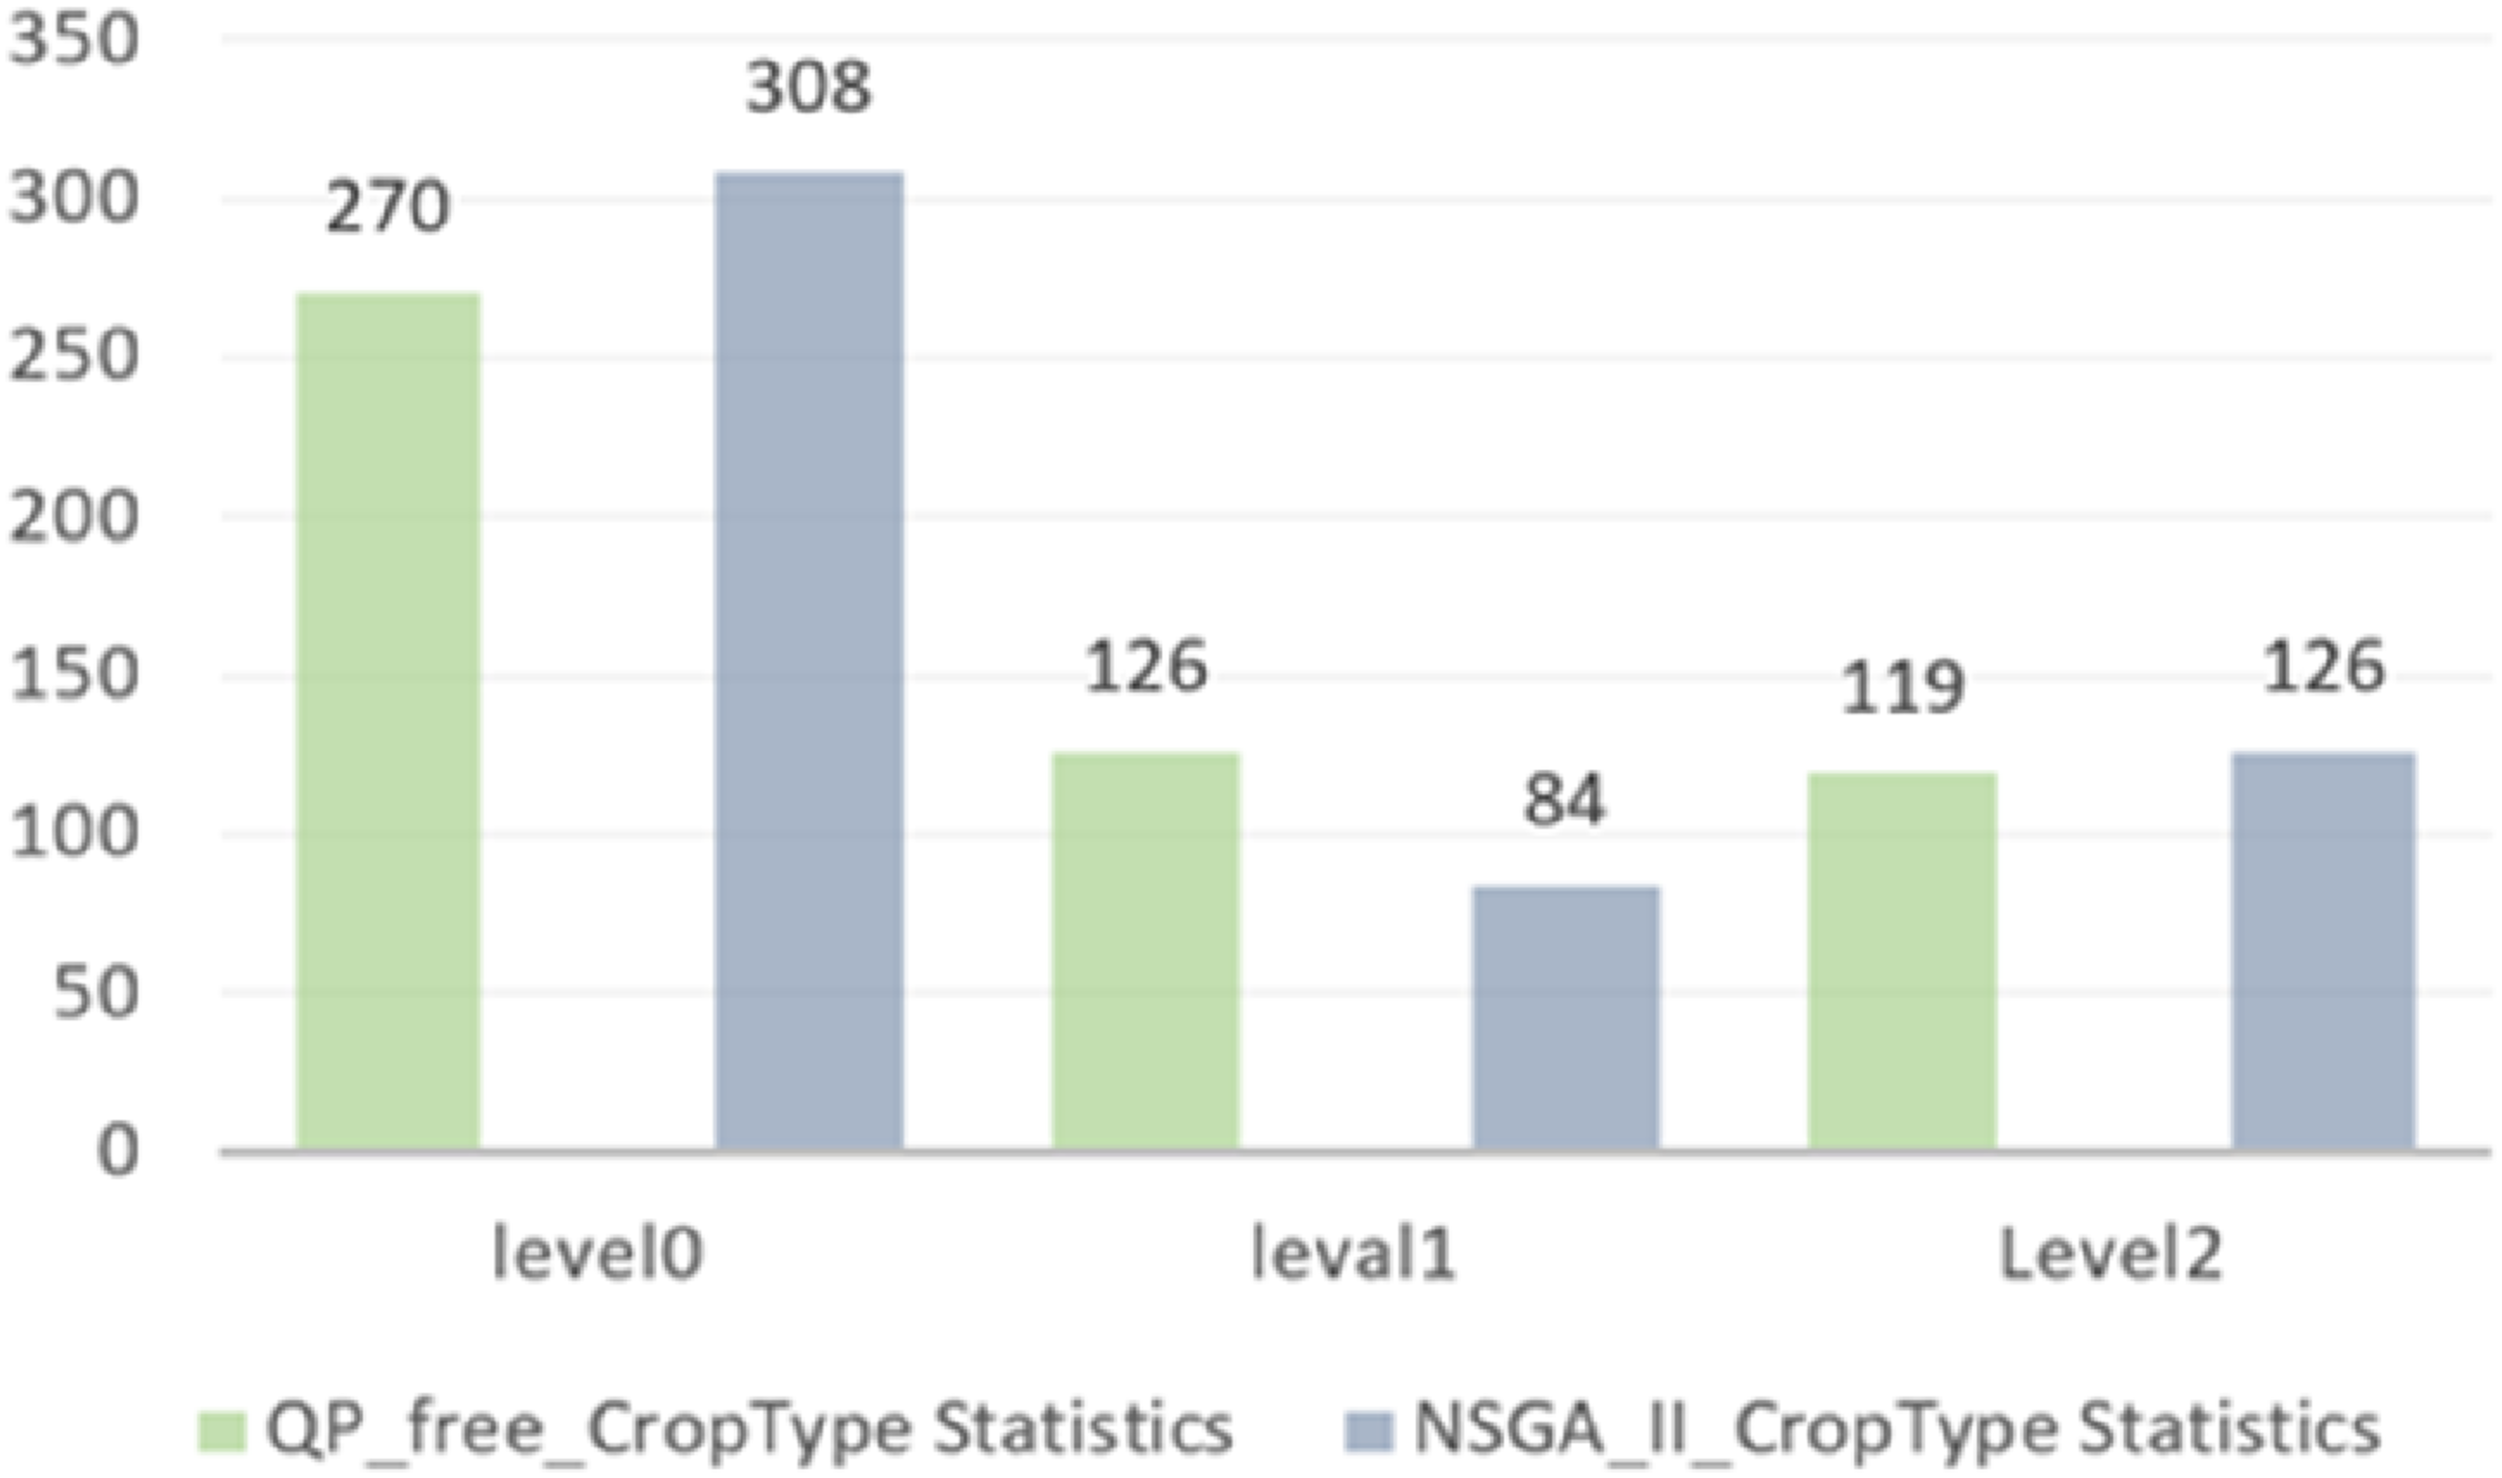
The profit optimization differences between NSGA-II and QP-free models are significant. During nonlinear optimization, NSGA-II performs exceptionally well, maintaining high and stable profits throughout the period, making it suitable for multi-objective optimization tasks. The QP-free model is stable in the early stages, but its profit growth is slower than NSGA-II, suggesting that NSGA-II is more adaptable to complex systems, better balancing multiple conflicting objectives for higher returns. After 2027, QP-free model costs stabilize, while NSGA-II costs increase year by year, indicating that the QP-free model can achieve certain profit optimization at a lower cost, making it suitable for cost-sensitive scenarios. NSGA-II, while significantly increasing profits, incurs higher costs, which should be approached cautiously, especially in later stages of operation. The high cost of NSGA-II aligns with its efficiency in multi-objective optimization. When selecting a model, if profit optimization is prioritized and high costs are acceptable, NSGA-II is a good choice. However, if strict cost control is necessary and profit growth requirements are moderate, the QP-free model is more suitable. At the same time, the columnar comparison chart of statistical data of optimal planting crop water demand between NSGA_II and QP_free in Figures 6 and 7 shows that at the lower level of crop water demand, the statistical data of NSGA_II model is 392, while the predicted statistical data of QP_free model is 396. Summing up the above that QP_free algorithm is more suitable for multi-objective optimization prediction than NSGA_II algorithm. Water demand statistics for crop types. Comparison of model statistics.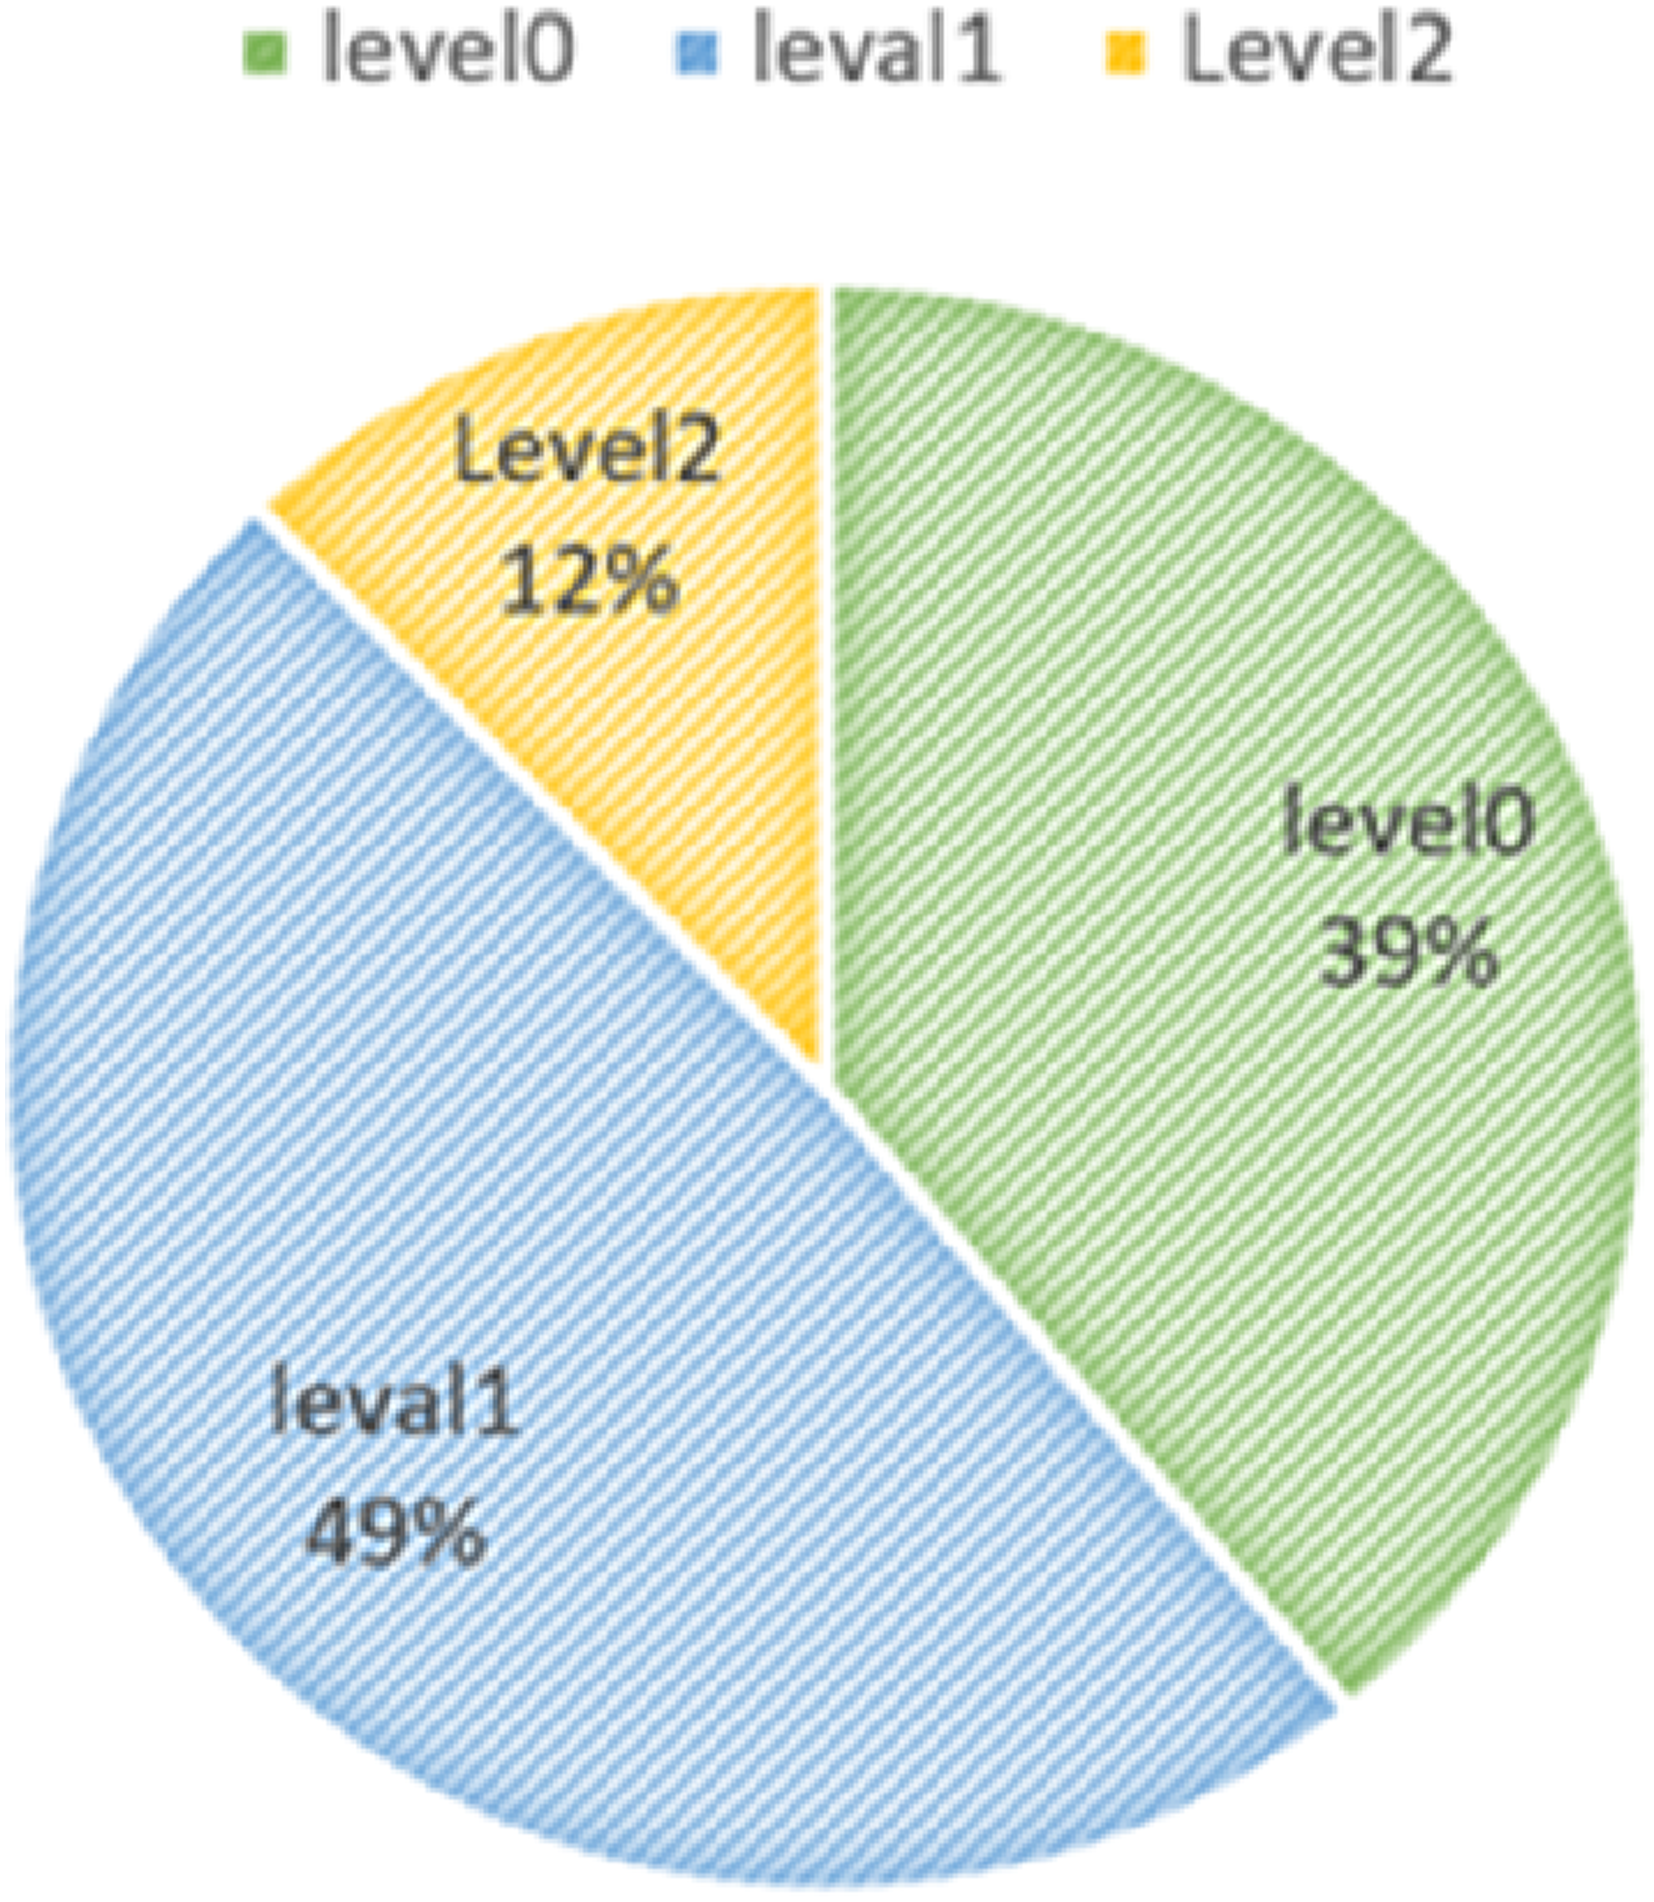
Conclusion
This study constructs crop planting strategy decision support models using the MILP, QP-free, GA, and NSGA-II algorithms. Given the complexity of agricultural production, which faces market fluctuations, yield uncertainties, and other factors, this research employs simulation data generation techniques to model real-world uncertainties, enhancing the model’s adaptability and practicality. Through detailed preprocessing of large datasets (such as variable selection and dimensional unification), the model aligns more closely with practical applications, improving the accuracy of the research findings.
However, the model still has limitations: first, the numerous influencing factors and high uncertainty of simulation data make actual prediction operations difficult, requiring professional assistance; second, although the QP-free algorithm excels at handling complex optimization problems, it has long solution times when processing large datasets, which may not meet the need for quick responses. Future research should focus on simplifying the model structure and improving solution efficiency to better serve agricultural production practices, promoting more scientific and efficient agricultural decision-making.
Statements and declarations
Footnotes
Conflicting interest
The authors declared no potential conflicts of interest with respect to the research, authorship, and/or publication of this article.
Funding
The author(s) disclosed receipt of the following financial support for the research, authorship, and/or publication of this article: The research is supported by the Hunan Natural Science Foundation Project (No.2024JJ7126).
