
Abstract
The digital media landscape has changed recently due to technological advancements, providing innovative ways for consumers to engage with brands and products. Among these technical advancements, augmented reality (AR) has become a potent instrument that improves user experiences by superimposing digital data onto the physical environment. AR creates immersive experiences that captivate users, fostering deeper emotional and cognitive connections. The objective of the study is to investigate the influence of AR technology on user engagement and interaction within digital media environments, employing computational analysis to examine user behavior. A total of 176 respondents participated in this study; they were divided into two groups: Group A received interaction with AR-enhanced media, and Group B received interaction with traditional digital content. Survey questionnaires will be conducted to measure changes in user satisfaction, engagement perception, overall immersive experience, user trust, and perceived enjoyment. Statistical techniques, such as t-tests, chi-square, Pearson correlation, descriptive statistics, and one-way ANOVA, will be used to analyze the data to compare the user engagement levels between groups. The findings indicate that high-fidelity improves the AR systems (Group A), which effectively integrate real and virtual elements and significantly enhance user trust and presence, leading to more meaningful interaction. This study offers perceptions into the efficacy of augmented reality in promoting increased user engagement, with implications for optimizing engagement tactics for marketers and developers of digital content.
Introduction
Augmented reality (AR) generation has emerged as a transformative device inside the virtual media environment, improving person interplay and engagement. 1 Similar to traditional media that gives one-way conversation, AR creates immersive experiences by mixing virtual items with the real world. This dynamic interaction permits users to engage in actual time, making AR a powerful tool in sectors together with entertainment, education, and advertising. 2 As technology evolves, its role in reshaping consumer engagement becomes increasingly more prominent. One of AR’s numbers one advantages in digital media is its capacity to foster deep consumer engagement through interactive experiences. 3 AR programs regularly require users to actively take part by means of manipulating or interacting with virtual devices, which increases cognitive engagement. 4 This form of interplay can result in a greater personalized and memorable reveal, whether it is through interactive classified commercials, immersive video games, or academic content material. The real nature of AR encourages customers to interact more deeply with content material in comparison to passive styles of media consumption. 5 In the spare time enterprise, AR has been widely followed to improve consumer engagement through gamification. Games are high instances of ways AR technology can blend the physical and digital worlds to create a unique and engaging experience. 6 By encouraging customers to discover their surroundings and interact with virtual characters overlaid at the real world, AR gamers no longer most effectively captivate interest but additionally improve social interplay among gamers and this gamification element encourages sustained interplay with virtual media. 7 AR is revolutionizing the advertising and marketing quarter by presenting customers with interactive and attractive methods to enjoy products. 8 Retailers are incorporating AR to permit users to strive for apparel, and accessories or maybe visualize how furnishings would appear before purchasing. 9 These immersive purchasing experiences drastically affect purchaser conduct, leading to better engagement and conversion costs. By making interactions extra experiential, AR enhances the general consumer journey, growing lasting impressions on customers. 10
AR technology is also reworking the academic zone with the aid of making mastering feedback more interactive and engaging. In digital media environments, AR lets college students visualize complicated ideas, explore virtual models, and interact in simulated real-world experiences. 11 By incorporating interactive 3D design and animations, AR can serve to gain knowledge of techniques, making education more inclusive and effective. It is a better degree of engagement, as beginners can take part actively rather than passively observe facts.
While AR offers immense potential for enhancing user engagement, there are challenges related to its quality sized implementation.
12
These demanding situations include technological limitations, which include the need for high overall performance devices, and dealing with user private information and data security. Additionally, developing high-quality AR content may be a useful resource in depth, requiring specialized talents and tools. Overcoming those challenges may be essential in ensuring that AR continues to enhance consumer interaction and engagement throughout digital media systems.
13
Figure 1 represents the major impacts of AR on user interaction. The impacts of AR on user interaction.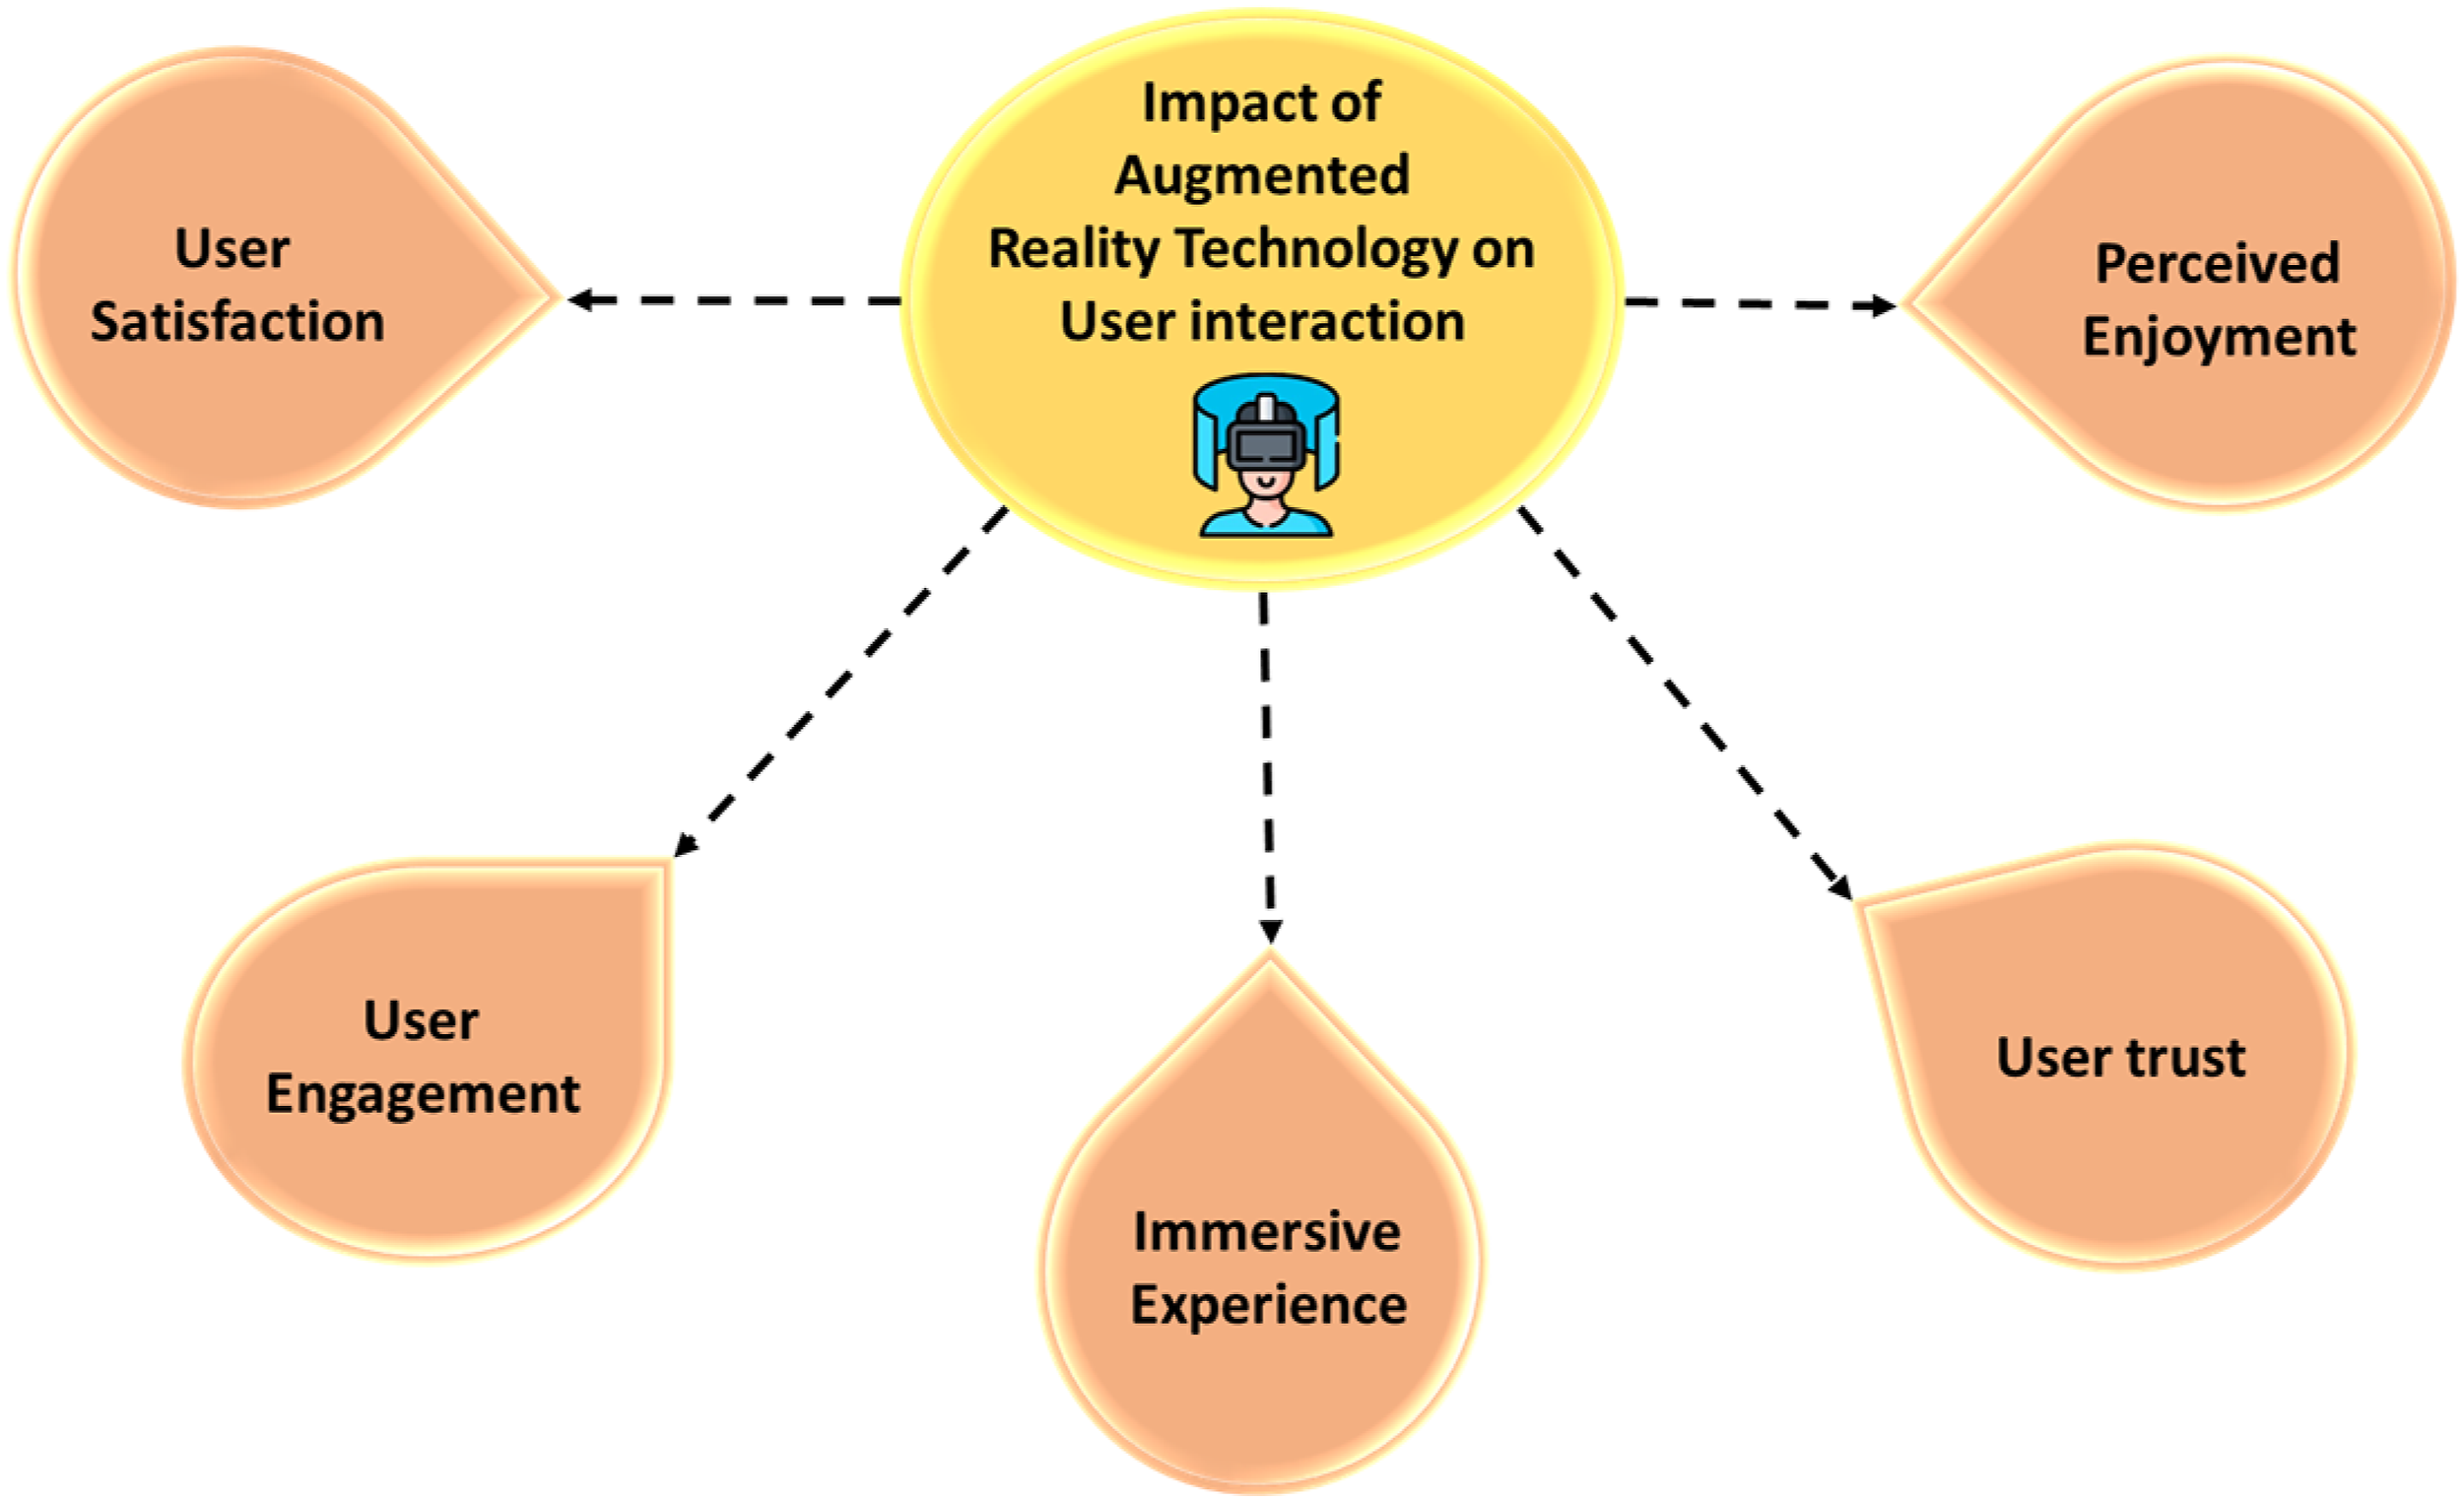
Its effect on user engagement in virtual media environments is anticipated to grow exponentially. With developments in AI, machine learning, and sensor technologies, the AR experience has become more immersive, intuitive, and accessible. The future will probably perceive AR incorporated academic systems. In the virtual age, augmented reality is a key factor in determining how consumers will connect, engage, and consume information. As AR technology grows more advanced, AR will also help users interact in a way that is more personal and relational with the content. 14 Furthermore, this technology and user’s preferred consumption patterns will not only redefine the nature of the consumer generated relationship but also fundamentally change the very nature of brand audience relations. In the long term, greater use of AR will transform user experiences in the dimension of entertainment, education, and marketing.
The main objective of this paper is to evaluate the performance of AR usage to interact with the digital media platform.
Related work
Augmented reality (AR) functions as a form of online advertising aimed at enhancing brand engagement, as explored in Ref. 15. AR is an innovative technology that allows users to interact with virtual elements within a real-world context by superimposing digital content. The findings indicate that AR can significantly boost customer engagement by offering a comprehensive and dynamic experience. This technology is particularly effective in the commercial and recreational sectors and is notably successful in appealing to younger consumers. The influence of interaction with objects, user-generated content (UGC), and virtual closeness on consumer participation was examined in Ref. 16. The researchers developed an environment termed hybridized virtual and augmented reality (HVAR), which enables users to engage with cultural traditions in both AR and virtual reality (VR). The experimental findings illuminate how user interaction occurs within HVAR contexts, particularly in the forthcoming hybrid reality settings characterized by multi-device connectivity. In Ref. 17, the study investigated AR that amalgamates virtual and real-world elements. Despite marketing evidence suggesting that AR is superior to other formats, existing research has yet to elucidate this advantage. Utilizing means-end chain theory, the authors identified specific properties of AR that confer advantages, aiding customers in achieving their objectives. These properties were subsequently organized into a practical framework in a later study, advancing the knowledge of augmented reality’s effects.
The relationship between customer satisfaction and the perceived quality of AR experiences, along with the mediating role of mindset, was explored in Ref. 18. The study found no correlation between perceived value and experience quality; it was among the first to investigate how reliability, presence, and relationship quality influence AR-generated experiences. Additionally, the findings underscored the importance of customer perceptions in service encounters and their impact on perceived service value. A methodical approach to creative customer interaction, allowing users to derive intrinsic satisfaction from AR-enabled innovation, was presented in Ref. 19. This development resulted from improved client engagement and a continuous moderation process linking AR use to customer interaction, creativity, and expected satisfaction. Utilizing regulation mode theory, the study uncovered a significant boundary condition contingent on client evaluation orientation, indicating new behavioral implications. In Ref. 20, the study assessed the impact of technological flexibility and increased realism in AR programs on consumer decision-making. Results demonstrated that augmented realism and technological mobility profoundly influenced customers’ flow experiences, contributing to heightened purchase intentions as well as emotional and cognitive responses to the brand and AR interface media. This research clarified the connections between an integrated shopping experience and various behavioral, emotional, and cognitive outcomes, thereby advancing theoretical understanding in online and interactive promotional studies utilizing AR.
The effect of users’ mental and emotional reactions to an AR retail assistant on purchasing decisions was explored in Ref. 21. The findings highlighted how brand perception and the perceived quality of information influence company engagement and purchase intent. This underscores that high-quality content remains crucial in all communication strategies, even within cutting-edge virtual reality shopping environments, as companies strive to capture consumers’ attention.
Research in Ref. 22 evaluated the relative advantages of AR over traditional online product presentations. A comparison was made between consumer responses to a smartphone app and a mobile website, resulting in the development of a customer engagement model. The findings revealed that emotional and cognitive responses to AR features accumulate to create behavioral outcomes. To maximize satisfaction, businesses should enhance system quality, product accuracy, and realism, as the sustainable success of AR applications is contingent upon pleasure and usability. The study in Ref. 23 investigated how consumers’ perceptions of the benefits and drawbacks of AR impact their purchasing experiences. By segmenting the audience based on their views and feelings toward AR as a shopping tool, the research identified specific factors contributing to these variations. Four distinct consumer groups emerged from this analysis, reflecting diverse attitudes toward AR in purchasing contexts. An evaluation of AR shopping within an online cosmetics store, offering an extensive range of products, was conducted in Ref. 24. This mixed-method analysis included demonstrations and focus group sessions, revealing that AR alleviates cognitive dissonance by improving perceived similarity and minimizing choice conflict. The findings indicate that AR is particularly beneficial in e-commerce settings featuring large selections of comparable products, assisting online retailers in boosting overall sales and margins.
The effect of authentic experiences on consumers’ perceived value, considering the mediating role of perceived ethics and consumer involvement, was examined using AR as a tool for creating genuine experiences in Ref. 25. While no significant connection was found between authentic experiences and the intent to share value, the results highlighted that AR fosters perceptions of authenticity. The authentic experiences generated by AR enhance customer engagement and ethical attitudes, subsequently increasing the willingness to co-create value. In Ref. 26, research evaluated how students interact with visual 3D components of augmented reality and its effect on information retention. This study assessed knowledge retention following AR engagement compared to instructional films presenting the same 3D content. Objective data from observations and video surveillance revealed similar interaction levels in both settings, with participants expressing a preference for the AR learning environment over the videos. The impact of various learning tools—including conventional textbooks, wearable augmented reality, and hybrid AR/VR materials—on secondary school students’ situational interest, participation, and educational efficacy was analyzed in Ref. 27. The results demonstrated that the AR/VR group surpassed the traditional educational group in situational engagement and learning effectiveness. In comparison to the other two groups, the AR/VR group’s level of engagement was significantly heightened. In Ref. 28, the effects of AR in a video game educational setting were examined. The study categorized the educational environment into AR and non-AR groups to understand the differential impacts of AR technology in science classrooms alongside the principles of game-based education. Experimental findings indicated that while AR does not negatively affect learning outcomes—despite imposing a higher cognitive burden—participants in AR environments did not show lower information acquisition compared to those in traditional settings. Furthermore, the research highlighted AR’s potential to enhance user engagement and motivation. The acceptance of AR technology among museum visitors was investigated in Ref. 29, utilizing the technological acceptance model (TAM) as a theoretical framework. The research clarified visitor behavior in virtual exhibitions, emphasizing the concepts of user satisfaction and the necessity of sociocultural mimetics when integrating TAM with virtual reality. The findings affirm that the incorporation of AR technology within museums presents substantial opportunities for the travel and tourism sector to recover from economic downturns.
Methodology
The comprehensive explanation of data collection, groups, questionnaire structure, and statistical analysis were explained in this section.
Data collection
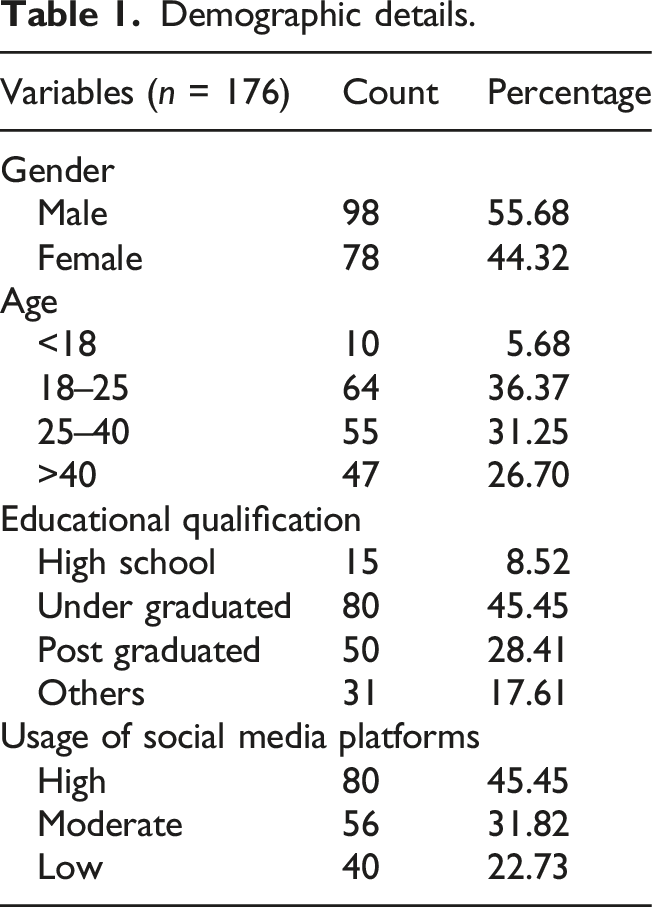
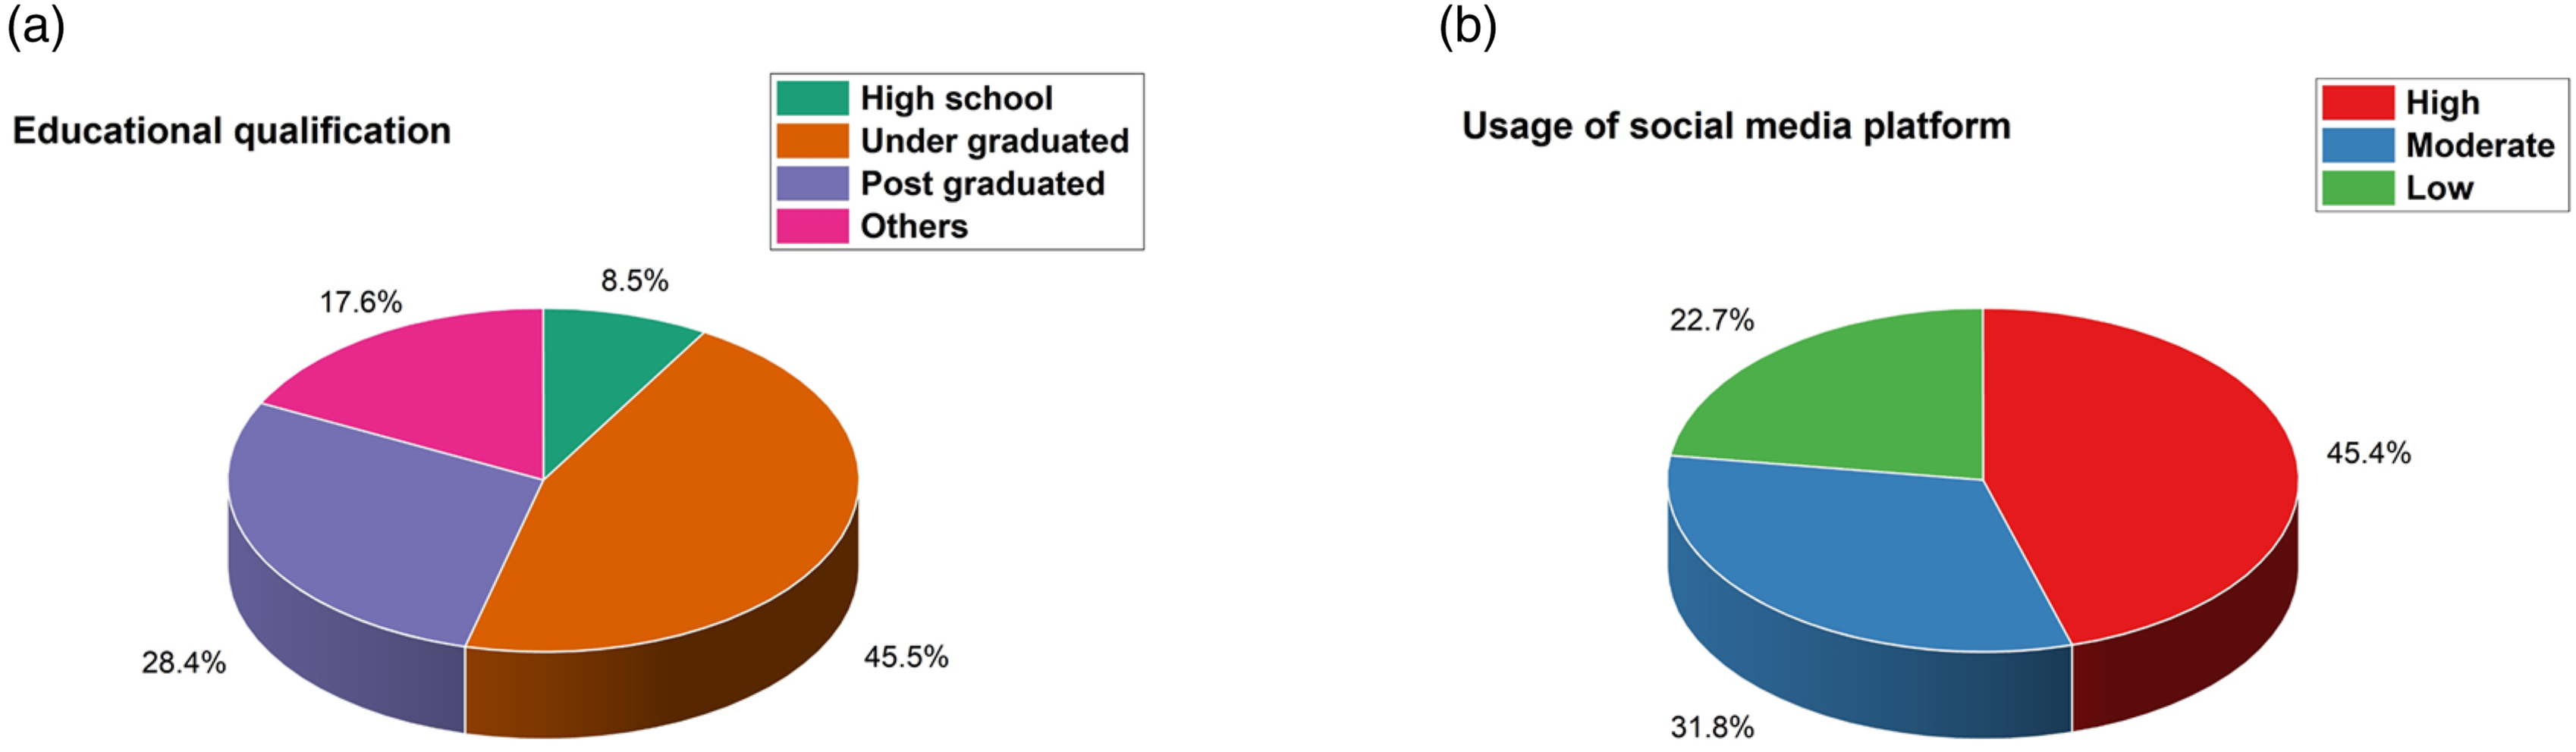
176 participants are used in this research and the demographic details, including age, gender, educational qualification, and social media platform usage, are represented in Table 1. Figure 2 displays the percentage of educational qualification and usage of social media. A total of 176 participants were separated into two groups, which included Group A and Group B. These two groups were used to evaluate. (1) Group A: It contains 88 participants and those who interact with the social media platform using AR. (2) Group B: This group also consists of 88 participants, who used traditional digital content to interact with the social media platform. Demographic details. Percentage of (a) educational qualification and (b) usage of social media.
Questionnaire structure
50 questions were distributed to both groups, covering factors such as user satisfaction, user experience, and engagement. The sample questions are as follows: • How well did the AR-enhanced content stand up to your expectations? • How simple was it to use the AR-enhanced content? • Comparing AR-enhanced media to conventional digital content, how pleased are you with your experience? • How engaging was the augmented reality experience for you? • To what extent was the information in the AR medium comprehensible and clear? • When dealing with the AR-enhanced media, how involved were you? • Regarding AR-enhanced media, how pleased are you with your experience in comparison to conventional digital content? • In the future, how inclined are you to engage with AR-enhanced media? • How likely are you to tell others about your experience? • To what extent would you suggest AR-enhanced media to friends or coworkers? • In comparison to previous digital content you have utilized, what depth did you find in the AR-enhanced media? • How pleased are you with the degree of customization or personalization that the AR content offers? • To what extent did the augmented reality information improve your comprehension or interaction with the brand or product? • How much of an impact did the AR-enhanced media have on your choices or purchases? • How easy and fluid was it for you to use the AR features on various devices (such as a tablet or smartphone)?
Likert scale
A 5-point Likert scale was used to measure the responses from the participants and it is one of the psychometric scales that are so frequently used to measure attitudes, opinions, or perceptions within the frame of surveys on the basis of five ordered response categories. “Highly disagree” to “highly agree” is a scale that is occasionally used to allow participants to indicate how much they support or oppose an idea. It is a handy and useful method for the measurement of perceptive variables and overall attitudes people bear in mind. While the scale measure captures the subject’s degree of agreement or disagreement or lack of it, the results obtained are ordinal data that is suitable for statistical analysis. Such a 5-point structure facilitates response while also guaranteeing sufficient variation to identify meaningful patterns.
Statistical analysis
The SPSS program was used to analyze the data for the research. To assess the performance of AR, descriptive, chi-square, t-test, Pearson correlation, and the one-way ANOVA are employed.
Descriptive analysis
This evaluation includes summarizing and organizing data to realize its basic characteristics. It presents simple summaries of the pattern and the measures, such as method, medians, modes, and standard deviations. This form of evaluation allows one to become aware of patterns, developments, and anomalies within the data. Visual tools like graphs and charts regularly accompany descriptive statistics to improve understanding.
t-test
A statistical technique for analyzing two groups’ approaches to observe if there might be a significant difference between them is the t-test. It evaluates whether the located differences in the sample manner are more than what might be expected via random chance. t-tests can compare two exclusive groups or evaluate two related groups. This approach is extensively used in hypothesis testing across various fields.
One-way ANOVA
It is a statistical approach used to compare the way of three or more independent groups to decide if at least one group is significantly different from others. It assesses the effect of a single express independent group on a nonstop established variable. The evaluation calculates an F-statistic that is the ratio of the variance between group methods to the variance within the corporations.
Pearson correlation
The strength and trajectory of the linear connection between two nonstop variables can be measured by this statistical degree. A value of one indicates a perfect correlation, a value of less than one indicates an ideal negative correlation, and a value of zero indicates no linear connection. A positive belief indicates that when one variable increases, another continues to expand, while a value that is negative suggests the opposite.
Chi-square
This analysis was used to determine if there may be a positive connection among the groups. It assesses how expected frequencies of occurrences compare to discovered frequencies in a contingency table. A chi-square data, which quantifies the difference between the calculated and predicted frequency ranges, is computed by the test. A better chi-square value suggests an extra difference among those frequencies, denoting a capacity dating between the variables.
Result and discussion
The responses are gathered from both groups and are evaluated using a t-test, chi-square descriptive analysis, Pearson correlation, and one-way ANOVA.
Descriptive analysis
Outcome of descriptive analysis.
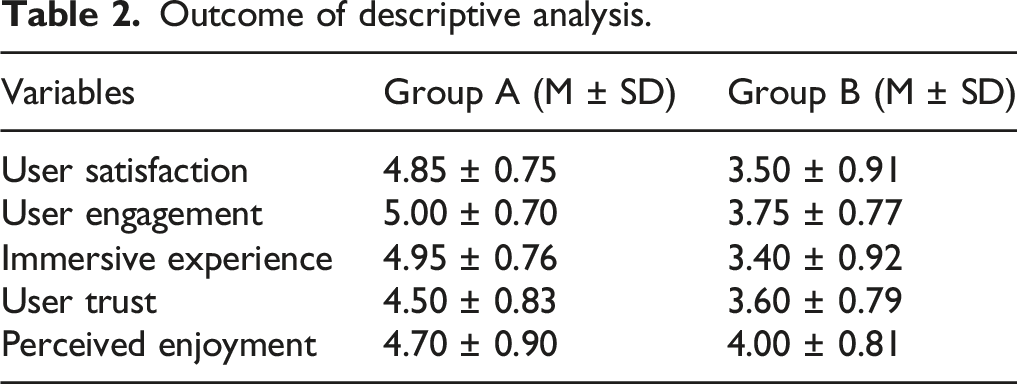
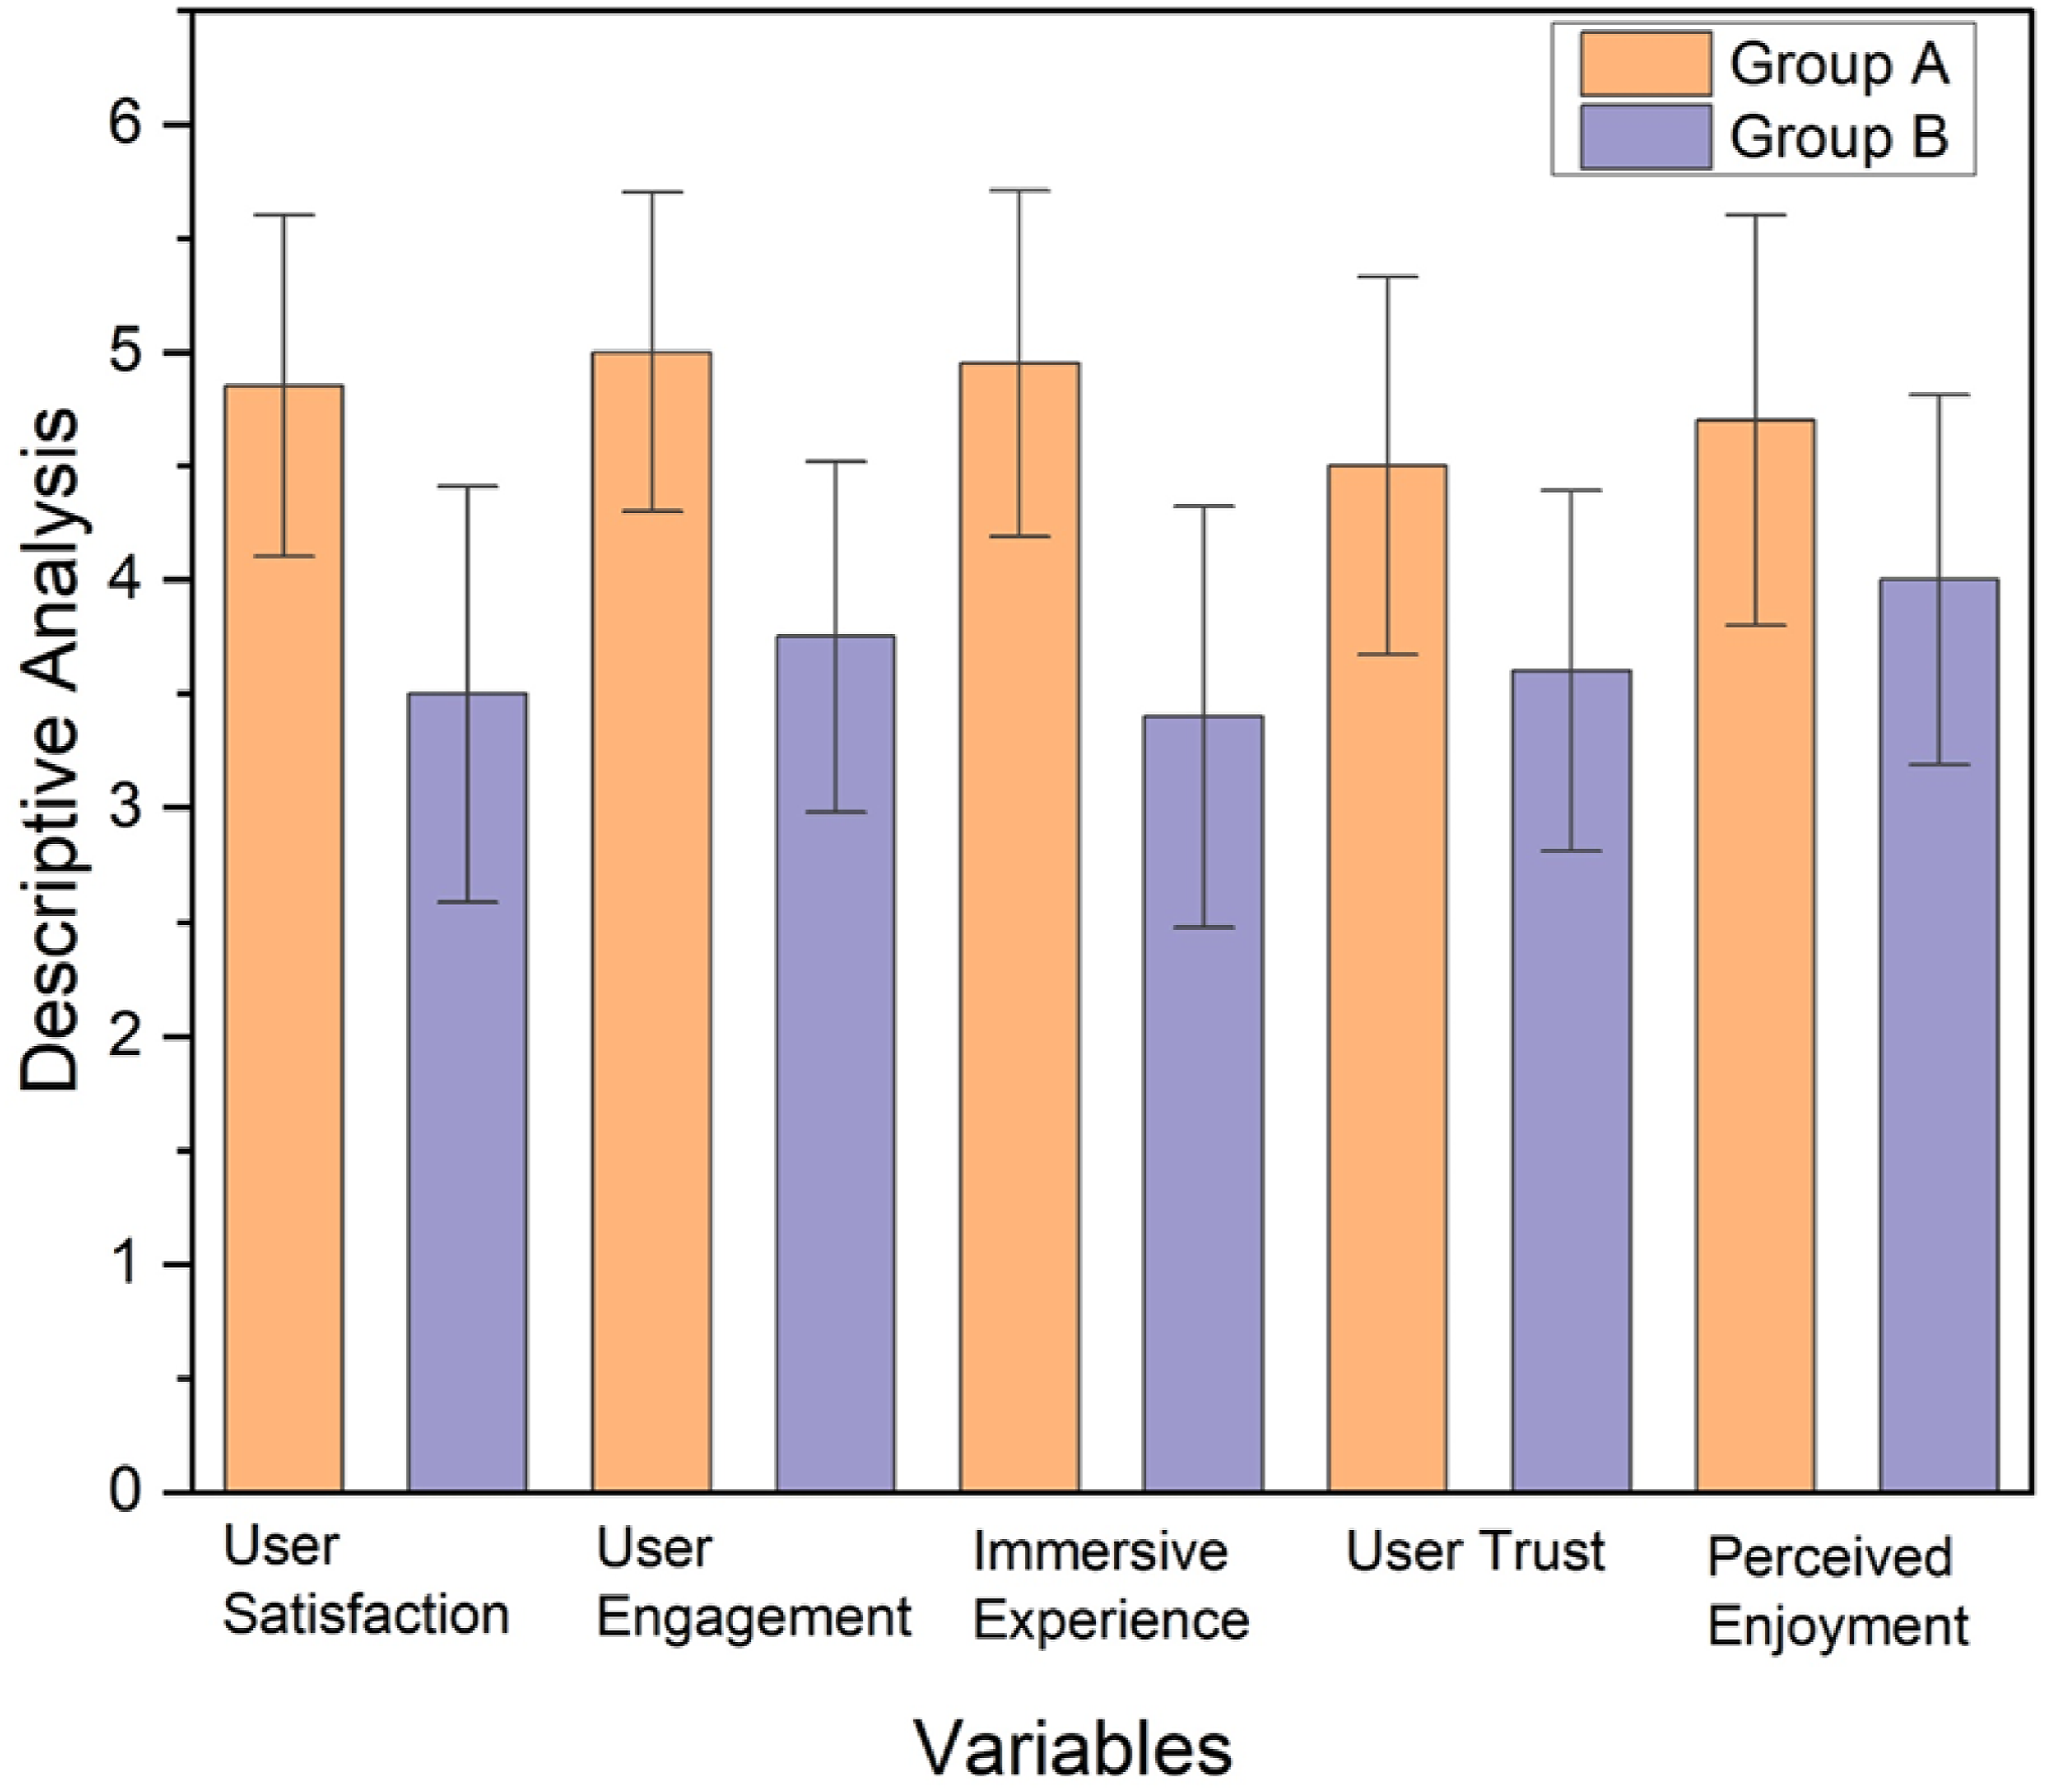
Outcome of descriptive analysis.
The standard deviations reveal a more consistent response in Group A, highlighting the reliability of AR-enhanced experience in user engagement. According to the findings, Group A, which interacts with social media platforms using AR, has better performance than others.
One-way ANOVA
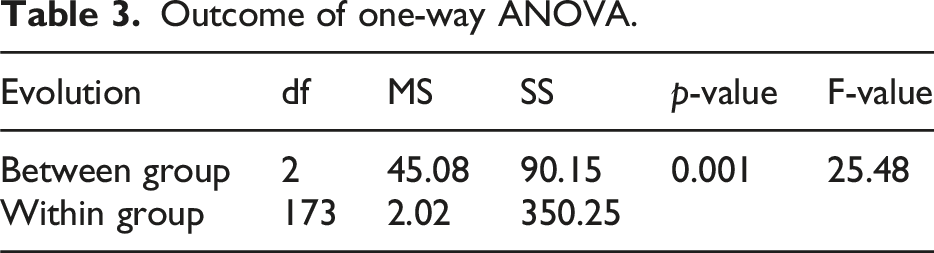
The one-way ANOVA (Analysis of Variance) is a statistical method used to test whether there are significant differences between the means of three or more independent groups. In this study, the ANOVA was employed to determine if user experience variables differed between Group A (AR-enhanced media) and Group B (traditional media). The resulting F-value represents the ratio of variance between the groups to variance within the groups; a significant F-value suggests that at least one group mean significantly differs from the others.
Outcome of one-way ANOVA.
Pearson correlational
Outcome of Pearson correlation.
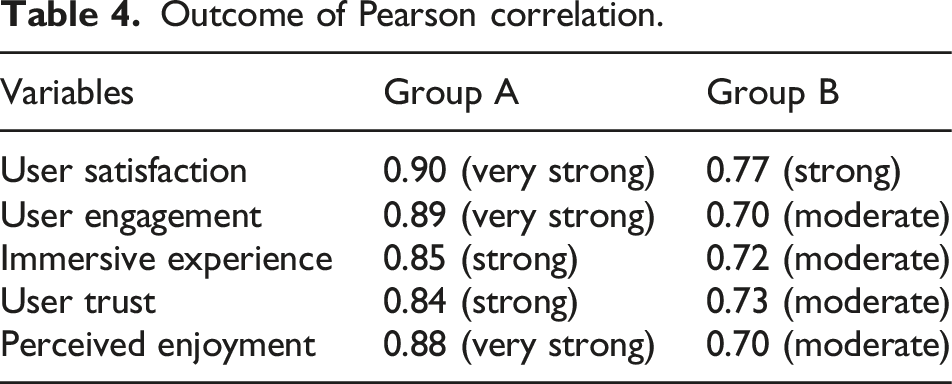
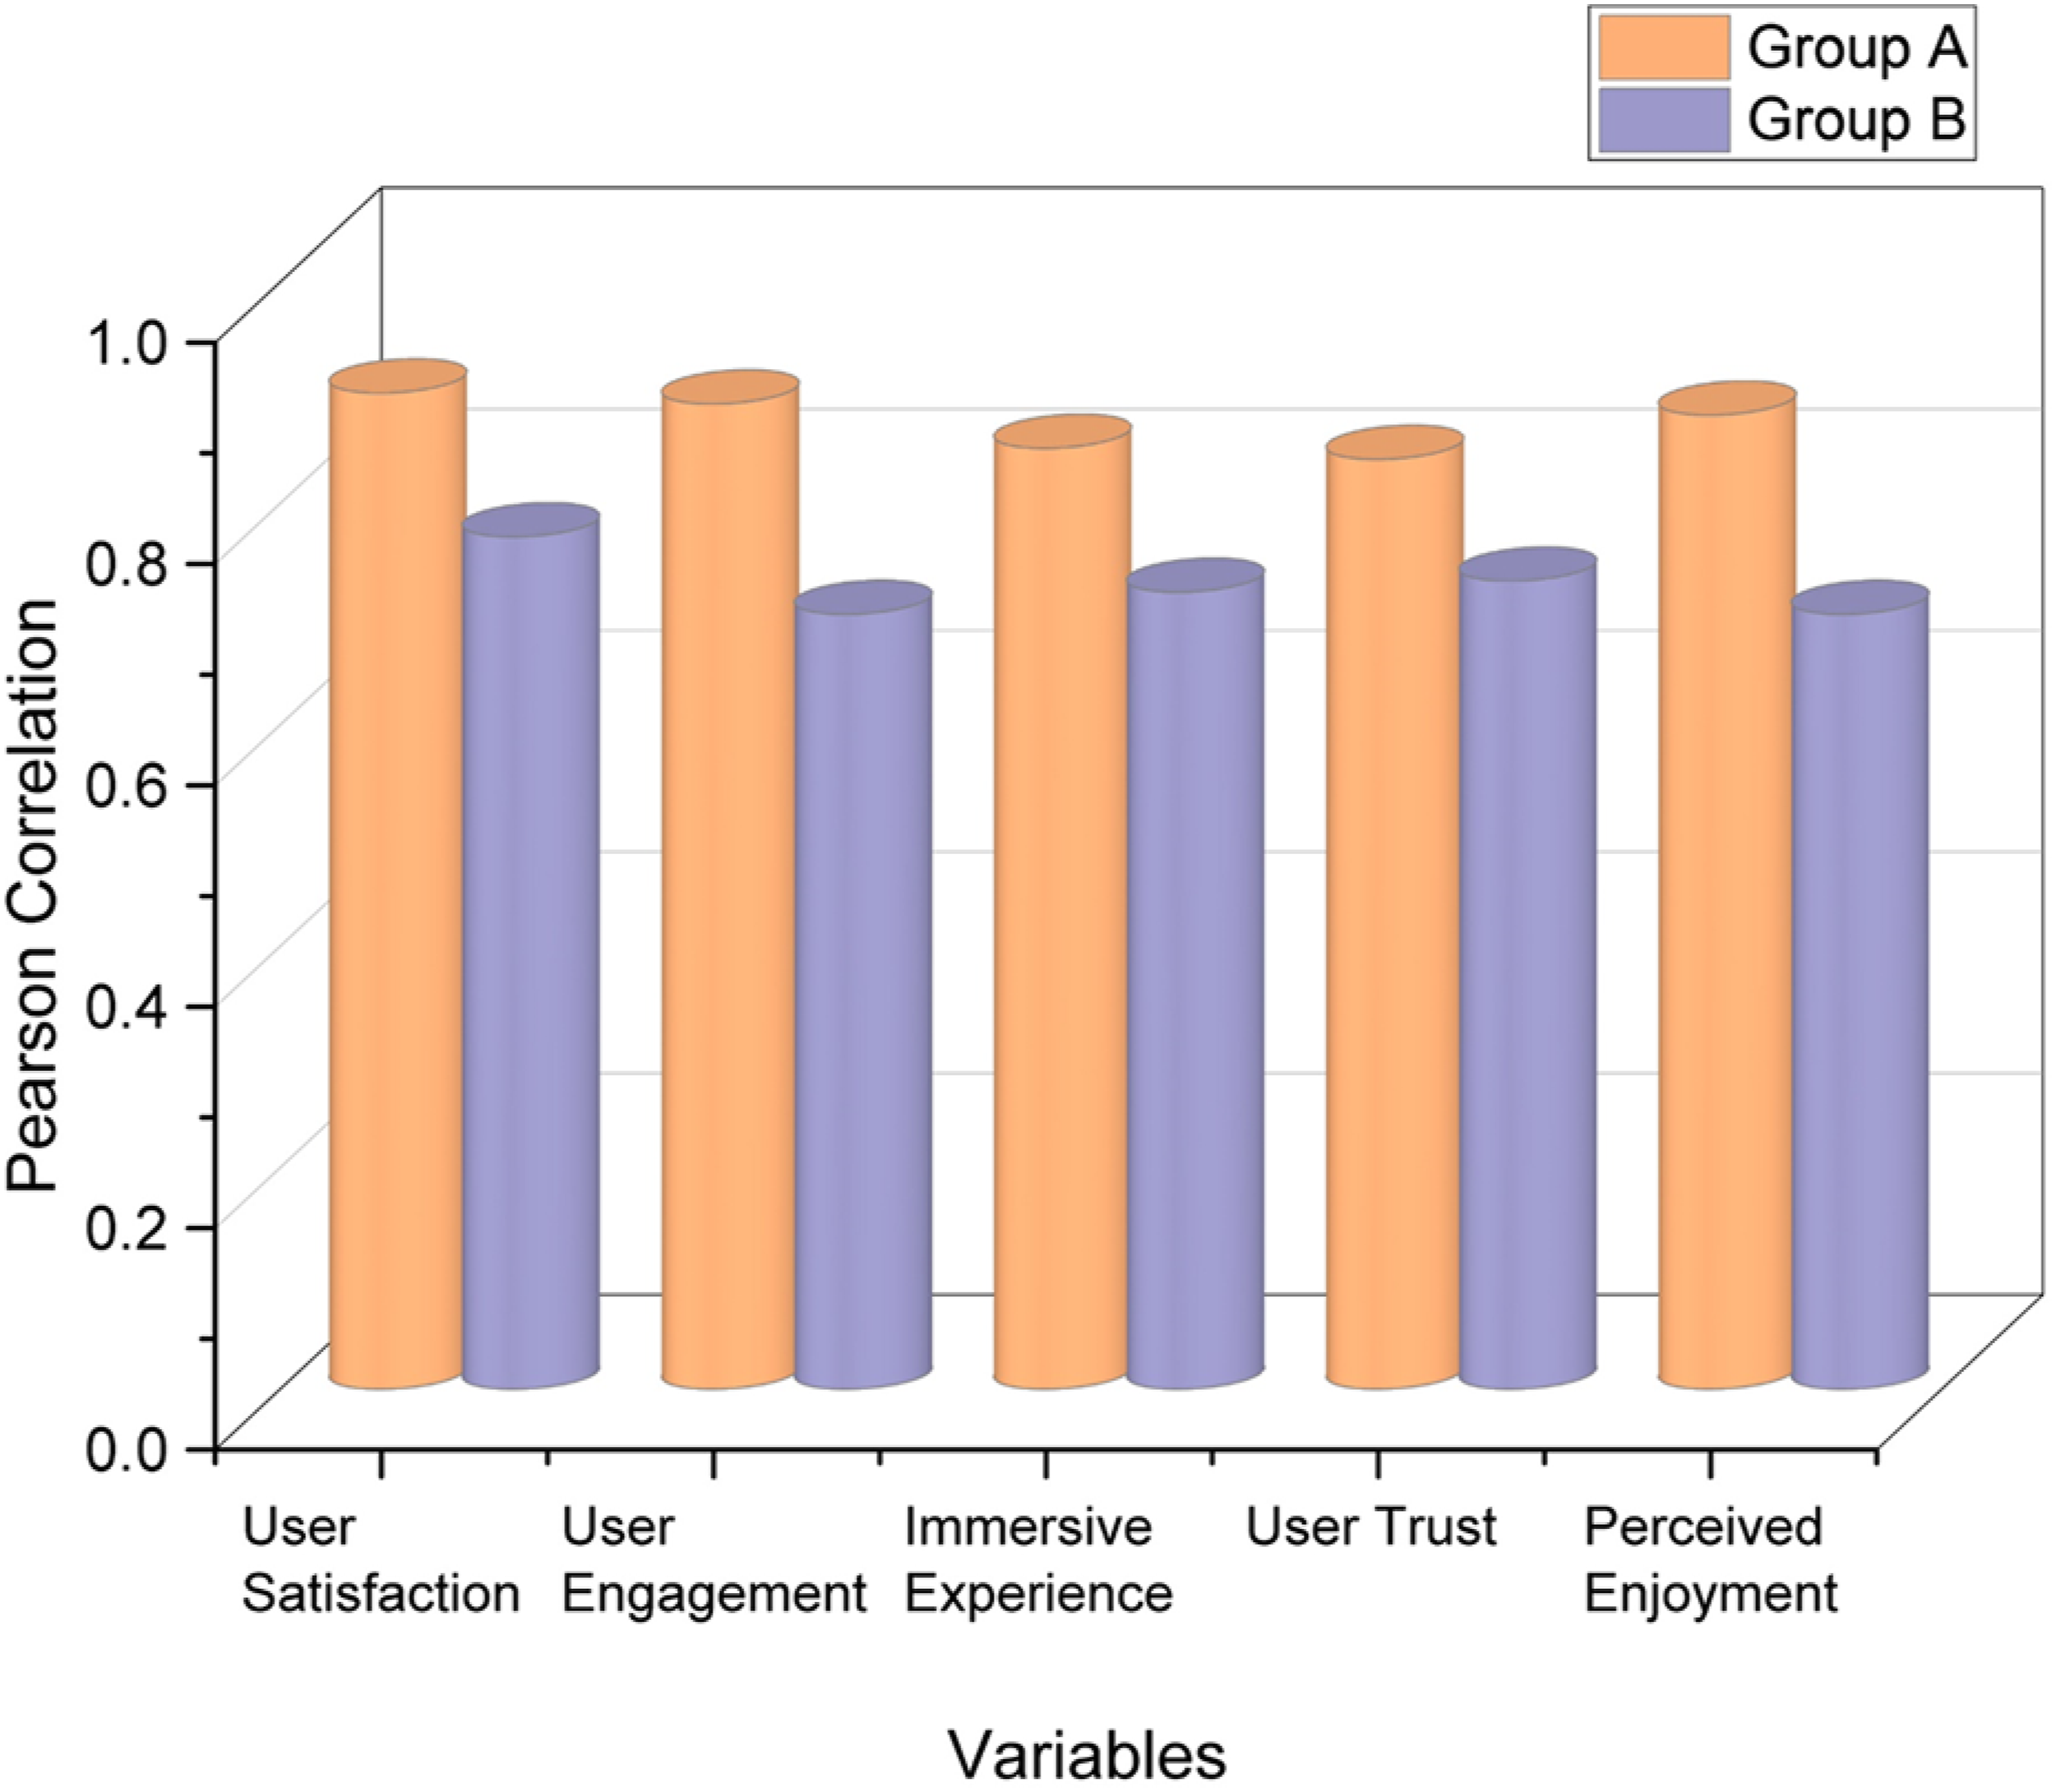
Outcome of Pearson correlation.
Group A has superior performance in all variables and helps to enhance user engagement than Group B, which interacts using traditional media.
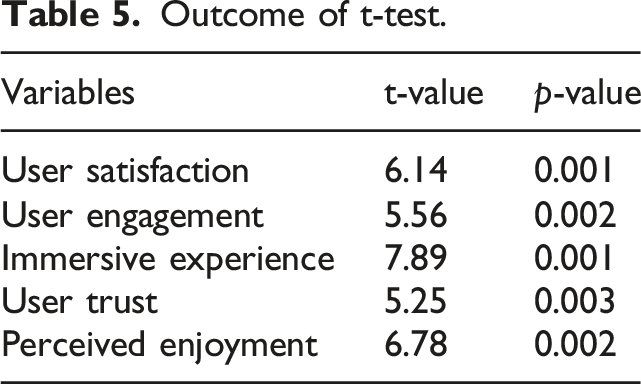
t-test
The t-test is a statistical analysis utilized to compare the means of two groups to ascertain if they are significantly different from one another. This technique helps establish whether the observed differences in user experience between Group A and Group B are not due to random chance. A p-value below a predetermined significance level (e.g., 0.05) indicates that the differences are statistically significant.
Outcome of t-test.
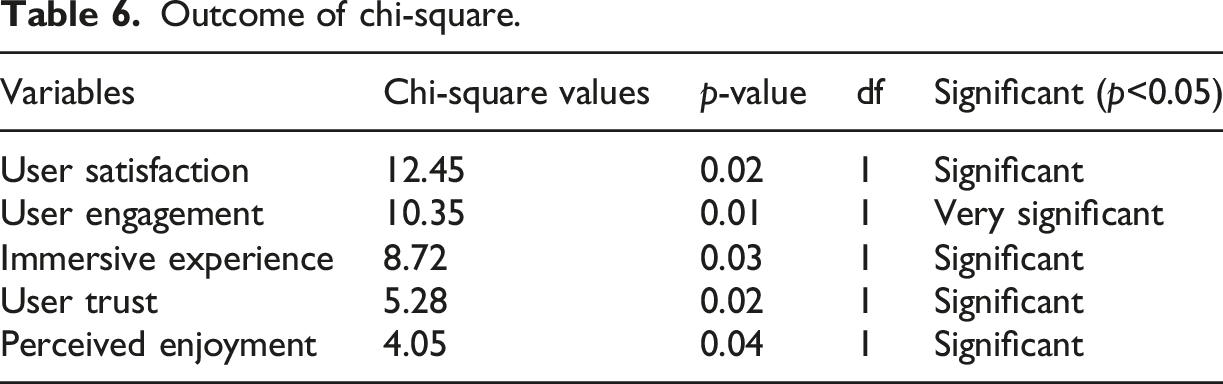
Chi-square
Outcome of chi-square.
Discussion
The descriptive analysis, one-way ANOVA, Pearson correlation, chi-square, and t-test results provide a comprehensive comparison between Group A (AR-enhanced media users) and Group B (traditional digital media users) across five key user experience variables: The constructs include user satisfaction, user engagement, user trust, immersive experience, and perceived enjoyment. The results illustrated that Group A surpassed Group B in all the variables with larger means of the variables, where the means of user satisfaction were 4.85, the immersive experience 4.95, and the engagement 5.00. This suggests that AR technology improves the interaction of the end-users by augmenting the scenario with more feedback and engagement. Group B, who used traditional digital content, scored a lower mean on all the aspects, except for perceived enjoyment, 4.00, which is a little close to Group A. This means that while traditional media may indeed provide entertainment, it does not foster the kind of interaction and build the levels of trust, which is achieved by using AR technology. The one-way ANOVA also supported this by giving a large between group sum of squares that was equal to 9.15 and a within group variance of 350.25. Therefore, the analytically derived F-value of 25.48 and a
The analysis of Group A has also shown the variables are positively correlated; user satisfaction is positively highly correlated to engagement (0.90); engagement is positively highly correlated to the power of AR to successfully engage users (0.89). Likewise, credibility perceived by users (0.84) and presence (0.85) infer the effectiveness of AR in increasing emotional and cognitive attentiveness. Group B has shown somewhat different results indicating that traditional media may not incite much of users’ engagement or their perceived level of trust, with engagement recording having a correlation coefficient of 0.77, and perceived enjoyment correlating at 0.70. t-tests conducted to establish the significance of the results also supported the information observed by achieving significance levels at
Conclusion
In this paper, AR technology’s impact on user engagement and interaction within digital media environments was investigated. The 176 individuals were divided into two groups (Group A and Group B), each consisting of 88 participants. Group A participants interact the social media with AR and Group B participants interact with traditional digital content. Descriptive analysis, Pearson correlation, one-way ANOVA, chi-square, and t-test were employed to evaluate the groups. As a result, AR (group A) enhanced the user experience compared to more traditional digital media. Regarding user satisfaction level, the group that interacted with AR got a higher mean score of 4.85 than the group without interaction with AR, which got a mean score of 3.50 on the same parameter. In terms of immersive experience, the group that was in interaction with AR got a mean score of 4.95, while the non-AR group got a mean score of 3.40 in the parameter of engagement. The obtained F-value of 25.48, p < 0.001, also supports the proposition that AR has a significant impact on user engagement, trust, and satisfaction, along with the high value of Pearson correlation coefficient of 0.90 for user satisfaction and 0.89 for engagement in Group A. The chi-square analysis suggests that groups differ, with Group A exhibiting greater user satisfaction (12.45), p = 0.02 with the AR-enhanced media and engagement (10.35), p = 0.01, immersion (8.72), p = 0.03, trust (5.28), p = 0.02, and perceived enjoyment (4.05), p = 0.04 and according to the findings, Group A is superior to Group B.
Limitation and future scope
A significant constraint of this study is its incredibly small population size, which won’t absolutely constitute the diversity of digital media users. Furthermore, the observation focuses on short-term user interactions, missing insight into the long-term outcomes of AR in user engagement. To bolster future research, we encourage exploring longitudinal studies that could investigate how the repeated exposure to AR experiences influences user engagement and interaction over time. Understanding the evolution of user experiences and the potential for sustained engagement could provide a deeper understanding of the long-term impacts of AR technology. The reliance on self-report via surveys may also introduce bias, as users may not accurately reflect their true reports. This opens avenues for future research into the broader application of AR in diverse digital media environments, which include e-commerce, education, and entertainment.
Statements and declarations
Footnotes
Conflicting interest
The author(s) declared no potential conflicts of interest with respect to the research, authorship, and/or publication of this article.
Funding
The author(s) disclosed receipt of the following financial support for the research, authorship, and/or publication of this article: This research was funded by Network Ecological Chain of Digital Creative Industry, grant number CCIT2021STIT020102.