
Abstract
The basis for societal progress and development is the caliber of people training provided by colleges and universities. In the context of the development of agricultural modernization, a key assurance for fostering the growth of agricultural modernization is the caliber of the staff training provided in agricultural colleges and universities. At present, the existing evaluation models for the quality of personnel education in agricultural universities have defects such as low efficiency in data processing and long running time. Therefore, to better judge the training quality of agricultural graduates in colleges and universities, the study proposes to use the random forest algorithm to build an evaluation method for the quality of agricultural talent training, and on this basis, use the TRRF algorithm to improve it. At the same time, to weight the data, the F-measure assessment method is applied. In this way, the effectiveness of the evaluation model can be improved. The experimental findings demonstrate that the F-TRRF model suggested in the study has 99.17% accuracy when evaluating the standard of agricultural staff training. Therefore, the random forest evaluation model integrated with F-measure suggested in the study has a high level of precision in evaluating the training quality of agricultural talents, which can effectively meet the actual needs of talent evaluation, provide a basis for cultivating more and higher quality agricultural talents, and provide reference opinions on talent cultivation.
Keywords
Introduction
With education’s ongoing evolution, changing the way of higher education works continues to deepen. Enhancing the standard of personnel training is the top priority for optimizing the structure of higher education and improving the level of running schools and social service capabilities of colleges and universities. 1 “Sannong” occupies an important position in China’s socialist modernization drive, and cultivating more high-quality agricultural talents is the core and key to solving the “three rural” issues.2,3 At present, the quantity of agricultural professional personnel training in China cannot fulfill the real requirements of social progress. There are many defects in the existing methods in the process of assessing the level of agricultural personnel education.4,5 There is a relative lack of specialized talent evaluation methods, especially in the agricultural field, where the evaluation content is complex and the evaluation process is difficult to measure. In addition, existing evaluation indicators cannot objectively reflect the problems that universities face in talent cultivation. Therefore, to raise the standard of agricultural students training at universities, the study aims to assess how well agricultural students are trained at universities, and analyze the problems in the process of agricultural personnel training through the evaluation results. As one of the integrated learning algorithms, random forest (RF) is often used to solve data classification and regression tasks. In terms of generalization power, classification impact, and noise tolerance, the method performs well. The study uses the RF to construct an evaluation model to assess the quality of agricultural talent training and to improve the model by using the TRRF algorithm to solve the problems. Meanwhile, the data characteristics are weighted by using the F-measure. F-measure, as a metric that combines recall and precision, has been widely used in binary classification, multi-label classification, and even in structured output prediction. The larger the F-measure value, the better the performance of the classifier. The main method for classifying imbalanced data is to design optimized algorithms for F-measure evaluation criteria, or design corresponding algorithms based on processed sample data. The F-measure is used to weight the data features. An improved RF agriculture talent quality evaluation model based on F-measure weighting is constructed (F-TRRF). It is hoped that the accurate evaluation of the quality of agricultural personnel training can be realized, and the quality and level of agricultural personnel training in universities can be improved.
The innovation of this article is as follows. The study uses RF algorithm to construct a quality evaluation method for agricultural talents. Then the TRRF algorithm is innovatively introduced to improve the RF, optimizing the quality evaluation method for agricultural talents.
Compared with traditional methods, the proposed method first designs a relatively objective and scientific talent quality evaluation index system. Secondly, in response to the shortcomings of traditional RF models in evaluation, the TRRF algorithm is introduced to optimize it, and F-measure is used to weight the data. The evaluation model obtained can effectively address the shortcomings of traditional methods in data feature extraction and classification during the application process.
Related works
The stochastic forest technique, one of the ensemble learning algorithms, is popular in many disciplines due to its high flexibility and effective fitting impact. Biici and Zeybek established a landslide susceptibility evaluation model based on self-organizing feature map network and RF model to explore the impact of evaluation unit and non-landslide sample selection methods on landslide susceptibility prediction. The outcomes demonstrate that the tissue feature map network’s prediction accuracy based on RF reaches 94.94%. This may significantly increase the RF model’s assessment accuracy and be used to choose non-landslide samples. 6 Cai et al. used the RF algorithm to figure out the pavement friction prediction model’s texturing parameters. The outcomes of the experiment demonstrate the prediction model’s efficacy and accuracy after introducing the RF algorithm are significantly improved, and at the same time, there are clearer judgments on low-speed friction and high-speed friction. 7 Chen et al. used the RF algorithm to build a regional bridge earthquake damage state assessment model to monitor the state of regional bridge structures. The findings indicate that the model’s assessment accuracy is greater than 90%, which provides guidance for the seismic design, disaster prevention and structural renovation of bridges. 8 Uhlenkott et al. used the RF algorithm to classify dengue fever patients with different severities, so as to help doctors diagnose and treat patients according to their condition. Experiments have proved that the method has excellent performance in predicting the clinical extent of dengue fever. 9 Yuchi et al. used the RF algorithm to model the indoor PM2.5 concentration to better analyze the indoor environment. Through experiments, this algorithm has a good effect in predicting indoor air quality. 10
Talents play a crucial role in the development of the society. Therefore, the talent cultivation is particularly prominent. As the cradle of talent cultivation, the core task of universities is to cultivate high-quality talents for social development. Luo and Stoeger pointed out that the high-quality skilled talents are the core of the increasingly fierce competition. In view of the current market needs, the reform of secondary vocational education should be actively promote, generate more highly qualified professionals and cater to the real requirements of social advancement. 11 Wang and Wei pointed out that it is vital to develop the scientific research system to increase the caliber of abilities, strengthen the teaching staff and establish a more reasonable talent quality evaluation plan for Chinese universities. 12 Hu et al. developed an assessment model for the cultivation of creative talents in colleges and universities after the epidemic in light of the pandemic’s effects on the development of talents in universities. Four first-level indicators of environment, teaching linkages, instructors, and students make up an assessment index system for the quality of creative and entrepreneurial abilities training in colleges and universities. The empirical findings demonstrate that this strategy may increase the model’s accuracy in evaluating talent training, and it has a specific reference value for that talent training in universities. 13 Zhang and Zhao used talent evaluation indicators to construct a corresponding skier talent evaluation model when selecting and evaluating skier talents. The outcomes demonstrated that the assessment model is valid and reliable for evaluating athletes. 14 Peng and Dai mainly used the teaching effect of fuzzy decision tree classroom to assess the quality of talents training. Through this model, we can comprehend its effects on talent quality and raise the standard of talent development. 15
To sum up, the RF algorithm has relatively mature applications in the fields of mathematics, engineering, and medical treatment. This algorithm has unique advantages in the process of data classification. According to studies on talent quality assessment, the research in this area mainly focuses on the improvement of talent quality, but there are few related studies on how to evaluate talent quality effectively and reasonably. Therefore, the study combines RF to build a RF-based agricultural talent quality evaluation model, hoping to improve the quality of the effect of agricultural talent quality training and continuously improve the talent training program.
Construction of evaluation model for agricultural talent quality based on the RF algorithm of F-measure
Construction of agricultural talent quality evaluation indicators
Evaluation index system of agricultural talent quality.
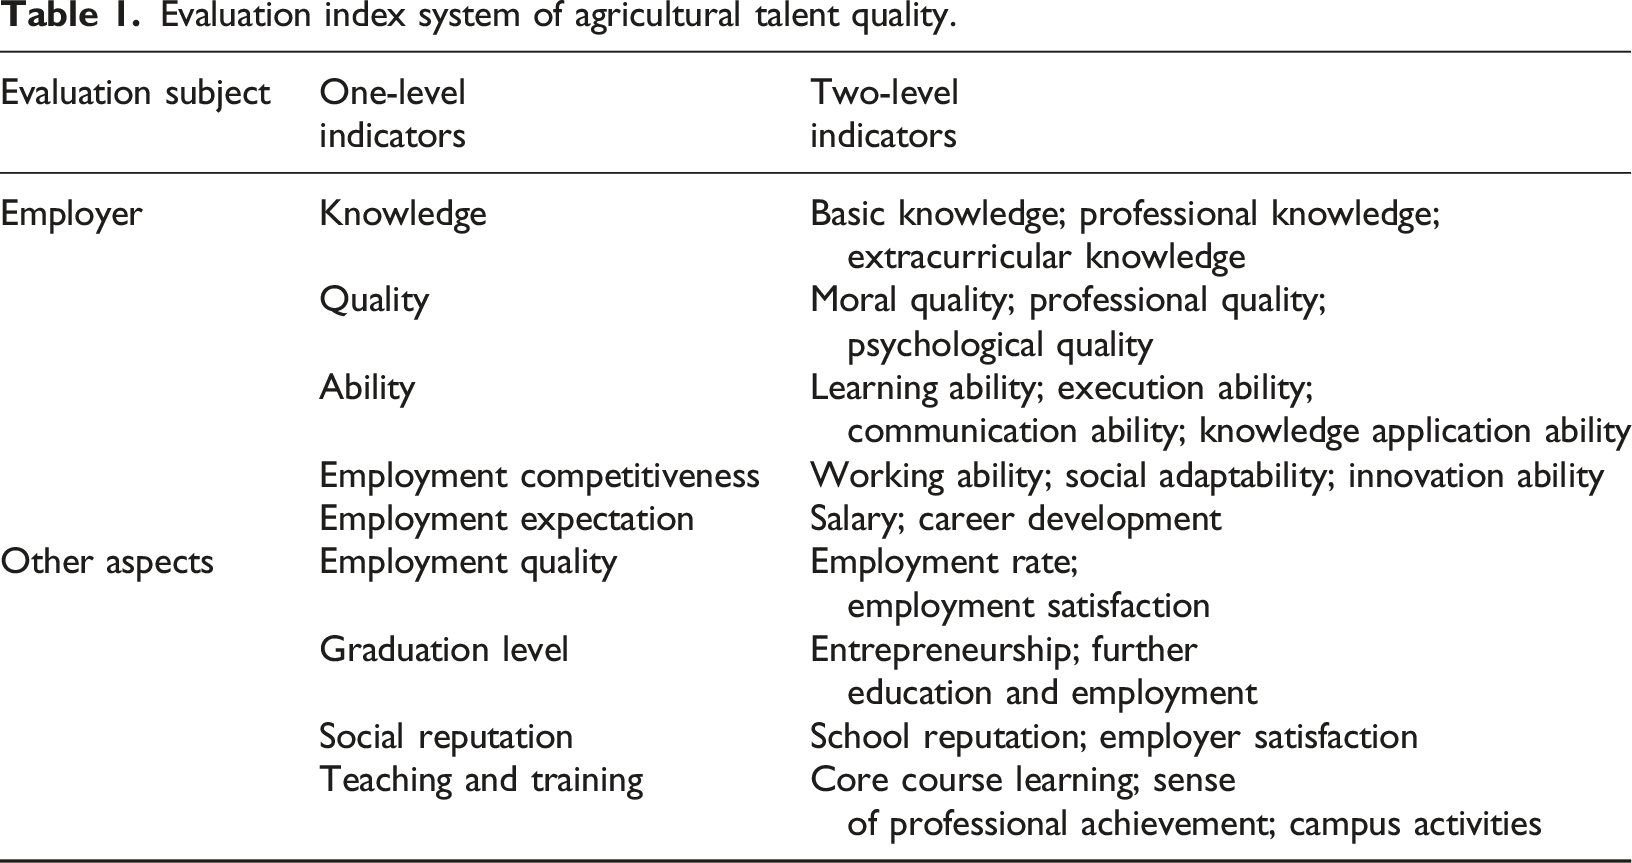
The evaluation subjects mentioned in Table 1 include employers and other evaluation subjects, among which the other subjects mainly include some social institutions and universities. The first-level indicators include the knowledge, quality, ability, employment competitiveness, employment expectation, employment quality, graduate level, social reputation, and teaching and training of the evaluation object.
In practical work, a solid and professional level of theoretical knowledge is the foundation for completing work. At the same time, good extracurricular knowledge is also indispensable, such as proficiency in quantity calculation and operation, good language communication skills, etc., which are essential knowledge in practical work. Therefore, knowledge level evaluation includes basic knowledge, professional knowledge, and extracurricular knowledge. Personal qualities can reflect a graduate’s comprehensive abilities, including moral qualities, professional quality, and psychological qualities are reflected in various aspects such as interpersonal communication, daily communication, and work execution. The professional skills of graduates are the basic skills they need to cultivate to adapt to future job positions, including learning ability, execution ability, communication skills, knowledge application ability, etc. Employment competitiveness refers to the potential and ability of individuals to obtain job opportunities in the job market, including intrinsic vocational and professional skills, as well as the influence of external factors such as society, family, and learning. Employment expectations refer to the comprehensive reflection of the job positions, employment areas, and salary standards that graduates hope to obtain, as well as whether they can be respected by colleagues and valued by leaders, and whether their abilities and strengths can be utilized. The quality of employment mainly refers to the satisfaction of graduates with the job they are currently engaged in, including work environment, benefits, promotion, etc., which can effectively reflect the quality of talent cultivation in universities. The higher the employment satisfaction of graduates, the higher the recognition of the talent training model of universities in society. The graduate level mainly refers to their future choices, including further education, employment, and entrepreneurship. Social reputation is reflected in the credibility of the graduating school and the evaluation of its employees by employers. Teaching and training abilities are reflected in the core course learning, sense of professional achievement, campus activities, etc.
Both the first- and second-level indications selected above are evaluation indicators determined after the comprehensive judgment of agricultural talents, which can reflect the quality of agricultural talents in a relatively comprehensive, intuitive, and scientific way. The above index system will be used to build the agricultural talent quality evaluation model.
Construction of evaluation model for agricultural talent quality based on RF algorithm
The RF algorithm is a simple, flexible, and easy to operate machine learning method. It can produce excellent results in most cases, which is widely used in data classification and regression tasks. Given its advantages in data classification processing, this study chooses it as the algorithm for this article. RF is a typical algorithm in the bagging type of integrated learning algorithm, and it is a combination classifier. The classification basis is the decision tree (DT). A DT is a tree model that contains three different nodes, namely, the root node, intermediate nodes, and leaf nodes. The object’s attributes are represented by the nodes, the branched paths between them by the potential values of those attributes, and the values of those attributes, in turn, are represented by the leaf nodes.17,18 There are multiple independent CART DT combinations in RF. CART is an algorithm that takes the value of a split property, splits it in half, and then uses each half to categorize the results. Figure 1 depicts the specific process. Schematic diagram of decision tree.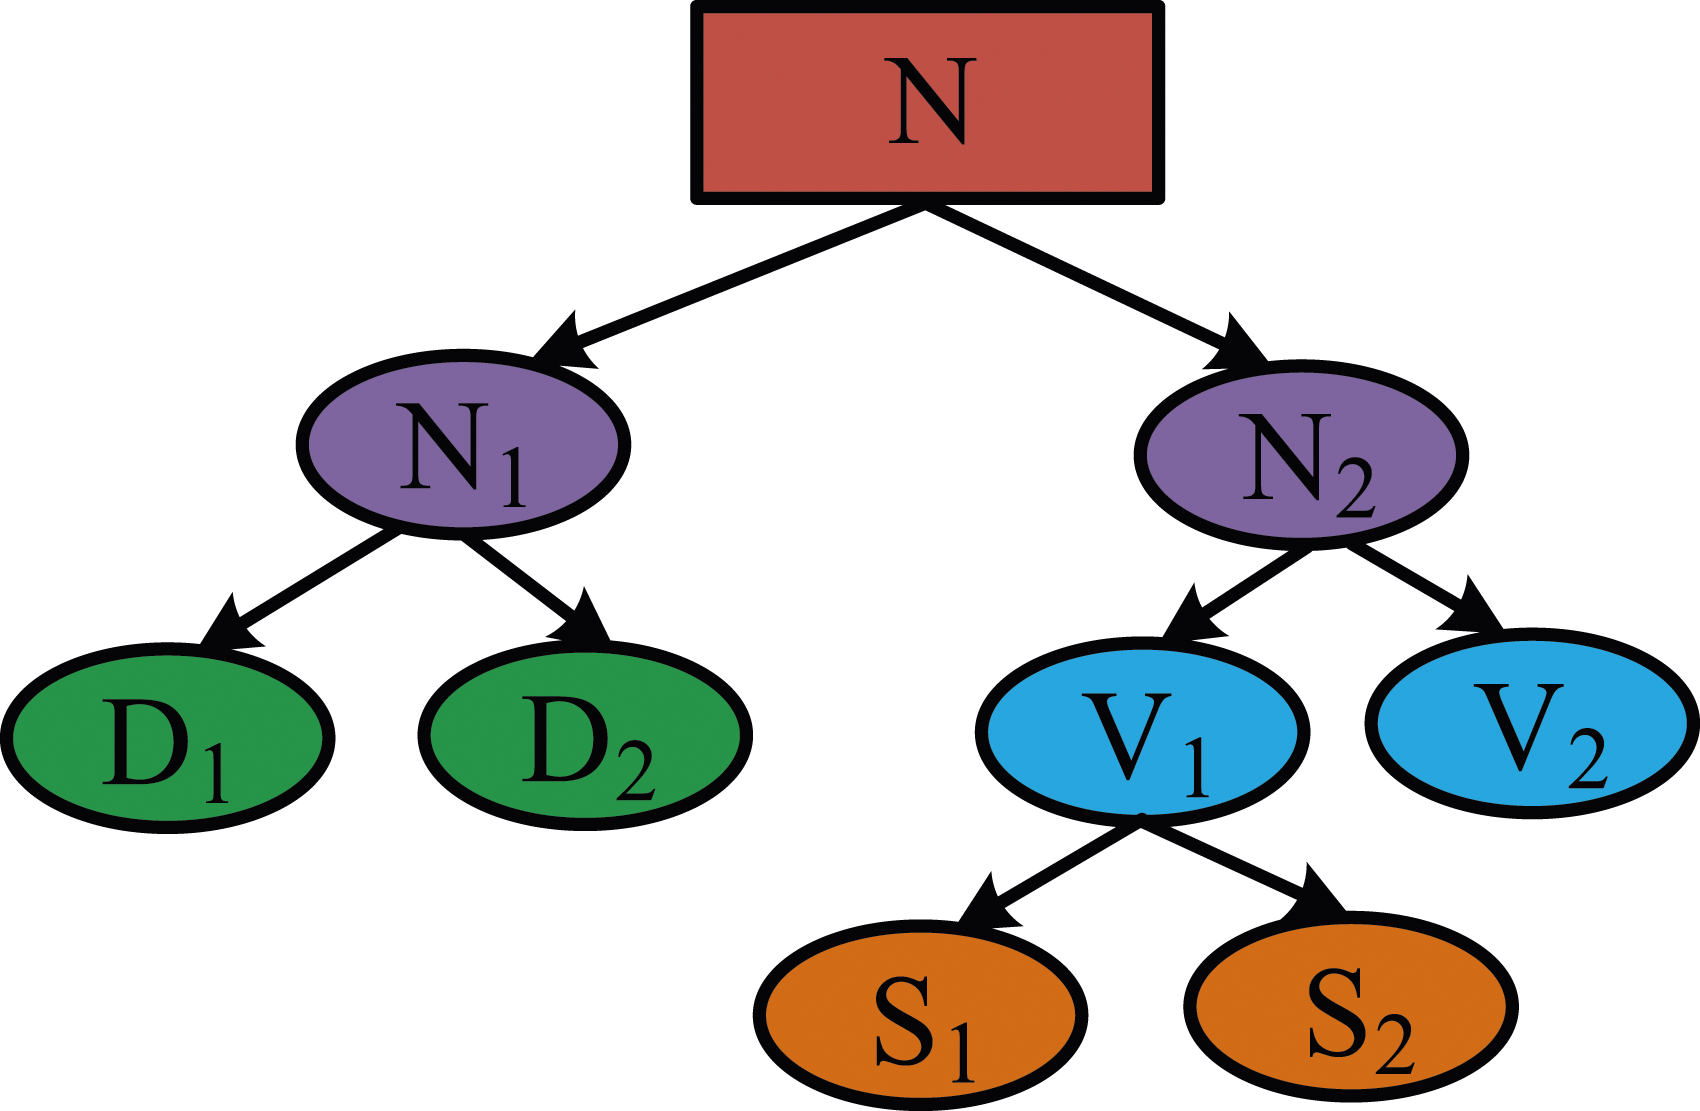
In Figure 1, N represents the total number of samples. N1 and N2 represent the two actual categories outputted from N. D1 and D2 represent the two actual categories output from N1. V1 and V2 represent two categories classified from N2. S1 and S2 represent two categories classified from V1. The current training set is divided in half using the binary recursion approach based on the Gini index calculated from the training set, thereby generating subtrees with two branches on the left and right. The Gini metric is utilized by the algorithm to measure data partitioning when a node splits.19,20 Its calculation process is shown in Formula (1).
In Formula (1), 
In Formula (2), 
In Formula (3), when the sample 
After the classification results are obtained, the results of each decision tree are counted. The final regression result will then be the average of all the forecast findings, as shown in Formula (5).
In Formula (5), Flow diagram of random forest algorithm.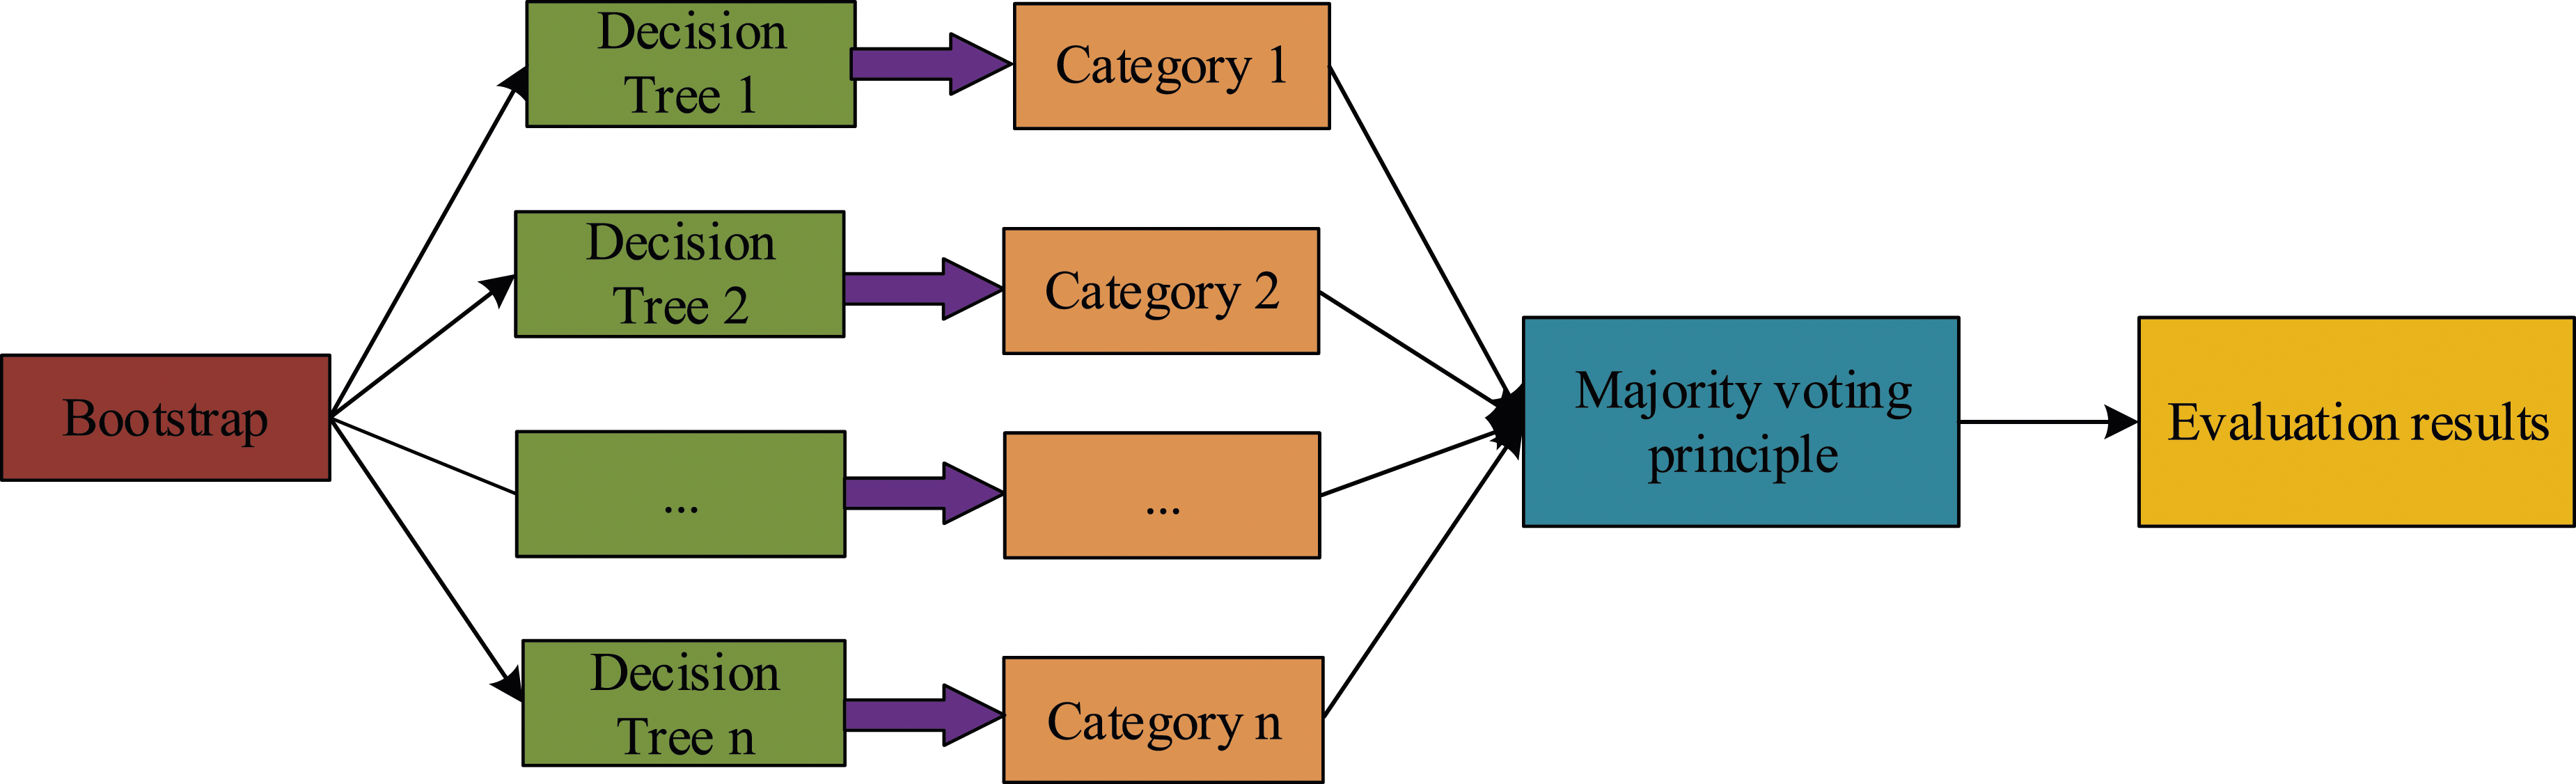
In RF, 
In Formula (6), 
In Formula (7), 
In Formula (8), 
In Formula (9), 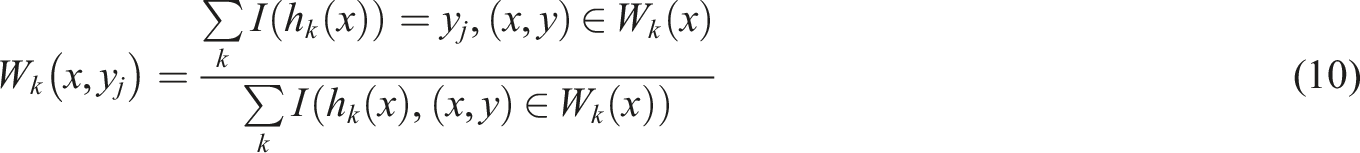
In Formula (10), the numerator represents the sum of each decision tree and the number of correct classifications corresponding to the data set that has not been extracted, and the denominator represents the total of the number of data set samples that has not been extracted.
Construction of agricultural talent quality evaluation model based on improved RF algorithm
Although RF has significant advantages in data processing, for some noisy classification data, RF is prone to overfitting during training. At the same time, different data attributes can also affect the classification performance of RF. Therefore, based on the RF algorithm, the trees reduction random forest (TRRF) algorithm is used to improve the RF algorithm. The number of DTs in RF is simplified by the method of classification precision of the DT and the similarity between the DTs, and the DTs with higher quality are extracted to form a new random sub-forest, so as to enhance the model’s performance.23,24 Figure 3 depicts the modified RF algorithm process. Flow chart of random forest based on TRRF algorithm.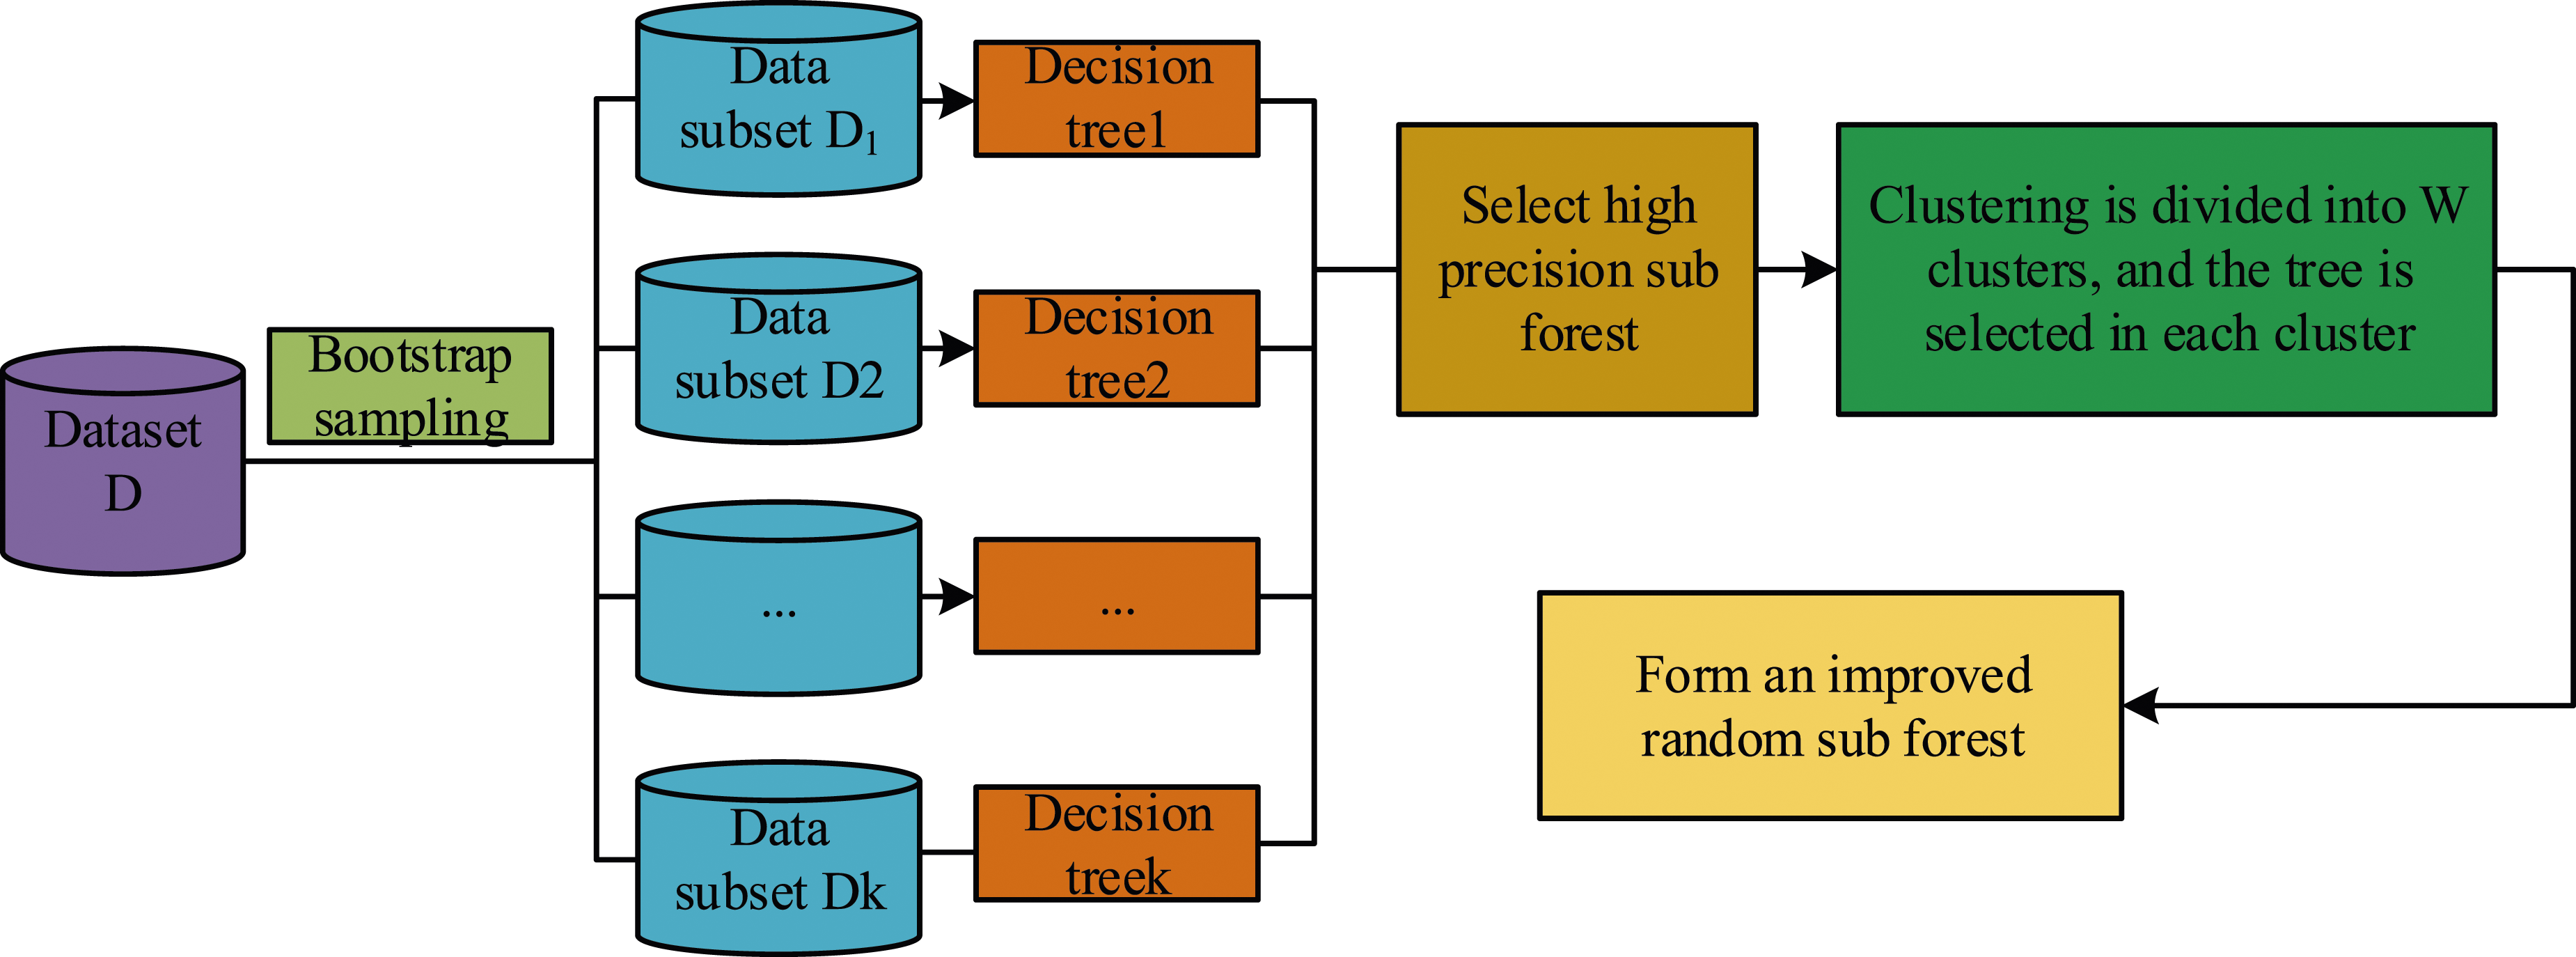
Calculate the AUC value of every DT in RF, arrange the calculation results from high to low, and remove the decision tree with a lower AUC value. In this process, affected by factors such as the data’s characteristic dimension, set and noise, the quality of DT with a higher AUC value may also be lower.20,25 Therefore, when screening the DT, the research first determines the average classification accuracy 
In Formula (11), 
According to the selection method of Formula (12), the decision tree with higher precision is selected from the initial RF to form the sub-forest to be clustered. In determining classification judgments, the RF algorithm employs the average majority voting mechanism. However, this classification method will cause every DT to have the same voting weight during classification, which directly affects the quality of classification results.26,27 Based on this consideration, the research uses F-measure to construct a weighting method based on DT. F-measure combines the precision rate and the recall rate. As the initial information retrieval evaluation standard, it has been widely used in prediction problems such as binary classification and multi-label classification, and is a relatively common evaluation standard. In traditional binary classification learning, the commonly used evaluation indicators are accuracy, precision, and recall. The calculation method of the precision rate is displayed in Formula (13).
In Formula (13), 
The larger the precision rate and recall rate indicators are when evaluating the performance of the classifier, the better the performance of the classifier. However, these indicators have better performance when evaluating balanced data sets. For unbalanced data sets, the above indicators cannot accurately measure the performance of classifiers. In this case, the weighted average F-measure of recall and accuracy is utilized to assess the classifier’s performance. F-measure is an indicator for comprehensively evaluating the performance of classifiers. When the data set is imbalanced, the classification performance of the classifier improves as the value increases.
28
Each DT will generate a category prediction for each record in the verification set after receiving the data from the verification set. The DTs’ anticipated results will then be compared to the actual outcomes. The formula displays the computation process, as shown in Formula (15).
In Formula (15), Recall is the recall rate; Precision is the precision rate; and
Performance analysis of agricultural talent quality evaluation model based on RF algorithm
Performance analysis of improved RF algorithm
To evaluate the effectiveness of the agricultural talent quality evaluation model proposed in the study, the study selected 2350 graduates of an agricultural university to train the model. After screening the data and deleting redundant, invalid and repeated data, 2000 pieces of data were left for experimentation. The RF model, TRRF model and F-TRRF model are trained separately. Using the same sample data to train it, Figure 4 shows how many times the three models are iterated throughout the training phase. Comparison of iteration times of three evaluation models.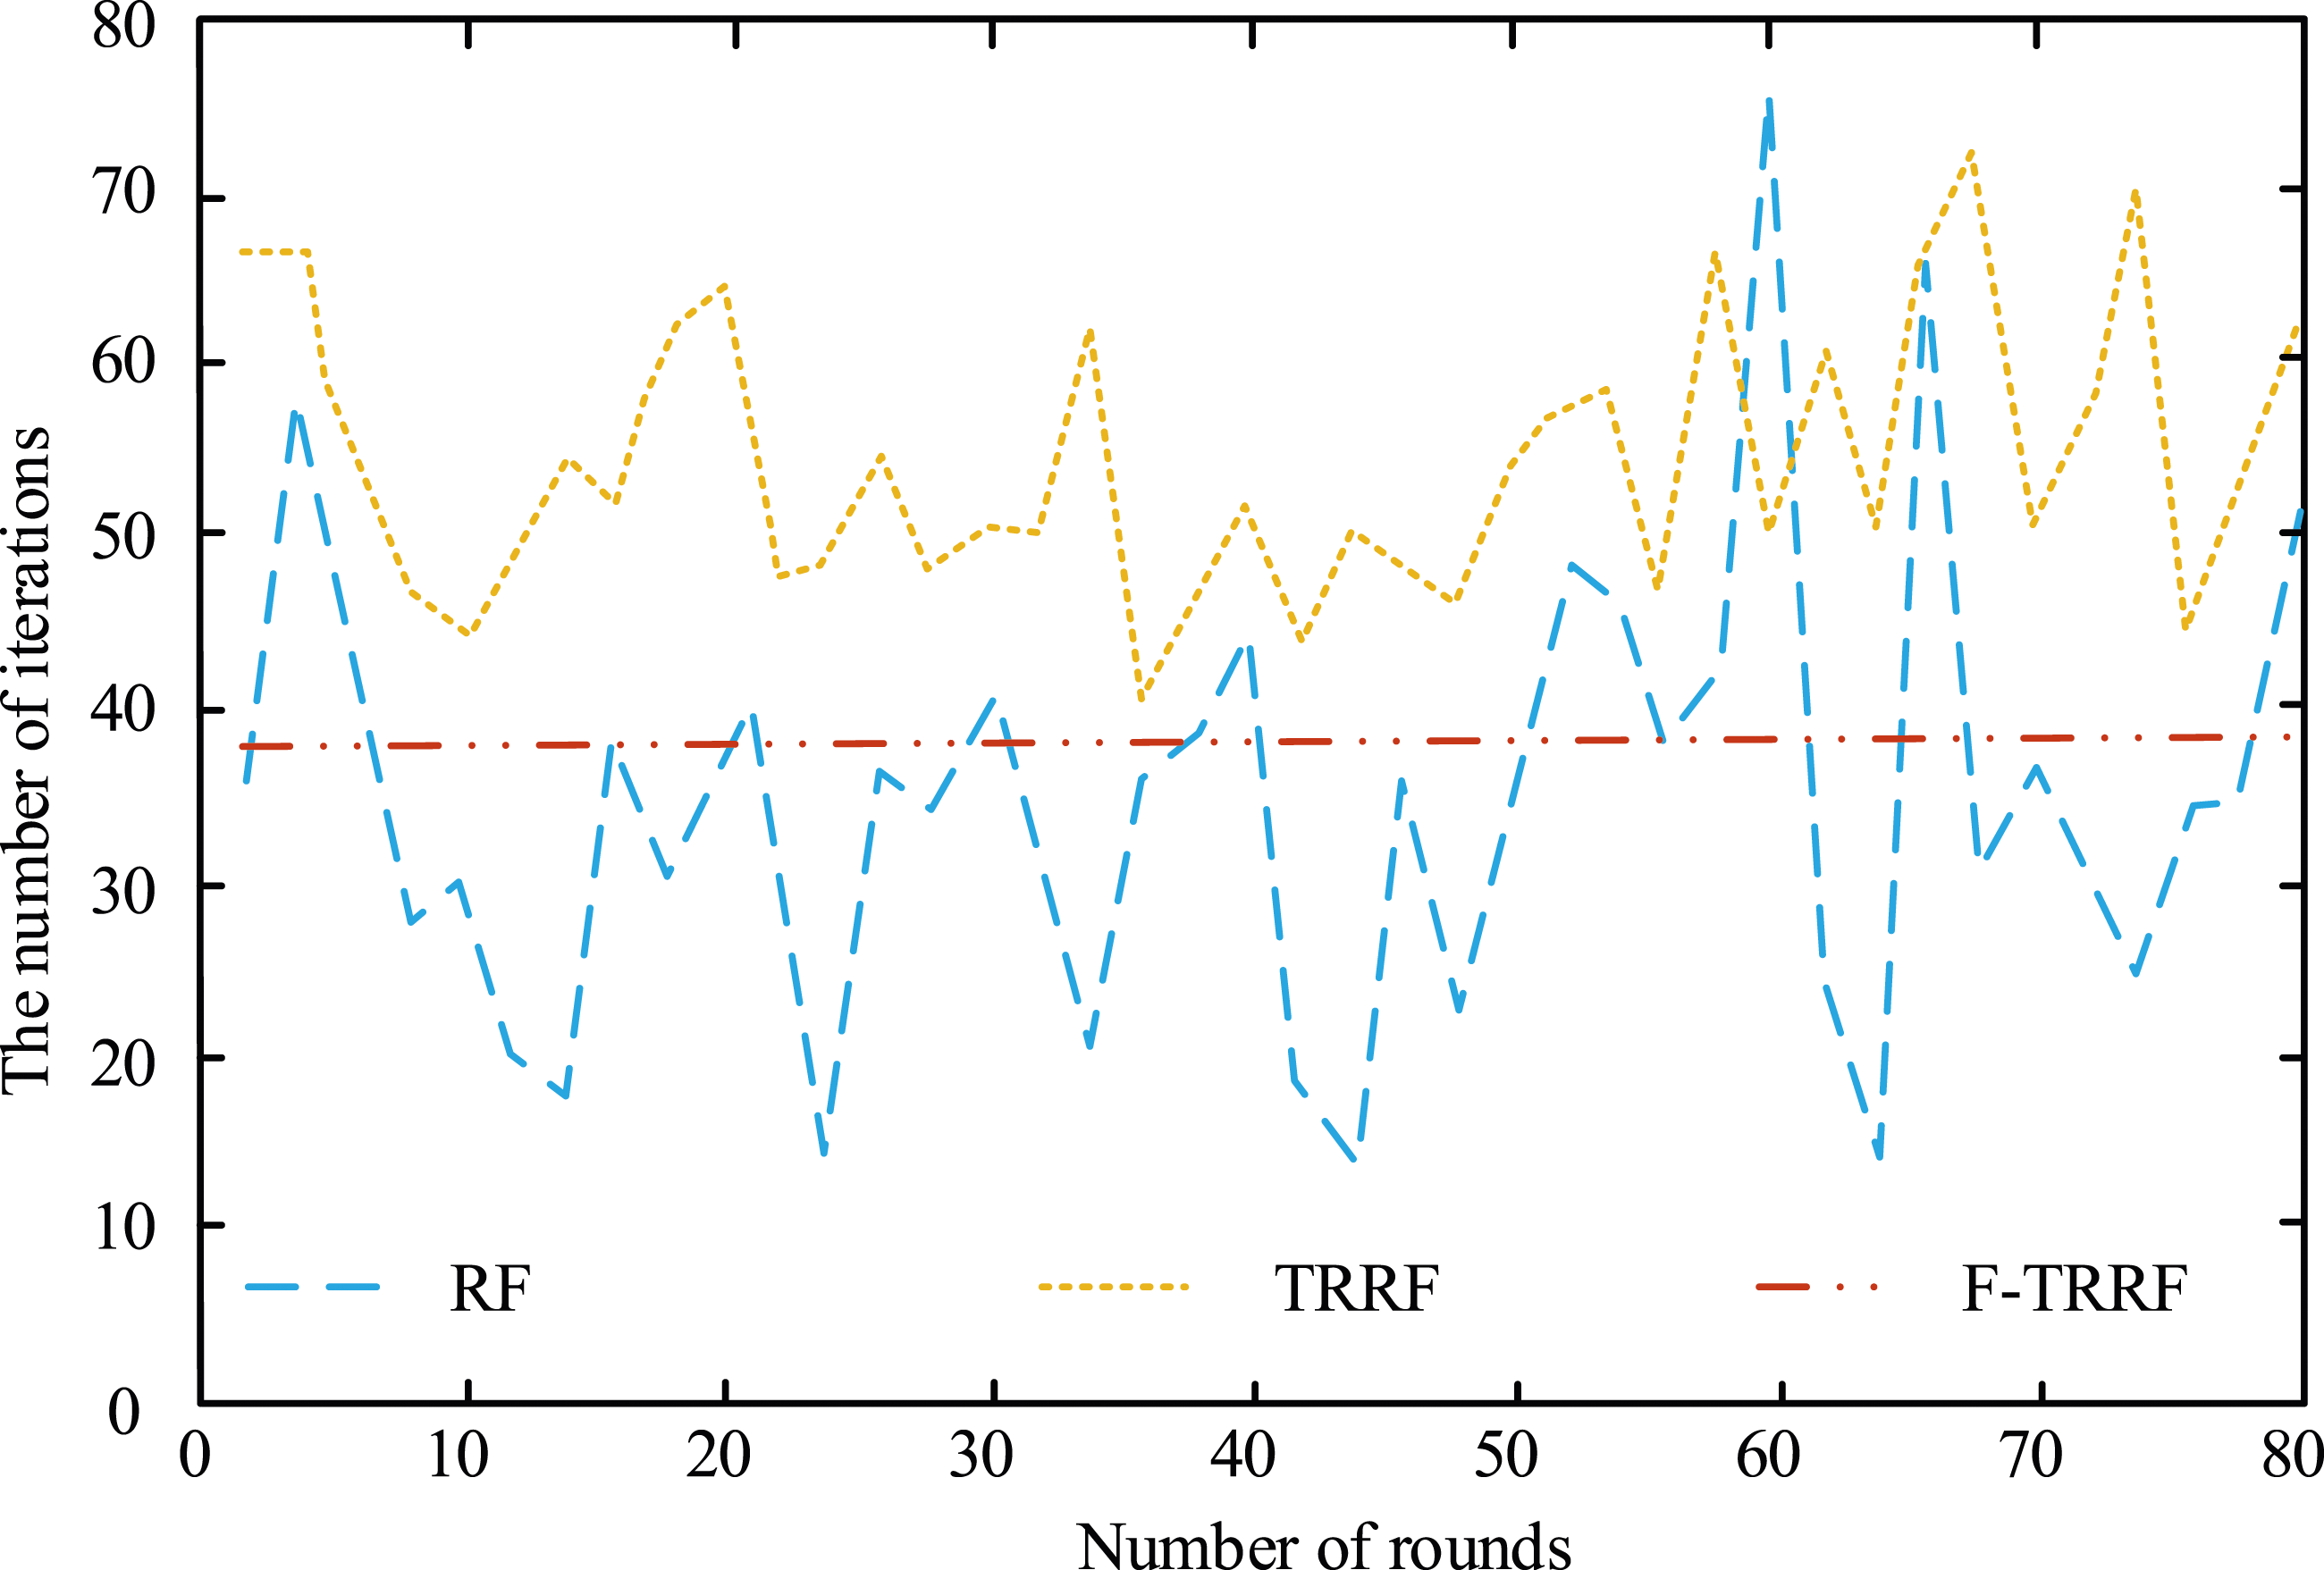
From Figure 4, the iteration numbers of the three models are significantly different. The number of iterations of the RF model fluctuates greatly, the training process is unstable, and there are multiple maximum and minimum values. The maximum number of iterations, which total 77, appears when there are 58 rounds; when the quantity of rounds is 25, the minimum number of iterations is 14, the range of iterations is 63 times, and the average quantity of iterations of the whole RF evaluation model is 42 times. The TRRF model’s overall fluctuation trend is somewhat less pronounced than the RF approach. The maximum number of iterations is 74 when there are 66 rounds; when the quantity of rounds is 35, the minimum number of iterations is 42, and the range of iterations is 32 times, and the average quantity of iterations for the entire model is 58 times. The whole training process of the F-TRRF model has little change, no obvious ups and downs, the average number of iterations is 38, and the convergence is good. Compared to the RF and TRRF models, the average quantity of iterations of the F-TRRF method is 4 times and 20 times lower, respectively, and the convergence is significantly better than the other two agricultural talent quality evaluation models.
Figure 5 shows the running time during the training period. Running time of three models in training process.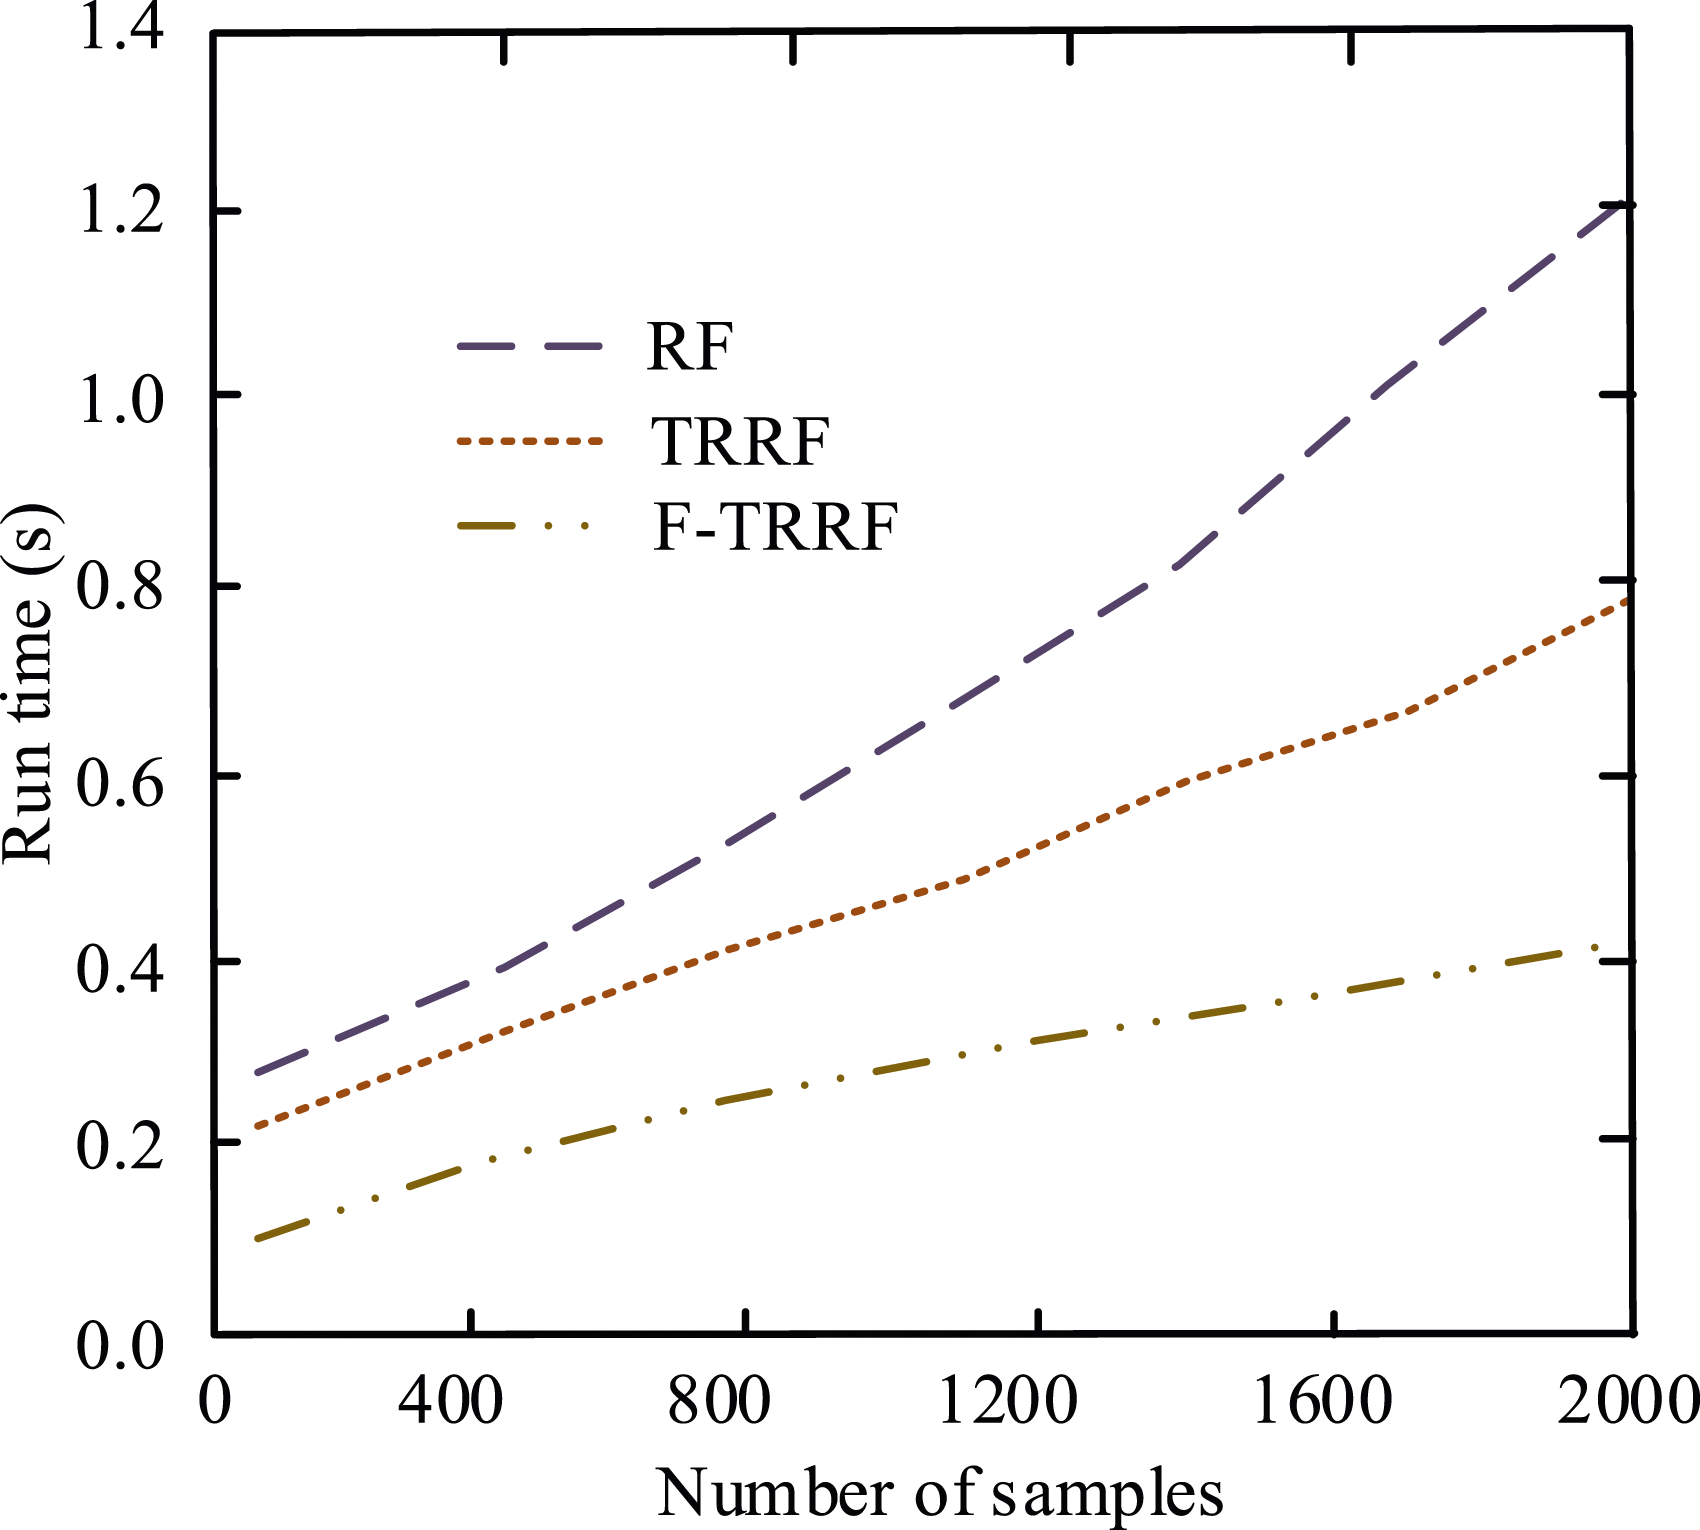
From Figure 5, there are large differences in the running time of the three agricultural talent quality evaluation models. In the overall change trend, with more training data, the three models’ running times lengthen. Specifically, the RF evaluation model has changed the most. In the beginning, there is a running time of 0.28 seconds, and 1.2 seconds when the training samples reach 2000. The running time of the TRRF model varies slightly less than that of the RF model, from 0.2 seconds in the initial stage to 0.78 seconds when the training samples reach 2000. The F-TRRF model consumes the least time and has the highest efficiency during operation. The running time of the initial stage is 0.1 seconds, and when the training samples reach 2000, the running time is 0.41 seconds. Compared with the RF model and the TRRF model, F-TRRF takes 0.79 seconds and 0.37 seconds less time when the training samples reach 2000, respectively, and the model’s performance is significantly superior to that of the RF model and the TRRF model.
Figure 6 displays the accuracy of the three algorithms throughout training. Comparison of the training accuracy of three evaluation models.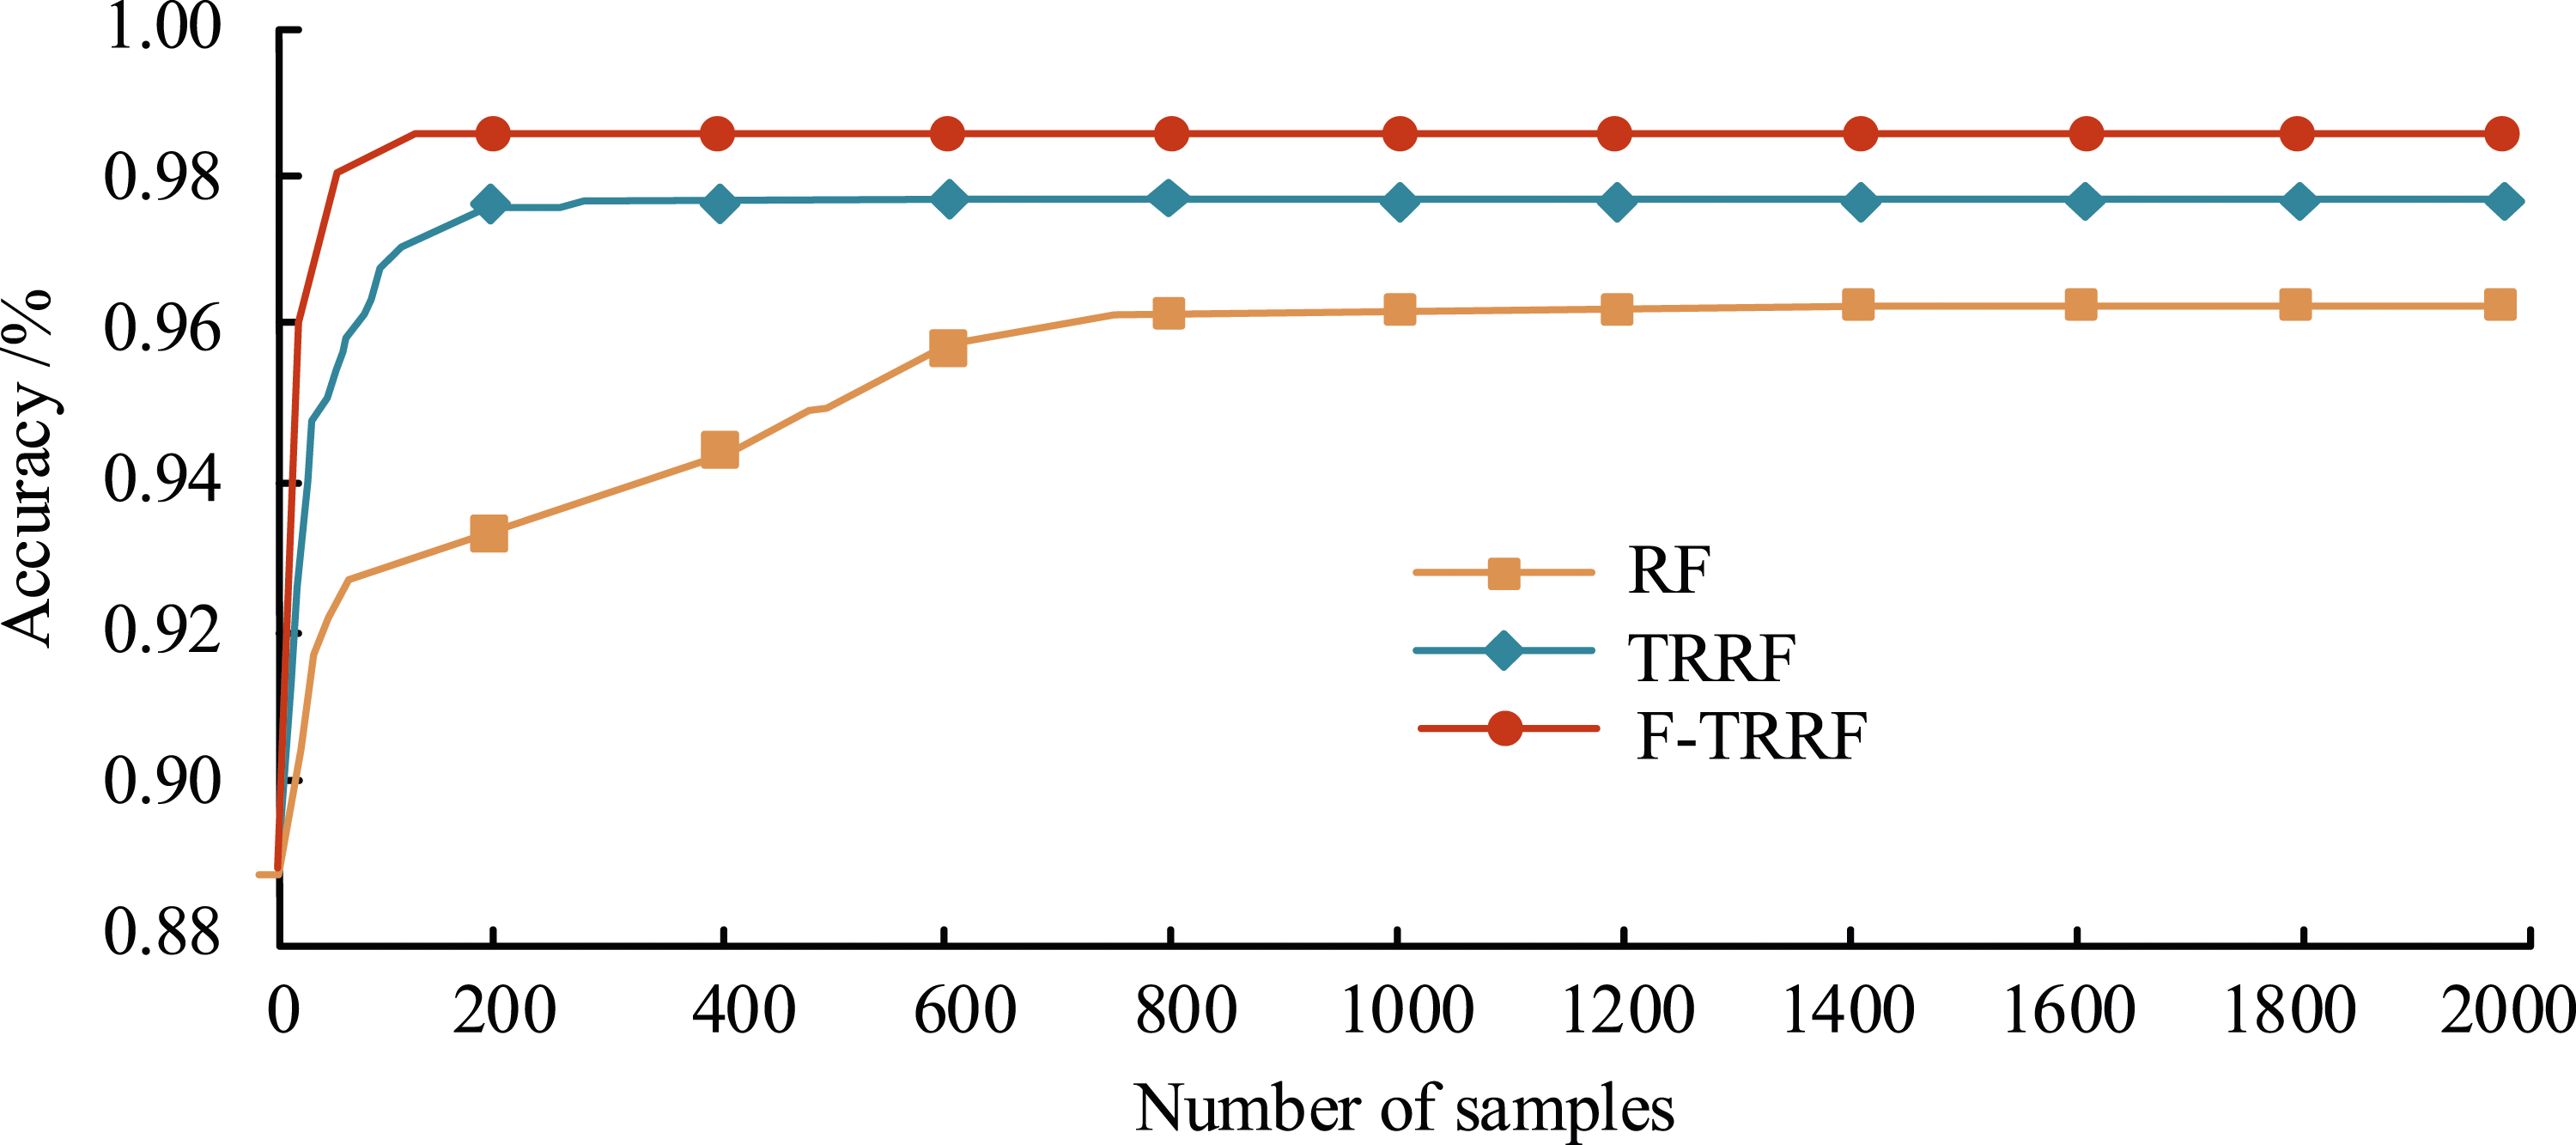
From Figure 6, the accuracy rates of the three models grow with the quantity of training data. This is because the model can extract more detailed data characteristics from the more samples that are extracted. After the training samples reached 1200, the accuracy rate of the RF model was in a stable state at 96.21%; the accuracy rate of the TRRF model was 97.64%; the training accuracy rate of the F-TRRF model was 98.86%, 65% and 1.22% higher than the RF method and TRRF method, respectively. It may be inferred that the F-TRRF model is considerably more accurate than the RF model and the TRRF model.
The relative errors of the three models during training are shown in Figure 7. Comparison of relative errors of three evaluation models.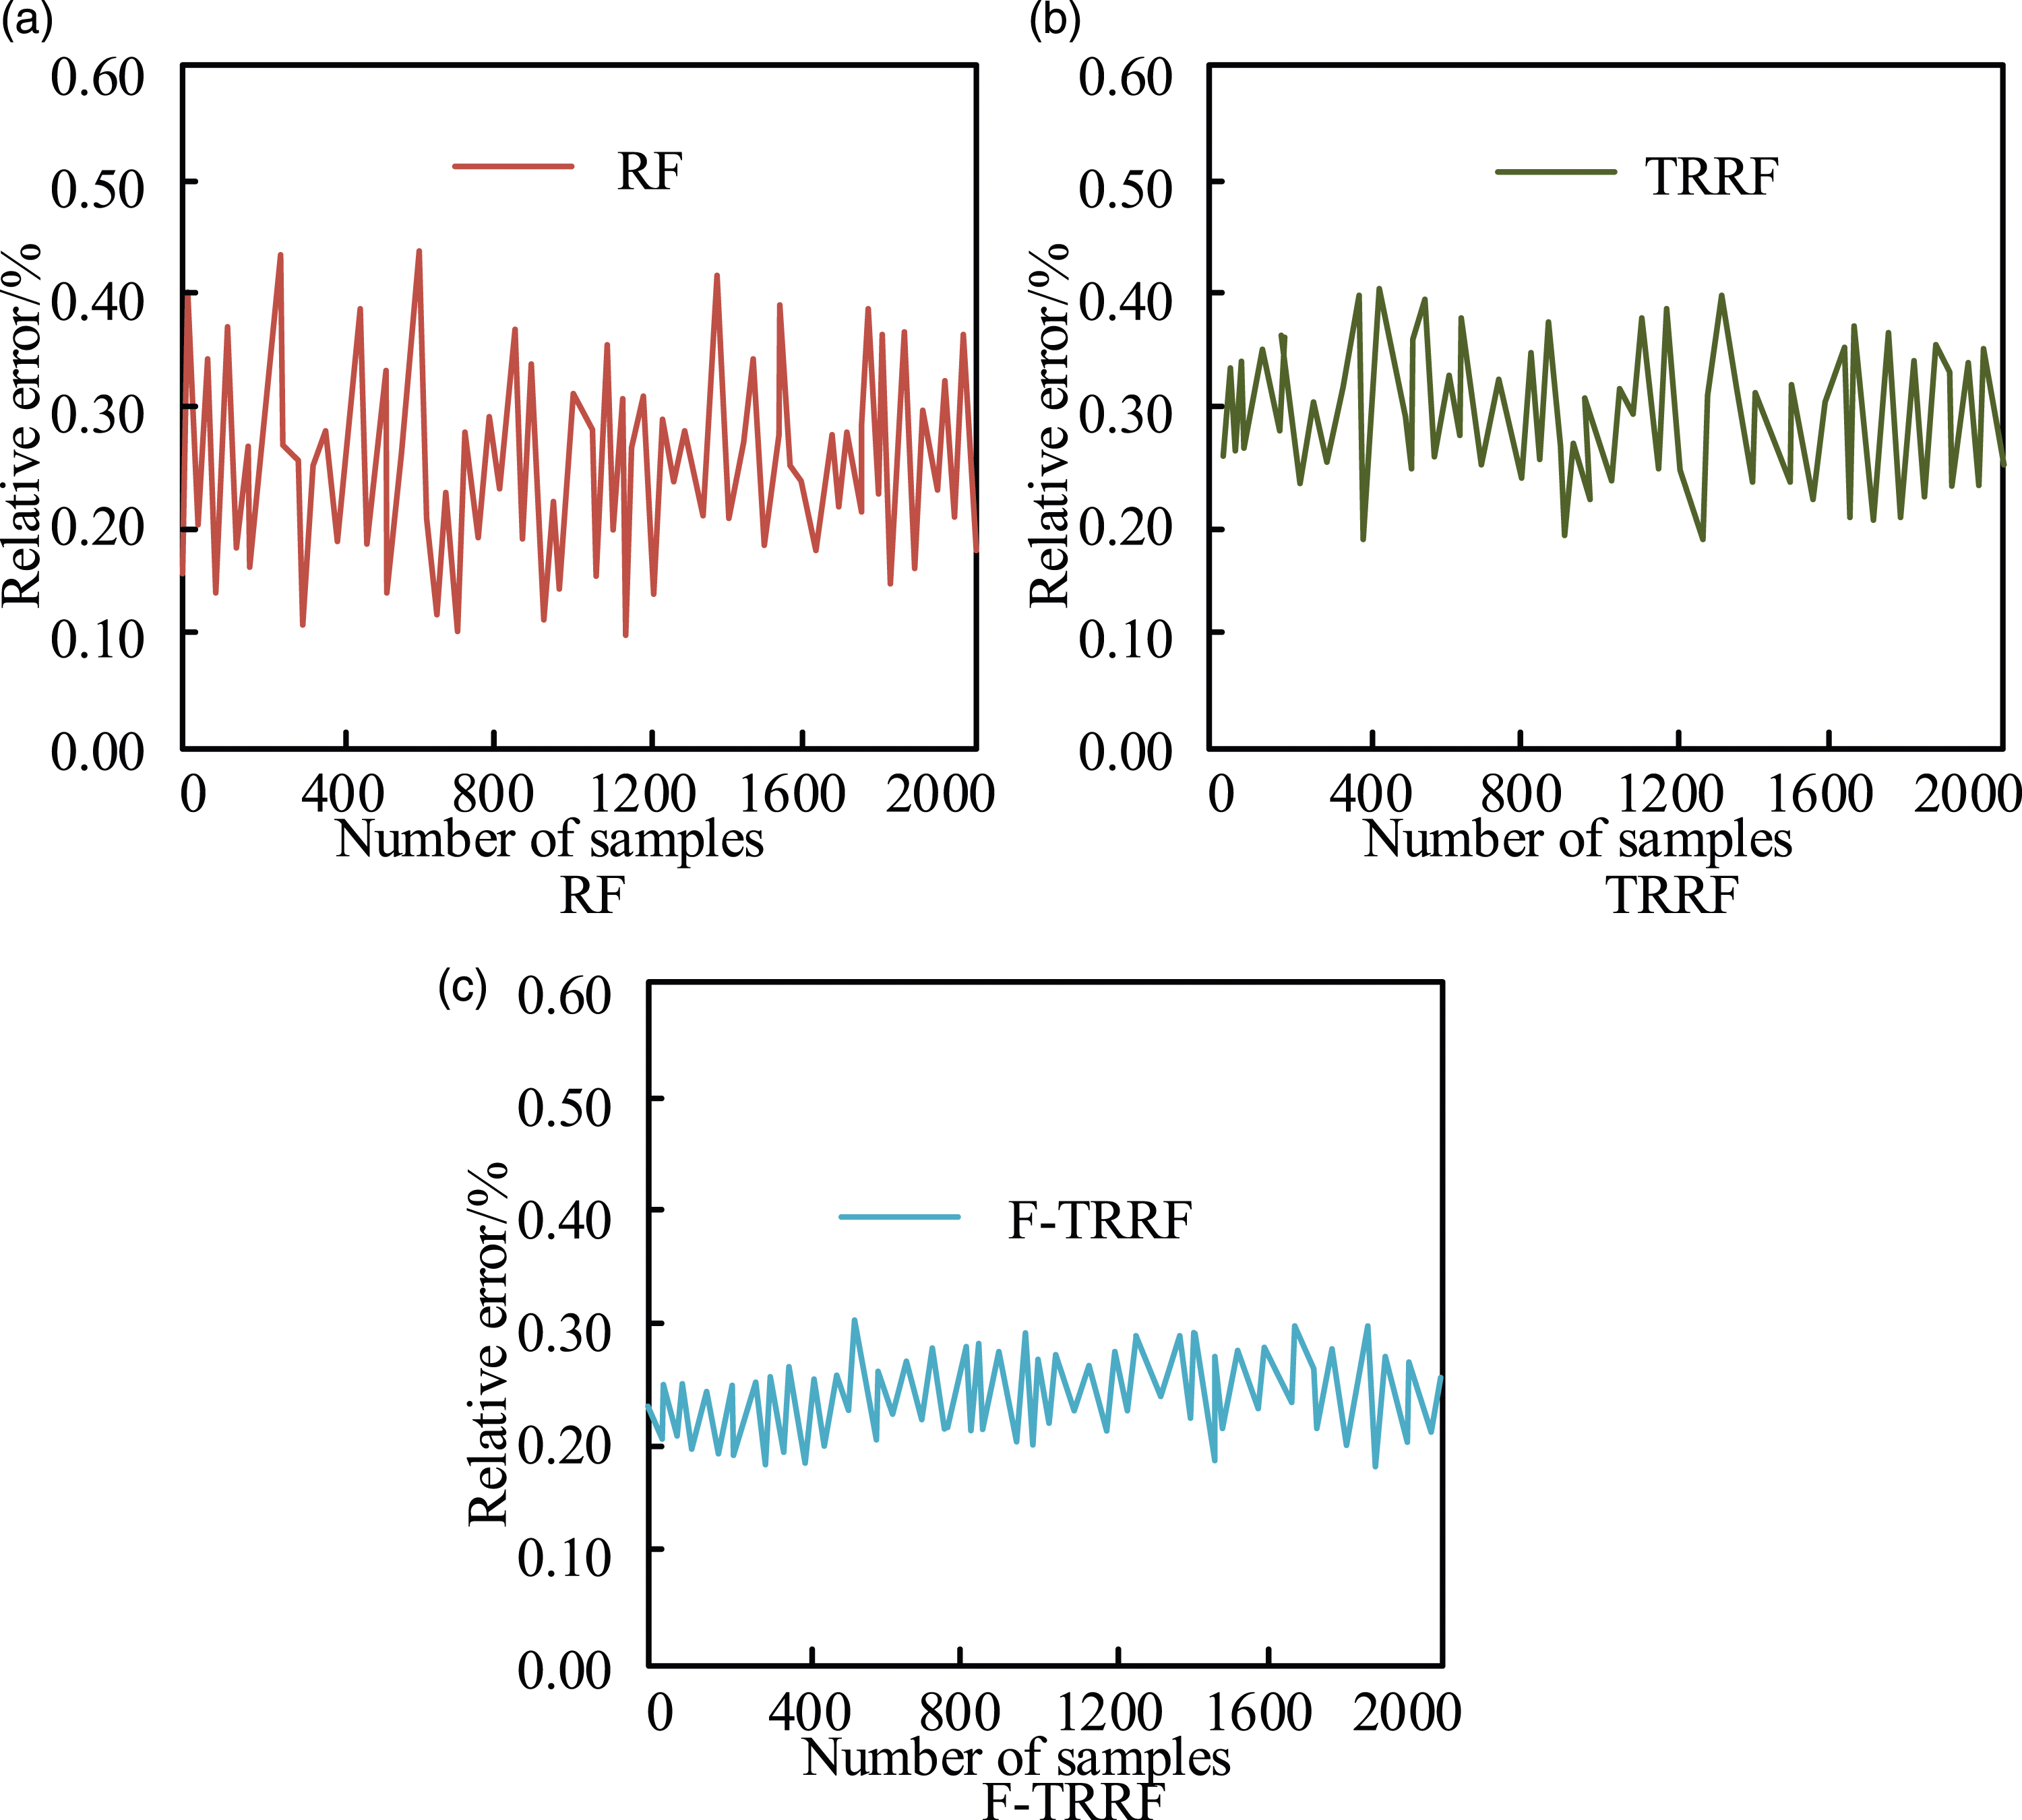
As illustrated in Figure 7(a), the relative error value of the RF evaluation model has a large change trend, and the relative error value is between 0.10 and 0.45. There are multiple maxima and minima of relative errors in the whole process. The greatest relative error value among them is 0.45, while the smallest is 0.09. In Figure 7(b), the trend of relative error value for the TRRF evaluation model is substantially less than that of the RF evaluation model, and the relative error value ranges from 0.20 to 0.45. There are multiple maxima and minima of relative errors in the whole process. Among them, the maximum relative error value is 0.41; the minimum relative error value is 0.20. In Figure 7(c), the relative error value of the F-TRRF evaluation method is significantly less than that of the RF evaluation model and TRRF evaluation model, and the relative error value is between 0.15 and 0.35. There are multiple maxima and minima of relative errors in the whole process. Among them, the maximum relative error value is 0.31; the minimum relative error value is 0.18. From the above analysis, it can be seen that the research proposed that the F-TRRF model has a small error and an ideal accuracy rate in the evaluation of the quality of agricultural talents.
Application analysis of improved RF algorithm
Applying the trained evaluation model to the evaluation of the talent quality of agricultural university graduates, the accuracy rate obtained is demonstrated in Figure 8. Comparison of accuracy of three evaluation models in application.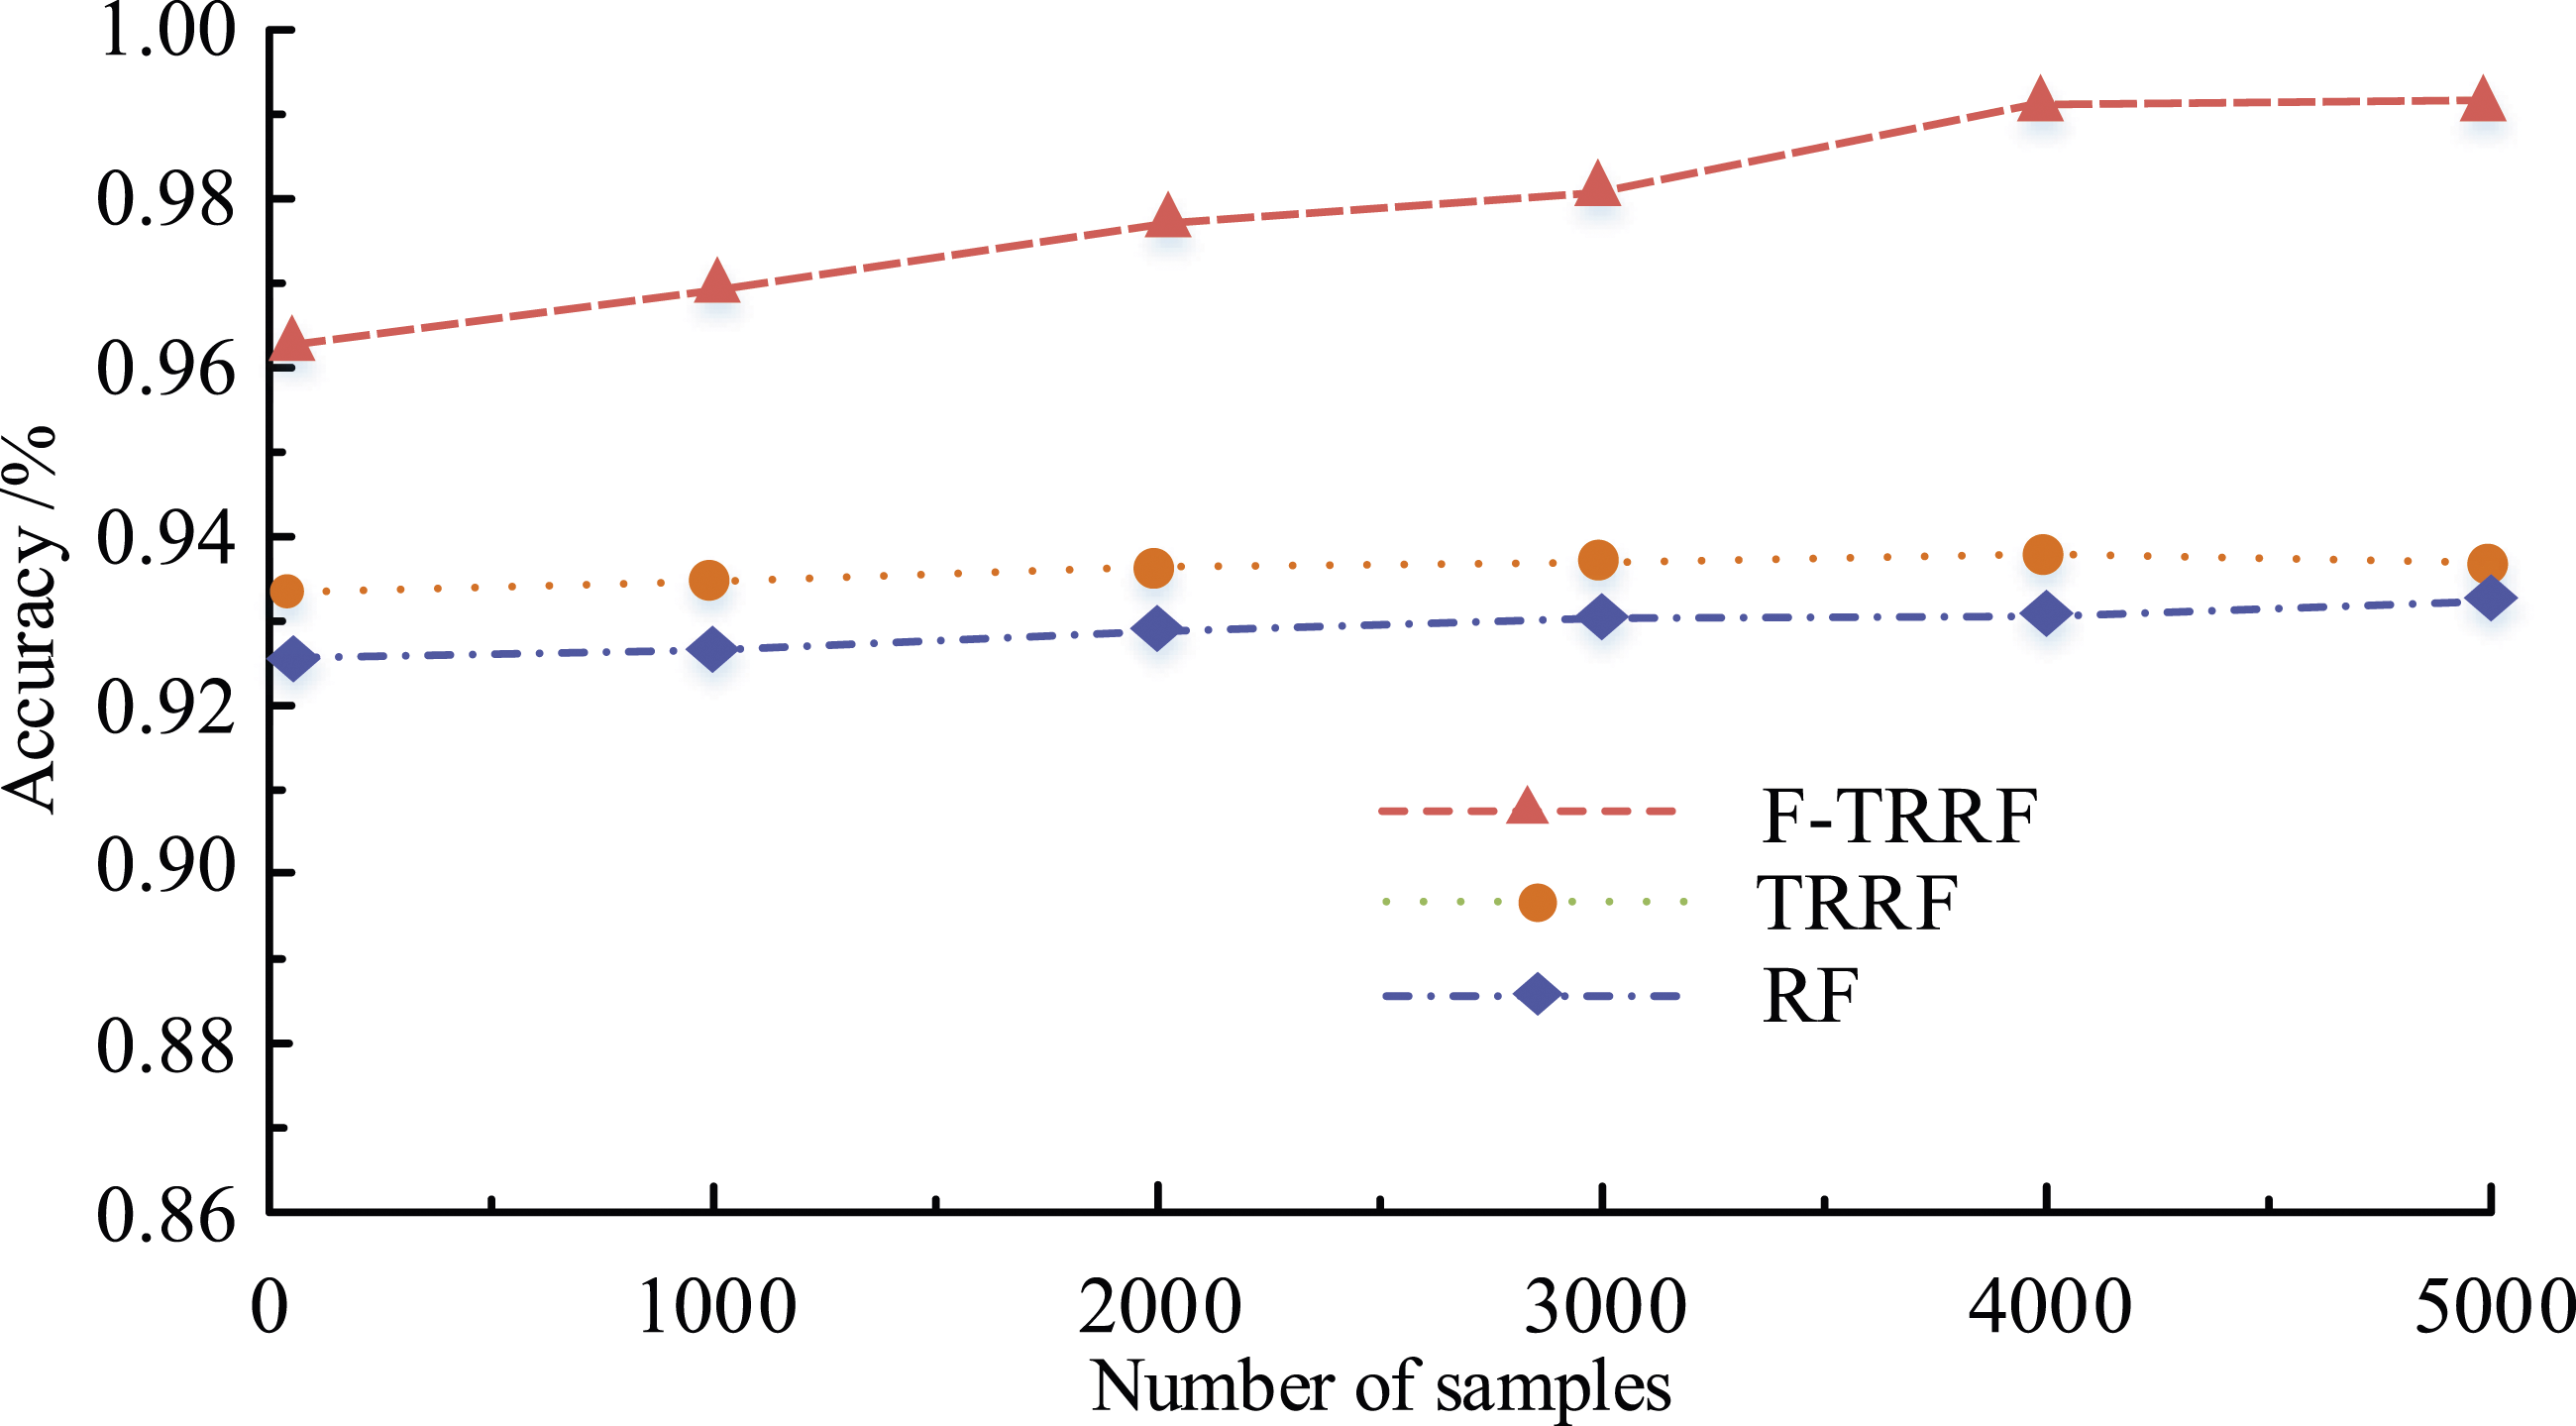
As illustrated in Figure 8, the accuracy rates of the three models in the application process are quite different. The accuracy of both the RF model and the F-TRRF model rises as the number of test samples grows. The TRRF model’s precision is demonstrated a slight decline after a small increase. Among them, the TRRF model’s accuracy is 92.68%. The TRRF model’s accuracy is 93.12%. The TRRF model’s accuracy varies greatly. When the sample size is 5000, the accuracy rate reaches a balanced state, which is 99.17%. By comparison, the accuracy of the F-TRRF model is 6.49% and 6.05% higher than that of the RF method and the TRRF method, respectively. It can be concluded that the F-TRRF model has a good application effect and can meet the evaluation and estimation of the quality of agricultural talents by universities and social organizations.
Figure 9 illustrates the accuracy rate, recall rate, and F1 value of the three models. Accuracy, recall, and F-measure value of the three models.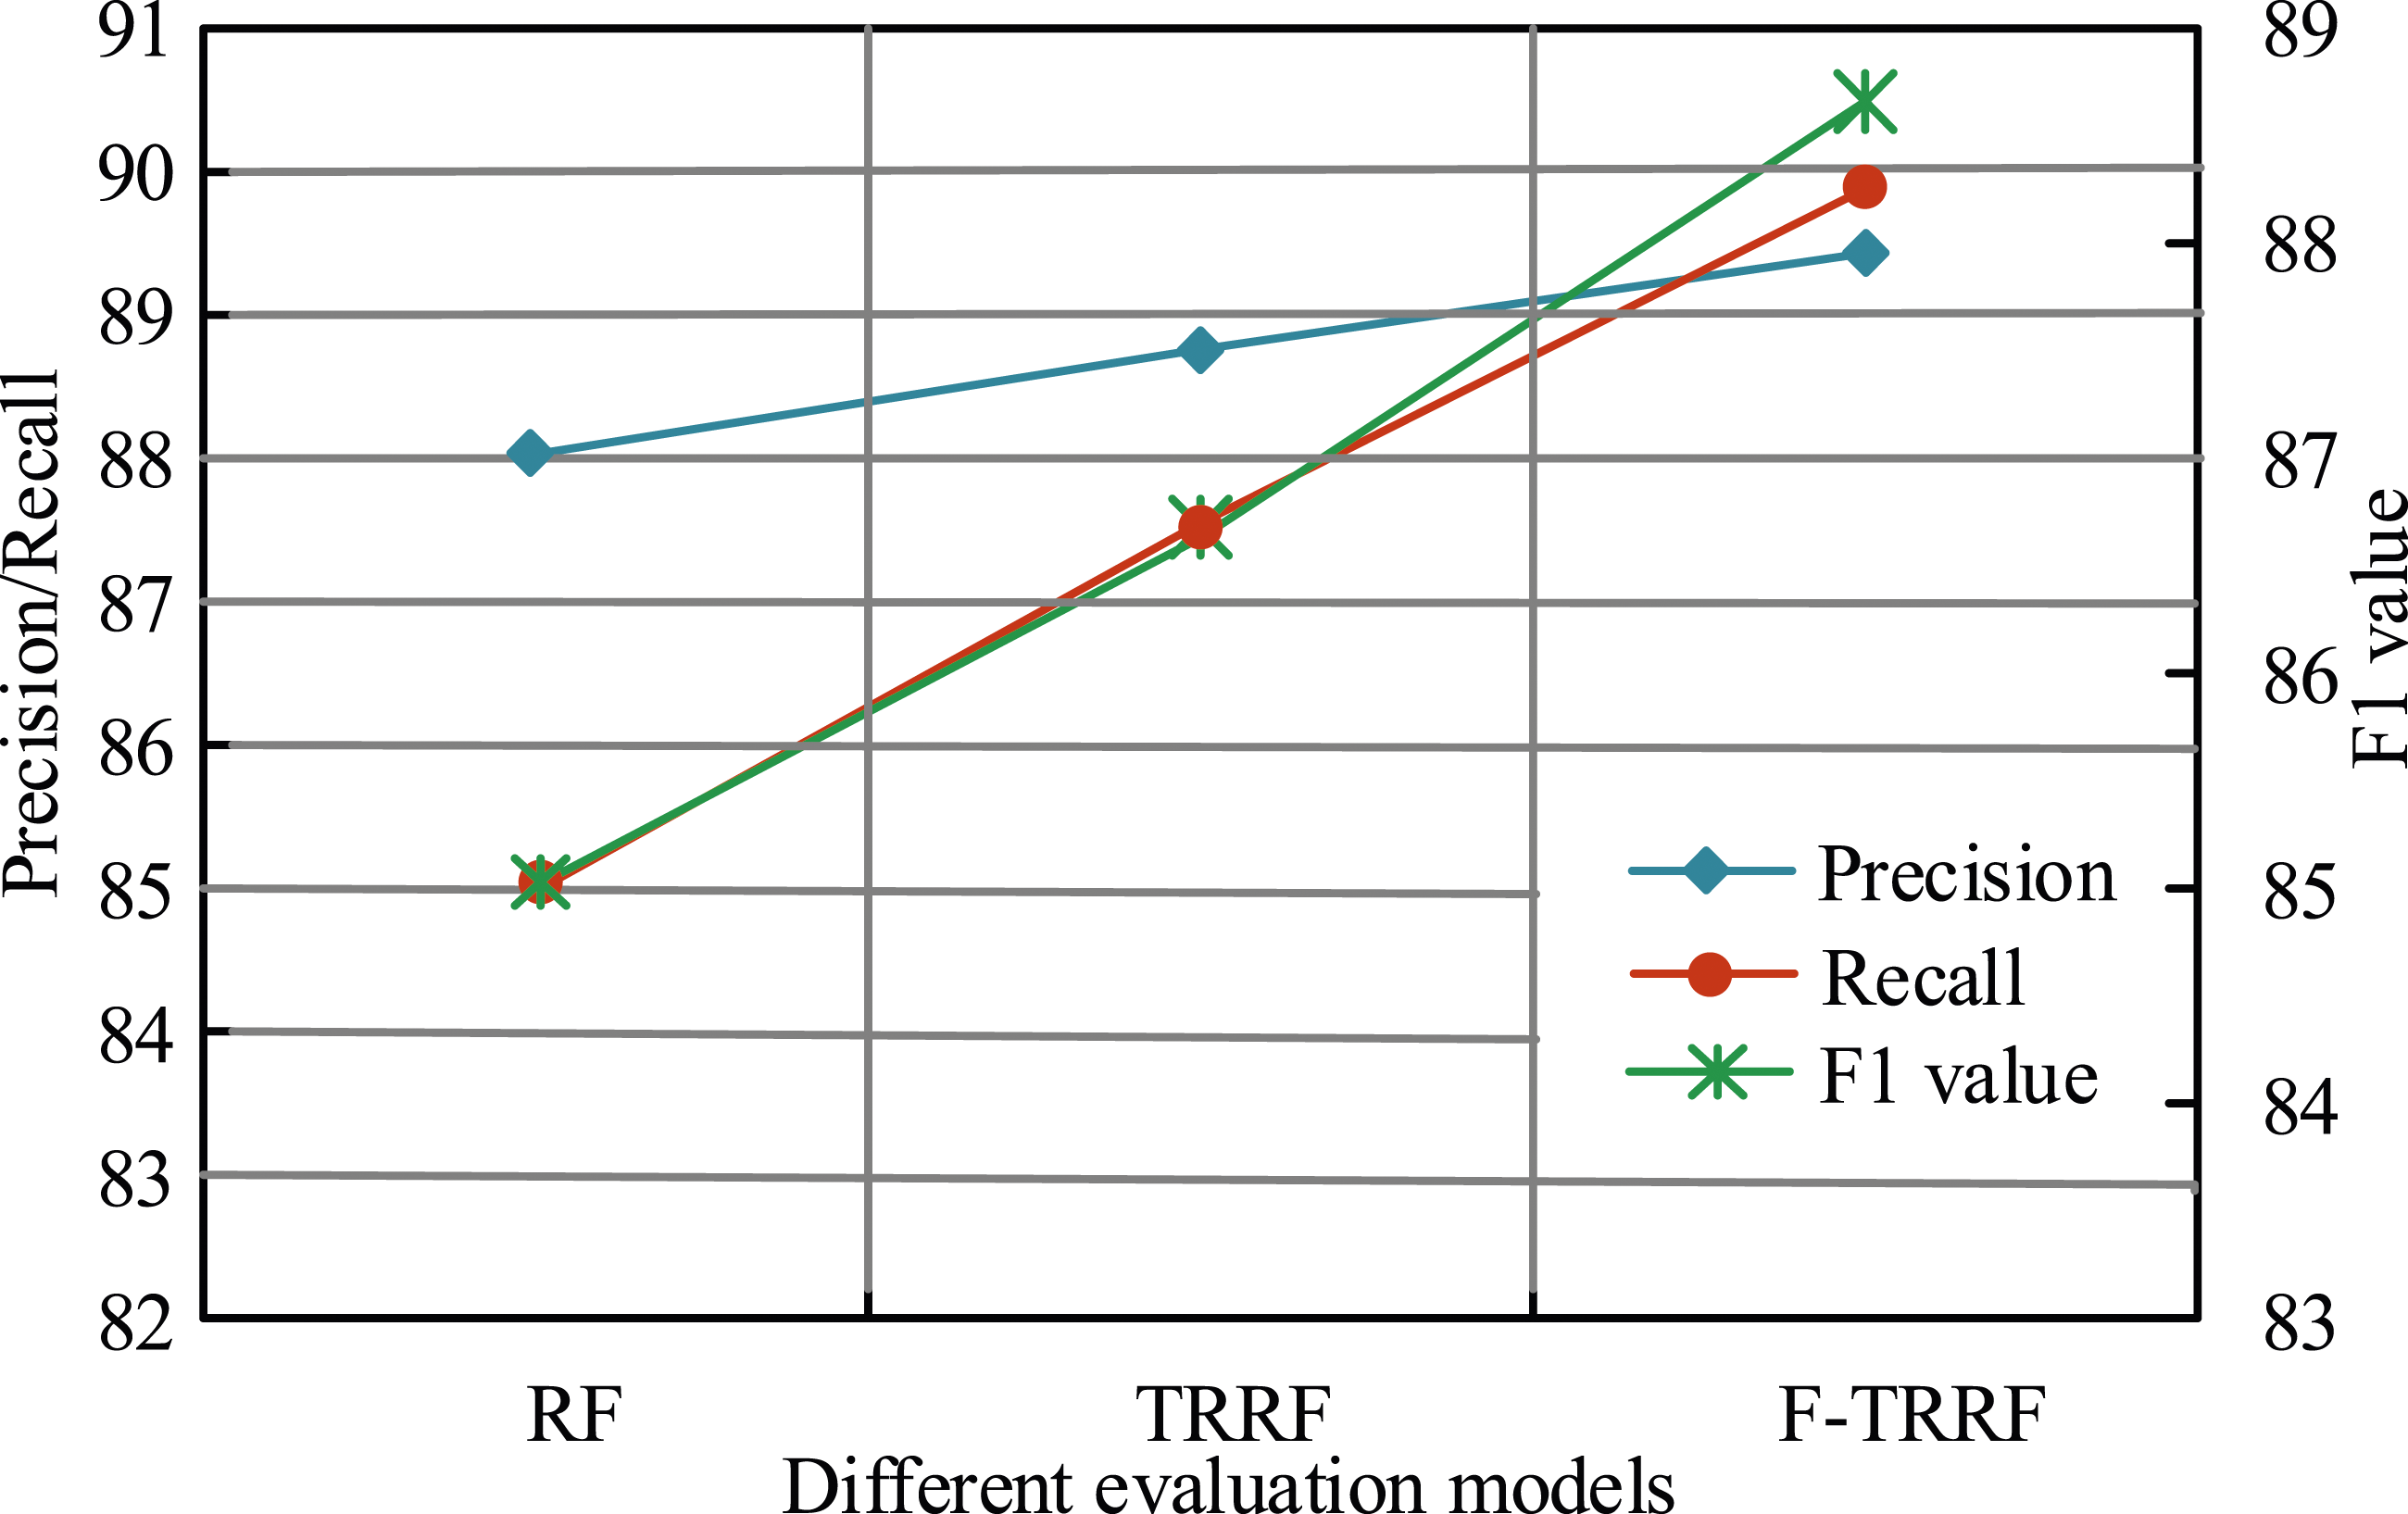
Figure 9 illustrates the outcomes of experiments comparing the effectiveness of the three models during the application process. The RF model’s precision rate, recall rate, and F1 value of are 88.18%, 85.15%, and 85.21%, respectively. The TRRF model’s precision rate, recall rate, and F1 are 88.82%, 87.54%, and 87.56%, respectively. The precision rate, recall rate, and F1 value of the F-TRRF model are 89.49%, 89.97%, and 90.46%, respectively. After comparison, the precision rate of the F-TRRF model is 1.31% and 0.67% greater than that of the RF model and TRRF model, respectively. The recall rate of F-TRRF model is 4.82% and 2.43% higher than that of RF model and TRRF model, respectively. The F1 value of F-TRRF model is 5.25% and 2.9% higher than that of RF model and TRRF model, respectively. On the whole, the three models all have high precision, recall and F1 value, which can well realize the quality evaluation of agricultural talents. However, the F-TRRF model performs substantially better than the other two types. Therefore, the F-TRRF model proposed by the research has the best evaluation effect on the quality of agricultural talents.
To better analyze the effectiveness of the proposed agricultural talent quality evaluation model, the study compared it with commonly used talent quality evaluation methods, including genetic algorithm optimized BP neural network evaluation method (GA-BP), Analytic Hierarchy Process (AHP), and Naive Bayes. The results are shown in Figure 10. Prediction performance of various technologies on academic performance.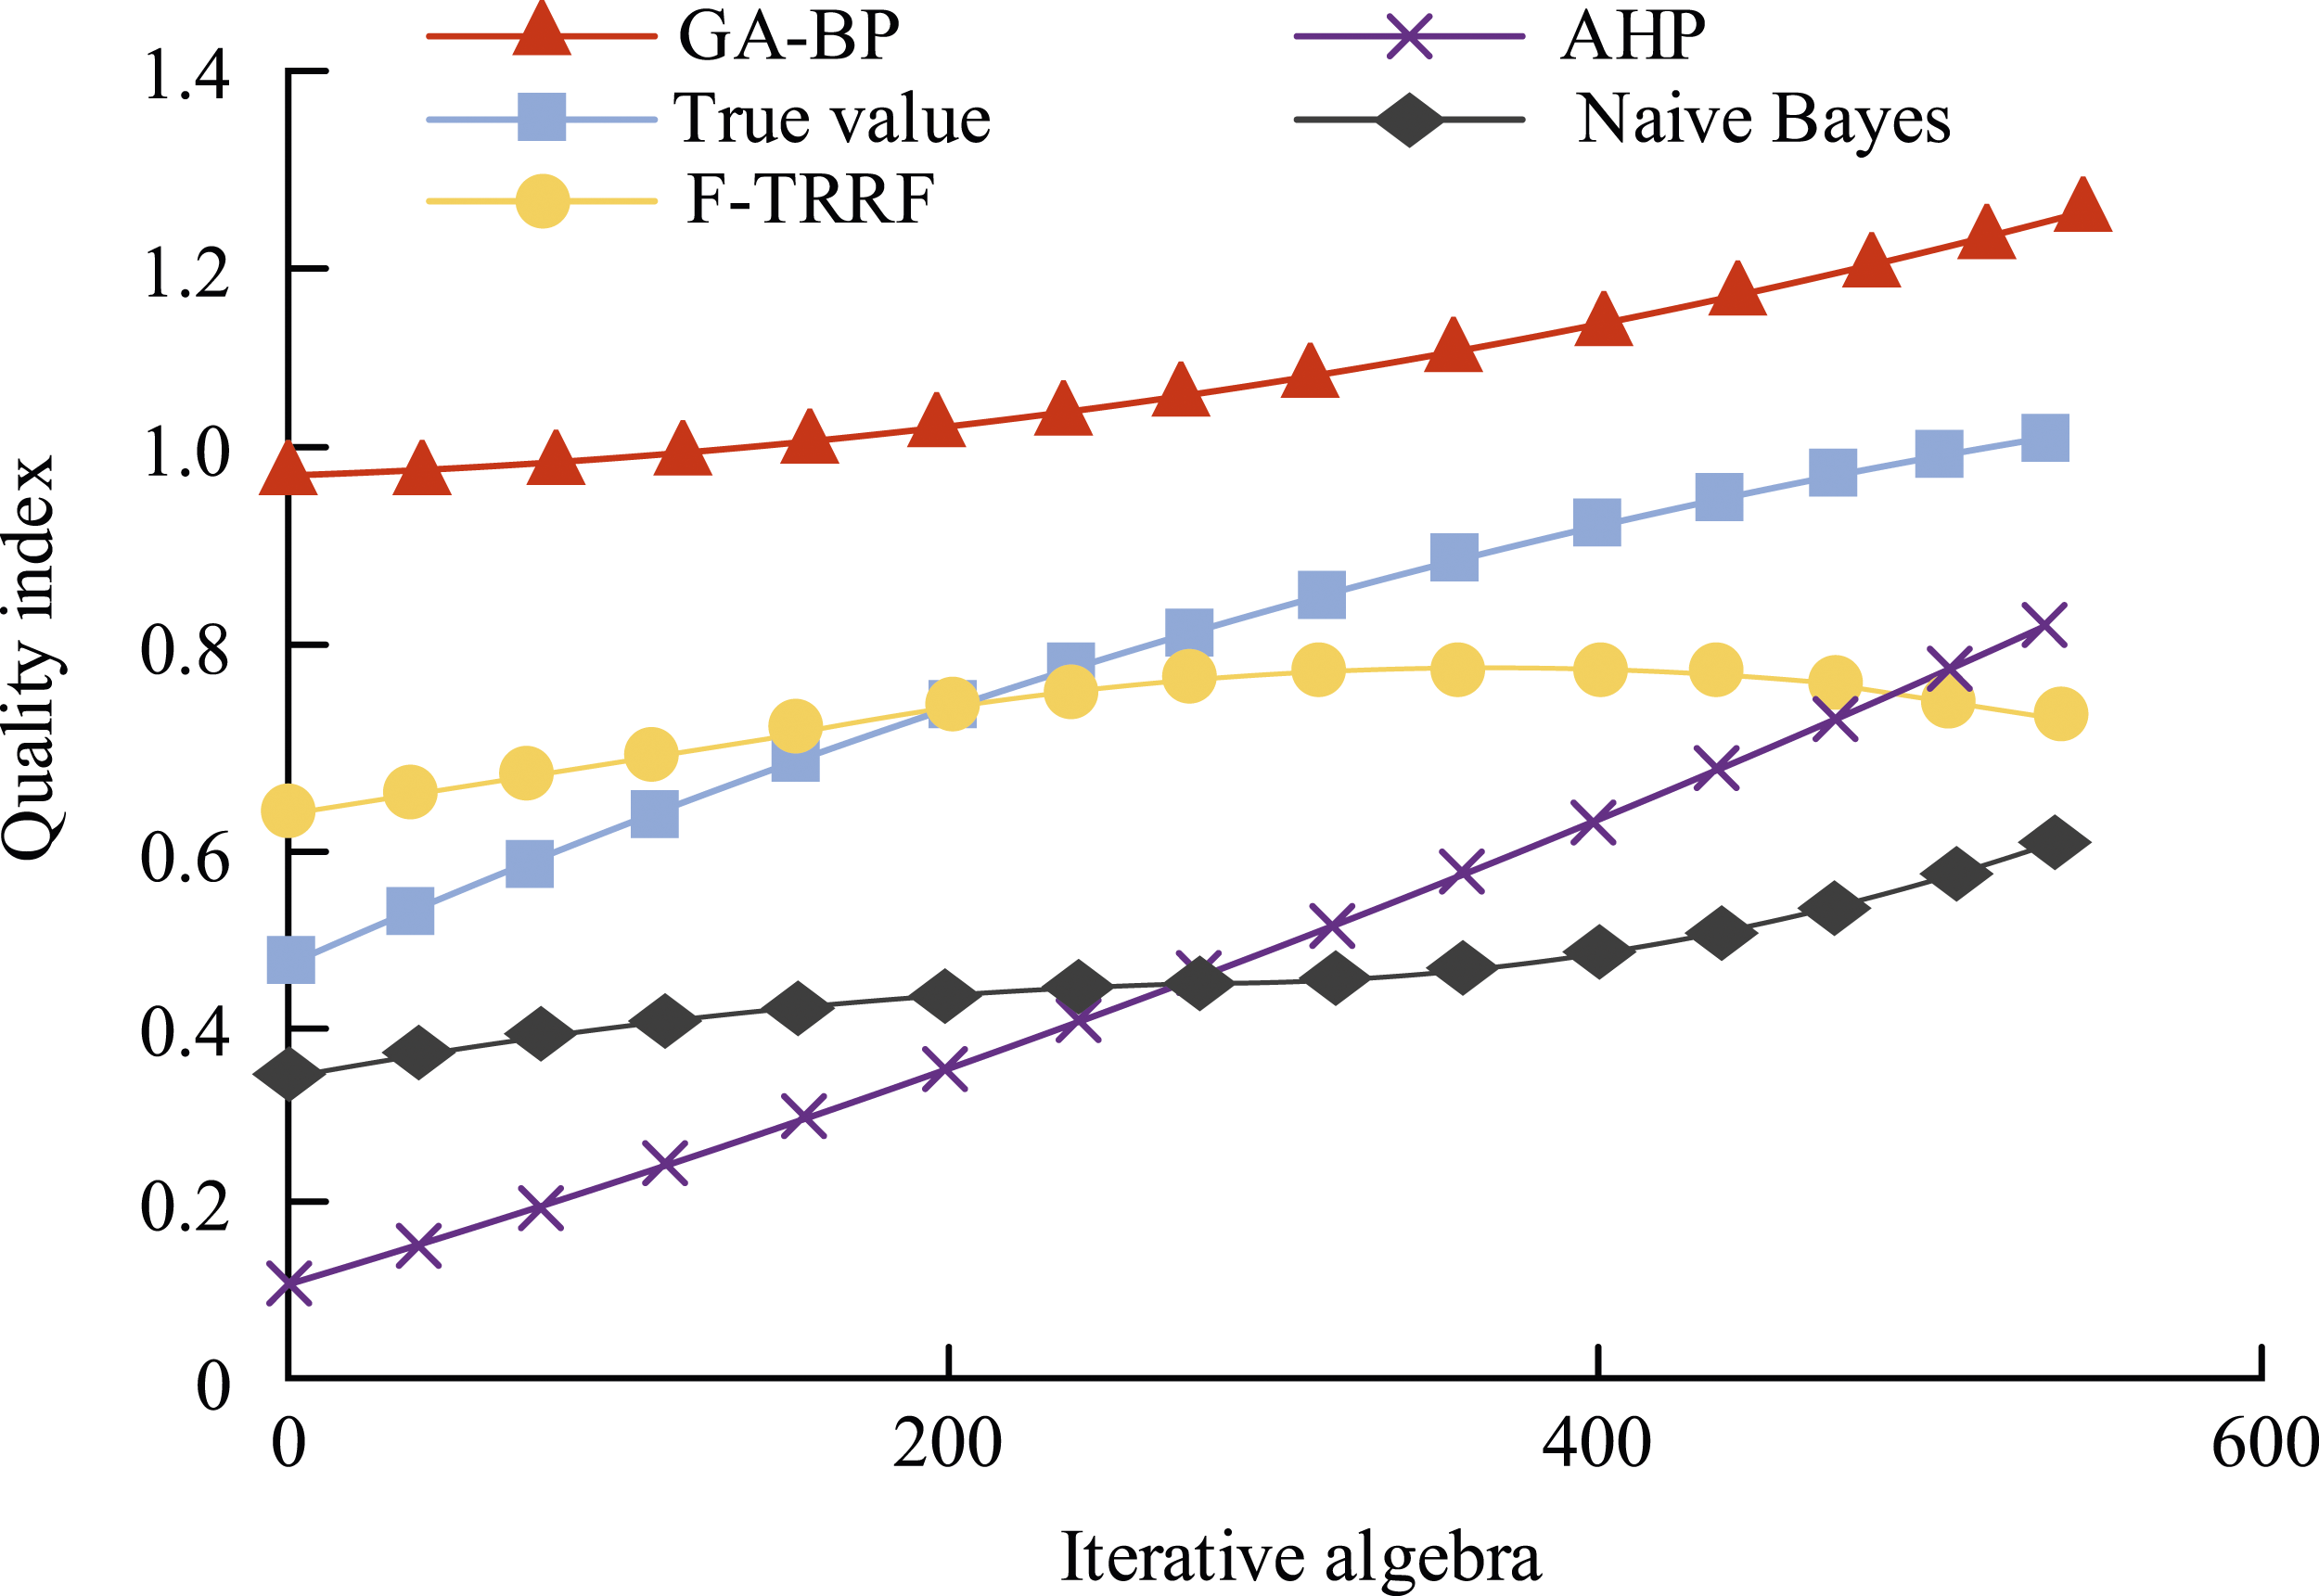
Figure 10 shows the evaluation of each algorithm. Overall, as the algorithm progresses, the student’s performance index gradually increases, which is consistent with the true value. Compared with various algorithms, the F-TRRF proposed in the study is closest to the true value, with an average difference of 0.213, followed by Naive Bayes, AHP, and GA-BP.
Based on the above content, the evaluation method for agricultural talent quality proposed in the study can reasonably predict the quality of agricultural college graduates. Compared with traditional evaluation methods, the proposed method has better evaluation performance. Due to various factors, there are many differences in the quality of agricultural talent cultivation in higher education institutions. Therefore, the evaluation results of agricultural talent quality should consider its influencing factors from multiple aspects in order to improve the overall quality of agricultural talents and better serve agricultural development.
Conclusion
The goal of cultivating high-quality talents is the requirement of social development, and cultivating more high-quality agricultural talents is the fundamental measure to realize agricultural modernization. The evaluation of the quality of agricultural talents can provide suggestions and methods for the cultivation of agricultural talents in agricultural universities. Meanwhile, it can facilitate the country and society to better grasp the reserve of relevant talents. The research first selects the appropriate index to form the index system of agricultural talent evaluation. Then build an agricultural talent evaluation method based on RF algorithm, and improve the evaluation model, and use the F-measure evaluation index to weight the data of the evaluation model to enhance the effectiveness of the model assessment. According to the experimental findings, the suggested assessment model’s running time in training process is 0.41 seconds; the model’s precision rate, recall rate, and F1 value are 89.49%, 89.97%, and 90.46%, respectively. Therefore, The F-TRRF agricultural talent quality evaluation model suggested in the study offers higher accuracy and operational efficiency. Simultaneously, its performance in practical application is also more ideal, which can meet the actual needs. However, due to the limitation of data collection, the research only selects some data of agricultural college graduates for experiments, and the experimental data is less. In future research, more data should be collected to continuously improve the evaluation model.
Statements and declarations
Footnotes
Author contributions
Shubing Qiu contributed to the motivation, the interpretation of the methods, the data analysis, and results. Shirong Hu provided the draft versions and revised versions, reference. Yong Liu provided the related concepts and minor recommendations, and extracted the conclusion and discussion.
Declaration of conflicting interests
The author(s) declared no potential conflicts of interest with respect to the research, authorship, and/or publication of this article.
Funding
The author(s) disclosed receipt of the following financial support for the research, authorship, and/or publication of this article: This work was supported by the Projects of Major Humanities and Social Sciences of Anhui University (Grant: SK2021ZD0044), the Project of National Innovation and Entrepreneurship for College Students (Grant: 202210363117X), and the Humanities and Social Sciences of the Ministry of Education (Grant: 18YJCZH228).