
Abstract
Tunnel health assessment is an important part of ensuring the structural safety and extending the service life of tunnels. However, limited by the problems of insufficient data and class imbalance in the monitoring of tunnel defects, the model may face the prediction bias during the training process. Therefore, this study introduces a tunnel health assessment method based on data augmentation to improve the classification performance and generalization ability of the model. First, the defects monitoring data of the left line of the Huilongshan Tunnel in Shaoguan City, Guangdong Province were collected, a true dataset containing 13 defect indicators was established, and preprocessing operations such as feature transformation, outlier detection and handling, missing value filling, and normalization were performed on it. Then, three data augmentation methods, CTGAN, SMOTE, and CVAE, were used to augment the dataset to generate the synthetic datasets, D s1 , D s2 , and D s3 , respectively. The similarity between the synthetic datasets and the true dataset was assessed using statistical methods, including statistical indicators, boxplots, and Q-Q plots. The effectiveness of data augmentation was then validated using three machine/deep learning models, BP neural networks, SVM, and XGBoost. The experimental results show that the synthetic dataset D s1 generated by CTGAN performed the best in terms of accuracy (98.47%), precision (98.05%), recall (98.10%), and F1 score (98.06%), significantly improving the model’s classification performance while effectively mitigating the problems of insufficient data and class imbalance. Overall, this study demonstrates the superiority of the CTGAN method in tunnel health assessment tasks and provides a reliable data augmentation solution for tunnel health assessment.
Introduction
With the speedy development of transportation infrastructure, the number of tunnel constructions has been increasing. Tunnels face various defects during actual operation, such as cracks, water leakage, and lining damage, which threaten the structural safety and long-term stability of the tunnel.1–3 Therefore, regular defect monitoring and health assessment have become an important part of tunnel maintenance, which is crucial to ensure the safe operation of tunnels and extend their service life. However, the problems of insufficient data and class imbalance in the monitoring of tunnel defects often affect the performance of health assessment models. 4 Due to limitations in monitoring data collection, such as constraints from equipment and time, some health levels have limited data. This leads to difficulties for the assessment model in sufficiently learning the characteristics of minority classes during training, ultimately affecting the accurate assessment of tunnel health.
Machine learning and deep learning models have increasingly been utilized for tunnel health assessment in recent years.5,6 Researchers have introduced algorithms such as SVM, 7 Random Forest (RF), 8 and XGBoost 9 for tunnel health level prediction. In addition, CNN, DNN, and LSTM have also been used to model tunnel health status to improve prediction accuracy. 10
Although these models have achieved certain results, they are highly dependent on large-scale and high-quality training data. Due to the limitation of monitoring equipment, high cost of data collection, and scarcity of samples of certain health levels, the true data often cannot meet the model training requirements, thus limiting the generalization ability of models. Especially in cases of class imbalance, models may tend to predict the majority class, neglecting the features of minority classes, which affects the reliability of defect assessment. 11
In order to address the problems of insufficient data and class imbalance, data augmentation techniques have become an essential approach to improving model performance. Common augmentation methods include data interpolation-based methods, such as SMOTE, 12 and generative model-based methods, such as Variational Autoencoder (VAE)13,14 and Generative Adversarial Network (GAN).15,16 Among them, GAN has made significant progress in various fields, including image, text, and video.17,18 CTGAN (Conditional Tabular Generative Adversarial Network) is a derivative model of GAN tailored for tabular data and has been employed for oversampling of tabular data 19 and in predicting multi-axis fatigue life. 20 VAE as a probabilistic generative model, can model data distributions. 13 CVAE (Conditional Variational Autoencoder) builds upon VAE, designed to generate samples under specific conditions in the data space. 21
This study aims to apply CTGAN, SMOTE, and CVAE techniques to tunnel health assessment, addressing the problems of insufficient data and class imbalance in the monitoring of tunnel defects through data augmentation. By generating synthetic datasets, the scale of training data is extended, especially supplementing samples of the minority class, thereby enhancing the classification performance and generalization ability of the health assessment model. This study provides scientific decision support for tunnel management authorities to help them effectively remediate tunnel defects and ensure the long-term safe operation of tunnels.
Dataset establishment
Data collection
In this study, the site monitoring data of defects on the left line of the Huilongshan Tunnel in Shaoguan City, Guangdong Province were collected. The starting mileage of the left line of Huilongshan Tunnel is K003+790, and the ending mileage is K004+956, spanning 1166 m. In order to carry out tunnel health assessment, this study divided the left line of the tunnel into 117 assessment units with 10 m as a unit of assessment, and the monitoring data of each unit contains 13 defect indicators. These defect indicators served as characteristic variables, specifically including: crack length, crack width, crack depth ratio, cavity longitudinal length, cavity depth, cavity circumferential range, water leakage status, water leakage pH value, deformation rate, inner limit ratio, lining strength ratio, lining thickness ratio, and protective layer thickness ratio. The target variable was the health level of each assessment unit of the tunnel, which was categorized into four levels of tunnel health according to the severity of the defects: Level 1 (no or minor defects), Level 2 (average defects), Level 3 (more severe defects), and Level 4 (severe defects). Finally, the true dataset contained 13 feature variables and 1 target variable, totaling 117 samples.
Data preprocessing
Since true data may contain noise, missing values, outliers, and other issues that can affect the effectiveness of data augmentation and the model training. Therefore, it is necessary to perform effective data cleaning and transformation to guarantee the integrity of the augmented data and the accuracy of model training. 22 For the true dataset, this section sequentially performed preprocessing operations, including feature transformation, outlier detection and handling, missing value filling, and normalization.
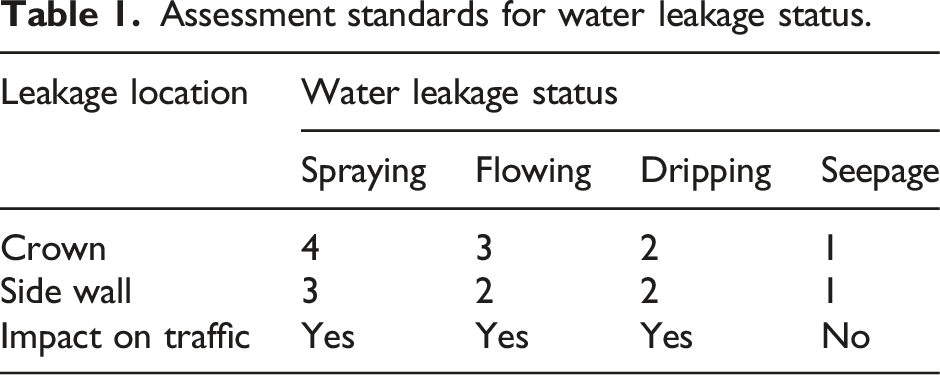
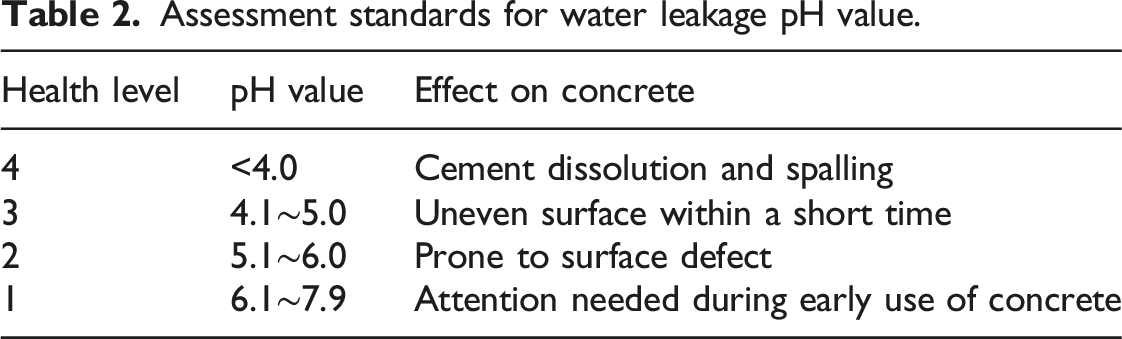
Feature transformation
Assessment standards for water leakage status.
Assessment standards for water leakage pH value.
Outlier detection and handling
Outliers are data points that significantly deviate from the overall trend of the data, potentially caused by anomalies, measurement errors, or extreme phenomena. A boxplot is a simple and widely used statistical chart that visualizes data distribution characteristics by displaying the five-number summary of the data. It can effectively detect outliers. 25
Outlier detection was conducted on the 13 defect indicators, with the results presented in Figure 1. It can be seen that, except for the crack depth ratio and water leakage pH value indicators, all other indicators exhibited varying degrees of outliers. Among them, indicators such as cavity longitudinal length and cavity depth showed a relatively high number of outliers. For the detected outliers, an initial manual review was conducted to retain significant outliers while removing obviously erroneous data. Subsequently, the remaining outliers were replaced using the extreme value method, where data pointed smaller than the lower limit value were replaced with the lower limit value, and those greater than the upper limit value were replaced with the upper limit value.
26
Boxplot detection results.
Missing value filling
Data distribution after outlier removal.
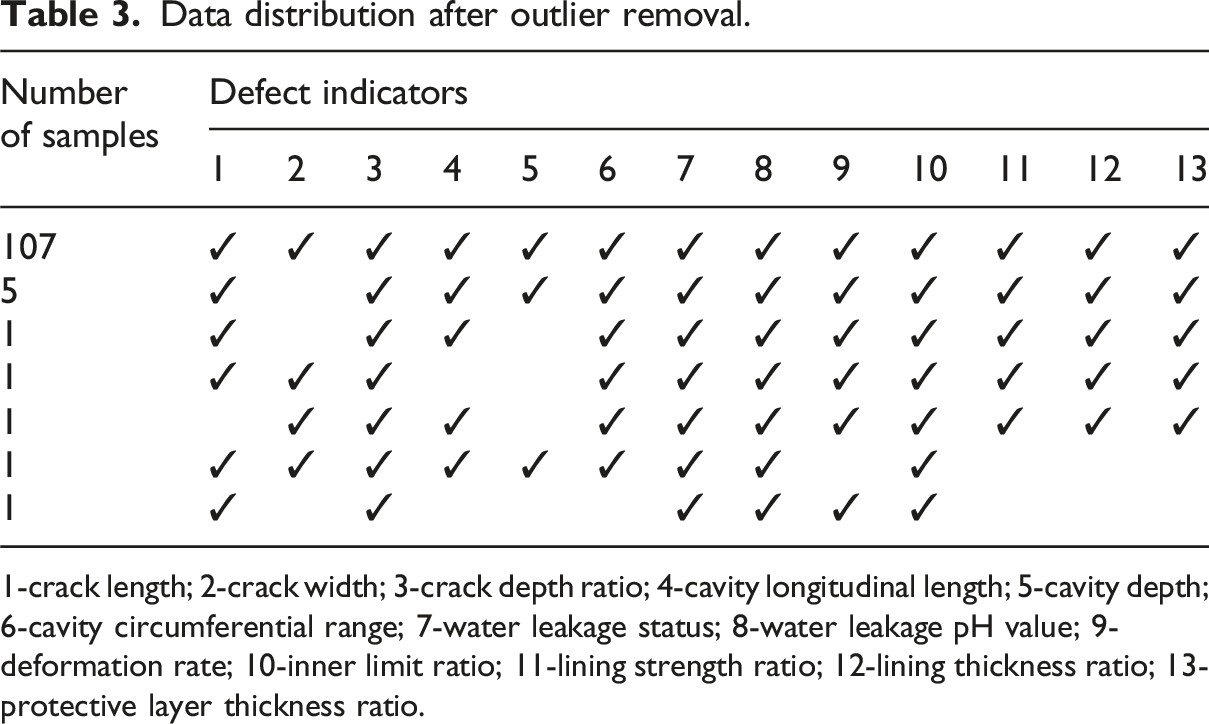
1-crack length; 2-crack width; 3-crack depth ratio; 4-cavity longitudinal length; 5-cavity depth; 6-cavity circumferential range; 7-water leakage status; 8-water leakage pH value; 9-deformation rate; 10-inner limit ratio; 11-lining strength ratio; 12-lining thickness ratio; 13-protective layer thickness ratio.
According to Table 3, missing values were present in 9 defect indicators, namely, crack length, crack width, cavity longitudinal length, cavity depth, cavity circumferential range, deformation rate, lining strength ratio, lining thickness ratio, and protective layer thickness ratio. The data distribution histograms for each indicator are shown in Figure 2. Observing the histograms, it can be seen that crack length, crack width, cavity longitudinal length, cavity depth, cavity circumferential range, and deformation rate had more obvious bias or outliers, and the use of median filling can reduce the influence of these extreme values. The data distribution of lining strength ratio, lining thickness ratio and protective layer thickness ratio was more centralized, and the mean value can better represent the overall data trend. Histograms of data distribution for each indicator.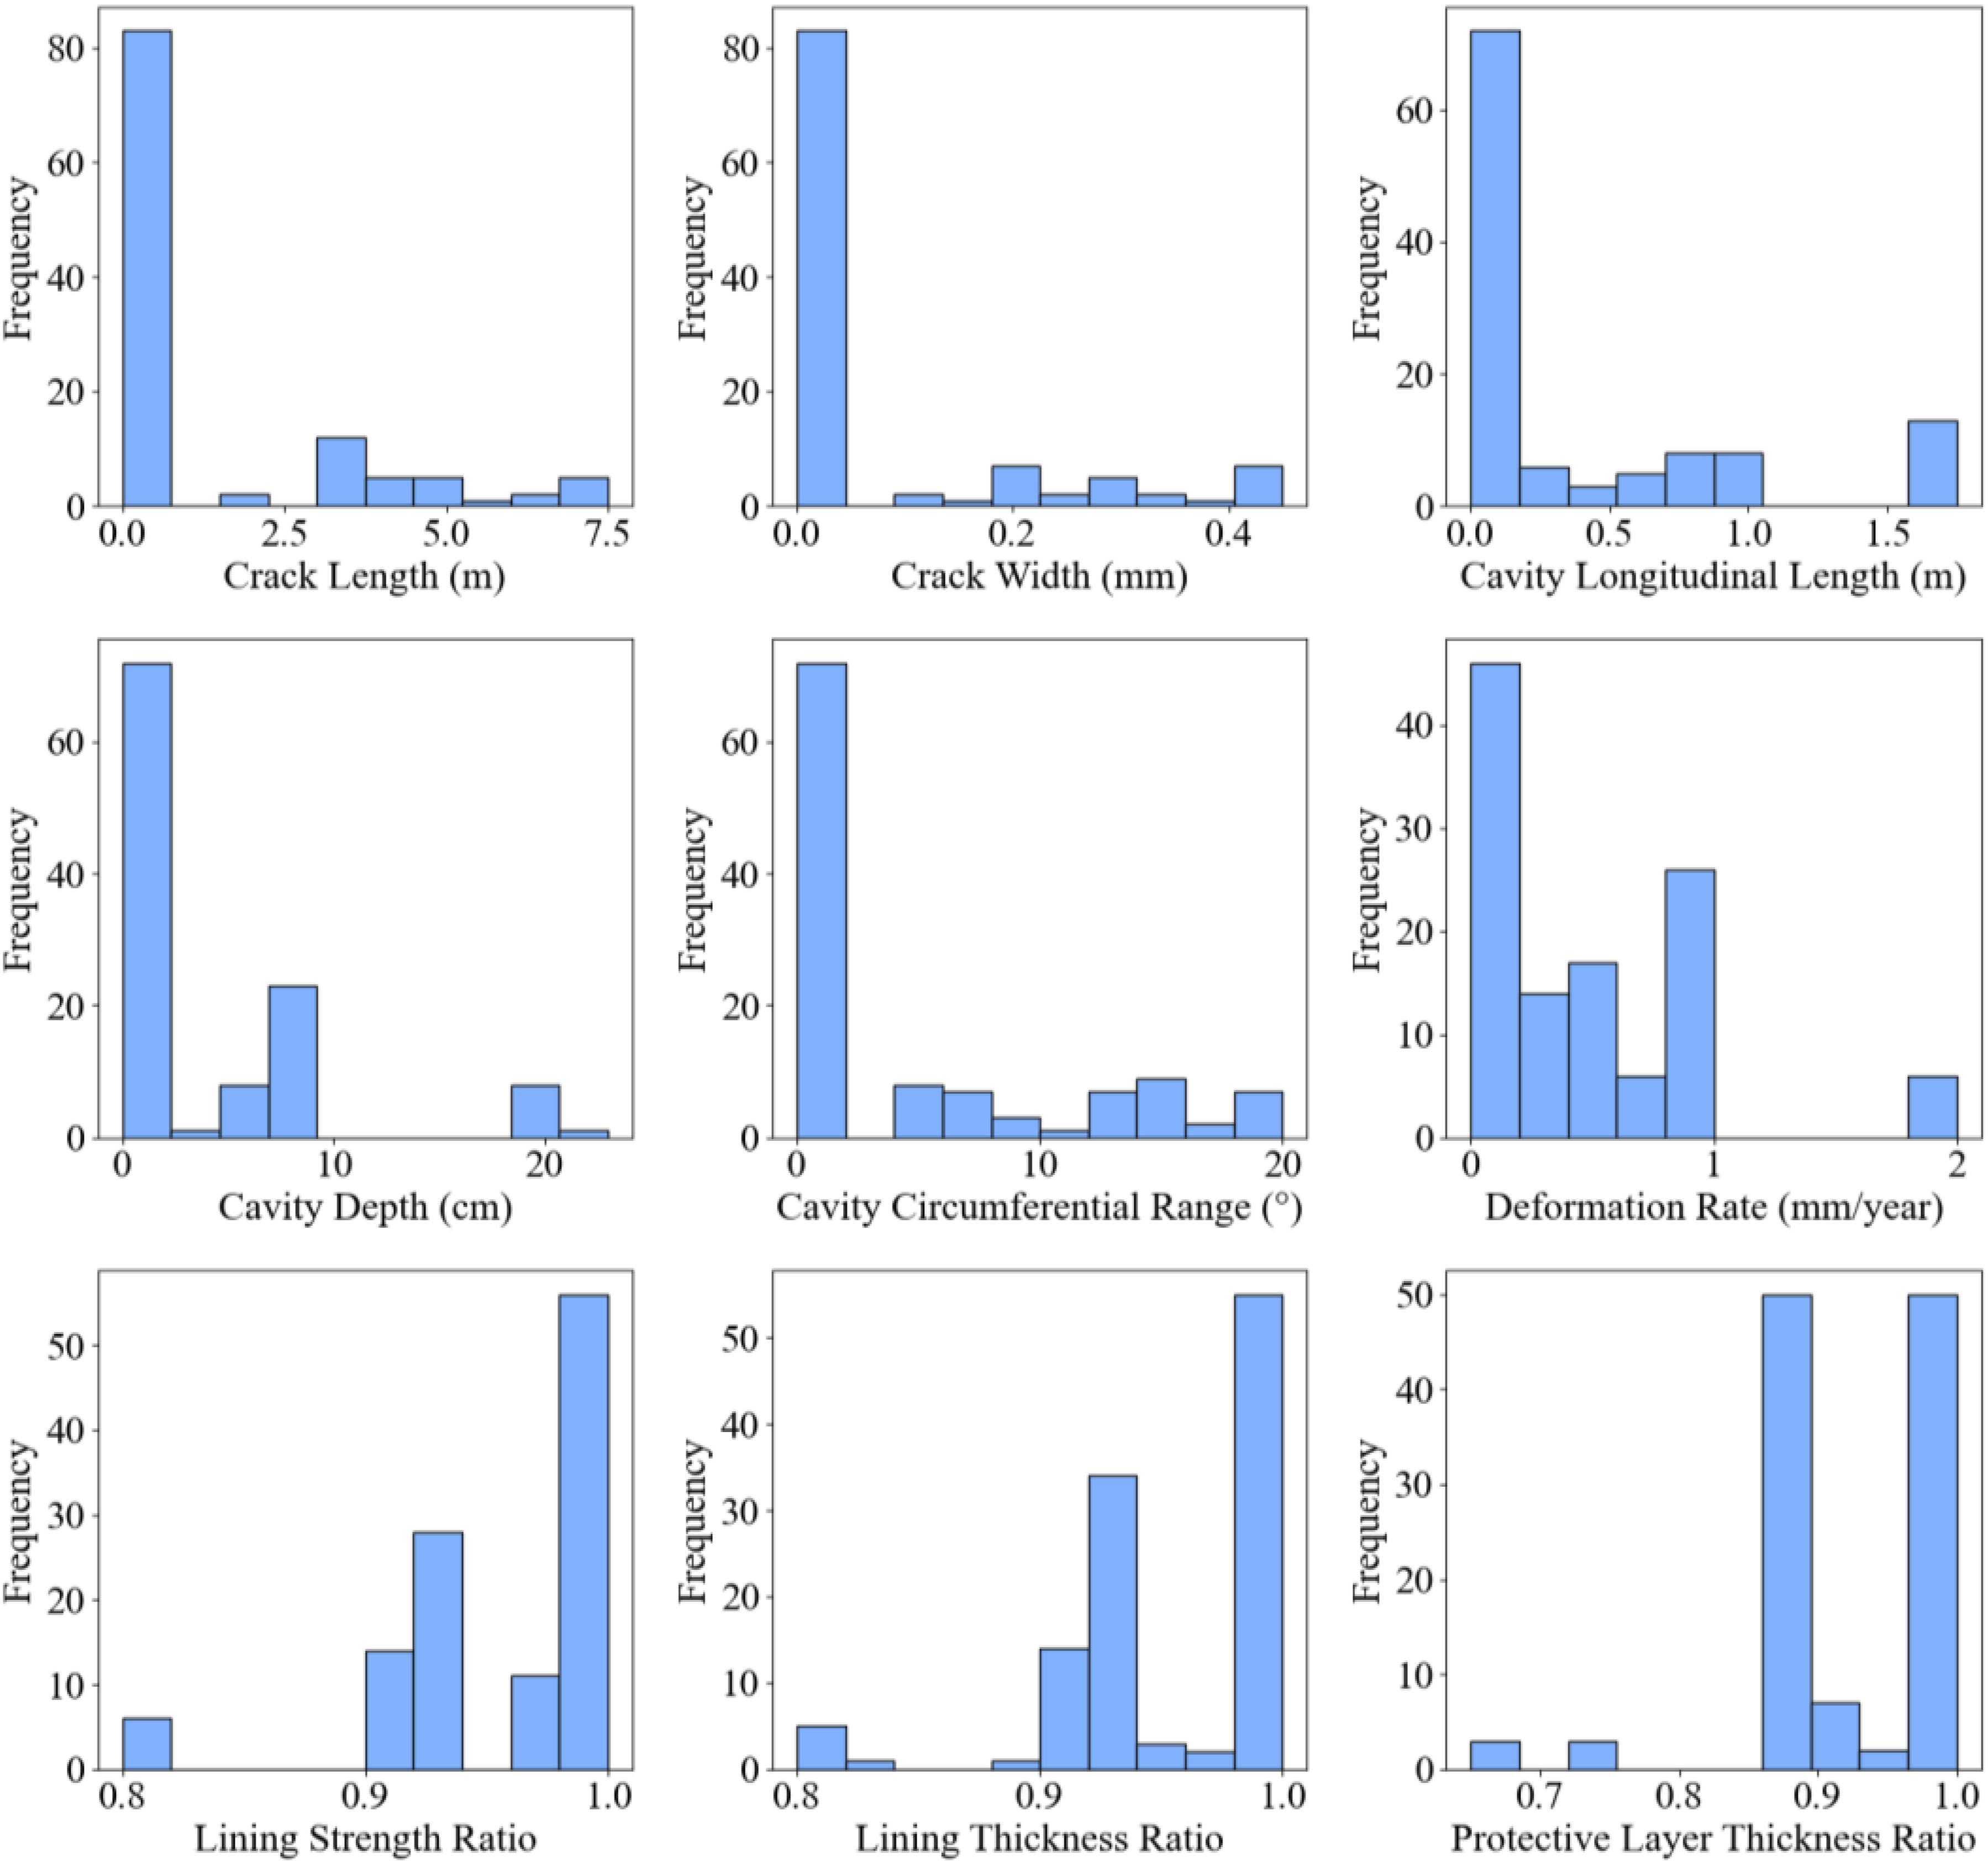
Normalization
In order to ensure a consistent range of values for different features and to avoid feature imbalance during data augmentation due to different magnitudes, the data were usually normalized by Min-Max method, scaling the feature values to the range of [0, 1].
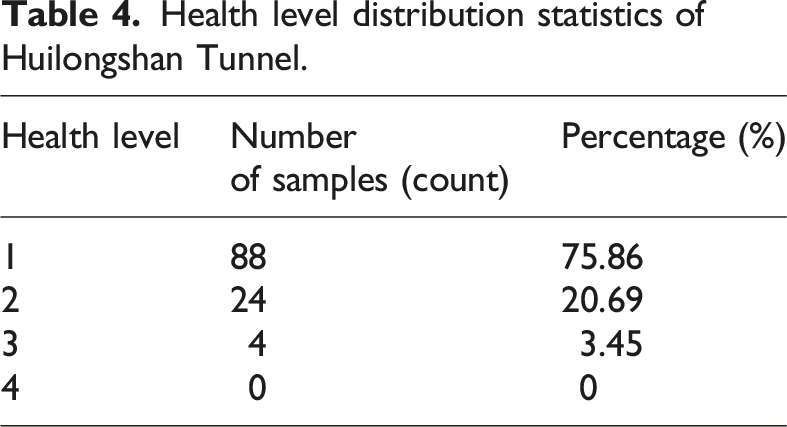
Analysis of data class distribution
Health level distribution statistics of Huilongshan Tunnel.
Methodology
Study step
This study utilized three data augmentation techniques—CTGAN, SMOTE, and CVAE—to address the problems of insufficient data and class imbalance. First, the preprocessed tunnel defect data was analyzed to identify the problems of insufficient data and class imbalance. Next, the data augmentation techniques (CTGAN, SMOTE, and CVAE) were applied to the preprocessed dataset to generate synthetic datasets, and statistical analysis was performed to assess the quality of the synthetic data. Finally, machine/deep learning models were used to validate that the data augmentation techniques effectively addressed the problems of insufficient data and class imbalance.
Data augmentation
In this study, the defects monitoring data of the left line of the Huilongshan Tunnel was used as the true dataset D t , which contains a total of 117 samples. Before data augmentation, the true dataset D t was preprocessed to obtain the preprocessed true dataset D t ', which contains 116 samples. Data augmentation techniques were then applied to D t ' to generate synthetic datasets D s (with synthetic datasets generated by CTGAN, SMOTE, and CVAE being D s1 , D s2 , D s3 , respectively), resulting in a total of 800 samples.
Similarity validation
To validate the quality of the synthetic dataset D s , statistical methods were applied to perform a similarity analysis between D t ' and D s . The descriptive statistics and distribution characteristics of the two datasets were compared to ensure the effectiveness of the synthetic data.
Tunnel health assessment model training and evaluation
After confirming the effectiveness of the synthesized data, the datasets D t ' and D s were split into a training set at a ratio of 70% and a test set at a ratio of 30%, respectively, for training and testing the machine/deep learning models. The performance evaluation on the test set was conducted to verify whether data augmentation effectively alleviated the problems of insufficient data and class imbalance, and to assess whether it improved the model’s generalization ability and evaluation accuracy.
Data augmentation techniques
CTGAN
CTGAN is an extension of the GAN specifically designed to generate synthetic data that adheres to certain conditional constraints. 28 CTGAN consists of a conditional generator (G) and a discriminator (D), and it generates synthetic data that has a similar distribution to true data through adversarial training. The conditional generator (G) takes a batch of random vectors generated from random noise as input, and, in combination with the conditional information, generates corresponding synthetic data. The discriminator (D) is responsible for determining whether the input data is true or synthetic. By comparing the distributions of true data and synthetic data, the discriminator calculates its loss function and updates the model parameters. 29
The core of CTGAN lies in the design of a conditional adversarial training mechanism. To ensure that the generated data is both truthfulness and adheres to specific conditional constraints, CTGAN adopts a loss function based on WGAN-GP (Wasserstein GAN with Gradient Penalty). 30 Specifically, the discriminator’s loss function seeks to maximize the difference between the distributions of true data and generated data. The generator’s loss function, on the other hand, minimizes the objective function, making the synthetic data as close as possible to the true data and satisfying the constraints of the conditional information.
SMOTE
SMOTE is an oversampling technique based on interpolation between samples, commonly used to address problems of class imbalance, particularly when there is a shortage of minority class samples in classification tasks. SMOTE works by generating new synthetic samples between existing samples of the minority class, thereby expanding its distribution. This approach helps to equalize the class proportions in the dataset, enhancing the model’s capability to identify the minority class.12,31 Specifically, SMOTE works in the following steps: (1) For each minority class sample, the Euclidean distance between it and other samples in the dataset is computed to determine the k nearest neighbors; (2) A random sample is chosen from the k nearest neighbors, and interpolation is performed between the current sample and the selected neighbor to generate a new synthetic sample; (3) The procedure continues until enough synthetic samples are generated to reach the desired number of minority class samples.
Through the interpolation-based generation strategy, SMOTE effectively alleviates the class imbalance problem. However, since the sample generation process only considers linear relationships between samples, for datasets with more complex distributions, the synthetic samples generated by SMOTE may deviate from the true data distribution.
CVAE
CVAE is a deep learning model that adopts an autoencoder architecture and combines variational inference methods for probabilistic modeling and generating new datasets. Unlike traditional autoencoders, CVAE introduces latent variable distribution assumptions and additional conditional information during the encoding process. The goal is to learn the probabilistic distribution of the conditional latent space. 32 The structure of CVAE consists of three parts: the encoder, latent space, and decoder. The encoder receives input data along with conditional information, maps them to the parameters of the latent space, and generates the probabilistic distribution of the latent variables. The latent space generates latent variables as compressed representations of the input data. The decoder reconstructs the input data based on latent variables sampled from the latent space and the conditional information. 33
During CVAE training, the goal is to minimize the loss function, ensuring that the generated latent space accurately reflects the structure of the input data and utilizes conditional information to generate data that matches specific classes. The loss function in CVAE consists of two components. The first component is the reconstruction loss, which measures the discrepancy between the input data and the reconstructed data, guiding the decoder to generate samples that resemble the original data. The second component is the KL divergence, which assesses the discrepancy between the latent variable distribution and the standard normal distribution. This encourages the latent space distribution to approach the standard normal distribution while ensuring that the generated data adheres to the given conditional information. 33
Evaluation criteria
Once the synthetic dataset is generated, the quality of the synthetic data is validated using statistical methods and machine/deep learning models to ensure that the synthetic data effectively addresses the problems of insufficient data and class imbalance in tunnel health assessment. 29
Statistical Methods include descriptive statistics and comparison of distribution features. For descriptive statistics, the minimum, maximum, mean, and standard deviation of both true and synthetic datasets are computed, and boxplots are drawn to reflect the data’s dispersion. For distribution features, Q-Q plots are used to visually analyze the distribution of each defect indicator in both true and synthetic data. The Q-Q plot is a common tool for testing normality, with the x-axis representing the theoretical normal distribution quantiles and the y-axis representing the normalized actual data quantiles. Based on tunnel health grades, this method visually verifies whether the distribution of synthetic data for each class matches that of the true data.
In addition, machine/deep learning methods can assess whether the synthetic dataset enables the creation of a more effective predictive model compared to the true dataset. The performance of these models serves as a measure to validate the effectiveness of the synthetic data. In this study, three machine/deep learning models were used to achieve this goal. The specific models are described below.
BP neural network
The BP neural network model employs a Multi-Layer Perceptron (MLP) structure, consisting of multiple fully connected layers. It introduces nonlinearity through the ReLU activation function and maps the input features to classification results layer by layer. During the training process, the cross-entropy loss function is selected as the objective to measure the difference between the model’s predicted probability distribution and the true labels. By minimizing the loss function, the model progressively adjusts the network parameters and updates the weights based on feedback information in each iteration until training is complete.34,35
SVM
SVM is a highly effective machine learning algorithm, particularly effective in solving nonlinear and high-dimensional data pattern recognition problems. In classification tasks, SVM operates by identifying an optimal hyperplane that maximizes the separation between data points from different classes, thus achieving effective classification and improving the model’s generalization ability. 7 The key hyperparameters of SVM are the kernel function and the penalty coefficient. The kernel function maps the data from a lower-dimensional space to a higher-dimensional space, while the penalty coefficient is used to balance the model’s complexity with the training error.
XGBoost
XGBoost is an improved version of the GBDT, which iteratively builds multiple decision trees through the Boosting method to correct the prediction errors of previous models. 36 XGBoost minimizes prediction errors via a gradient descent-based optimization process. This process minimizes the objective function, which is composed of a loss function and regularization terms. The loss function measures the error between the predicted and true values, assessing the model’s fit to data. The regularization term controls the number of leaf nodes and their weights, balancing the model’s complexity and generalization ability.
To evaluate the performance of the above models, four evaluation metrics are used: accuracy, precision, recall, and F1 score. These four metrics are widely adopted and well-suited for multi-class classification tasks. Accuracy provides an overall performance measure, while precision, recall, and F1 score offer detailed insights into classification effectiveness. In contrast, metrics such as AUC-ROC and MCC are typically designed for binary classification and are less interpretable in the multi-class context of tunnel health assessment. Therefore, we adopted these four metrics to ensure consistency and interpretability across the evaluation process.
Results and analysis
Design parameters of data augmentation models
CTGAN model
In this study, the CTGAN model was used for data augmentation, and the model was trained using the Python library ctgan. The model design parameters are as follows: • epochs = 5000: The model is trained for 5000 epochs; • batch_size = 100: In each iteration, 100 samples will be randomly selected from the data; • generator_lr = 2e-4, discriminator_lr = 2e-4: The learning rates for both the generator and discriminator are 2e-4; • generator_dim = (256, 256), discriminator_dim = (256, 256): Both the generator and discriminator networks consist of two layers, each containing 256 neurons.
SMOTE model
In this study, the SMOTE model was used for data augmentation, implemented using the SMOTE class from the imblearn library. The model design parameters are as follows: • k_neighbors = 4: The number of nearest neighbor samples for generating synthetic samples is 4; • samples_strategy = {1: 488, 2: 264, 3: 164}: Specifies the number of samples to be added to each class. Class 1 is increased by 400 samples, Class 2 by 240 samples, and Class 3 by 160 samples.
CVAE model
In this study, the CVAE model was used for data augmentation, implemented using the PyTorch library. The model design parameters are as follows: • nput_dim = 13: The feature variables are 13; • num_classes = 3: The target variable consists of 3 classes; • fc1 = 256, fc2 = 128, fc3 = 128, fc4 = 256: The encoder contains two fully connected layers: 256 neurons in the first and 128 neurons in the second. The decoder also contains two fully connected layers: 128 neurons in the first and 256 neurons in the second; • epochs = 100: The model is trained for 100 epochs; • optimizer = Adam (lr = 0.0005): The Adam optimizer is used with a learning rate of 0.0005.
Validation of synthetic datasets
Based on statistical methods
As described in “Study step”, this study applied three data augmentation techniques to the preprocessed true dataset D t ' (116 samples), generating the synthetic dataset D s (800 samples). Therefore, this section primarily compared the statistical features of D t ' and D s , specifically the comparison of descriptive statistics and distribution characteristics. Since the dataset contains 13 damage indicators, only a subset of representative indicators is presented in this study.
The statistical indicators of D t '.
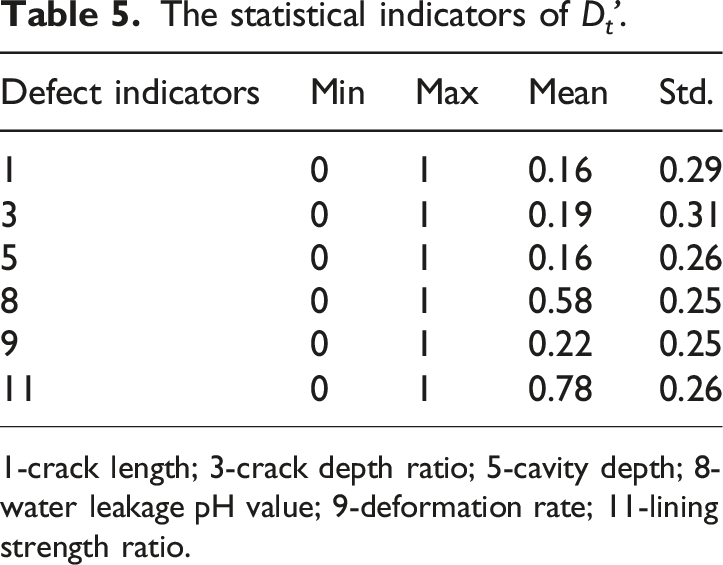
1-crack length; 3-crack depth ratio; 5-cavity depth; 8-water leakage pH value; 9-deformation rate; 11-lining strength ratio.
The statistical indicators of D s .
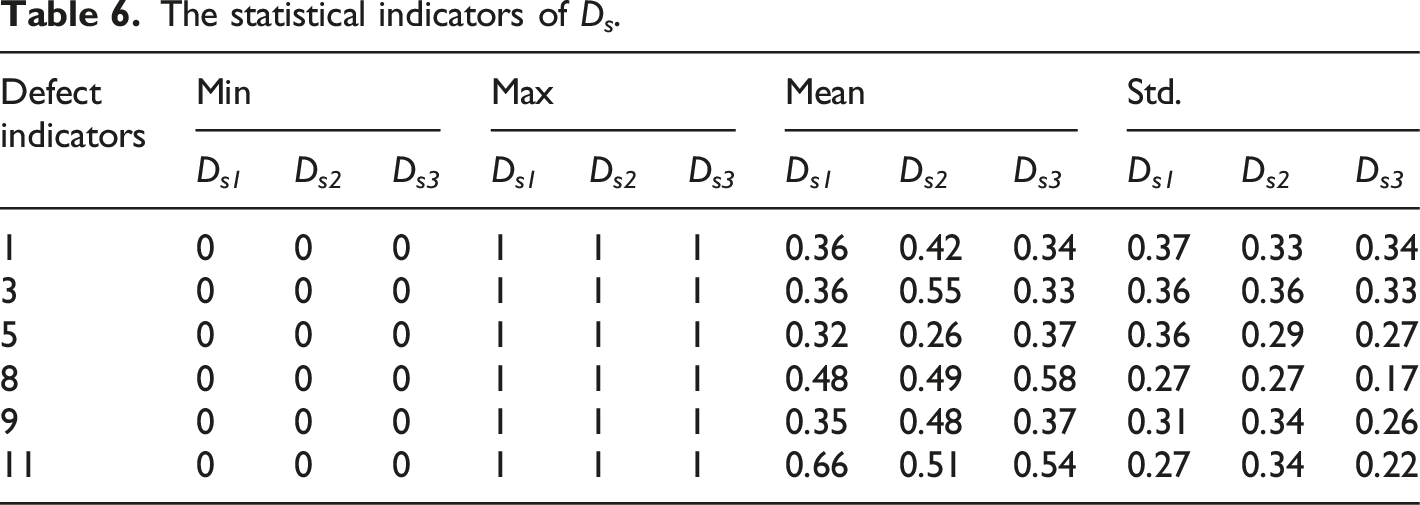
Figure 3 presents the boxplots for the dataset D
t
' and D
s
. As shown in the figure, D
s1
performed the best cross multiple features. For crack length, crack depth ratio, and cavity depth, although Ds1 had a wider distribution range, its median aligned well with the true dataset, and no outliers were present. For water leakage pH value, deformation rate, and lining strength ratio, D
s1
's distribution range closely matched that of the true dataset, with no significant outliers and lower data dispersion. The boxplots of D
t
' and D
s
. (a) D
t
' and (b) D
s
.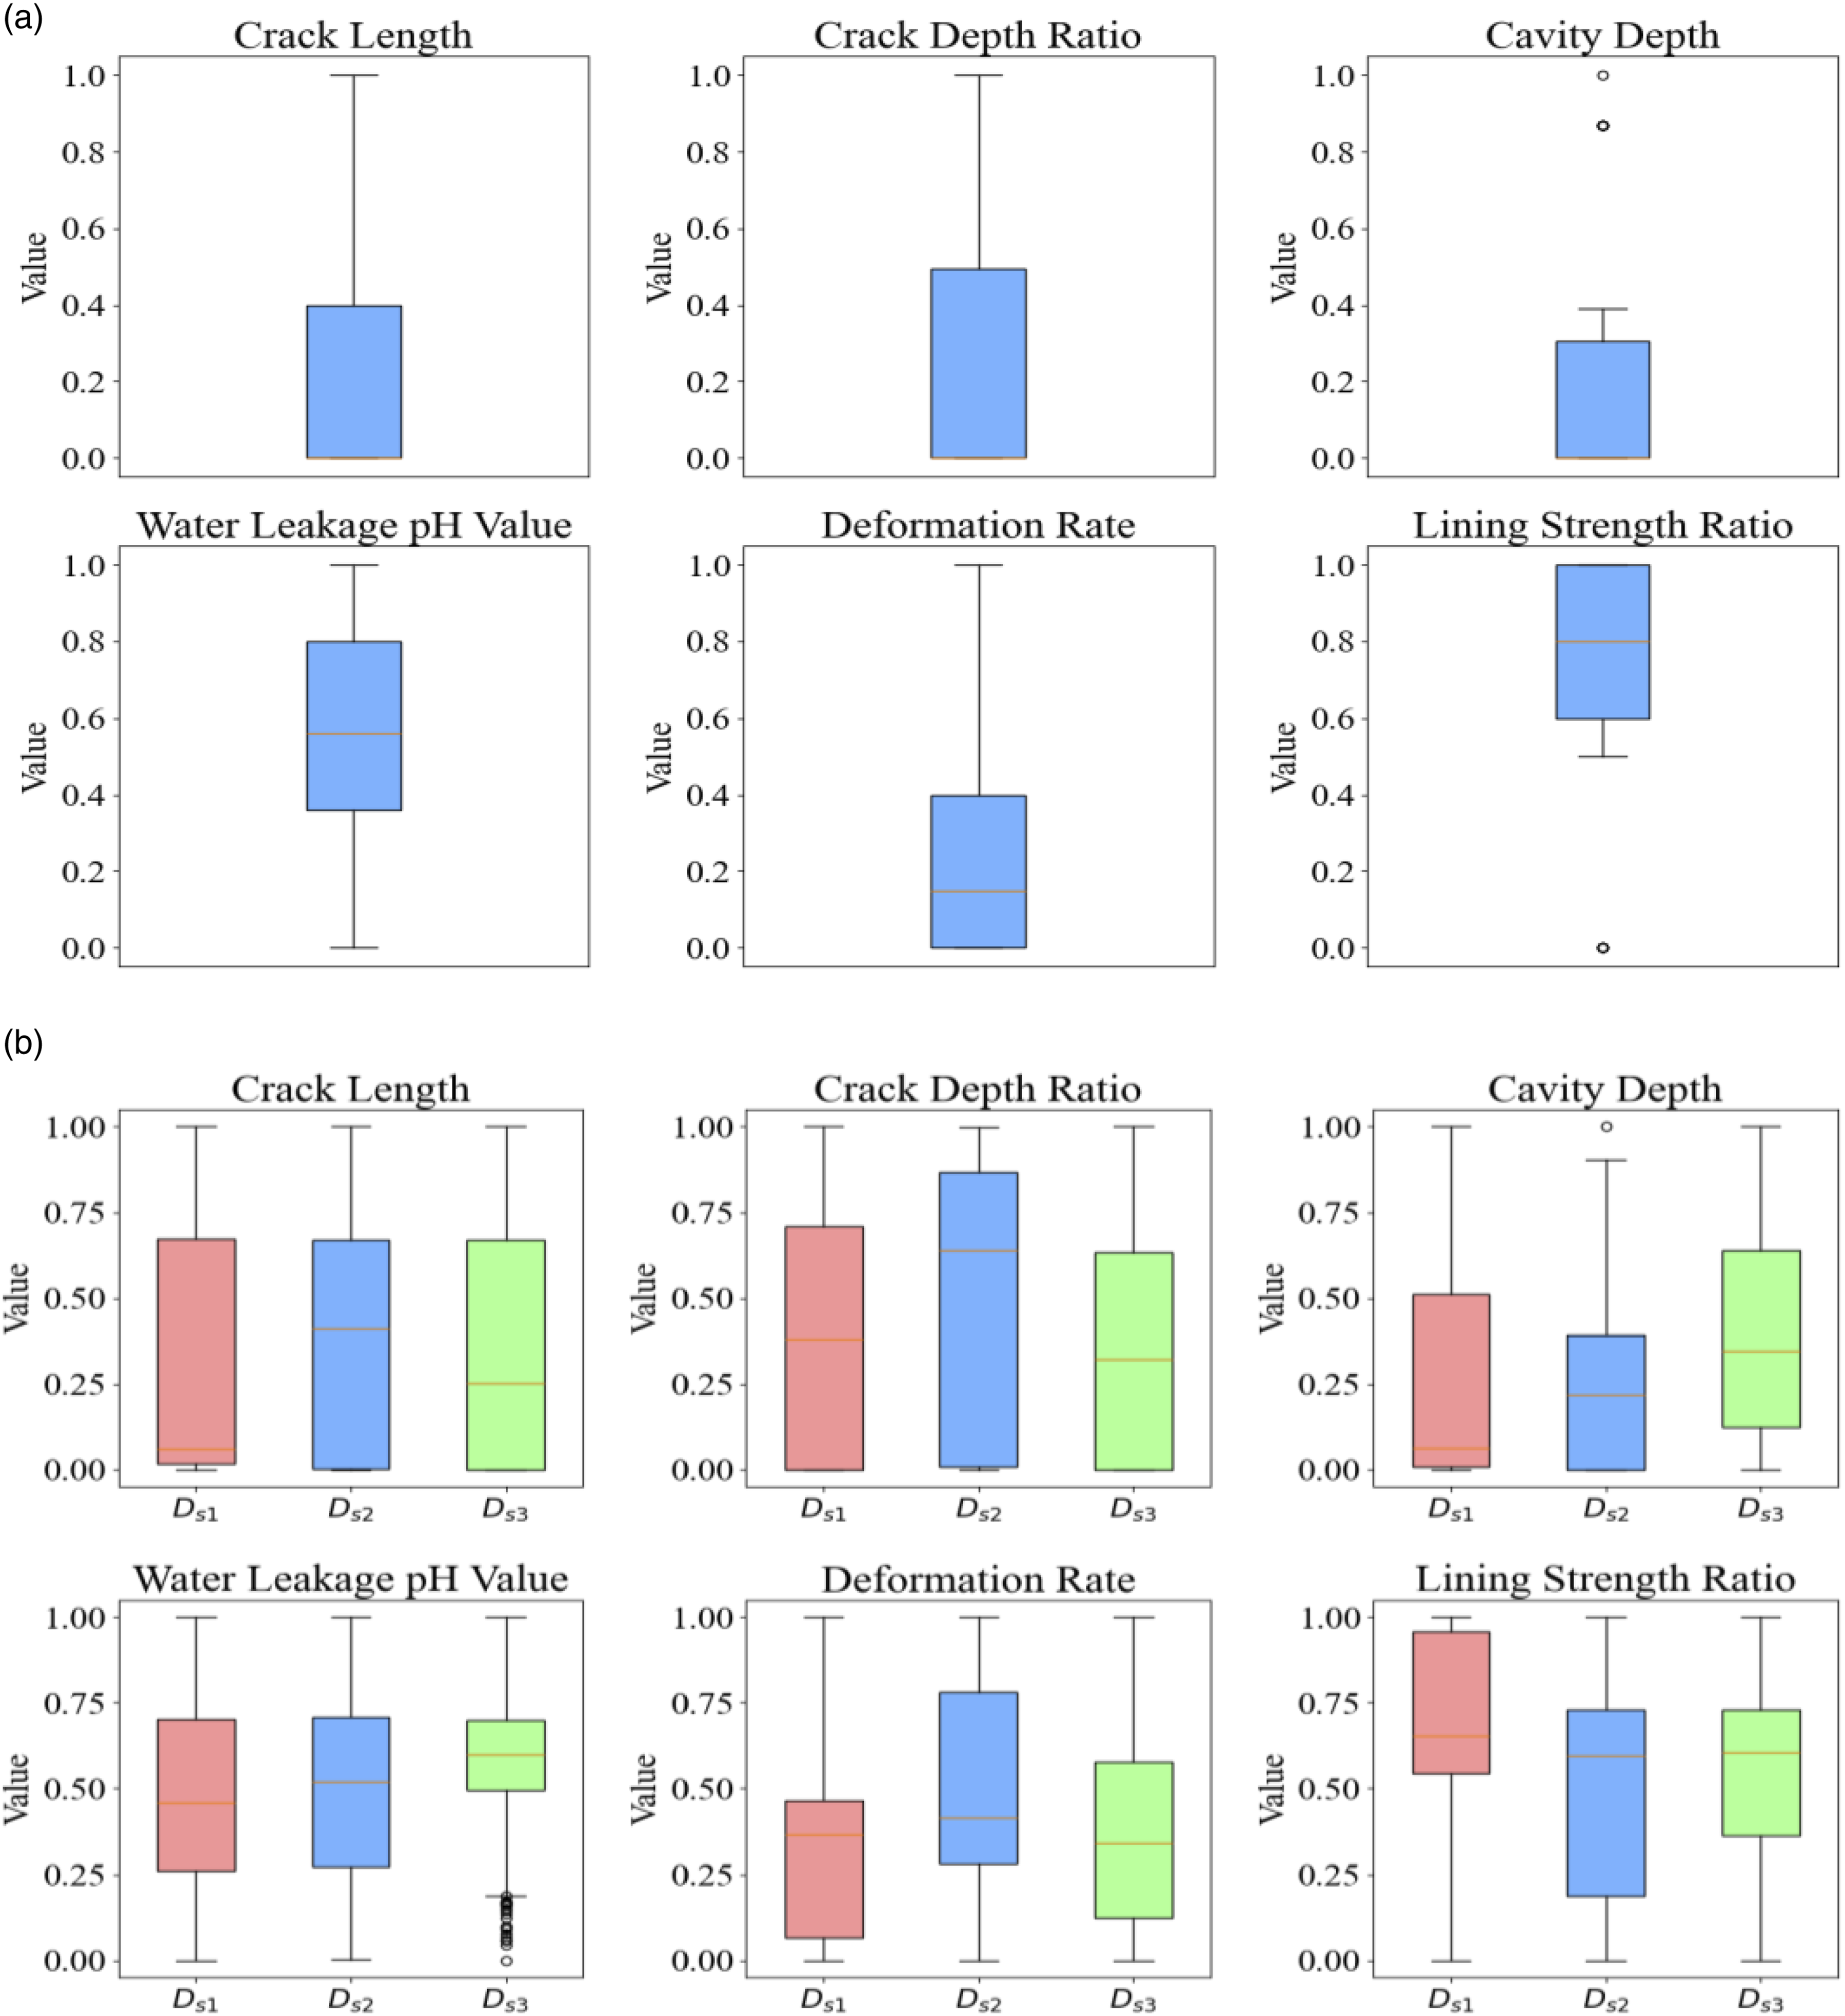
Figure 4 shows the Q-Q plots for the dataset D
t
' and D
s
. According to the plots, it was clear that D
s1
significantly improved the balance of the data’s class distribution and ensured that the generated data fitted the true dataset with high consistency. This was especially evident in features such as crack length and water leakage pH value, where the generated data exhibited smooth distributions that closely aligned with the statistical properties of the true data. In contrast, while D
s2
effectively increased the number of samples, its feature distribution showed higher dispersion, particularly in the fitting of the higher and lower percentiles. D
s3
appeared as three parallel straight lines, failing to capture the complexity present in the true data, resulting in overly simplified distributions that lack the ability to simulate the diversity of the true data. Overall, D
s1
better modeled the complexity of the true data, particularly excelling in terms of distribution balance and fit. The Q-Q plots of D
t
' and D
s
. (a) D
t
', (b) D
s1
, (c) D
s2
, and (d) D
s3
.
Based on machine/deep learning methods
As described in Section 3.3, this section used three machine/deep learning models (BP neural network, SVM, and XGBoost) to validate the effectiveness of the synthetic datasets. The true dataset D t ' and the synthetic dataset D s were split into a training set at a ratio of 70% and a test set at a ratio of 30%, respectively. Grid search combined with 10-fold cross-validation is used for model training.
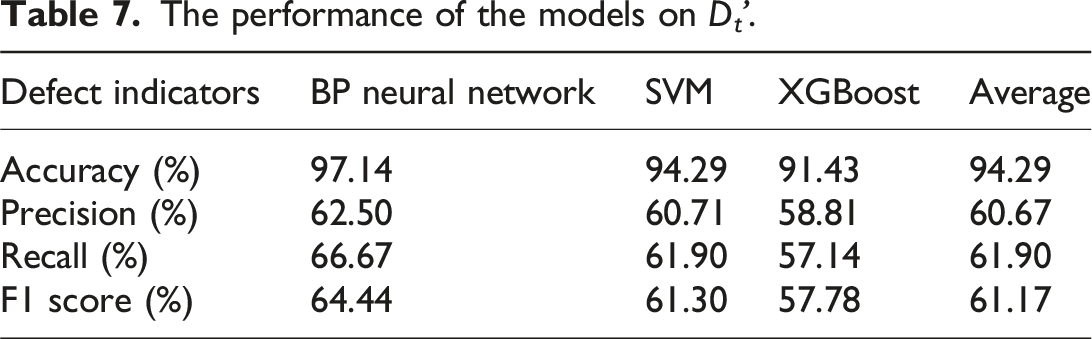
The performance of the models on D t '.
The performance of the models on D s .
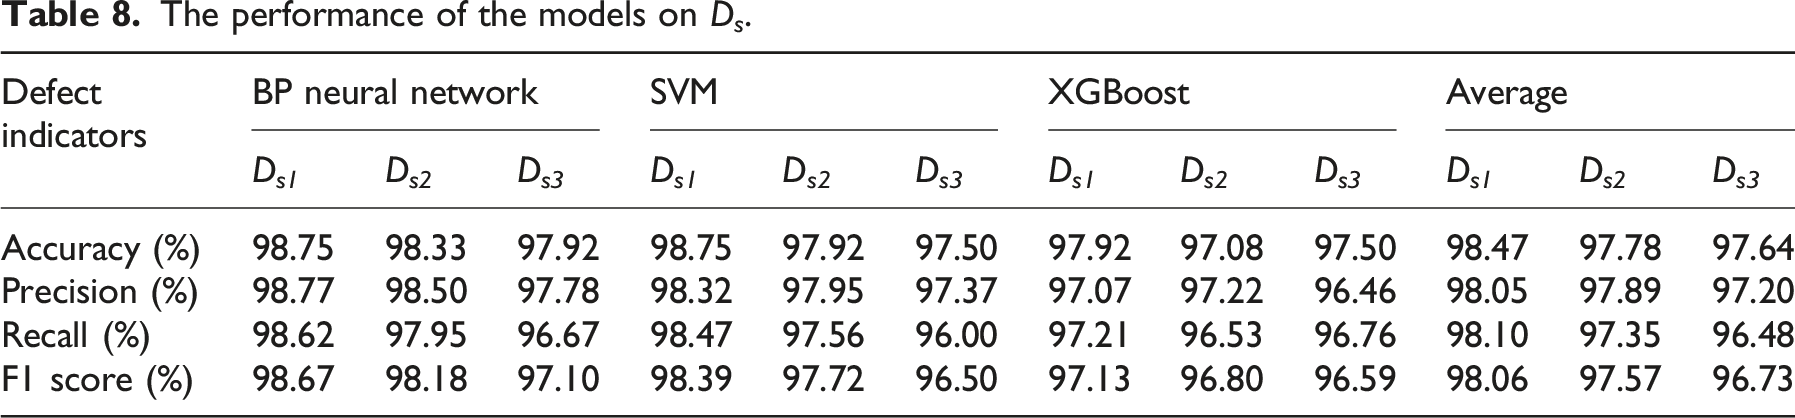
Furthermore, the performance improvements from data augmentation varied across the three models. The BP neural network showed the most significant improvement when trained with the augmented datasets, particularly with D s1 generated by CTGAN. This may be attributed to its reliance on large and diverse datasets to capture nonlinear feature relationships. SVM also benefited from data augmentation but appears more sensitive to the distribution of synthetic samples, possibly due to its dependence on clearly defined decision boundaries. XGBoost exhibited relatively stable performance across all datasets, reflecting its inherent robustness and ability to handle small or imbalanced datasets effectively. Among the three augmentation methods, CTGAN consistently enhanced model performance across all classifiers, whereas SMOTE and CVAE showed model-dependent effectiveness. These results suggested that both the choice of augmentation method and classifier affected the model’s sensitivity to synthetic data and overall performance.
Results
Based on the comprehensive analysis using statistical methods and model validation, the synthetic dataset D s1 performed the best in terms of data augmentation and model training evaluation. Through the comparison of statistical indicators, boxplots, and Q-Q plots, D s1 outperformed the other synthetic datasets (D s2 , D s3 ) and the true dataset D t ' in simulating the statistical properties of true data and fitting the data. In the training and evaluation of machine/deep learning models, D s1 achieved the best performance in accuracy, precision, recall, and F1 score, significantly improving the model’s classification performance. This validated that the CTGAN method effectively enhanced the model’s generalization ability and evaluation accuracy.
Moreover, the defect data was classified into three health levels: Level 1, Level 2, and Level 3. The data distribution for D t ' was highly imbalanced, with 75.86% (88 samples), 20.69% (24 samples), and 3.45% (4 samples) for the three classes, respectively. In contrast, D s1 adjusted the data distribution to 50.75% (406 samples), 32.38% (259 samples), and 16.88% (135 samples), significantly increasing the number of samples in the minority classes. This effectively alleviated the problems of insufficient data and class imbalance.
In summary, the synthetic data generated by the CTGAN method not only improved the statistical rationality of the data but also enhanced the model’s classification performance and generalization ability. It provided a more stable and reliable data foundation for tunnel health assessment tasks.
Conclusion
This study applied three data augmentation techniques—CTGAN, SMOTE, and CVAE—to address the problems of insufficient data and class imbalance in tunnel health assessment. The results demonstrate the effectiveness of data augmentation in tunnel health assessment, particularly in improving model performance and data quality. The main conclusions are as follows.
First, applying data augmentation method proves to be an effective solution for addressing insufficient data and class imbalance in tunnel health assessment datasets. By generating synthetic data with a similar distribution to true data, data augmentation significantly expands the dataset size and addresses the challenges of manual data collection, particularly in situations where sample availability is limited.
Second, the synthetic dataset D s1 generated by CTGAN exhibits high consistency with the statistical properties and distribution of the true dataset. The comparisons of statistical indicators, boxplots, and Q-Q plots indicate that the synthetic data not only preserves the inherent characteristics of the true data but also improves dataset balance and diversity, providing more comprehensive training data for tunnel health assessment models.
Finally, through the training and evaluation of machine/deep learning models (BP neural network, SVM, and XGBoost), it is verified that the synthetic data D s1 generated by CTGAN improves model classification performance and prediction accuracy. This demonstrates its significant potential for application in tunnel health assessment tasks.
Supplemental Material
Supplemental Material - Application of data augmentation techniques in tunnel health assessment
Supplemental Material for Application of data augmentation techniques in tunnel health assessment by Jinglong Li, Xiufang Zheng, Diyang Chen, Lin Yang, Yupeng Cui, Kejin Li, Zengliang Song and Hui Chou in Journal of Computational Methods in Sciences and Engineering
Footnotes
Funding
The author(s) disclosed receipt of the following financial support for the research, authorship, and/or publication of this article: The authors acknowledge financial support from the National Key Research and Development Program of China (No. 2024YFF0507902) and the University Research Project on Intelligent Detection and Rapid Remediation Technologies and Equipment for Tunnel Secondary Lining Quality (No. zy20240101).
Conflicting interests
The author(s) declared no potential conflicts of interest with respect to the research, authorship, and/or publication of this article.
Supplemental Material
Supplemental material for this article is available online.
References
Supplementary Material
Please find the following supplemental material available below.
For Open Access articles published under a Creative Commons License, all supplemental material carries the same license as the article it is associated with.
For non-Open Access articles published, all supplemental material carries a non-exclusive license, and permission requests for re-use of supplemental material or any part of supplemental material shall be sent directly to the copyright owner as specified in the copyright notice associated with the article.