
Abstract
How to fairly evaluate the state of the innovation and entrepreneurship ecosystem given the fast growth of creativity and entrepreneurial activities has become a crucial question. Conventional assessment techniques can depend on empirical indicators or basic statistical models, which are challenging to expose the complicated dynamic interactions and inherent rules of the system. Thus, this work suggests an intelligent evaluation approach including causal inference and deep representation learning for innovation and entrepreneurial environments. Deep representation learning extracts the system features; causal inference reveals the causal relationship between variables, so enhancing the operability and assessment accuracy. Specifically, the intelligent assessment method proposed in this study achieves a mean square error (MAE) of 0.149, which is significantly lower than other traditional methods. In terms of causal effect estimation, the estimation of this method is 0.92, which is much higher than other models. On structural Hamming distance (SHD), the present method is only 4, indicating its high accuracy in causal structure identification. The approach offers fresh concepts and technical support for the intelligent evaluation of ecosystems of innovation and entrepreneurship.
Keywords
Introduction
The fast expansion of worldwide innovation and entrepreneurial activity makes innovation and entrepreneurship ecosystems more and more crucial in advancing social vitality and economic progress. Apart from the several kinds of entrepreneurial entities (e.g., businesses, governments, investors, research institutes, etc.), innovation and entrepreneurship ecosystems comprise intricate elements including multi-level interactions, resource flows and policy effects. 1 The current focus in academia and practice on assessment methods for innovation and entrepreneurship ecosystems is on how to comprehensively and accurately assess the health and development potential of these systems. However, traditional methods usually rely on empirical data or basic statistical models, which make it difficult to clearly reveal the intrinsic patterns and dynamic changes in complex systems. But conventional tests typically rely on empirical data or basic statistical models, which cannot clearly expose the inherent laws and dynamic changes in intricate systems.
Deep learning and causal inference methods in complex system analysis have attracted much attention recently. By automatically extracting implicit features from high dimensional data, deep representation learning helps assessment models to more effectively capture system underlying patterns. 2 Conversely, causal inference offers a strong instrument for exposing the causal links among variables in a system, therefore promoting a better knowledge of the fundamental processes of system evolution. These approaches taken together have produced meaningful research with not only notable increases in prediction accuracy but also explanations of causative mechanisms and improve the actionability of assessment findings.
There are still certain limits in the present research even if some studies based on machine learning and causal reasoning applied to the evaluation of creative entrepreneurial ecosystems have been made. Most of the current approaches lack an efficient mix of the two and concentrate on one activity, such basic feature extraction or causal inference. 3 For instance, despite their successes in feature classification and prediction accuracy, conventional machine learning algorithms such as Support Vector Machine (SVM) and Random Forest often fail to completely grasp the complicated nonlinear relationships in the data and lack causal mechanism explanations. 4 Furthermore, although able to expose causal relationships between variables, causal inference techniques such models based on Structural Equation Modelling (SEM) or Bayesian Network usually depend on hypothetical premises by themselves, are unable to effectively deal with the effects of multiple nonlinearities in high-dimensional data and have high requirements for data preprocessing and model selection. Among the dynamic changes and interacting impacts among the elements in the innovation and entrepreneurship ecosystem, these approaches sometimes overlook. In a multivariate context, for instance, elements like policy changes, market demand variations, and technology breakthroughs may interact with one another and it is challenging for current approaches to take these multi-dimensional interactions simultaneously under consideration.
The goal of this research is to propose a new intelligent assessment methodology that improves the accuracy and tractability of assessment of innovation and entrepreneurial ecosystems by combining deep representation learning and causal inference. The following mostly reflects the innovations of this work: (1) Integration of deep representation learning and causal inference: Overcoming the issue of inadequate causality explanation in current studies, a new assessment framework combining deep representation learning and causal inference is proposed, which is able to profoundly reveal the causal relationships among variables in the innovation and entrepreneurship ecosystem on basis of feature extraction. (2) Construction of a multi-dimensional comprehensive assessment model: Not only can a comprehensive assessment model help to identify important elements in the innovation and entrepreneurship ecosystem, but it can also dynamically capture the complexity in the evolution of the system, so offering more accurate and complete assessment results. (3) Improving the operability and prediction accuracy of the model: While the prediction accuracy has significantly improved, providing more practical decision-making support for policymakers and businesses, the model’s operability in real-world applications is enhanced by optimising the combination of deep representation learning and causal inference.
Relevant technologies
Deep representation learning
Deep representation learning is a technique for autonomously obtaining high-dimensional feature representations from raw data employing deep neural networks. Unlike conventional feature extraction techniques, deep representation learning is extensively applied in fields including image recognition, natural language processing, and recommender systems since it can extract features with high semantic information from a great volume of complex data by multilayer nonlinear transformations.
Autoencoder is a standard unsupervised learning technique in the setting of deep representation learning. Through an encoder, an autoencoder maps the input data to a low-dimensional potential space; subsequently, a decoder reconstructs the input data.
5
Minimising the difference between the input and reconstructed data is the aim; the Mean Square Error (MSE) is often the loss function: Loss variation during autoencoder training process.

As training progresses, the MSE loss function decreases, indicating that the model is learning a low-dimensional representation of the data. Specifically, as the difference between the input data and the reconstructed data gradually decreases, the loss function stabilises, indicating that the model has converged.
Furthermore, principal component analysis (PCA) may usually be used on the low-dimensional data output by the encoder to translate the features to a two-dimensional space for simple visualisation thereby enabling further analysis of the features collected by the self-encoder.
6
Figure 2 shows the low-dimensional feature distribution following PCA downscaling, so clarifying the primary direction of change in the data and the way the self-encoder identifies salient characteristics of the data. Low-dimensional feature distribution after PCA downscaling.
In Figure 2, ‘Component 1’ and ‘Component 2’ represent the two main directions after dimensionality reduction by PCA. These directions are the main features extracted from the original data and are used to visualise a low-dimensional representation of the data.
In theory, Component 1 and Component 2 are independent, but presenting them in a two-dimensional diagram is intended to provide a more intuitive understanding of the main directions of change in the data. This visualisation method helps to further analyse the characteristics of the data.
Convolutional Neural Networks (CNNs), on the other hand, are deep learning methods that excel in computer vision tasks. Through a convolutional operation, CNNs automatically extract local features in an image; subsequently, via several convolutional and pooling layers, they extract progressively abstract features, finally for image classification or target recognition. The convolution operation’s formula is:

In the convolution operation, the value of x is the pixel value of the image. The value of x is chosen to extract local features of the image by the convolution operation. Specifically, the value of x is determined based on the actual pixel values of the image so that the model can learn the important features in the image.
An extension of unsupervised learning, self-supervised learning seeks to build auxiliary tasks (e.g., missing portion of data) thereby learning deep-level representations of data. Self-supervised learning enables feature learning in the picture domain by projecting portions of pixels or image areas.
8
For instance, its loss function often employs a cross-entropy loss function, represented as:

Using latent variable models, variational autoencoder (VAE) is a generative model creating data. Two components comprise the loss function in VAE: the reconstruction error and the KL scatter, which gauges the variance between the prior and variational posterior distributions. One may write its loss function as:

By means of adversarial training, generative adversarial networks (GANs) serve as a deep generative model to maximise the generator and discriminator performance. Adversarial training’s objective function is:

Equation (5) is the objective function of GAN to optimise the performance of the generator and discriminator. Through adversarial training, the GAN is able to generate very realistic data samples. The importance of equation (5) is that it enables the generator to generate high quality data samples through the optimisation of the game between the generator and the discriminator, which improves the generative and generalisation capabilities of the model.
By automating feature learning and minimising the laboriousness of hand feature construction, deep representation learning can overall derive meaningful representations from vast-scale complex data. Deep representation learning will become ever more significant in all kinds of intelligent evaluation techniques as processing capability increases and algorithms are continuously optimised.
Causal inference
Unlike simply correlations, causal inference seeks to find and deduce causal links from data. Particularly when trying to forecast the influence of changes in particular aspects on the system as a whole, causal inference is essential in innovation and entrepreneurial ecosystems to grasp the impacts of many elements and their interactions. By explicitly defining the ideas of intervention and counterfactual, causal inference is able to identify and estimate causal effects unlike conventional statistical analyses, therefore offering a consistent basis for decision-making. 10
Usually embodied by the Rubin Causal Model (RCM), the Potential Outcomes Framework is one of the fundamental models for causal inference.
11
Under this model, the Potential Outcome without Intervention is Y0(i) and the Potential Outcome at Intervention T = 1 is Y1(i). Mathematically stated as the difference between the results under intervention and non-intervention, the individual causal impact ΔY(i) is:

The missing data of the Latent Outcomes Framework, that is, the impossibility to track the results of individuals in both intervention and non-intervention contexts, present challenges. Causal Graph Models, using Directed Acyclic Graphs (DAGs), show causal links between variables in order to solve this problem.
12
Nodes stand in for variables; arrows show causal relationships. Dependencies between nodes are found by means of d-separation, therefore streamlining the model. Do operations in intervention analysis serve as interventions on the variables and assist in the conditional probability distribution estimation following the intervention.

In observed data, a widely used technique of causal inference is Propensity Score Matching (PSM).
21
Usually, logistic regression models utilising the formula estimate propensity scores:

Figure 3 illustrates the distribution of propensity scores for the treatment and control groups using the PSM approach. As depicted in the figure, effective matching enhances the comparability of the two groups in terms of their propensity scores, thereby reducing the impact of confounding bias, even in the presence of disparities in their distributions. Schematic diagram of propensity score matching.
Another often used causal inference method to handle endogeneity, that is, the bias produced when the error term and the independent variable have a correlation, is instrumental variabilities (IV). Two criteria must be satisfied by the instrumental variable Z: first, Z is connected with the independent variable X; second, Z is uncorrelated with the error term ϵ. The instrumental variable method’s estimating formula is:

These approaches offer a scientific basis for decision-making and assist research to precisely evaluate the influence of several elements in complicated innovation and entrepreneurial ecosystems.
Smart assessment methods for innovation and entrepreneurship ecosystems
Design and implementation
Aiming to provide accurate assessment for innovation and entrepreneurship ecosystems, the design and implementation of the intelligent assessment method for innovation and entrepreneurship ecosystems combines two fundamental technological frameworks, deep representation learning and causal inference, with each other. Key components of the complete method design include data gathering and preprocessing, deep representation learning method, causal inference framework, the integration of the two, and training and optimisation of the assessment model; the specific framework is shown in Figure 4. Intelligent assessment method framework for innovation and entrepreneurship ecosystem.
Data acquisition and preprocessing
Data collecting seeks to compile multi-dimensional knowledge on business finance, market performance, R&D, and technological innovation. Raw data must be pre-processed to guarantee its consistency, accuracy, and completeness given the range of data sources and formats.
13
Data cleansing, missing value handling, normalisation, feature selection, and dimensionality reduction constitute part of the preprocessing activities. Usually, mean values cover for missing values:


By means of these data preprocessing activities, the data quality can be sufficiently enhanced to provide accurate and reliable inputs for the next deep representation learning and causal inference, so guaranteeing the high efficiency and stability of the intelligent assessment method of innovation and entrepreneurship ecosystem.
Deep representation learning methods
Deep representation learning draws features from multi-source data in evaluating creative entrepreneurship ecosystems. Self-encoders train to minimise the difference between the input and reconstructed data and use unsupervised learning to acquire low-dimensional properties of the data.
15
This work makes use of a loss function formula as follows:

The role of the loss function in model optimisation is to measure the difference between the predicted and true values of the model. In this study, the loss function is used to optimise not only the deep representation learning model but also the causal inference model. By minimising the loss function, the model is better able to learn the features of the data and the causal relationships between the variables, thus improving the accuracy of the evaluation results.
A back-propagation approach using gradient descent updates the weight parameters in the network, therefore optimising the self-encoder. Gradient descent’s updating rule is:

Framework for causal inference
Common causal graphical models (DAGs) represent causal relationships between variables through directed acyclic graphs, which can show causal paths more intuitively, but their limitation is that they need to identify and represent all potential causal relationships accurately, but the PSM approach balances the distribution of characteristics between treatment and control groups by estimating propensity scores, thus reducing confounding bias.
Evaluating ecosystems of innovation and entrepreneurship depends on the causal inference framework. It clarifies how elements influence general performance and enables one to deduce causal linkages from data to guide decisions.
In this work, a causal diagram model helps to develop a causal diagram model so expressing the causative linkages between several variables.
16
It is hypothesised that there is a set of variables whereby directed edges between nodes show the causal effect of one variable on another. One may visualise the framework of a causal network as follows:

This study employs regression analysis to quantify the strength of the effect of the independent variable (e.g., businesses’ technical innovation inputs) on the dependent variable (e.g., firm performance) thereby deduce causal effects. Presumably, a causal model is:

This study estimates the treatment impact by matching like sample populations when the causal effect cannot be obtained directly from the observed data using the PSM approach. Using a logistic regression model with the following formula helps one to estimate the propensity score:

Equation (18) is used to estimate the propensity score, which is the core of the PSM method. By estimating the propensity score, confounders can be effectively controlled for, leading to more accurate estimates of causal effects. Equation (18) is important because it provides a way to balance the distribution of characteristics between the treatment and control groups, thereby reducing confounding bias.
Integration of deep representation learning and causal inference
Deep representation learning combined with causal inference can overcome the constraints of a single method when intelligently evaluating innovation and entrepreneurship ecosystems. While the latter creates causal diagrams to resolve the relationships between elements (e.g., technological innovation, market feedback, and enterprise growth), revealing important drivers and their mechanisms of action, the former extracts low-dimensional features of complex data by means of self-encoders.
In this work, a combined optimisation approach combines causal inference with deep representation learning. Initially, a deep self-encoder compiles low-dimensional feature representations from the raw data:

A causal inference model is then fed these low-dimensional feature representations to examine, in the innovation and entrepreneurship ecosystem, the impact of individual attributes on target variables (e.g., company performance, innovation output, etc.). Constructing a causal diagram with the phrase helps the causal inference model to deduce causal linkages among variables.

A comprehensive understanding of the innovation and entrepreneurship ecosystem can ultimately be achieved through the integration of causal inference models and deep representation learning. By employing this fusion technique, we can generate more accurate feature representations and conduct in-depth analyses of causal relationships among various elements, thereby providing more informative recommendations for decision-makers.
Model training and optimisation
The main challenge we face when integrating deep representation learning and causal inference into a single framework is how to balance the weights between the two modules. We address this issue through a joint optimisation approach; specifically, we define an integrated loss function that combines the reconstruction loss of the self-encoder and the error term of causal inference. By adjusting the hyperparameter λ, we can flexibly control the weights between the two modules to achieve optimal model performance (see equation (21)). Reducing the entire loss is the ultimate aim:

In the optimisation strategy section, we not only use early stopping to prevent overfitting, but also employ the Adam optimiser to accelerate the convergence process. In addition, we select the optimal hyperparameters, including the learning rate η, weight decay factor λ, etc., through cross-validation. Specifically, we performed a grid search for each hyperparameter to find the best combination to improve the generalisation ability and prediction accuracy of the model (see equation (22)):

In selecting a deep representation learning model, we considered a variety of models, including self-encoders, variational autoencoders (VAEs), and generative adversarial networks (GANs). Self-encoders were ultimately chosen because of their efficiency in feature extraction and data compression, especially when dealing with high-dimensional data. In addition, the training mechanism of self-encoders is relatively simple and easy to implement and optimise.
These training and optimisation techniques enable the model to precisely infer causal links in the innovation and entrepreneurship ecosystem and extract valuable information from challenging multi-dimensional data, therefore offering effective and accurate support for decision-making.
Application and evaluation
This study provides a comprehensive quantitative evaluation of the effectiveness of the proposed intelligent assessment method for innovation and entrepreneurship ecosystems. This method integrates deep representation learning and causal inference through various assessment criteria. To ensure the stability and adaptability of the approach in practical applications, the assessment metrics primarily focus on causal inference impact, model accuracy, robustness, and other relevant factors.
First of all, in this study one of the fundamental components of model evaluation is causal effect. By means of causal analysis of several elements in the innovation and entrepreneurship ecosystem (e.g., technological innovation, resource allocation, etc.), this paper estimates the causal effect to quantitatively evaluate the intensity of each factor on the target variables (e.g., enterprise performance, innovation output, etc.). The computation of causal effects follows this formula:

This study uses the Mean Absolute Error (MAE) as an indicator to evaluate the correctness of the model since it allows one to measure the absolute difference between the true value and the expected outcomes of the model using the following formula:

Furthermore, by means of simulations in several contexts, this work examines the performance of the model in the face of noisy data and missing data conditions thereby verifying the robustness of the model. In this sense, by separating the training and test sets numerous times, the cross-valuation method is extensively applied to guarantee the stability of the model on diverse datasets.
19
One may depict the cross-valuation process by the following equation:

By means of these tools and assessments, the approach of this research shows general dependability and usefulness across a wide spectrum of pragmatic environments.
Experiments and analyses
Datasets and data preprocessing
This experiment uses the Global Entrepreneurship Monitor (GEM) Adult Population Survey (APS) dataset to evaluate the intelligent assessment approach of innovation and entrepreneurship ecosystems integrating deep representation learning with causal inference presented in this work. Covering entrepreneurial traits, entrepreneurial motivation, market environment, and other dimensions, the GEM dataset offers thorough data on adult entrepreneurial activities in many nations and regions around the world and is appropriate for analysis of entrepreneurial ecosystems in different countries and regions.
Main features of the GEM dataset.
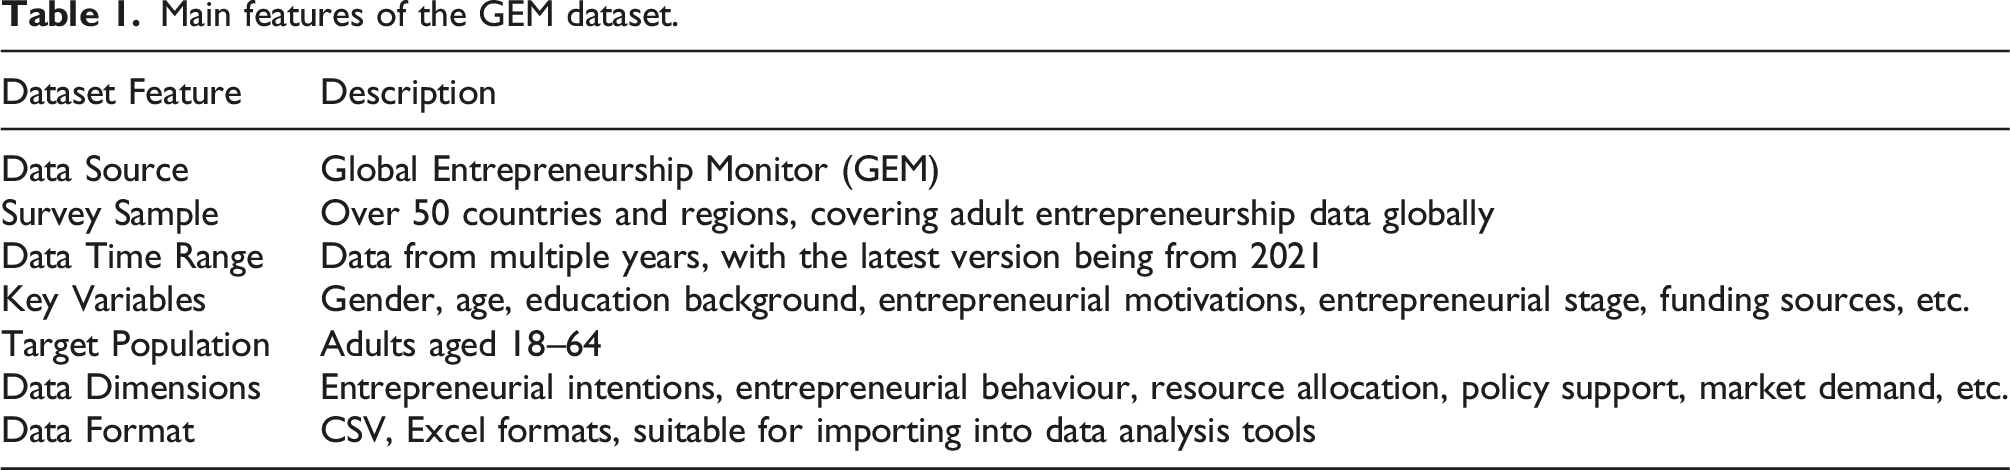
On the GEM dataset, required preprocessing was completed before the experiment. Missing values were handled by a combination of interpolation and deletion technique to guarantee data consistency and integrity. 20 Furthermore for numerical features, standardisation was used to remove the impact of several scales on model training. Solo thermal coding was applied to convert categorical variables, so facilitating the model to better manage them.
In the data preprocessing section, we used a normalisation method for the numerical features. The purpose of normalisation is to convert the data to zero mean and unit variance in order to eliminate differences in magnitude between features and to ensure fairness and accuracy in model training. This standardisation approach helps to improve the convergence speed and prediction accuracy of the model. Specifically, we normalise the processing by calculating the mean and standard deviation of each feature, subtracting each feature value from the mean of that feature, and then dividing by the standard deviation. This type of processing is widely adopted in many machine learning tasks because it can effectively reduce the effect of magnitude between features and enable the model to handle each feature more fairly.
By means of the aforementioned data preparation, a dataset suitable for model training and testing in this research has finally been acquired. This dataset facilitates the intelligent evaluation of creative business environments and provides a solid foundation for causal inference analysis and deep representation learning.
Multi-model comparison experiments
A multi-model comparison experiment is intended to thoroughly validate the efficacy of the proposed ‘Intelligent Assessment Method for Innovation and Entrepreneurship Ecosystems Integrating Deep Representation Learning and Causal Inference’ by means of seven main assessment methods. These approaches examine the advantages of the proposed method from several angles and span conventional statistical models, integrated learning algorithms, deep learning models, representation learning methods, and representative models in present causal inference research.
The GEM database provides the experimental data; it chooses sample data from several nations and regions covering multi-dimensional indicators of entrepreneurial activities, governmental support, and entrepreneurial climate. The prediction challenge is to build the matching causal inference to enable decision-making and evaluate the success rate of entrepreneurship depending on historical and real data.
Model configuration.
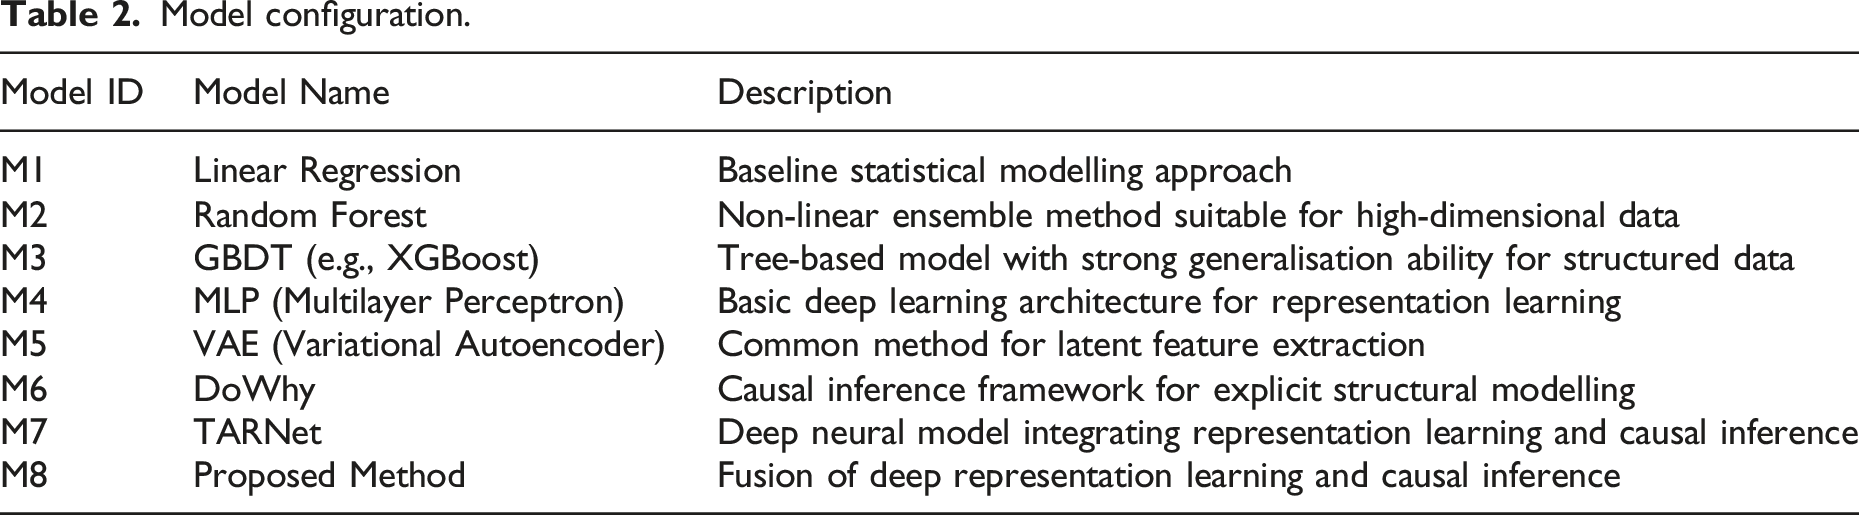
Three key metrics are applied in the experimental evaluation of this work: structural Hamming Distance (SHD), causal effect, and MAE. Specifically derived by computing the difference between the two in terms of the addition, deletion, and directional corrections of the edges, SHD, as a structural level measure, is used to compare the causal graph inferred from the model with the real causal structure. Calculating the least amount of modifications on edge additions, deletions, and orientation adjustments for both helps the SHD be determined. The three indicators taken together completely capture the whole performance of the model in several dimensions, including numerical prediction, causal inference and structural reduction. Figure 5 displays the experimental findings. Results of the multi-model comparison experiment.
The method (M8) of this study performed satisfactorily on all three evaluation criteria. With the lowest MAE (0.149), the model forecasts the environment for innovation and entrepreneurship rather effectively. Although the estimated causal impact is 0.92, it is far higher than the other models and shows that the method has stronger causal inference and can more effectively portray the possible effects of intervening variables on the environment. The SHD was just 4, much below the other models, indicating that the method of this study was more accurate in identifying the structure of the causal map.
Less accurate and causally inferred than other models are traditional machine learning models (Random Forest M2, GBDT M3, etc.), linear regression (M1). These models struggle to detect causality, thereby producing low causal impact estimates (0.72 for M1, 0.76 for M2), however they perform better in standard prediction tasks. Moreover displaying notable structural Hamming distances, these models indicated causal structure recovery biases.
This paper demonstrates how clever assessment of innovative and entrepreneurial ecosystems may be accomplished using deep representation learning and causal inference, so surpassing conventional approaches in prediction accuracy, causal effect measurement, and causal structure reconstruction. It also clearly illustrates its vast possibilities for useful purposes.
Ablation performance experiments
This section conducts ablation studies to examine the effect of various modules on model performance in order to validate the novel entrepreneurial ecosystem intelligence assessment method proposed in this work. Ablation studies remove or change fundamental methodological components to observe changes in model performance, therefore evaluating each component.
There are many possibilities in this ablation experiment.
Eliminate the deep representation learning module (M8-A): this experiment tests just the causal inference method devoid of the module. This model is probably going to perform poorly in prediction accuracy and causal inference since it cannot employ deep learning to detect possible traits of high-dimensional input.
This work uses deep representation learning for feature extraction and prediction devoid of the causal inference module (M8-A). This approach cannot explain causality and depends just on the representational power of deep learning, so causal effect estimation and causal structure identification may be biased.
Eliminating the joint optimisation of the causal inference modules (M8-C) and deep representation learning results trains both modules independently for final evaluation. This lessens the interaction between the causal inference model and the deep learning model, hence perhaps improving performance.
These ablation experiments confirm the value of combining several modules and assess their respective influence on the performance of the final model. Figure 6 contrasts outcomes of ablation experiments: Results of ablation experiments.
Ablation studies provide valuable insights into the model’s performance. First, removing the module for deep representation learning (M8-A) significantly degrades the model’s effectiveness. The MAE increases from 0.149 to 0.198, indicating that the model’s feature extraction capability is severely compromised without deep representation learning, which in turn diminishes prediction accuracy. Furthermore, the removal of the deep representation learning module substantially impairs the model’s performance in causal inference and causal structure identification, as evidenced by a declining causal effect estimate of 0.75 and an increase in the SHD.
Second, eliminating the causal inference module (M8-B) produced a causal impact estimate of 0.82 and a SHD of 8, implying that the model devoid of causal inference was far less successful in capturing intervening variables. Although MAE (0.172) improved, the overall performance was far lower than the whole model, so verifying the important part played by the causal inference module in causal link detection.
With an MAE of 0.157 and a SHD of 6, the independently optimised model (M8-C) performed lastly. Comparatively to the model optimised via deep representation learning and causal inference, a causal effect estimate (0.88) did not improve performance. This indicates that combining enhancing the deep representation learning and causal inference modules increases model performance.
Conclusion
This work proposes an intelligent assessment method for innovation and entrepreneurship ecosystems that leverages deep representation learning and causal inference. Deep representation learning enhances the accuracy of causal inference by enabling the model to extract potential high-dimensional features from complex ecological data and analyse causal relationships. The experimental results indicate its potential for creativity and entrepreneurial ecosystems, demonstrating that the proposed method outperforms current machine learning and causal inference models in terms of MAE, causal effect estimation, and SHD.
Nevertheless, the research in this paper has restrictions. First, the model performs well on large datasets; but, its low adaptability to all creative entrepreneurial environments may be limited by the low variety of the datasets. 22 Second, although it should be improved mostly in terms of model explanatoryness and causal inference transparency, this work blends deep representation learning and causal inference.
Future optimisation can incorporate: (1) Dataset extension and diversity enhancement: Future studies can improve the breadth and diversity of datasets, including cross-industry and cross-region data, so improving the generality and resilience of models. (2) Model optimisation and enhanced interpretability: Future studies could investigate novel strategies to increase the interpretability of models by means of interpretable deep learning techniques, thereby enabling transparent and simple to grasp predictive and causal inference outcomes of models.
23
(3) Real-time assessment and adaptive updating: Future studies should consider developing a real-time assessment system and implementing an adaptive updating mechanism to respond to the dynamic changes in the innovation and entrepreneurship ecosystem. This approach would allow the assessment model to be continuously adjusted and optimised in response to shifts within the ecosystem.
Footnotes
Funding
The author(s) disclosed receipt of the following financial support for the research, authorship, and/or publication of this article: This work was supported by the 2022 Jiangsu Provincial Social Science Application Research Excellence Project – Talent Development Special Subject: ‘Research on Optimization Pathways for Human Capital Development in Jiangsu’s Specialized, Sophisticated, Differentiated, and Innovative Enterprises’ (Grant No.: 22SRB-14), 2023 Jiangsu Provincial Science and Technology Program Project: ‘Research on Influencing Factors, Implementation Pathways, and Policy Optimization of Cultivating Industrial Innovation Talents by Jiangsu New-type R&D Institutions’ (Grant No.: BR2023014-4).
Declaration of conflicting interests
The authors declared no potential conflicts of interest with respect to the research, authorship, and/or publication of this article.