




Abstract
With the development of visual information communication technology, various interactive simulation methods for Arts and Crafts (AaC) have emerged. However, traditional methods suffer from low recognition accuracy and limited visual interaction. For improving the interactive ability of AaC, an interactive system based on visual view transformation of AaC is proposed. First, based on the scene vision-based aided design algorithm, the color segmentation is carried out on the known visual scene image. Then, morphological analysis is performed on segmented images to reduce noise and breakage and affect the obtained connected regions. Next, an assistant design algorithm based on behavior interaction is adopted to realize the combined control and simulation of the interactive design of AaC. Finally, the experiment is carried out to evaluate the algorithm used in the system. Experimental results demonstrate superior performance in CIMPACK index and recognition accuracy (0.78), with faster response times. This system enhances the intelligent interactive design capability for AaC, providing practical value for the industry.
Introduction
China’s AaC has always occupied an important position in the world. However, a large amount of information is generated and accumulated based on AaC, which is difficult to manage manually. Therefore, it is extremely urgent to establish a modern and efficient design method for AaC. If modern advanced technology can be combined and applied in a more intelligent way, it can meet the development needs of modern society, and at the same time, the rapid development and in-depth research of AaC can be accelerated. Nowadays, information visualization has been widely used.1,2 Among them, two disciplines play an important role in its development, namely, information graphics and scientific visualization, which have promoted the development of information visualization in different degrees. Information graphics provide an information presentation method that can adapt to the public, while scientific visualization provides a theory of rigorous, interactive, and real-time data exploration.
With the development of visual information communication technology, combined with the creativity, composition, and visual language information analysis methods of AaC, interactive simulation control of AaC is carried out. The combination of control of visual space, 3D imaging, and information interaction technology can improve the development level of communication design and image creativity in the field of the art design. In addition, adopting the visual communication analysis method for artistic perception and creative design can improve the interactive simulation and visual display ability of AaC. Therefore, the research on the design method of the interactive system of AaC is of great significance to the visual information reconstruction of AaC.3,4 Previous studies1–4 have explored the integration of information visualization techniques in artistic domains, highlighting the potential of graphical and scientific visualization methods. However, these works often lack behavior-driven interactive frameworks, which this study aims to address.
The design of the interactive system is based on the analysis of interactive information characteristics of AaC, which adopts visual linear control combination analysis and imaging processing, to carry out 3D interactive simulation control of AaC, to realize the interactive design of AaC combined with its spatial distribution. Traditional methods for interactive simulation of AaC have poor visual expression ability, and its recognition level of features is low, so it is necessary to transform its visual view.
For improving the interactive ability of AaC, an interactive system based on visual view transformation of AaC is proposed. This paper puts forward a design method for the AaC interactive system based on visual view transformation. First, based on the scene vision-based aided design algorithm, the color segmentation is carried out on the known visual scene image. Then, morphological analysis is performed on segmented images to reduce noise and breakage and affect the obtained connected regions. Next, an assistant design algorithm based on behavior interaction is adopted to realize the combined control and simulation of the interactive design of AaC. Finally, the experiment is carried out to evaluate the algorithm used in the system.
Key technologies of information visualization
Data transformation
Visualization needs to transform the original data into relational structured information for the next step. After obtaining the original data, data cleaning should be carried out, including deleting duplicate data, useless spaces, and punctuation marks, and dealing with invalid and missing values. In the process of conversion, data should be analyzed to extract data to the maximum extent, which extracts information from unordered and unstructured data. 5 Besides the superficial information such as title and author, the realization of visualization also needs to extract fuzzy information from the data set, identify the semantic units of information and their relationships, and deal with them structurally. The fundamental purpose of converting data into structured data is to find and take the most suitable data storage mode, 6 which forms a system through certain principles and laws.
Visual mapping
Mapping refers to the method of converting information extracted from digital resources into visual elements or information models to the conceptual mode. An informationion model is a low-level description of digital resources, while the conceptual model is a cognitive structure that can provide semantic information and support reasoning.7,8 The core of the visual display of digital resources is to map the transformed information to shapes or attributes that can be drawn and displayed by designing reasonable schemes and algorithms, which can be carried out in two steps: First, the information is converted into points, lines, areas, volumes, and other elements; Then, the information elements are transformed into visual expression elements, where each theme is represented by the characteristics of each color, and different lengths are represented by the size of the area.
Mapping mode
There are three ways to divide the patterns of mapping digital resources into visual elements.9,10 The first way divides patterns into enumeration mapping and selective mapping. From the perspective of whether to map all features of the original digital resources, the former refers to mapping all elements in the initial data set, while the latter only maps specific elements. The second method describes the relationship between the change of original digital resources and the mapping result, which can be divided into linear mapping and nonlinear mapping. Linear mapping means that every visual element has an absolute meaning, and the change of original data will not cause the change of relative position. However, nonlinear mapping will change its relative position with the change of initial data. Single mapping means that there are no related mapping elements in the original data or visual elements. Complete mapping means that there are mapping objects corresponding to all data in visual information. These three mapping strategies—enumeration versus selective mapping, linear versus nonlinear mapping, and single versus dual mapping—provide flexibility to accommodate various visualization requirements. Enumeration mapping ensures that all features are preserved, which is suitable for exhaustive data exploration, while selective mapping allows focusing on key elements, reducing visual clutter in large datasets. Linear mapping maintains proportional relationships, making it ideal for quantitative analysis, whereas nonlinear mapping enhances the visibility of subtle variations by dynamically adjusting spatial representations. Single and dual mapping strategies address different levels of data completeness; single mapping applies when partial data representation suffices, while dual mapping is essential for applications requiring full data fidelity and traceability.
Together, these mapping strategies enable adaptable visualization designs, ensuring that users can tailor the representation of digital resources to diverse analytical or communicative goals in various user scenarios.
Classification technology
The purpose of information organization is to add structure to abstract unstructured information and create dimensions and measurement units of information. Among all related organization methods, classification is an important method for information visualization. Classification algorithms include the K-means algorithm and Bayesian algorithm.11,12 Before classifying digital resources, we should first create categories according to specific tasks, then classify the specific resource objects. If necessary, sub-categories can be added under the categories to achieve the exact purpose. In addition, it can more objectively reflect the contents of various digital resources by classifying resources according to their own attributes, as shown in Figure 1. Mapping relationship of information visualization.
Information coding
Coding is the process of converting information from one form to another, which has two standards: the consistency standard and the importance standard. 13 The consistency standard means that the features of the image should match the features of the original information; while the importance standard means that the selected visualization method can display the most important content of resources. There are many forms of coding, including color coding, shape coding, and position coding. Color coding can be used to display information such as resource length, publishing time, and theme. For example, the ordered resource items can be coded by grayscale, and the resource information that has no obvious relationship with nouns can be displayed by color module. Shape coding can display different types of resource information by designing different graphic symbols. And the types of colors and shapes are limited, because too many display levels can’t be improved, and the display of some information elements will be affected, which will greatly weaken the user’s ability to access information. 14 Location coding is the most effective visualization mechanism to display all attributes. The use of interactive technology can enable users to choose or change coding modes independently, but this flexibility also increases the difficulty of making the best choice from many coding modes.
Visual view transformation
The result of the mapping is to present various features of digital resources in the view, which can be set to three levels, namely, primary, intermediate, and advanced. Their functions are viewing a single data, displaying a group of data, and displaying all data information. The reason why the display level is set to three levels is that from the point of view of user acceptance and screen limitation, which can’t be fully displayed at one time, and each user has his own interest points and visualization expectations. Digital resources are different, so visualization needs to consider the various needs of users for a comprehensive and detailed display and display a large amount of content on multiple levels through view conversion so that users can view the corresponding information according to their own needs. 15 Viewing can fully arouse the enthusiasm of users, which helps users effectively view the resources they need, find the potential connection between resources, and explore creative knowledge. The view conversion process is the process of interaction between users and the library visualization system. Types of interaction mainly include selection, reconstruction, and filtering. For example, filtering technology allows users to independently select resource subset entries, Focus + Context is the most widely used technology in view conversion, 16 which is a technology based on deformation, which requires a trade-off between accuracy and visual clarity.
Design of an interactive system for AaC
Overall architecture design
In order to realize the interactive system of AaC, the visual imaging analysis model of AaC interaction is built through the collection of environmental parameters and combined with 3d visual information interaction and multi-parameter combination control, the underlying database of the system was constructed, and the automatic assembly control was designed by PLC intelligent control technology.
17
In addition, the optimized transmission protocol of the control system is designed, and the interactive simulation control of AaC is carried out by means of 3D model reconstruction and multi-dimensional parameter fitting of artworks, and the overall structure model of a 3D somatosensory interactive system of AaC is obtained, as shown in Figure 2. Overall architecture of the system.
A cross-compilation control method is adopted to design artificial intelligence, and the overall structure model of the AaC interactive system is built. The core processing chip of the control system is designed with an embedded Linux kernel,
18
and the information fusion model of the control system is built. In addition, through cross-compilation and information fusion technology,
19
three-dimensional somatosensory interactive simulation and output conversion design are carried out. Its information transmission model is shown in Figure 3. Information transmission model.
Through the transmission control, conversion and processing of information collection inside the system, the transmission of 3D somatosensory interaction information can be effectively completed. DSP integrated information processing is adopted to carry out the output programmable logic control of 3D somatosensory interaction simulation system.
Scene vision-based aided design
In complex scene images, the target information or objects are blocked by other objects, the color difference changes, the shape size is different and other reasons, which is not conducive to the feature extraction of the target information.
20
SIFT feature is a very stable local feature, which is invariant to rotation, scaling and brightness change, the scene image is segmented according to the set threshold value; Then, the effective description region is processed by morphology, where the candidate regions are obtained; After that, SIFT feature is used to extract the target features in the candidate area. Figure 4 illustrates the overall process of scene vision-based aided design, including color segmentation, morphological analysis, and candidate region extraction. Aided design based on scene vision.
Split candidate region
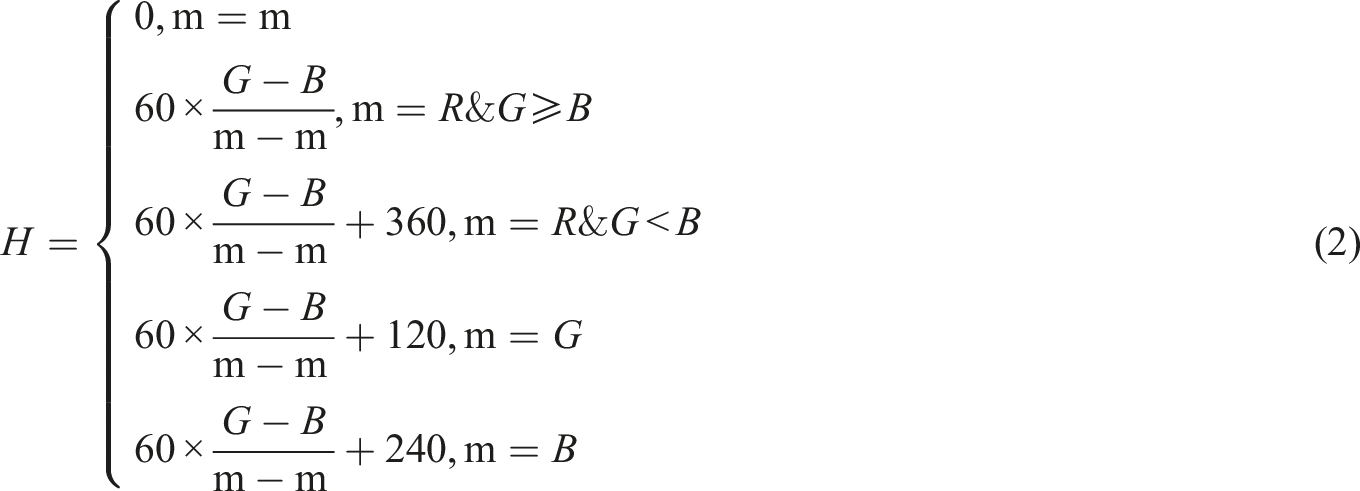
For known scene images, RGB, his, HSV and LCH are usually used for color segmentation. The specific algorithm formula is as follows:

HSV color space and RGB color space exist at the same time. Therefore, conversion between them is required, which is as follows:
These connected region is set as, where represents the -th connected region and n represents the number of connected regions. The width, height, and area of the connected region are expressed as and respectively. If equation (3) is satisfied, the connected region is regarded as a candidate region.
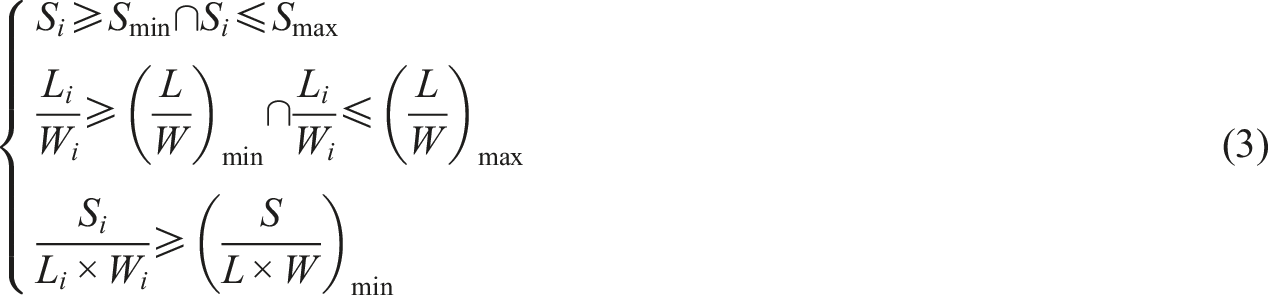
Finally, the candidate regions are obtained by rough segmentation of known scene images, and the images are classified by extracting shape features.
Target feature extraction
While newer methods like ORB and BRISK offer faster performance, SIFT is chosen for its superior rotation and scale invariance, which is critical in handling complex AaC design elements with varying orientations and sizes. To extract the features of objects in the scene, the SIFT feature points are taken as the center in the candidate region, and 16 is calculated × the gradient and direction of each pixel within the window. This paper adopts the form of dense sampling to obtain more SIFT feature points, as shown in Figure 5. Schematic diagram of feature extraction.
Figure 5 presents the multi-scale feature extraction using concentric circles of varying radii, demonstrating the dense sampling strategy for obtaining SIFT descriptors. The search radius of circles with three colors is r = 4, 8, and 12 pixels, respectively. The SIFT descriptor is calculated at the center of the SIFT feature point, that is, the center of the concentric circle. Each SIFT descriptor is represented by a 128-dimensional eigenvector. Therefore, each extraction point can be described by a feature vector of 128 × 3 = 384 dimensions. The adoption of a dense sampling strategy ensures that feature descriptors are computed across multiple scales and locations, enhancing the robustness of the feature representation against geometric variations and partial occlusions. By computing descriptors at different radii (r = 4, 8, and 12 pixels), the system captures both fine-grained and coarse-grained visual details, which is critical in complex AaC scenes characterized by intricate patterns and varying textures. Consequently, the use of 384-dimensional vectors, while increasing computational demand, provides a comprehensive and discriminative feature space that significantly benefits subsequent behavior-driven interaction modeling and design simulation.
Behavioral interaction based aided design
Based on the above-mentioned construction of AaC visual image imaging and feature recognition model and visual reconstruction, single frame vector fusion method is used to obtain the fusion distribution function of visual distribution as follows:



Algorithm 1. Pseudocode of the visual parameter fusion process
Input: Feature sets E (reconstruction attributes) and P (pixel feature distribution)
Output: Visual parameter fusion model.
(3) Return fused parameter se.
Experiment and analysis
Dataset
To further validate the diversity and representativeness of the experimental dataset, the 20 selected AaC models were categorized based on their geometric and stylistic complexity. Specifically, these models were divided into three distinct categories according to their structural features and visual intricacy:
Simple geometry category
This category includes models such as tables, chairs, and benches, characterized by their regular geometric shapes and minimal structural complexity. These models account for 30% of the dataset and are primarily used to evaluate the system’s basic feature extraction and matching capabilities.
Moderate complexity category
This category comprises models such as cabinets, beds, and sofas, which exhibit more intricate geometric structures with multiple components and irregular boundaries. Representing 45% of the dataset, these models are designed to test the system’s robustness in handling moderate variations in shape and structure.
High complexity category
This category includes highly artistic and structurally irregular models such as chandeliers and sculptures, which feature complex surface details and non-uniform geometric forms. Accounting for 25% of the dataset, these models pose significant challenges for visual feature extraction and interaction modeling.
Evaluation of algorithm
Time and accuracy of candidate scenario selection.
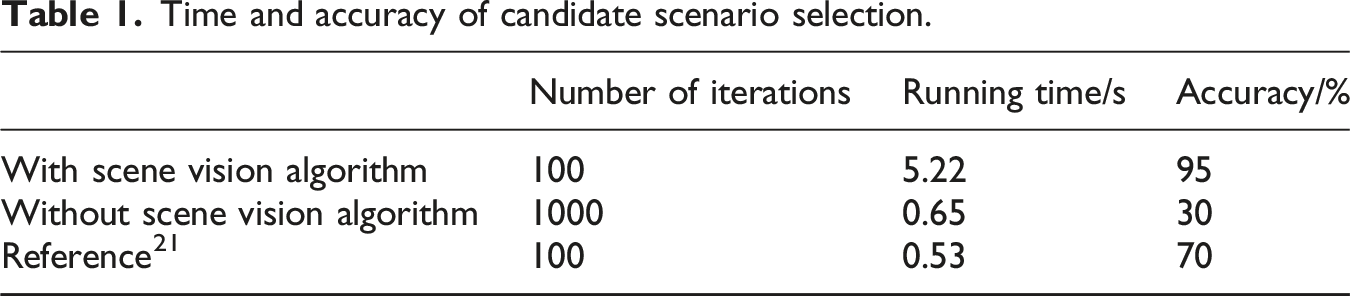
In addition, aiming at the common elements of table, chair, and bed in AaC design, the average values of 20 different kinds of models were tested, and the recognition accuracy under different models was shown in Figure 6. Recognition accuracy of different models.
It can be seen from the figure that the recognition accuracy of the proposed algorithm is higher than that of the existing algorithms, with an average accuracy of 0.78. However, the design model based on the Farthest distance and random matching has a poor recognition effect for candidate scenes, and its recognition accuracy is only 0.65. Due to the understanding of matching prior knowledge of AaC, this algorithm has the best performance in the comparison of various algorithms.
Table 2 provides a comprehensive comparison of four system configurations. (1) Baseline only: No scene matching or fusion, representing the system’s minimum capability. (2) Scene matching only: Includes scene-based candidate selection without parameter fusion. (3) Fusion only: Applies visual parameter fusion without candidate scene matching. (4) Full model: Combines both scene matching and parameter fusion. Comprehensive ablation study results on fusion and scene matching modules.

The results indicate progressive improvements across all metrics when incorporating either module, with the full model achieving the best overall performance—accuracy of 78.03%, precision of 77.25%, recall of 77.80%, and F1-score of 77.52%.
While the runtime slightly increases from 0.45 s (baseline) to 0.52 s (full model), the gain in recognition performance justifies this trade-off. The standard deviation also reduces as the system integrates more advanced components, confirming better result stability.
Evaluation of design effect
Experimental parameters.
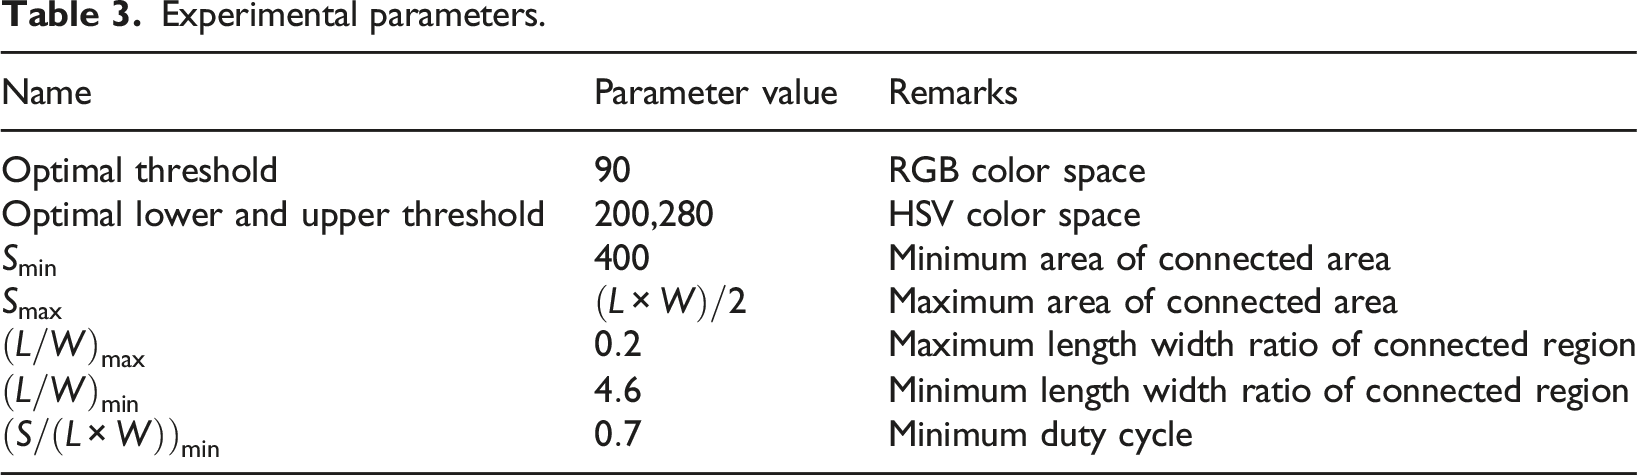
The conventional method of using AutoCAD to design AaC is compared with the method proposed in this system. The CIMPACK index table is introduced to compare the design results during the testing process of ERHY software. The CIMPACK index quantifies design practicality and production feasibility, with higher values indicating reduced complexity and improved manufacturability. The experimental data are shown in Figure 7. Comparison of CIMPACK indexes of different models.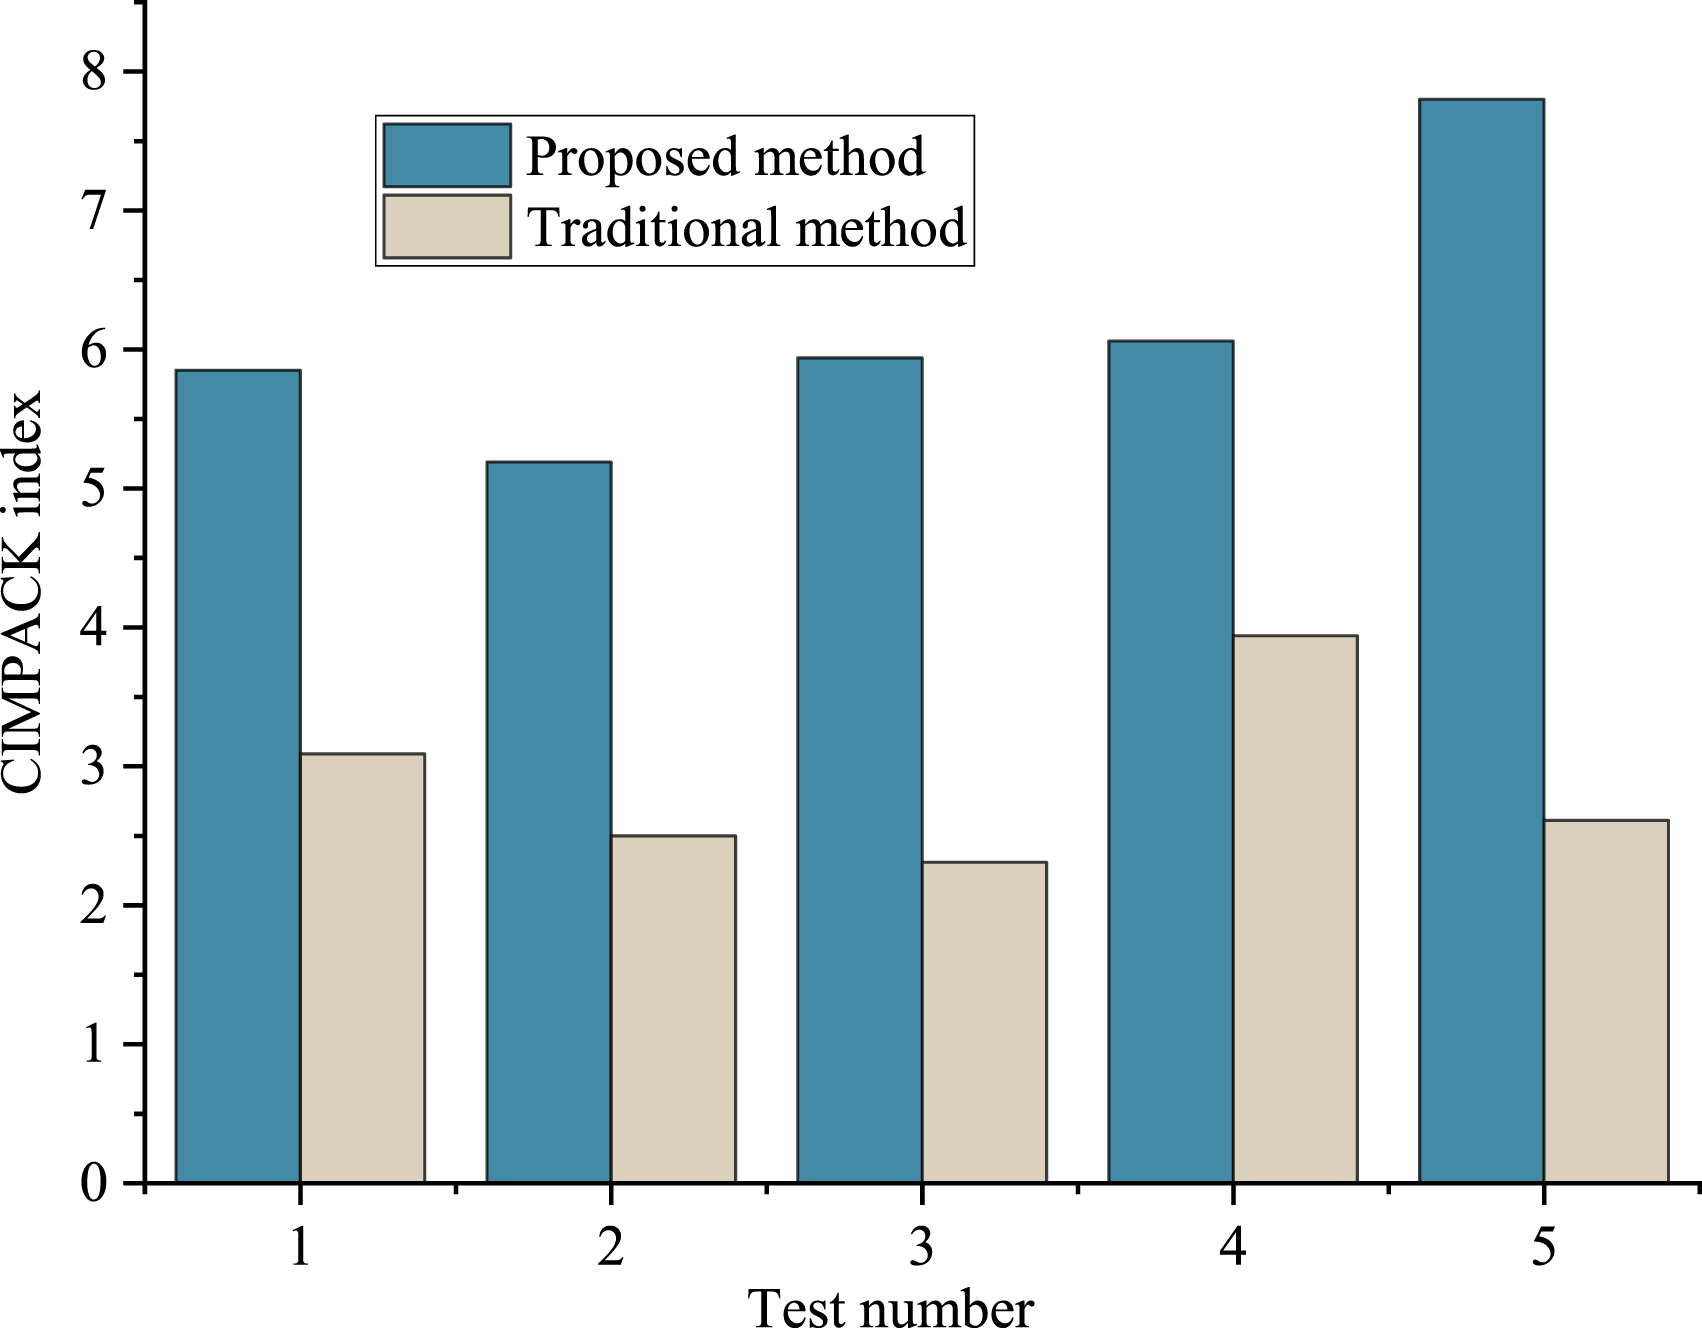
From the data analysis in Figure 7, the design method of AaC interactive system in this paper has more than one-time higher CIMPACK index than the conventional method for product design. CIMPACK index is a parameter to measure the practicability of the designed product. At the same time, after transformation, it has a negative multiple relationships with the process parameters, which can determine the difficulty of design and production. The larger the CIMPACK index is, the easier the production process is. In this paper, the virtual product design method based on 3D vision is compared with the conventional product design method. Figure 8 shows the results. Design effect evaluation of AaC.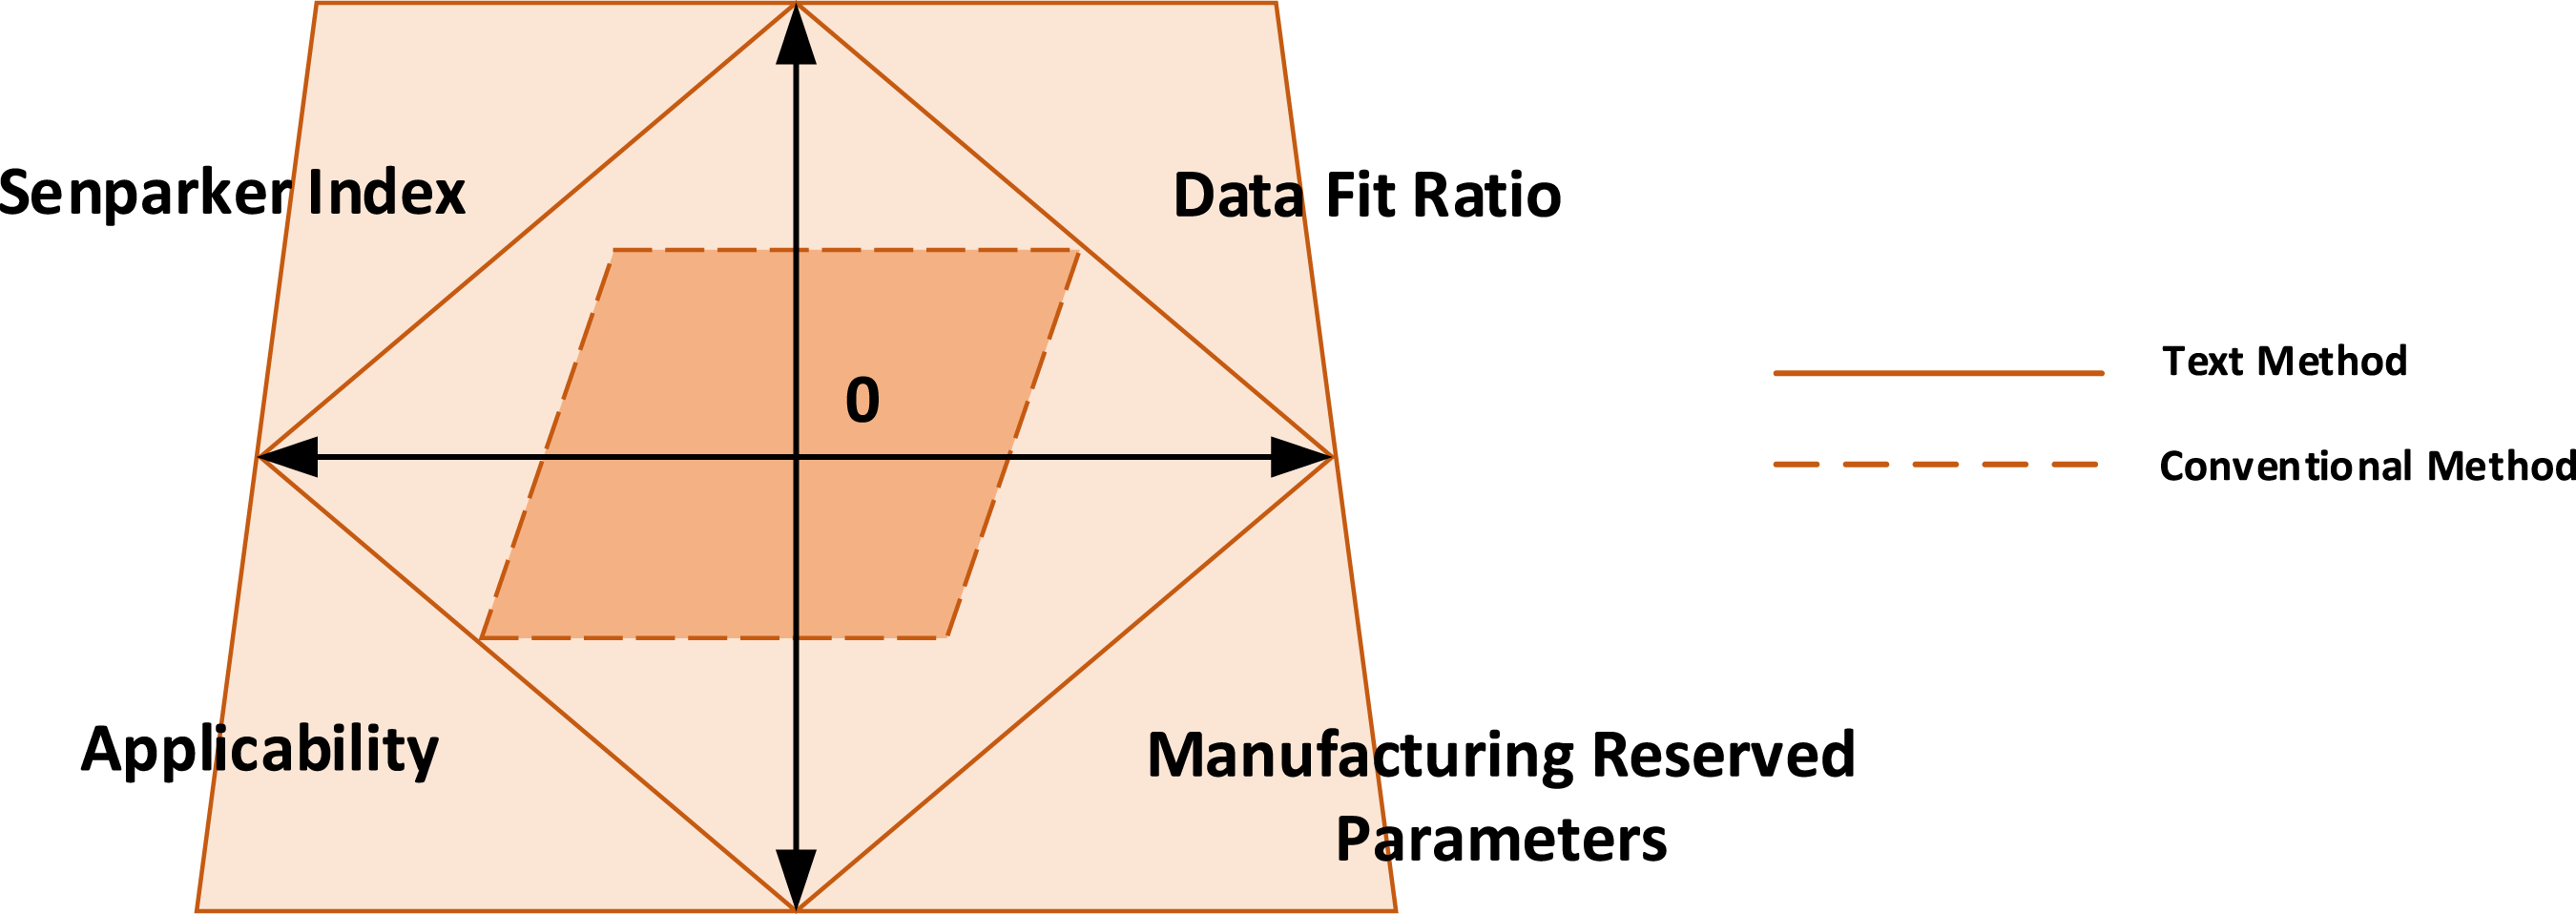
As can be seen from Figure 8, the interactive design method of designed AaC is clearly better compared to the common technique for involving AutoCAD for item configuration and CIMPACK list, which is demonstrated to be more pragmatic.
The query rate per second (QPS) is the number of response requests per second. It is a measure of the amount of traffic handled by a specific query server at a specified time. The per-second rate of domain name queries on the Internet is often used to measure the performance of the server. QPS is usually used to express and measure the load of the current system, improving TPS can enhance the processing capacity of the current system and increase the support of maximum QPS. The interactive design system of AaC products designed in this paper may bear more users’ visits at the same time. If the system fails to respond normally, it will also seriously affect the user experience of the system. Therefore, this paper tests the QPS of visual scenes, and the results are shown in Figure 9. Results of QPS.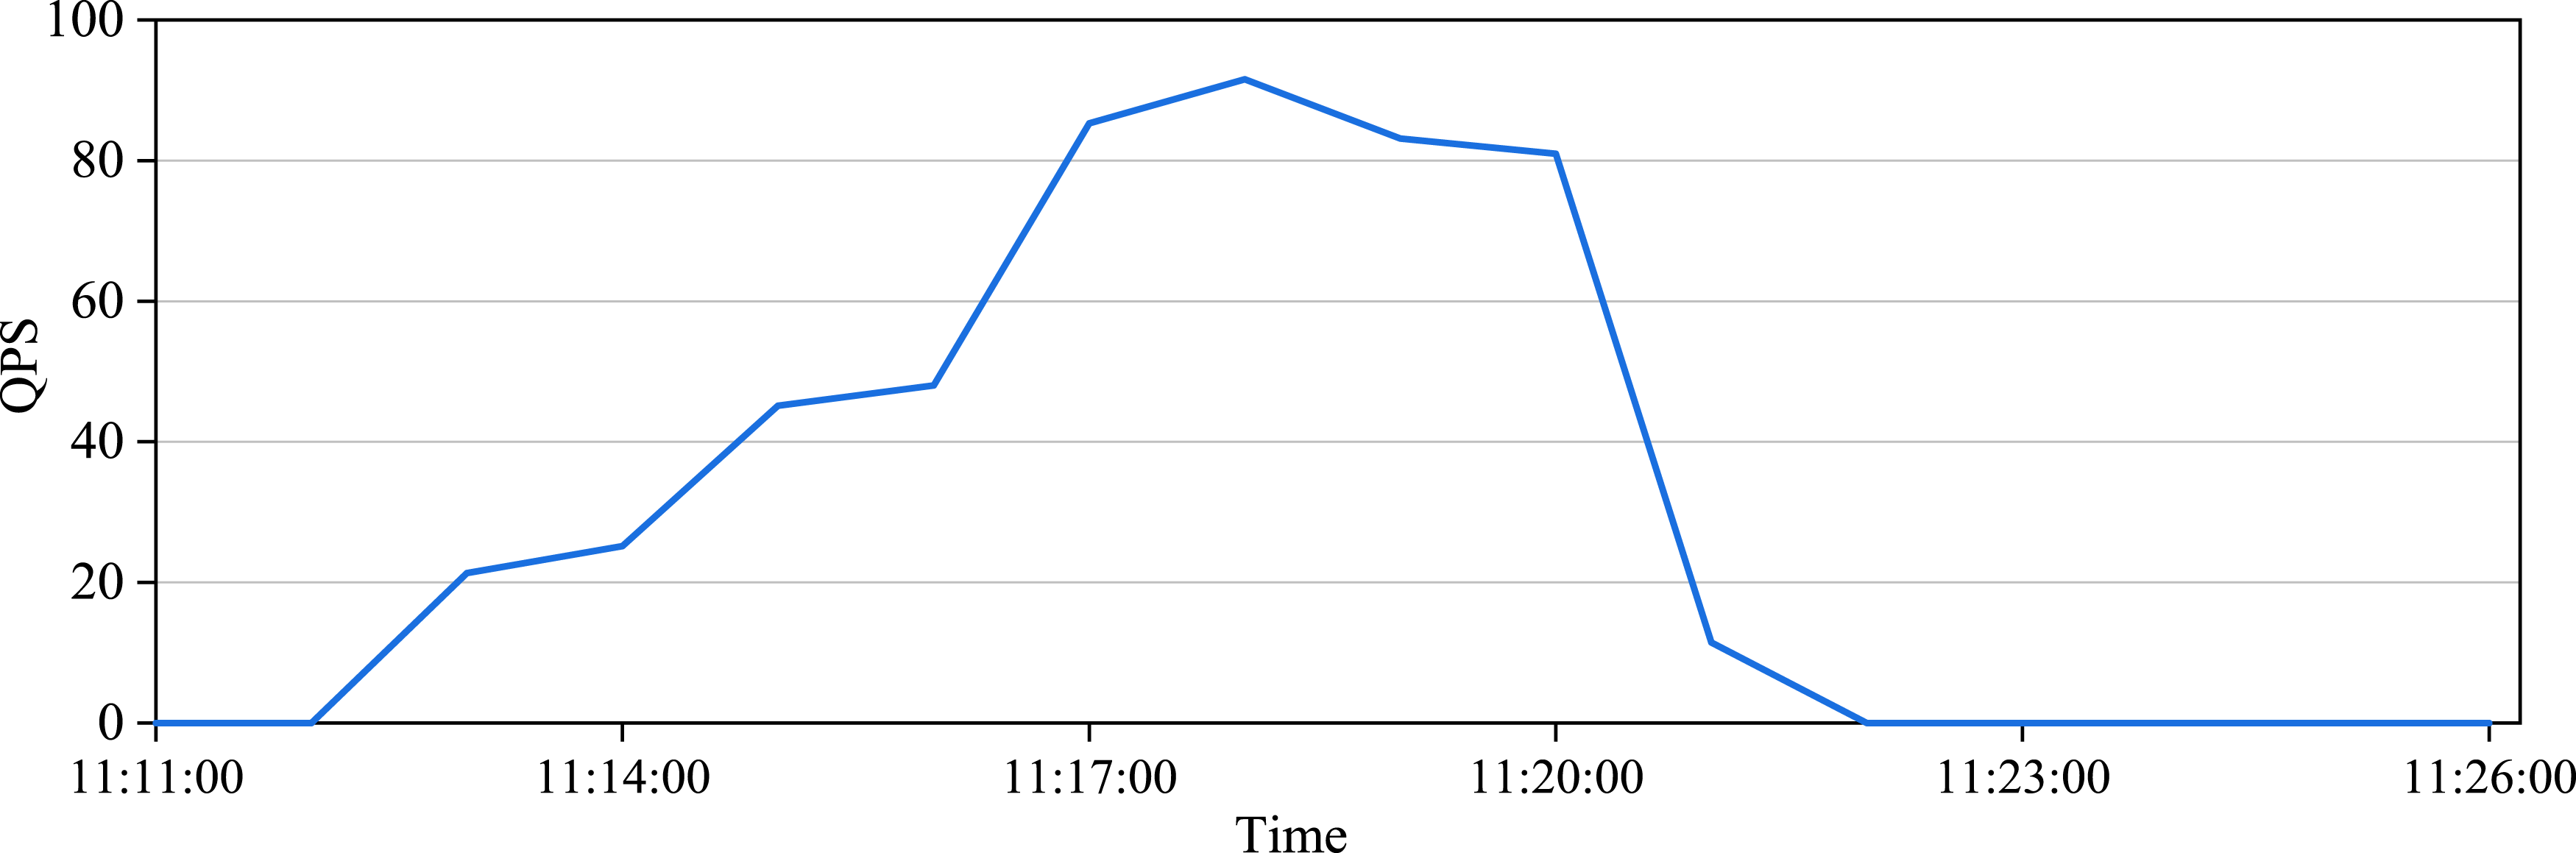
As can be seen from Figure 9, the highest query rate per second of visual scene can reach 95.6 QPS, and the number of visits that the system can bear in 1 minute can reach 45360 times, indicating that the system may bear more users’ visits at the same time, which meets the actual needs.
Conclusion
In this paper, a design method for an interactive system of AaC based on visual vision transformation is proposed. By inputting 1000 mapping relations of AaC products, the time and accuracy of the results of the candidate scenes are calculated to evaluate the algorithm used in the system. The results show that, due to the understanding of matching prior knowledge of AaC products, this proposed algorithm has the best performance in the comparison of other algorithms. In addition, the interactive design method of arts and crafts designed in this paper has a higher CIMPACK index and a faster corresponding speed, which is helpful to promote the development of intelligent design in the field of arts and crafts. In the future, more attention will be paid to the reconstruction of visual information, and in the aspect of performance testing, the interactive experience of users in art design will be tested and analyzed.
Footnotes
Acknowledgments
I thank the anonymous reviewers whose comments and suggestions helped to improve the manuscript.

Ethical consideration
This article does not contain any studies with human participants performed by any of the authors.
Author contributions
Jia Hou was responsible for study conception, design, interpretation of results, data collection, analysis, and the project administration. Jia Hou was responsible for draft manuscript preparation. All authors reviewed the results and approved the final version of the manuscript.
Funding
The authors disclosed receipt of the following financial support for the research, authorship, and/or publication of this article: This work is funded by “Research on the Integration Paths of Traditional Culture and Modern Architectural Landscapes in Henan Province in the Context of Mobile Internet,” the project number is 2024XWH270.
Declaration of conflicting interests
The authors declared no potential conflicts of interest with respect to the research, authorship, and/or publication of this article.
Data Availability Statement
Data sharing not applicable to this article as no datasets were generated or analyzed during the current study.