
Abstract
The new energy vehicle (NEV) industry urgently requires tailored credit assessment frameworks to address its nonlinear risk characteristics, driven by rapid technological iterations and policy dependency. This study selects 46 listed companies in the NEV supply chain (2019–2023) as samples, innovatively integrating multi-source data including financial metrics, textual tone analysis of annual reports, and ESG ratings. A three-dimensional composite indicator system (“financial robustness–strategic credibility–environmental resilience”) is developed to compare the predictive performance of Logit models and backpropagation (BP) neural networks in estimating corporate default probabilities. Empirical findings reveal: (1) Under the composite indicator system, the BP neural network achieves 81.7% default prediction accuracy, significantly outperforming the Logit model (72.4%), with a 32-percentage-point improvement in identifying defaulted entities; (2) Using single financial indicators, the BP network maintains superiority (58.3% overall accuracy vs 48.3% for Logit), validating its capacity to capture complex risk features; (3) The composite system enhances prediction accuracy by 23.4% (BP) and 24.1% (Logit) compared to single indicators, demonstrating the early-warning value of non-financial metrics. These results suggest that the synergistic application of multi-source composite indicators and BP neural networks substantially improves the precision of dynamic credit risk assessment in the NEV sector, offering methodological support for differentiated financial services and regulatory oversight.
Keywords
Introduction
Amidst the escalating global emphasis on environmental preservation and green economy, the new energy vehicle (NEV) industry, positioned at the strategic intersection of global energy transformation and industrial upgrading, is experiencing a dual trajectory of explosive expansion and structural realignment. Empirical data reveal that global NEV sales exceeded 16 million units by 2022. 1 Nevertheless, beneath this prosperity lie multifaceted challenges: volatile prices of upstream critical raw materials (e.g., lithium, cobalt) constrict profit margins across the entire industrial chain; persistently low capacity utilization rates of power batteries precipitate price wars due to structural oversupply; and accelerated technological iterations (e.g., solid-state batteries, sodium-ion batteries) compel enterprises to sustain escalating annual R&D expenditures while confronting high failure rates of advanced technological pathways. 2 Concurrently, regulatory instruments such as the EU Carbon Border Adjustment Mechanism (CBAM) and the U.S. Inflation Reduction Act (IRA) persistently reshape green supply chains, subjecting the industry to distinctive credit risk profiles characterized by the dual pressures of sunk costs in technological investments and the non-sustainability of policy subsidies. These dynamics collectively jeopardize the debt-servicing capacity of NEV enterprises.
Within this context, credit risk assessment has emerged as a critical enabler for sustaining industrial stability, with methodological evolution reflecting paradigm shifts in research approaches. Traditional studies predominantly rely on financial indicators—for instance, employing probit and regression models to analyze debt metrics for credit risk evaluation. 3 However, static financial frameworks exhibit theoretical deficiencies in addressing exogenous shocks from market volatility and industrial cyclicality. This limitation has catalyzed innovations in multidimensional evaluation systems. Notably, Moradi and Rafiei 4 developed a fuzzy inference system for Iranian banks, demonstrating enhanced adaptability to political-economic fluctuations during crises. With the deepening integration of digital technologies, Song et al. 5 proposed a multi-structural cascaded graph neural network (MS-CGNN) to mitigate insufficient credit indicators and inter-enterprise relational complexities in small and medium-sized enterprises. The proliferation of composite indicator systems has further underscored the imperative of textual data quantification. Li et al. 6 established a novel predictive framework leveraging innovation-oriented text mining and ensemble learning, validating the prognostic value of textual data in credit risk assessment. Wang et al. 7 augmented discrimination performance by autonomously extracting semantic soft factors from descriptive texts. Yet, extant methodologies remain inadequate for the NEV industry’s idiosyncratic risks. Conventional financial models fail to capture unstructured relational data (e.g., supply chain synergies) or reconcile the inherent tension between prolonged technology validation cycles and delayed return on investment. While composite indicators enhance predictive accuracy, current frameworks lack industry-specific textual analytics architectures, particularly in systematically processing mission-critical unstructured data such as policy documents, patent texts, and supply chain agreements. Consequently, the development of a dedicated NEV evaluation system that integrates textual indicators to transcend the spatiotemporal constraints of traditional financial metrics carries substantial theoretical and practical significance.
In the evolution of credit risk assessment methodologies, the compatibility between model architectures and industry-specific characteristics has remained a central focus of innovation. Traditional studies have predominantly relied on parametric models for linear discriminant analysis of financial indicators. For instance, scholars employed factor analysis for dimensionality reduction to construct Logit regression models, empirically validating the discriminative efficacy of financial indicators in assessing bond risks of Chinese NEV enterprises.8,9 Cross-industry comparative studies utilizing the KMV model further revealed the policy sensitivity of credit spreads in technology-intensive sectors. 10 Nevertheless, these approaches struggle to capture the nonlinear risk characteristics intrinsic to NEV enterprises—high-growth potential, volatility, and policy dependency—a theoretical impasse that has driven the adoption of machine learning paradigms. In terms of the new energy vehicle industry, nonlinear risk characteristics can be defined as the interactive effects of technological iteration and policy dependence, as well as the threshold effects of supply chain synergy and market volatility. Recent advancements include hybrid machine learning algorithms enhancing commercial credit boundary identification, 11 generalized method of moments (GMM) analyses linking banking digitalization to credit risk, 12 and stacked classifier frameworks incorporating filter-based feature selection (FS) for efficient prediction. 13 While traditional parametric models exhibit statistical significance, their linear assumptions conflict with the nonlinear risk transmission mechanisms inherent to the NEV industry. Moreover, their independence hypotheses fail to address strongly correlated intra-industry risk features. Despite extensive academic efforts employing random forests, classification regression trees, and extreme gradient boosting, 14 critical gaps persist: (1) the absence of structured comparisons between linear models and machine learning architectures under identical feature spaces, and (2) unquantified sensitivity differences in capturing industry-specific risk factors.
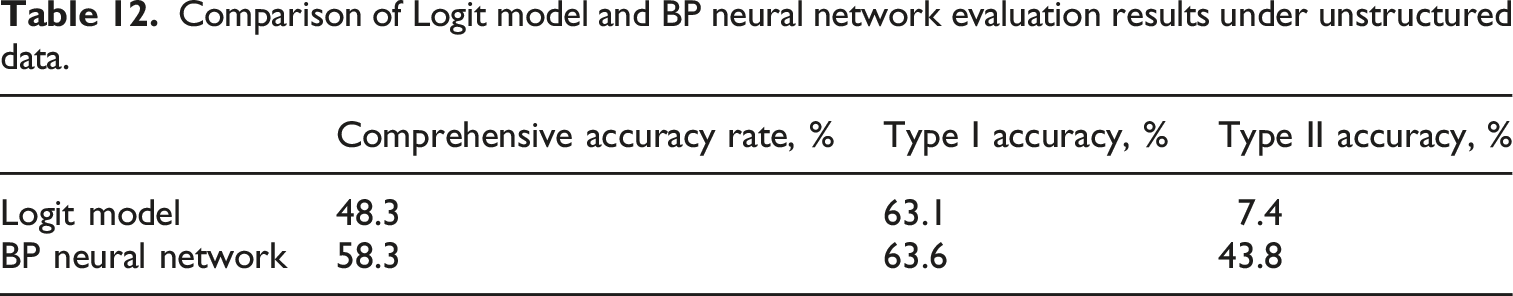
To address these challenges, this study develops a synergistic parametric-nonparametric framework tailored to NEV industry credit risk assessment. Leveraging dynamic panel data from 50 NEV supply chain-listed enterprises (2019–2023), we innovatively integrate ESG ratings and textual tone indicators from annual reports with financial metrics to construct a tri-dimensional composite index system (“Financial Robustness–Strategic Credibility–Environmental Resilience”) sensitive to industry-specific risks. Post dimensionality reduction to mitigate multicollinearity, empirical analyses employ both Logit models (retaining economic interpretability via maximum likelihood estimation) and BP neural networks (capturing policy-induced risk threshold transitions through dual hidden layers). Results demonstrate the BP neural network achieves 81.7% prediction accuracy, outperforming the Logit model by 9.3 percentage points, confirming its superior nonlinear risk decoding capability. Comparative tests between single financial indicators and the composite system reveal accuracy improvements of 23.4% (BP) and 24.1% (Logit), underscoring the early-warning value of non-financial indicators.
This research makes tripartite contributions: First, the novel tri-dimensional index system synergizes financial data with textual metrics (annual report tone, ESG ratings), enabling precise capture of NEV-specific nonlinear risks. This framework quantifies immediate solvency while providing early warnings for technological obsolescence and regulatory compliance pressures, outperforming traditional financial ratios in dynamism and multidimensionality. Second, the systematic comparison between Logit and BP neural network models expands methodological boundaries in NEV credit risk assessment. The BP network’s dual hidden layers and adaptive learning mechanisms successfully model nonlinear interactions among financial factors, textual sentiment, and ESG metrics, offering a hybrid framework balancing robustness and predictive accuracy for high-volatility industries. Third, this study enriches green finance theory and practice. Findings provide empirical foundations for financial institutions’ differentiated credit policies, corporate risk hedging strategies, and regulatory dynamic monitoring, facilitating sustainable development under carbon neutrality goals.
The remainder of this paper is organized as follows: Section 2 reviews relevant literature, Section 3 details the credit risk assessment model development, Section 4 presents empirical analyses, and Section 5 concludes with implications.
Literature review
As mentioned in the introduction, the essence of the credit risk of the new energy vehicle industry is the nonlinear spillover result of the technology market policy dynamic coupling. This section critically combs the responsiveness of existing literature to industry-specific challenges from two dimensions of methodology (section 2.1) and indicator system (section 2.2): first, is the model architecture compatible with the threshold effect of technology iteration and policy cycle? Second, can the indicator design capture unstructured relationship data such as industrial chain synergy? By revealing the disconnection between theory and practice, it provides ideas for the innovation path of this study.
Evolution of credit risk assessment models
Traditional statistical models such as logistic regression and probit analysis employ linear discriminant functions for default probability prediction, with methodological strengths in parametric interpretability. Zhao and Lin 15 demonstrated the efficacy of logistic regression using financial indicators in identifying default risk factors for SMEs, while Zhu et al. 16 enhanced the Z-score model with alarm source analysis and financial ratio evaluation for IoT risk assessment. However, empirical studies by Zhao et al. 17 reveal limitations: linear models underperform with incomplete data and exhibit significant accuracy degradation under non-normal distributions or multicollinearity—flaws exacerbated in cyclical emerging industries.
To transcend linear constraints, scholars have increasingly adopted machine learning (ML) techniques, marking a paradigm shift from classical statistics to intelligent algorithms. Bhatore et al. 18 identified neural networks and SVM hybrids as dominant tools in credit scoring and fraud detection. Gu et al. 19 improved assessment accuracy via XGBoost scorecards combined with ML classifiers, whereas Wang and Zhang 20 developed a two-stage ensemble model for enterprise risk early warning. Arora and Kaur 21 further demonstrated the stability of random forests (RFs) with Bolasso-selected features. These advancements hold particular relevance for the NEV industry, characterized by rapid technological and market dynamics.
With the further deepening of scholars’ application of machine learning, research has emerged on horizontally comparing the prediction accuracy of various machine learning models and improving machine learning models using different algorithms. Yu et al. 22 identified classification and regression trees (CART) as optimal for green enterprise credit ratings, while Wang and Liu 23 benchmarked GA-optimized RF, BP neural networks, and SVM in green supply chain contexts. Methodological innovations include Feng et al.’s 24 two-stage feature selection (FS) framework and Shen et al.’s 25 particle swarm optimization (PSO)-enhanced BP neural networks. These developments provide critical technical foundations for NEV-specific model construction.
In summary, while linear models validate financial indicators’ discriminative power, their inherent assumptions conflict with the NEV industry’s nonlinear “technology-market coevolution” risks. Conversely, neural networks’ black-box nature and insufficient domain knowledge integration hinder regulatory applicability—a key factor underlying inconsistent risk evaluations across models. Crucially, no prior study has systematically compared linear and nonlinear models within unified feature spaces to quantify their differential advantages (e.g., Logit’s financial data proficiency vs BP’s high-dimensional signal extraction). This comparative investigation not only validates structured-unstructured data fusion but also enriches NEV risk assessment frameworks.
Construction of credit risk indicators
Conventional research predominantly employs only financial indicators, such as debt ratios in regression models. Yet real-world enterprises face composite risks encompassing externalities beyond financial metrics. Huang et al. 26 pointed out that a single indicator cannot effectively evaluate a company’s credit risk, especially for a considerable number of multinational corporations, which are susceptible to factors such as policies and reputation.
Scholars have addressed this limitation through multidimensional systems. Kanno 27 incorporated ESG ratings, observing pronounced risk mitigation in capital-intensive industries. Sousa et al. 28 extended static credit scoring via dynamic modeling, while von Negenborn et al. 29 identified nonlinear correlations between rainfall anomalies and enterprises defaults. These innovations universally enhanced predictive accuracy.
With the development of the comprehensive indicator system, textual indicators have gradually gained attention in the construction of the system. Roeder et al. 30 linked negative analyst report sentiment to elevated default probabilities. Wang et al. 31 applied BERT to legal texts for risk prediction, and Crosato et al. 32 uncovered textual indicators’ corrective potential when accounting metrics fail.
Nevertheless, existing frameworks remain inadequate for NEV-specific risks. Financial indicators poorly capture policy cycle interactions, while composite systems overlook critical NEV-specific factors: battery recycling compliance costs, critical mineral supply chain ethics, etc. However, although existing research has constructed a multidimensional indicator system, it has failed to systematically integrate key issues such as industry-specific battery recycling compliance costs, ethical risks in key mineral supply chains, and policy cycle sensitivity, and has insufficient adaptation to the risk characteristics of the new energy vehicle industry.
Moreover, insufficient integration of core financial and domain-specific indicators undermines data synergy. Our tri-dimensional system (“Financial Robustness–Strategic Credibility–Environmental Resilience”) addresses these gaps: financial metrics quantify short-term solvency, ESG ratings reflect mid-term policy adaptability, and annual report tone analysis deciphers strategic authenticity. This architecture dynamically integrates policy sensitivity, technological uncertainty, and environmental compliance risks, providing a methodological toolkit for identifying NEV-specific credit risk patterns.
Development of credit risk assessment models
Determination of financial risk evaluation indicators for the NEV industry
The core of the NEV industry’s supply chain finance model lies in constructing a trinity framework of “technology-driven innovation, ecological synergy, and value circulation” to form an integrated industrial-financial closed loop. Centered around power battery manufacturers or OEMs, the NEV supply chain connects upstream suppliers (e.g., lithium mining, cathode material producers) with downstream service providers (e.g., charging infrastructure operators, battery recyclers), establishing a green value network spanning the entire lifecycle. This model operates through three pivotal mechanisms: technological lock-in effects, carbon footprint traceability systems, and dynamic financing pricing mechanisms, as illustrated in Figure 1. Supply chain finance model for the new energy vehicle industry.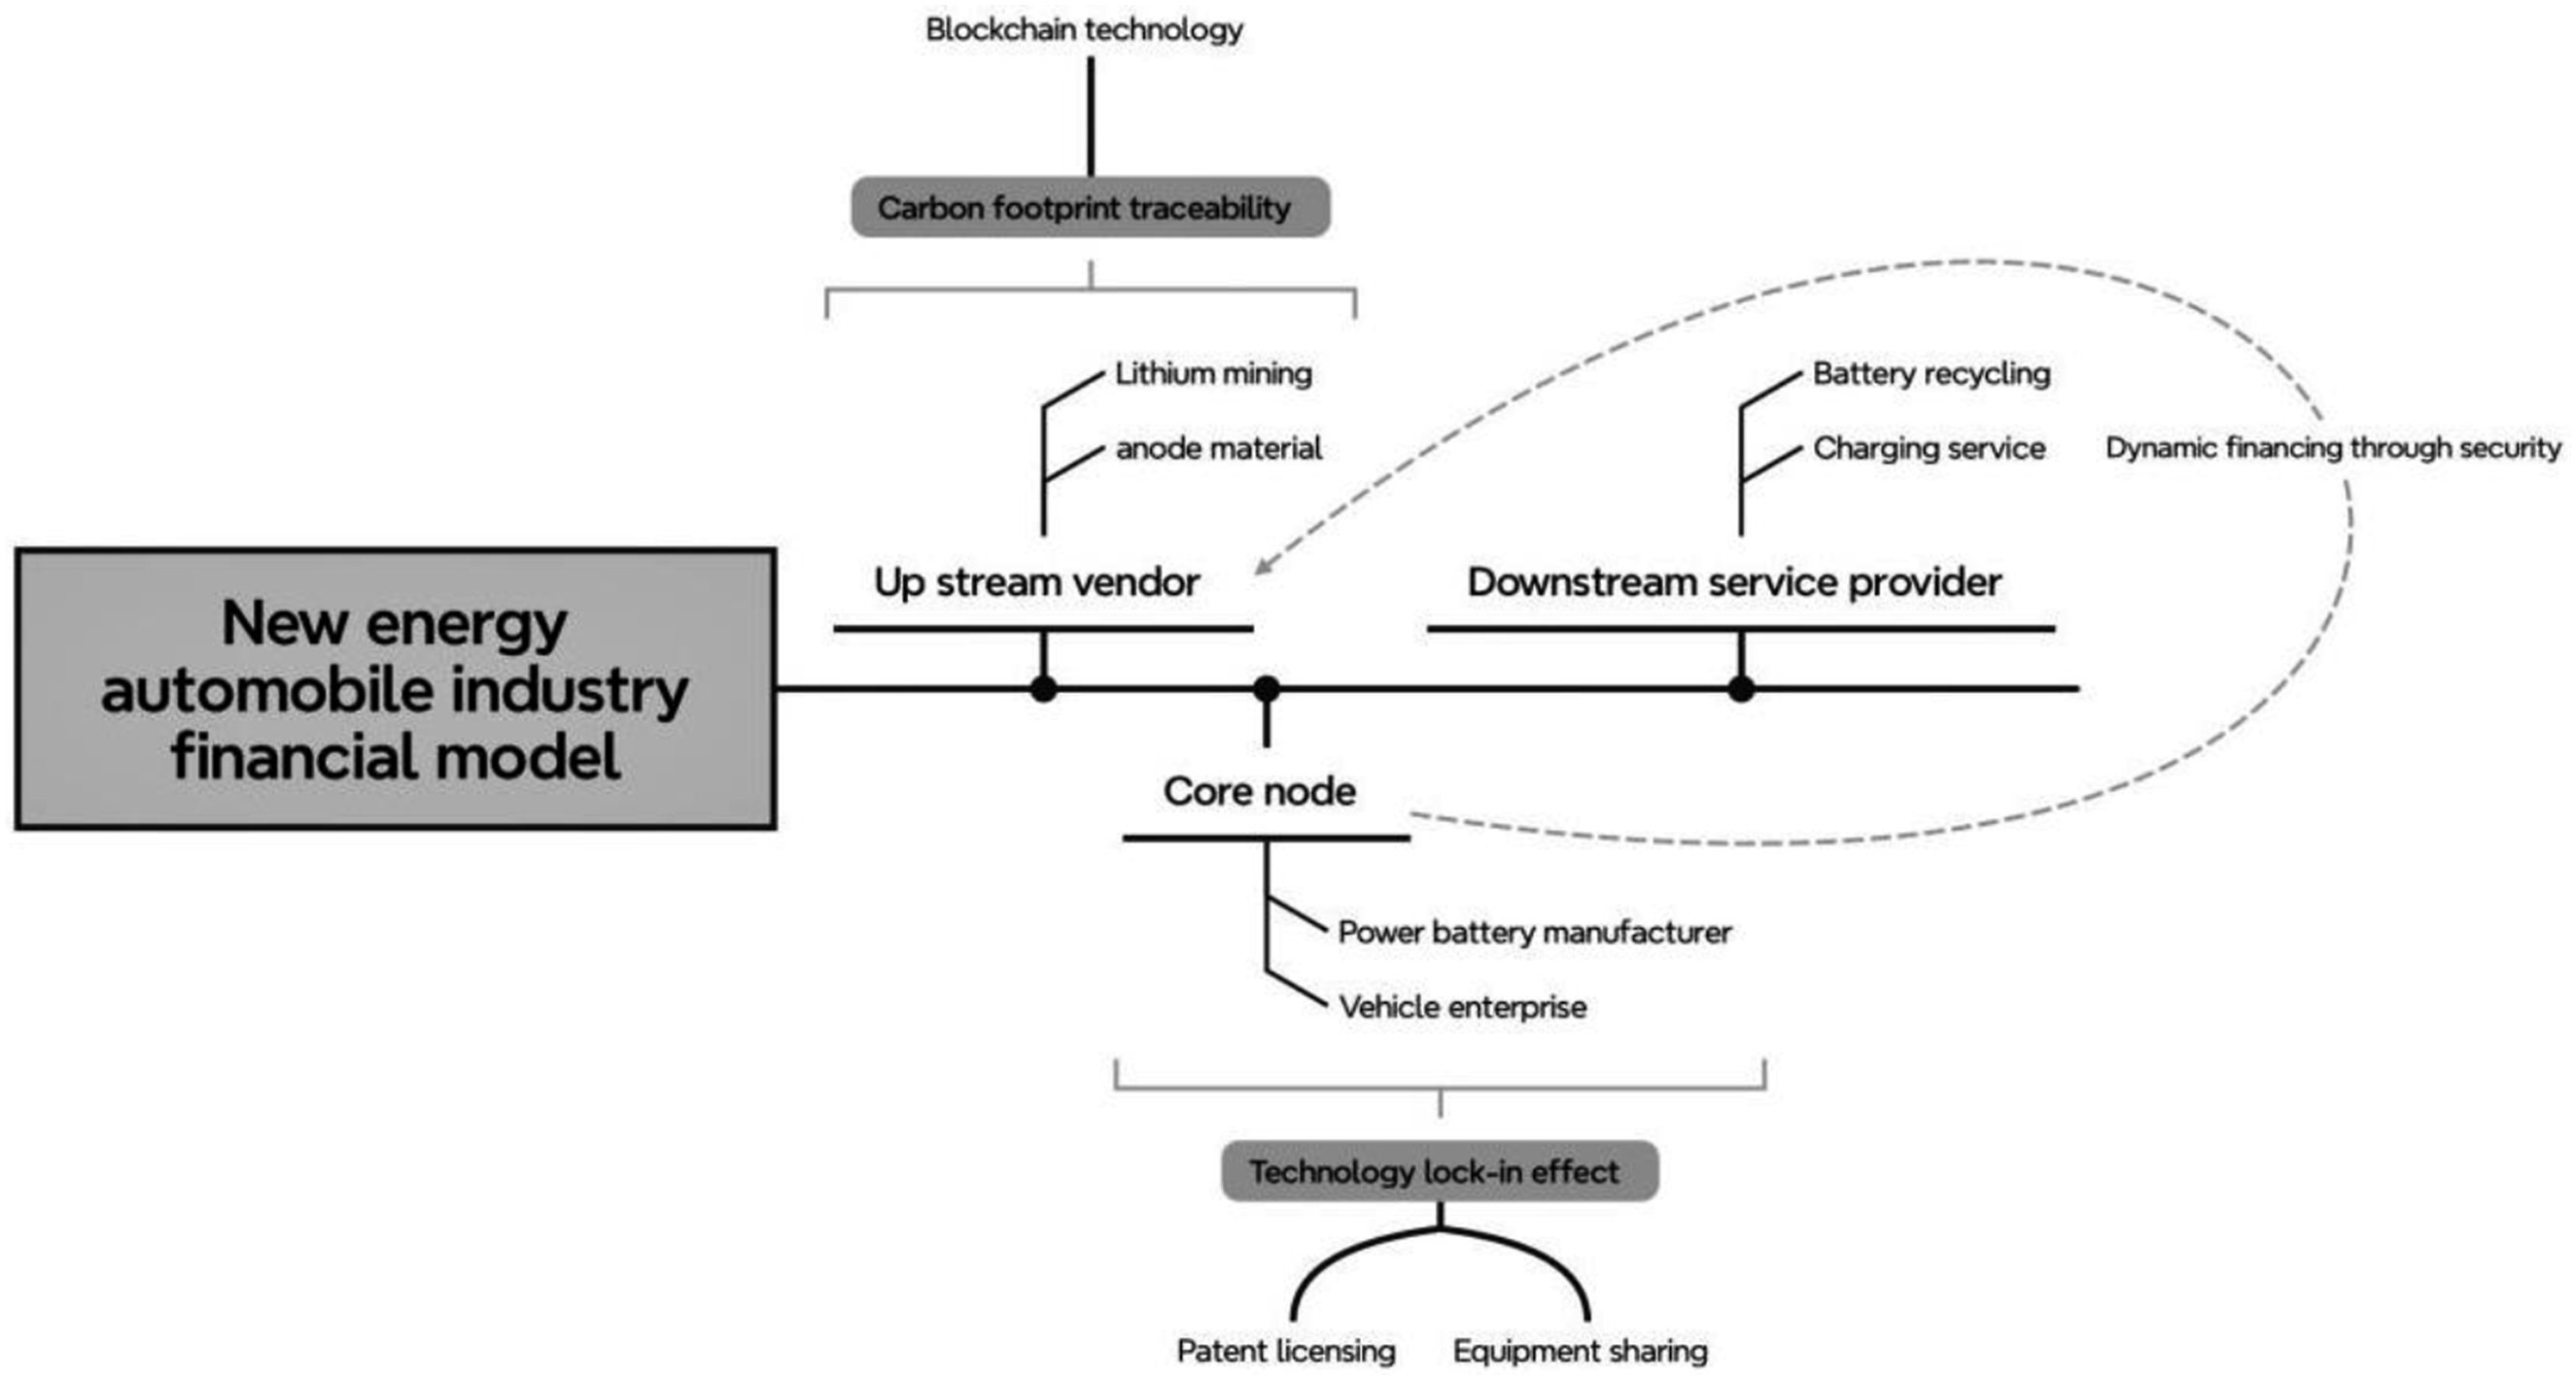
Core enterprises establish technical standards through patent licensing and equipment sharing, fostering stable supply relationships. Blockchain-enabled carbon footprint monitoring from lithium extraction to cascade utilization reduces the carbon intensity of battery production. When upstream diaphragm suppliers face inventory turnover days exceeding industry thresholds due to technological transitions, they secure financing via electronic warehouse receipts guaranteed by core enterprises, with financing costs linked to carbon reduction performance. The interdependence of these mechanisms generates distinct financing demands at various nodes when systemic inefficiencies occur. Consequently, precise credit risk assessment is critical for NEV enterprises to obtain institutional financing.
Construction of the credit risk assessment system
Current credit risk assessment methodologies predominantly rely on financial matrices comprising metrics such as current ratios and liability-to-asset ratios to gauge immediate solvency. However, the NEV industry’s distinctive “high-growth, high-volatility, high-policy-dependency” nonlinear risk profile necessitates indicators that capture strategic risk preferences of management and quantify environmental compliance costs.
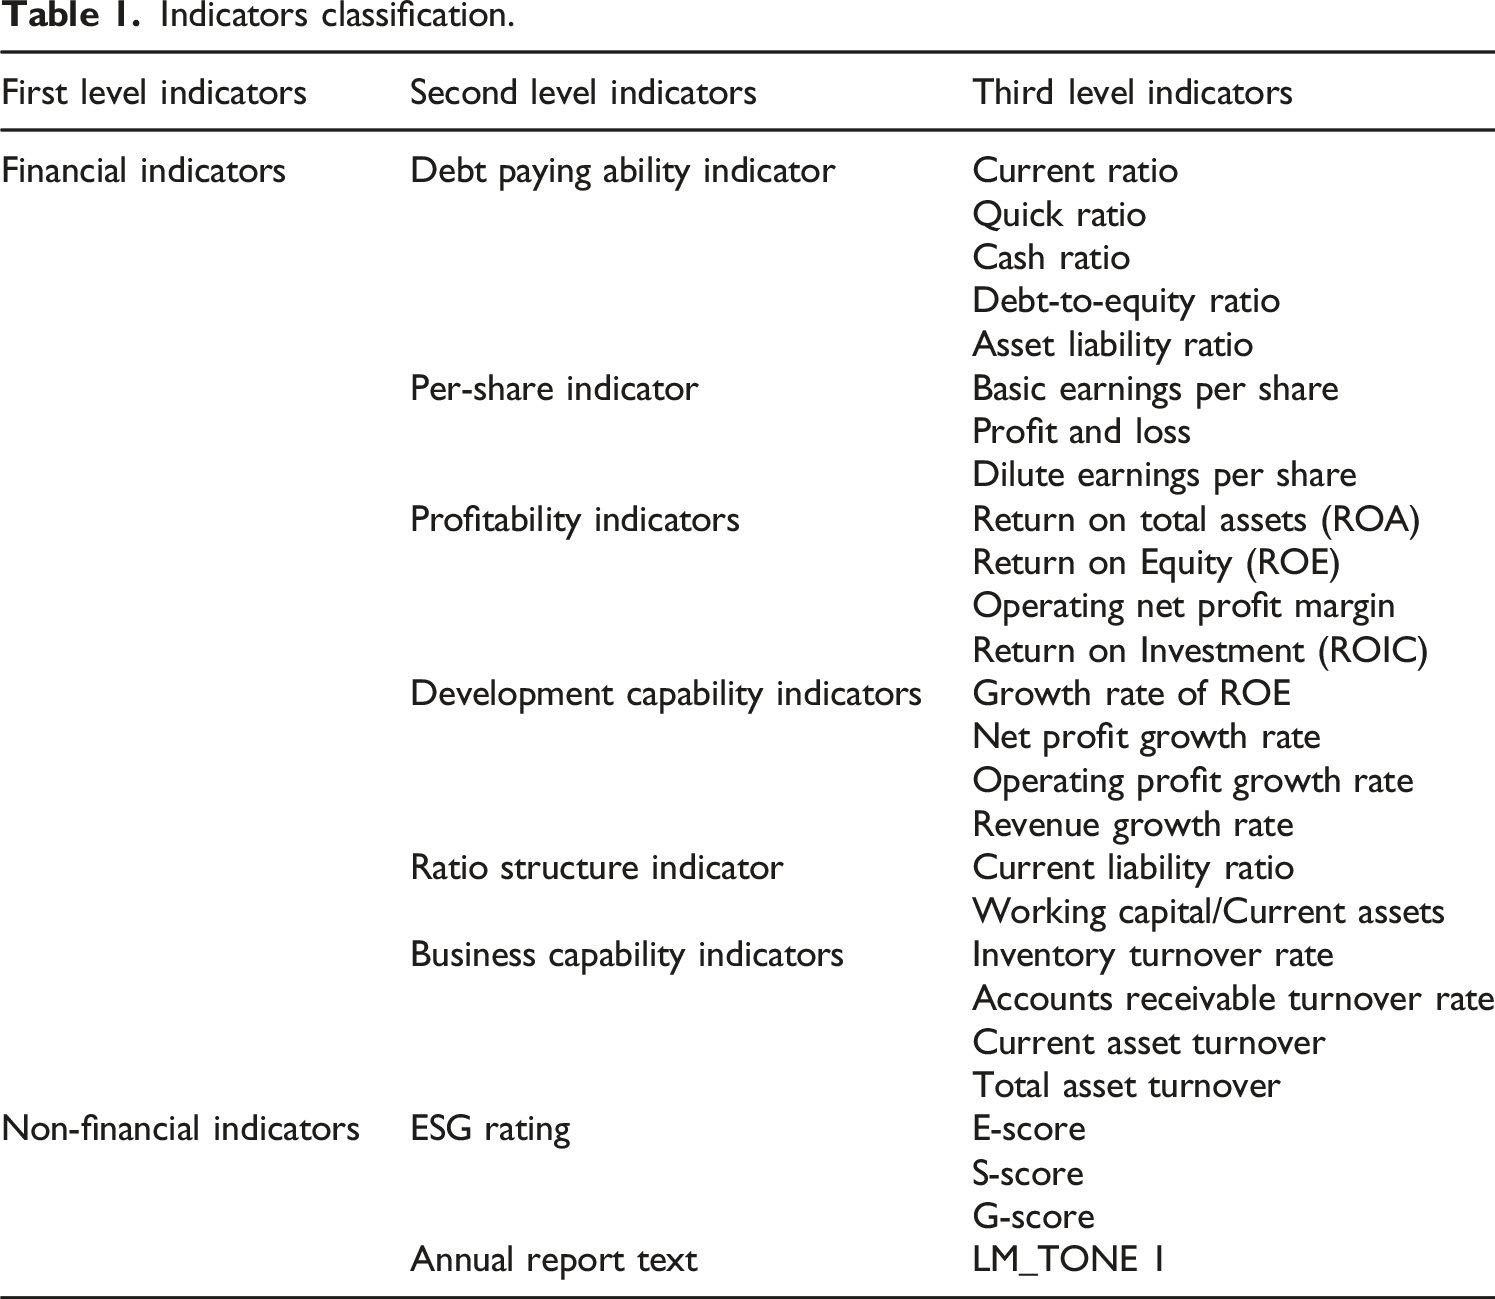
The LM lexicon enables semantic analysis of annual reports through term frequency statistics, identifying management’s semantic biases toward critical issues: technological pathways (e.g., “solid-state batteries,” “sodium-ion”) and policy risks (e.g., “subsidy phase-out,” “trade barriers”). The Annual Report Text Tone Indicator (LM_TONE1) is based on the standardized text analysis module provided by the CSMAR database, and quantifies the emotional tendency of management’s strategic statements by calculating the standardized value of (Positive word count − Negative word count)/Total word count. This module has passed the quality verification of information disclosure by the China Securities Regulatory Commission, and its vocabulary covers professional terms such as policies and technologies in the new energy vehicle industry. Its reliability has been verified in multiple empirical studies. Empirical data shows that when the LM_TONE1 value of suppliers is higher than a certain value, it is often accompanied by over exaggeration of technological breakthroughs and abnormal increase of R&D expense capitalization rate, which provides evidence for identifying the risk of “innovation foam.” Compared to lagging financial indicators, LM_TONE1 detects shifts in management’s risk perception 3–5 months prior to technological or policy disruptions.
For measuring the external environment, this article uses Huazhong ESG rating data, and its rating system is compatible with MSCI ESG methodology, covering three dimensions: environmental compliance (E), supply chain ethics (S), and governance transparency (G). Environmental score (E-score) quantifies carbon intensity and resource circularity rate, directly reflecting compliance-driven technological upgrade costs; Social score (S-score) tracks supply chain ethics controversy frequency (cases/year), predicting raw material premiums and ESG divestment risks. Governance score (G-score) assesses technical decision transparency via board voting consistency indices. This tripartite system constructs a proactive early-warning mechanism, identifying policy shocks and technological ethics risks 6 months earlier than financial metrics through three filters: environmental compliance pressure (E), supply chain resilience (S), and decision-making rationality (G).
Indicators classification.
Sample selection
This study focuses on the NEV industry, selecting listed enterprises within the industrial chain based on the China Securities Regulatory Commission (CSRC) industry classification guidelines and the STAR Market strategic emerging sector criteria. Targeting power battery systems, core materials, and intelligent equipment manufacturers, we initially identified 50 NEV manufacturing firms with data spanning 2019–2023. After excluding entities with abnormal financial records or incomplete disclosures, 46 representative listed companies were retained. The sample encompasses key segments: battery assembly (e.g., BYD, Guoxuan High-Tech), cathode materials (Ronbay Technology, Hunan Changyuan Lico), separators (Yunnan Energy New Material), and electrolytes (Tinci Materials). These firms exhibit technology-intensive characteristics, with R&D investment exceeding 5% of revenue and fixed-asset ratios above industry averages. The sample covers new energy vehicle industry clusters such as the Yangtze River Delta (62%) and the Pearl River Delta (23%), with medium-sized enterprises (revenue of 5–20 billion yuan, accounting for 68%) as the main scale, which is in line with the high industry concentration and policy-driven characteristics. This article focuses on the credit risk assessment of China’s new energy vehicle industry, and its policy-driven characteristics are significantly different from those of the European and American markets. Given the local knowledge attribute of the research problem, the sample selection at this stage has inherent logical consistency, and in the future, it can be extended to the European and American markets to verify the model’s generalization ability. Given the policy-driven nature and technological disruption risks inherent to the NEV sector, these enterprises face acute financing constraints during capacity expansion and technological upgrades—a core focus of our credit assessment framework.
Data were sourced from the China Stock Market & Accounting Research Database (CSMAR), China National Research Data Service Platform (CNRDS), and the National Enterprise Credit Information Publicity System. After consolidation, the dataset comprises 203 sample points from 46 firms over 5 years. The Logit model, due to its strong interpretability of parameters and wide applicability, can provide baseline comparisons for nonlinear models; BP neural network captures complex nonlinear features through hidden layer structure and backpropagation mechanism, which is in line with the interaction risk between technological iteration and policy dependence in the new energy vehicle industry. Although other models such as XGBoost and random forest perform well in nonlinear modeling, their black-box characteristics and insufficient integration of industry knowledge may weaken regulatory applicability. Therefore, this study chose Logit and BP neural networks as representative linear and nonlinear models for comparison. To enhance prediction efficacy of BP neural networks and Logit models, samples were partitioned into training and test sets at a 3:1 ratio. About the default Definition: Enterprises exhibiting any of the following within the study period were classified as default entities, labeled ST: Non-performing assets; Abnormal financial performance; Regulatory investigations into managerial misconduct; Material misstatements in operational disclosures. Non-default entities (non-ST) lacked such records. Given the mixed data types (absolute values, ratios, scores), all indicators underwent normalization. Negative indicators were inversely transformed, followed by positive standardization and dimensionless processing to ensure metric consistency and comparability.
Empirical analysis
Principal component analysis
The financial indicators selected in this study are categorized into six dimensions: solvency, per-share metrics, profitability, growth capacity, ratio structure, and operational efficiency, comprising 22 detailed metrics sourced from the CSMAR database. Each dimension reflects distinct credit risk attributes: Solvency measures cash payment capacity, inversely correlated with credit risk; Per-share metrics evaluate stock returns and market stability, with higher stability indicating lower risk; Profitability assesses profit generation capability, directly linked to creditworthiness; Growth capacity indicates developmental potential, where promising growth prospects mitigate risk; Ratio structure analyzes capital composition, with higher debt ratios escalating risk. Operational efficiency quantifies asset utilization effectiveness, where operational stability reduces risk.
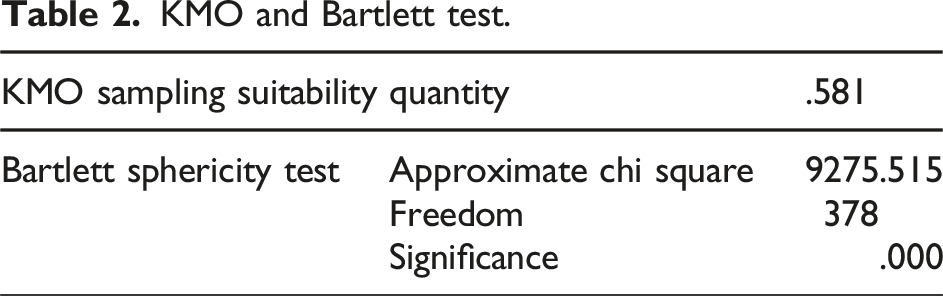
KMO and Bartlett test.
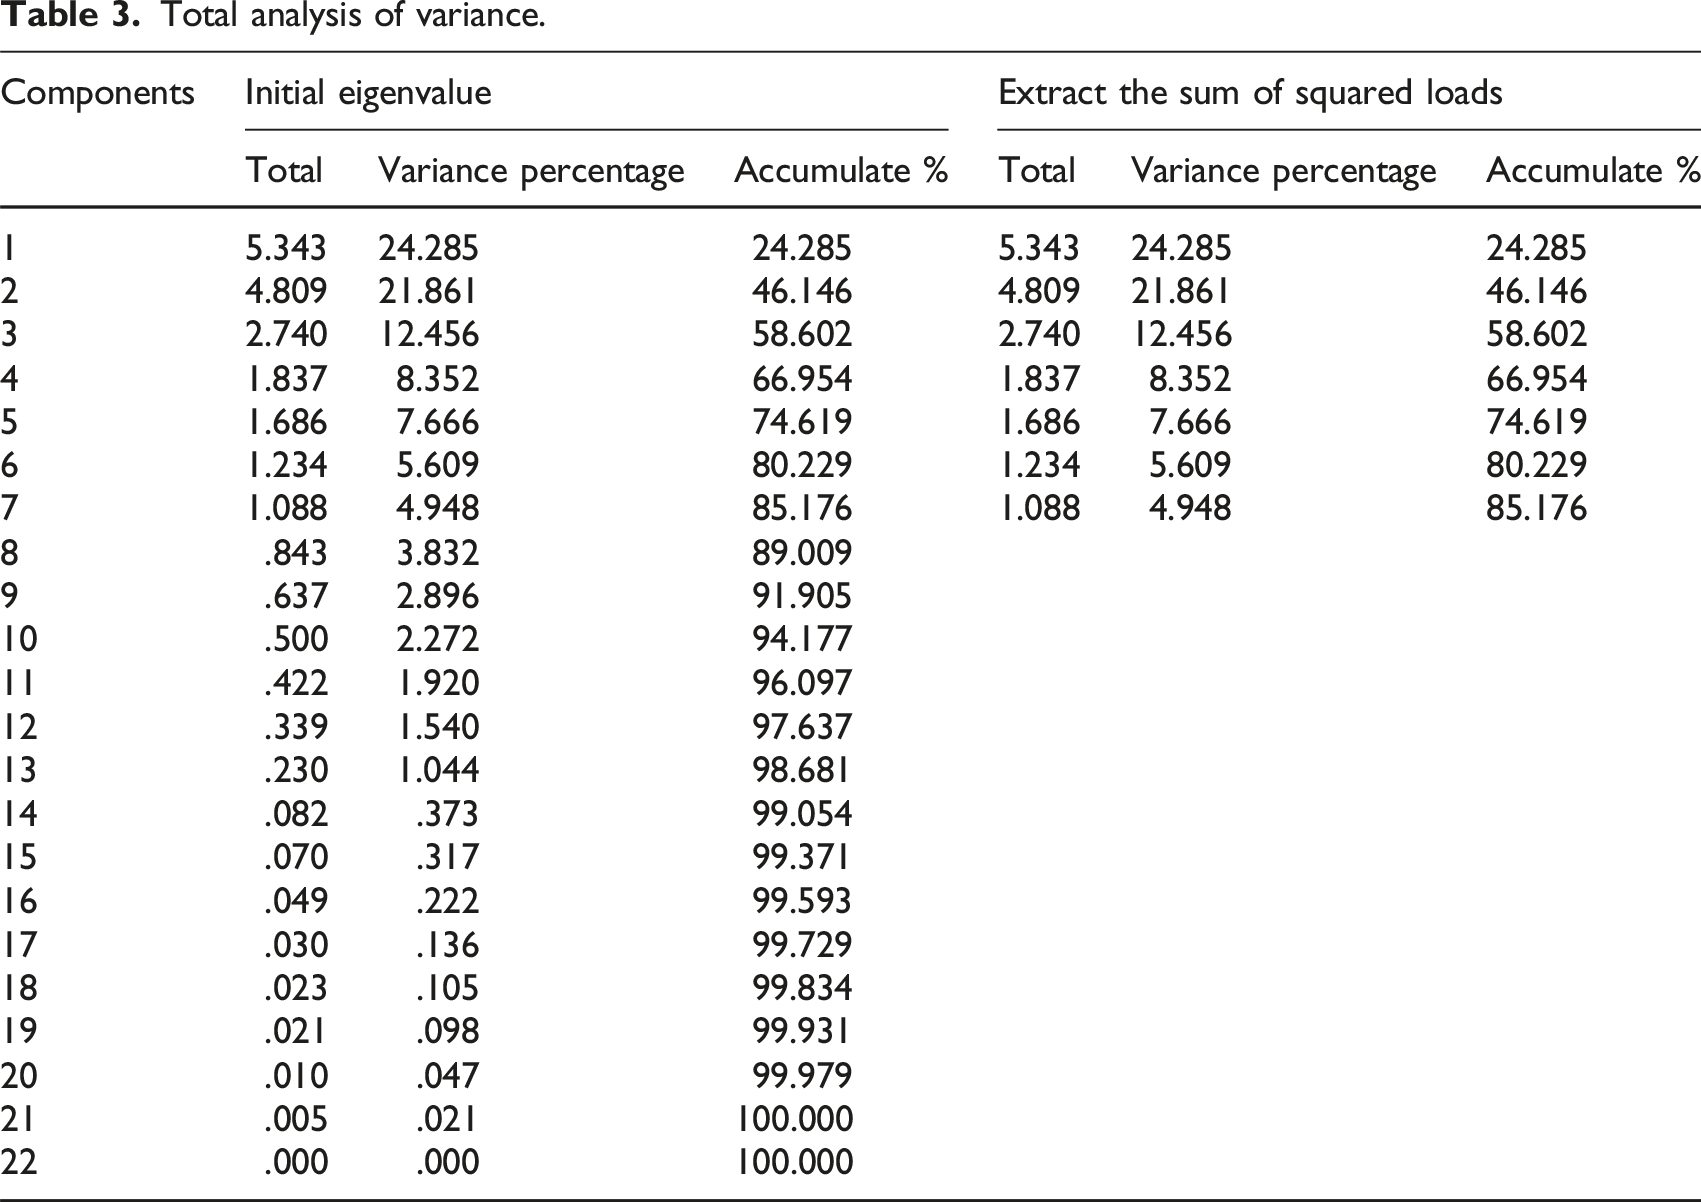
Total analysis of variance.
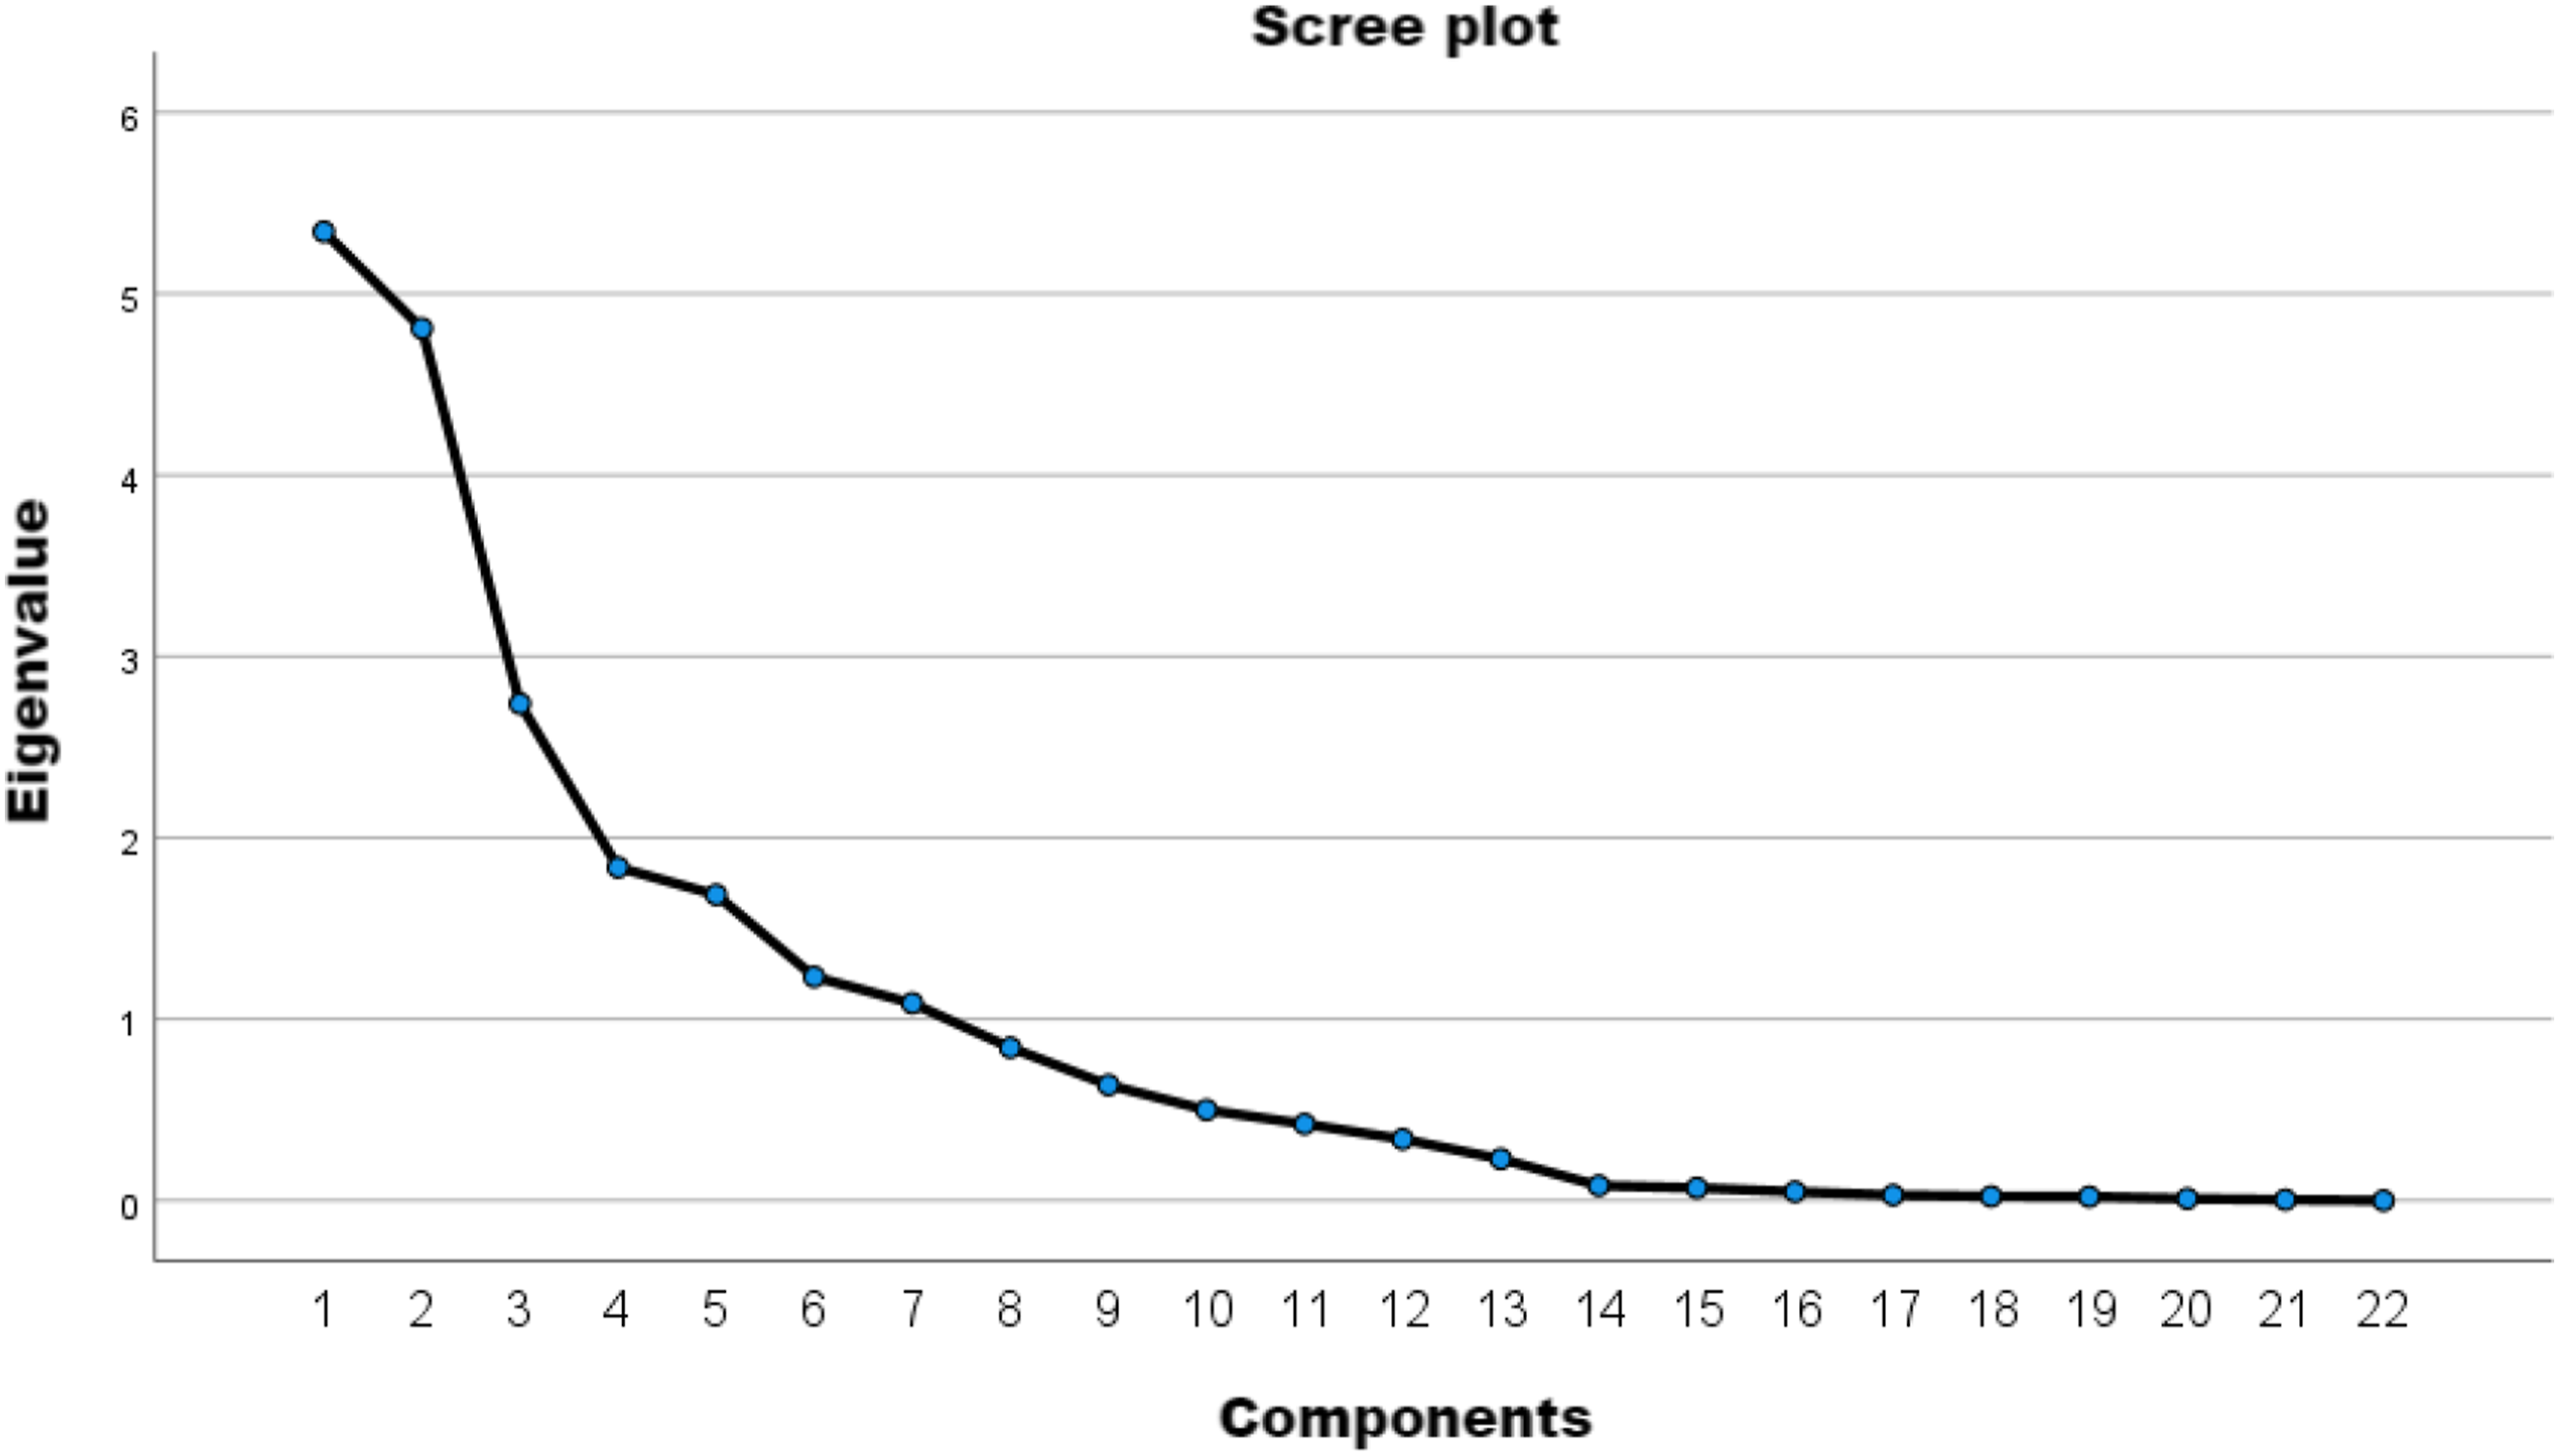
Scree plot.
Rotating component matrix.
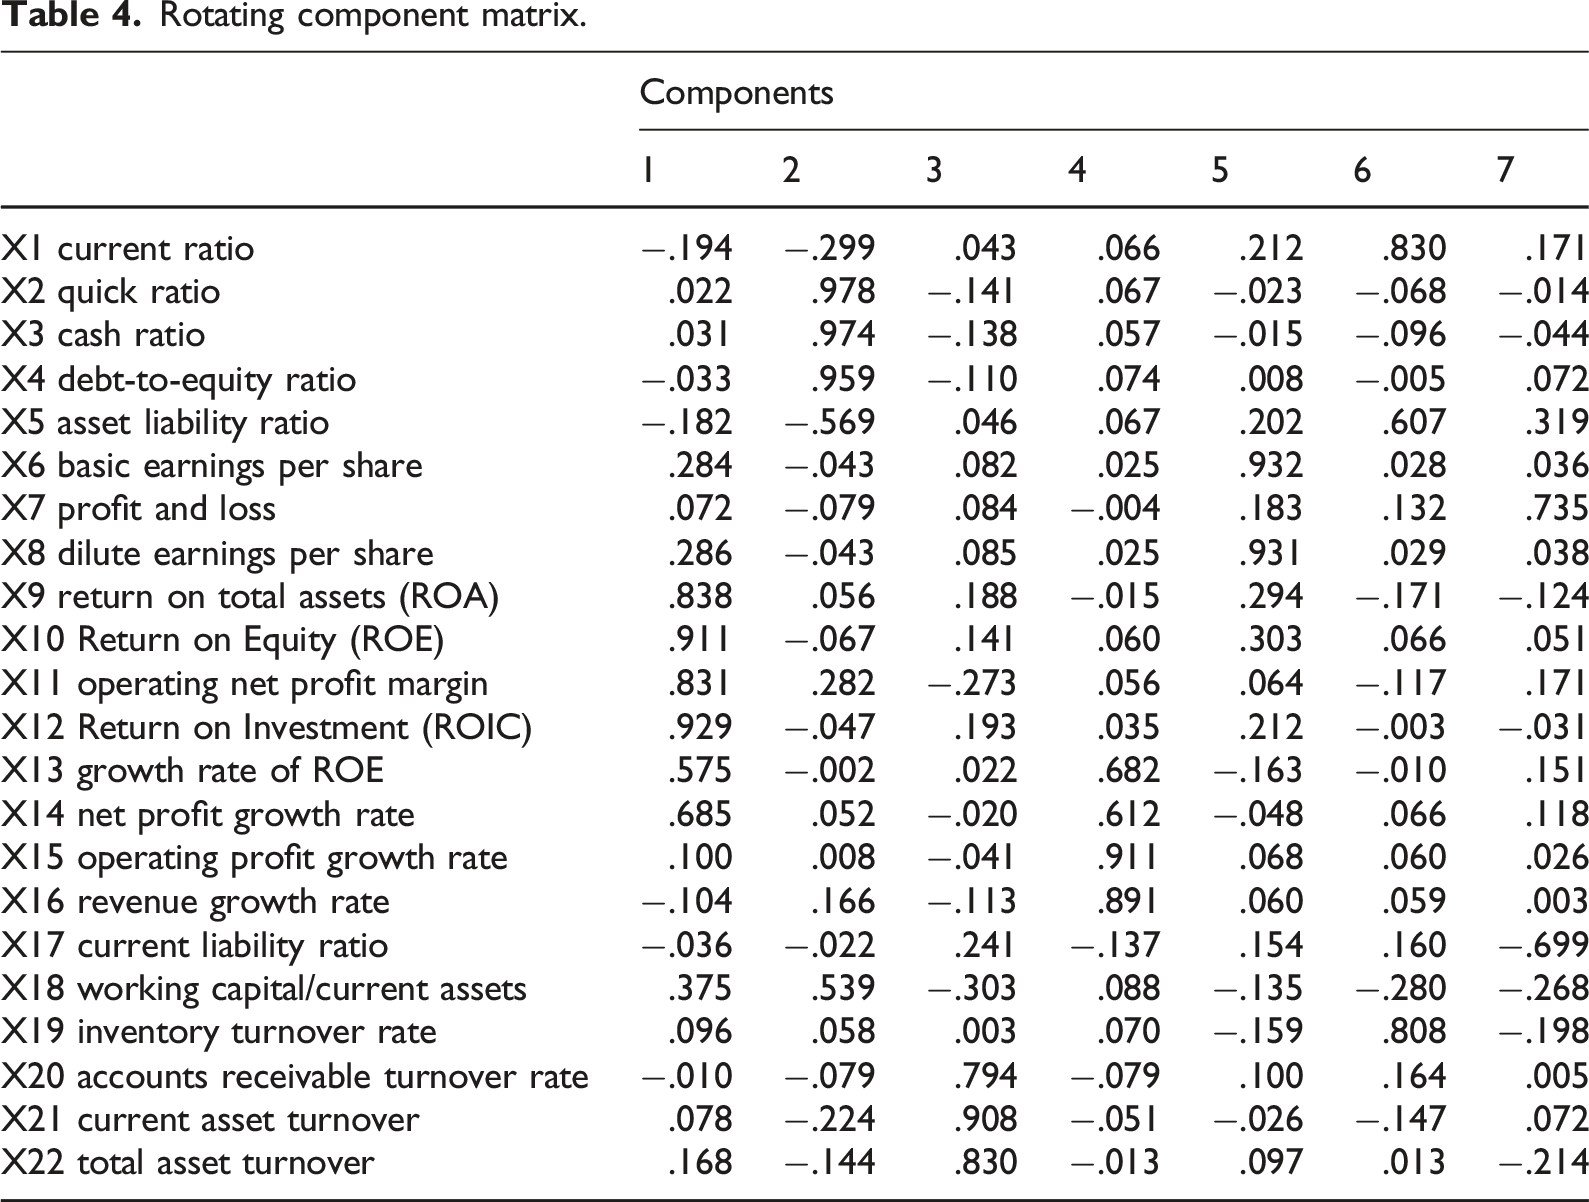
Z1 (Profitability Factor): High loadings (>0.83) on return on total assets (0.838), return on equity (0.911), net operating margin (0.831), and return on invested capital (0.929). Z2 (Solvency Factor): Dominant loadings (>0.95) on quick ratio (0.978), current ratio (0.974), and cash ratio (0.959). Z3 (Operational Efficiency Factor): Significant loadings on accounts receivable turnover (0.794), current asset turnover (0.908), and total asset turnover (0.830). Z4 (Growth Capacity Factor): Key loadings on ROE growth (0.682), net profit growth (0.612), operating profit growth (0.911), and revenue growth (0.891). Z5 (Per-Share Metric Factor): Primary loadings on basic EPS (0.932) and diluted EPS (0.931). Z6 (Asset Management Factor): Notable loadings on equity ratio (0.830), debt-to-asset ratio (0.607), and inventory turnover (0.808). Z7 (Capital Structure Factor): Moderate loadings on non-recurring gains/losses (0.735) and current liability ratio (0.699).
Composite principal component scores were computed via SPSS based on factor eigenvalues and explained variance. These seven factors, combined with quantified annual report tone (LM_TONE1) and ESG ratings, were input into Logit and BP neural network models for training.
Test based on Logit model
The Logit model is a regression analysis method widely used in binary classification problems. It maps the linear combination of predictor variables to the [0,1] interval through a logistic function, and outputs the probability of an event occurring. The core formula is:
The dependent variable in this article is binary (defaulting enterprise ST or non-defaulting enterprise non-ST), and the Logit model that can directly output the probability of default is applicable. The parameters of the Logit model can be obtained through maximum likelihood estimation, making the results interpretable. At the same time, the Logit model has been widely used in the field of credit risk assessment, which is convenient for comparison with existing research. Therefore, this study chooses the Logit model to assess credit risk.
Logit sample classification.
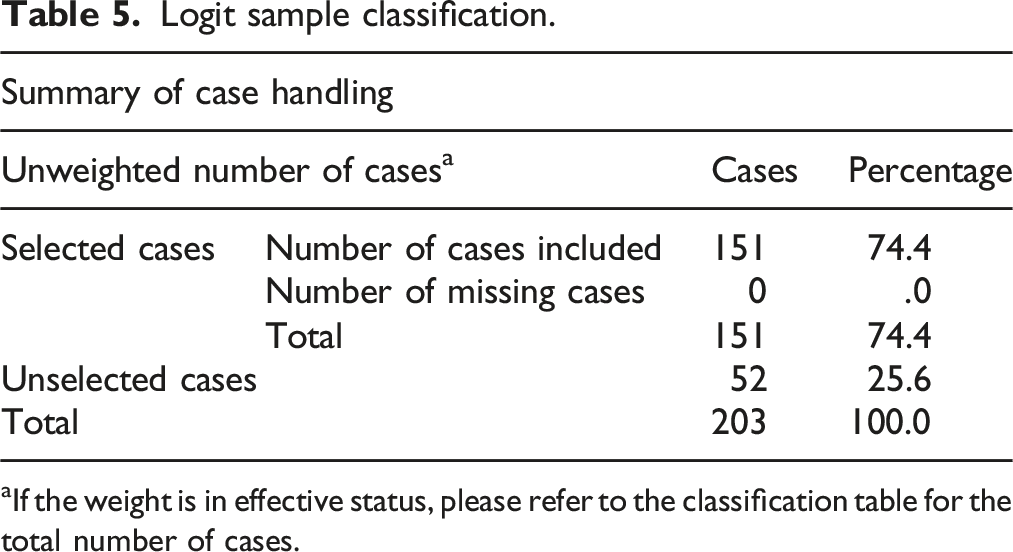
If the weight is in effective status, please refer to the classification table for the total number of cases.
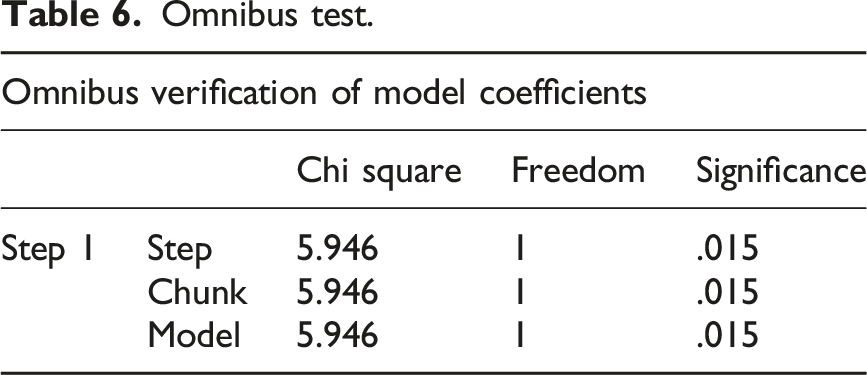
Omnibus test.
Partial variable coefficient.
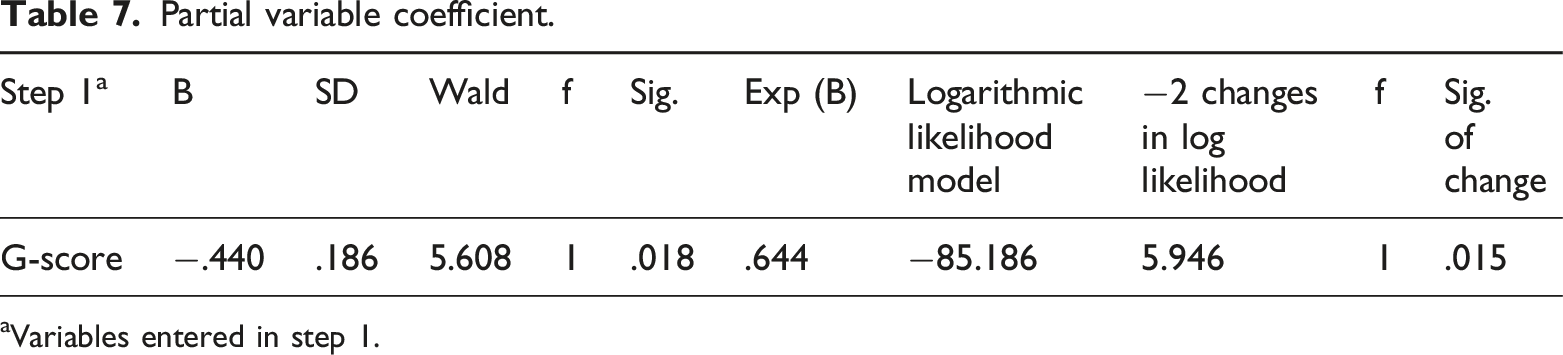
Variables entered in step 1.
Model summary.
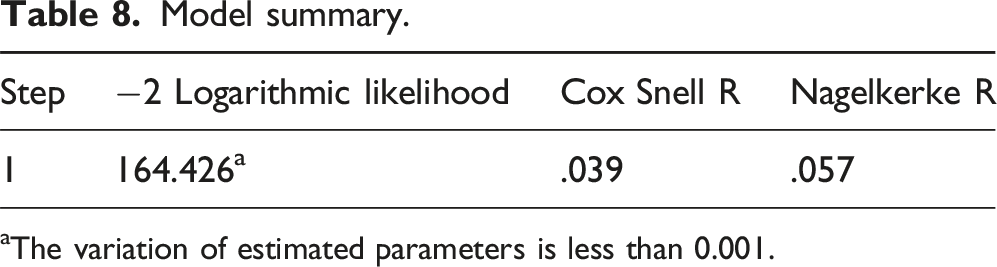
The variation of estimated parameters is less than 0.001.
Classification prediction.
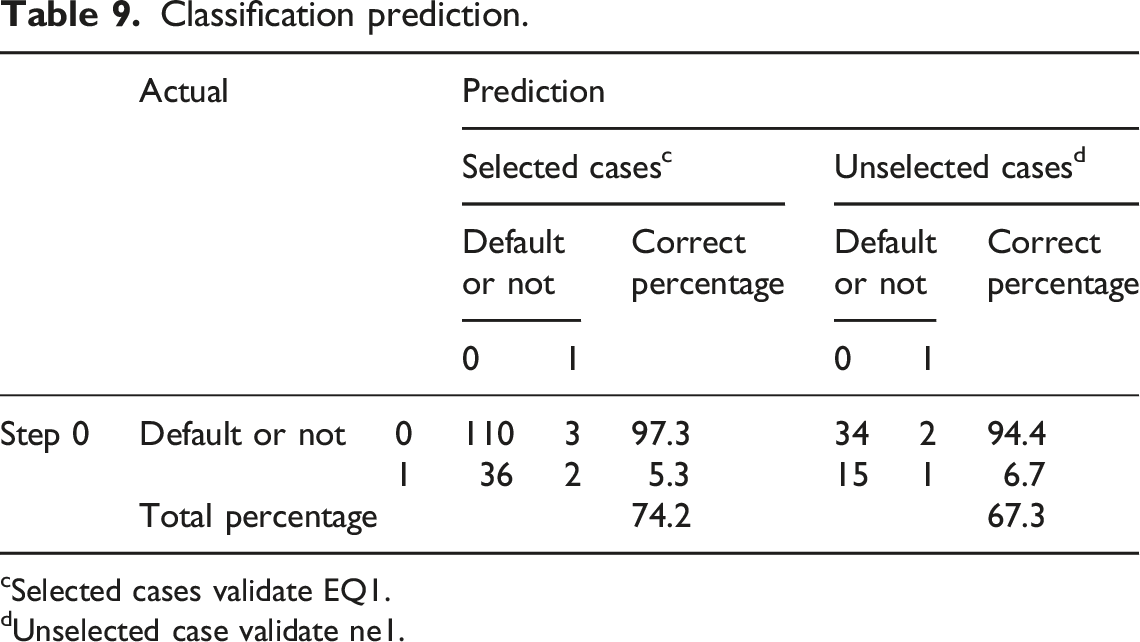
Selected cases validate EQ1.
Unselected case validate ne1.
The Z5 and Z7 factors in the Logit model results did not pass the statistical test, possibly due to sample size limitations or weak direct correlation between the indicators and credit risk. From the results of the classification prediction table, it can be seen that although the overall accuracy of the model is high, the recognition rate of defaulting enterprises is low (5.3%), indicating the need to further optimize variable selection or combine nonlinear methods to improve prediction accuracy. This test confirms the effectiveness of principal component analysis and Logit model in credit risk assessment, laying the foundation for subsequent comparisons.
Test based on BP neural network
BP neural network is a concept proposed by scientists led by Rumelhart and McClelland in 1986.
33
It is a feedforward neural network that optimizes weights through error backpropagation algorithm and excels at capturing nonlinear mapping relationships between variables. Its main components are divided into three layers: input layer, hidden layer, and output layer. The input layer receives raw data and standardizes it, transforming external features into network processable numerical signals that are passed on to the hidden layer; the hidden layer abstracts high-order features of the input signal through nonlinear activation functions, mining complex interaction relationships between variables to enhance the model’s expressive power; the output layer maps the abstract features of the hidden layer to specific predicted values. The existing research lacks clear evidence that increasing the number of layers of BP neural network is positively correlated with the fitting.
34
performance of the model. Therefore, taking the simplest three-layer model as an example, the formulas for the forward propagation and backward update mechanisms involved are as follows: (1) Hidden layer output calculation
The activation output of the jth neuron in the hidden layer is: (2) Output layer response calculation
The predicted output of the kth neuron in the output layer is: (3) Parameter backpropagation update
By using gradient descent to update the network parameters layer by layer (where η is the learning rate), the output layer weight adjustment amount is:
Among them, the output layer error signal:
Hidden layer weight adjustment amount:
The hidden layer error signal propagates back through the chain rule:
The BP neural network iteratively performs forward propagation and error backpropagation until the loss function converges to a predetermined threshold or reaches the maximum training epochs. The influencing factors of credit risk may have complex nonlinear interactions, and compared to traditional Logit models, it is difficult to fully characterize nonlinear features. BP neural networks can achieve high-order feature extraction through hidden layer structures to improve prediction accuracy and better compensate for this weakness; moreover, the BP algorithm has adaptability in parameter optimization and is suitable for modeling high-dimensional data with heterogeneous indicators such as principal component factors and text tone. Therefore, this article chooses BP neural network for comparative research. Taking the double hidden layer as an example, the topological logic diagram of the BP neural network drawn is shown in Figure 3. BP neural network topology diagram.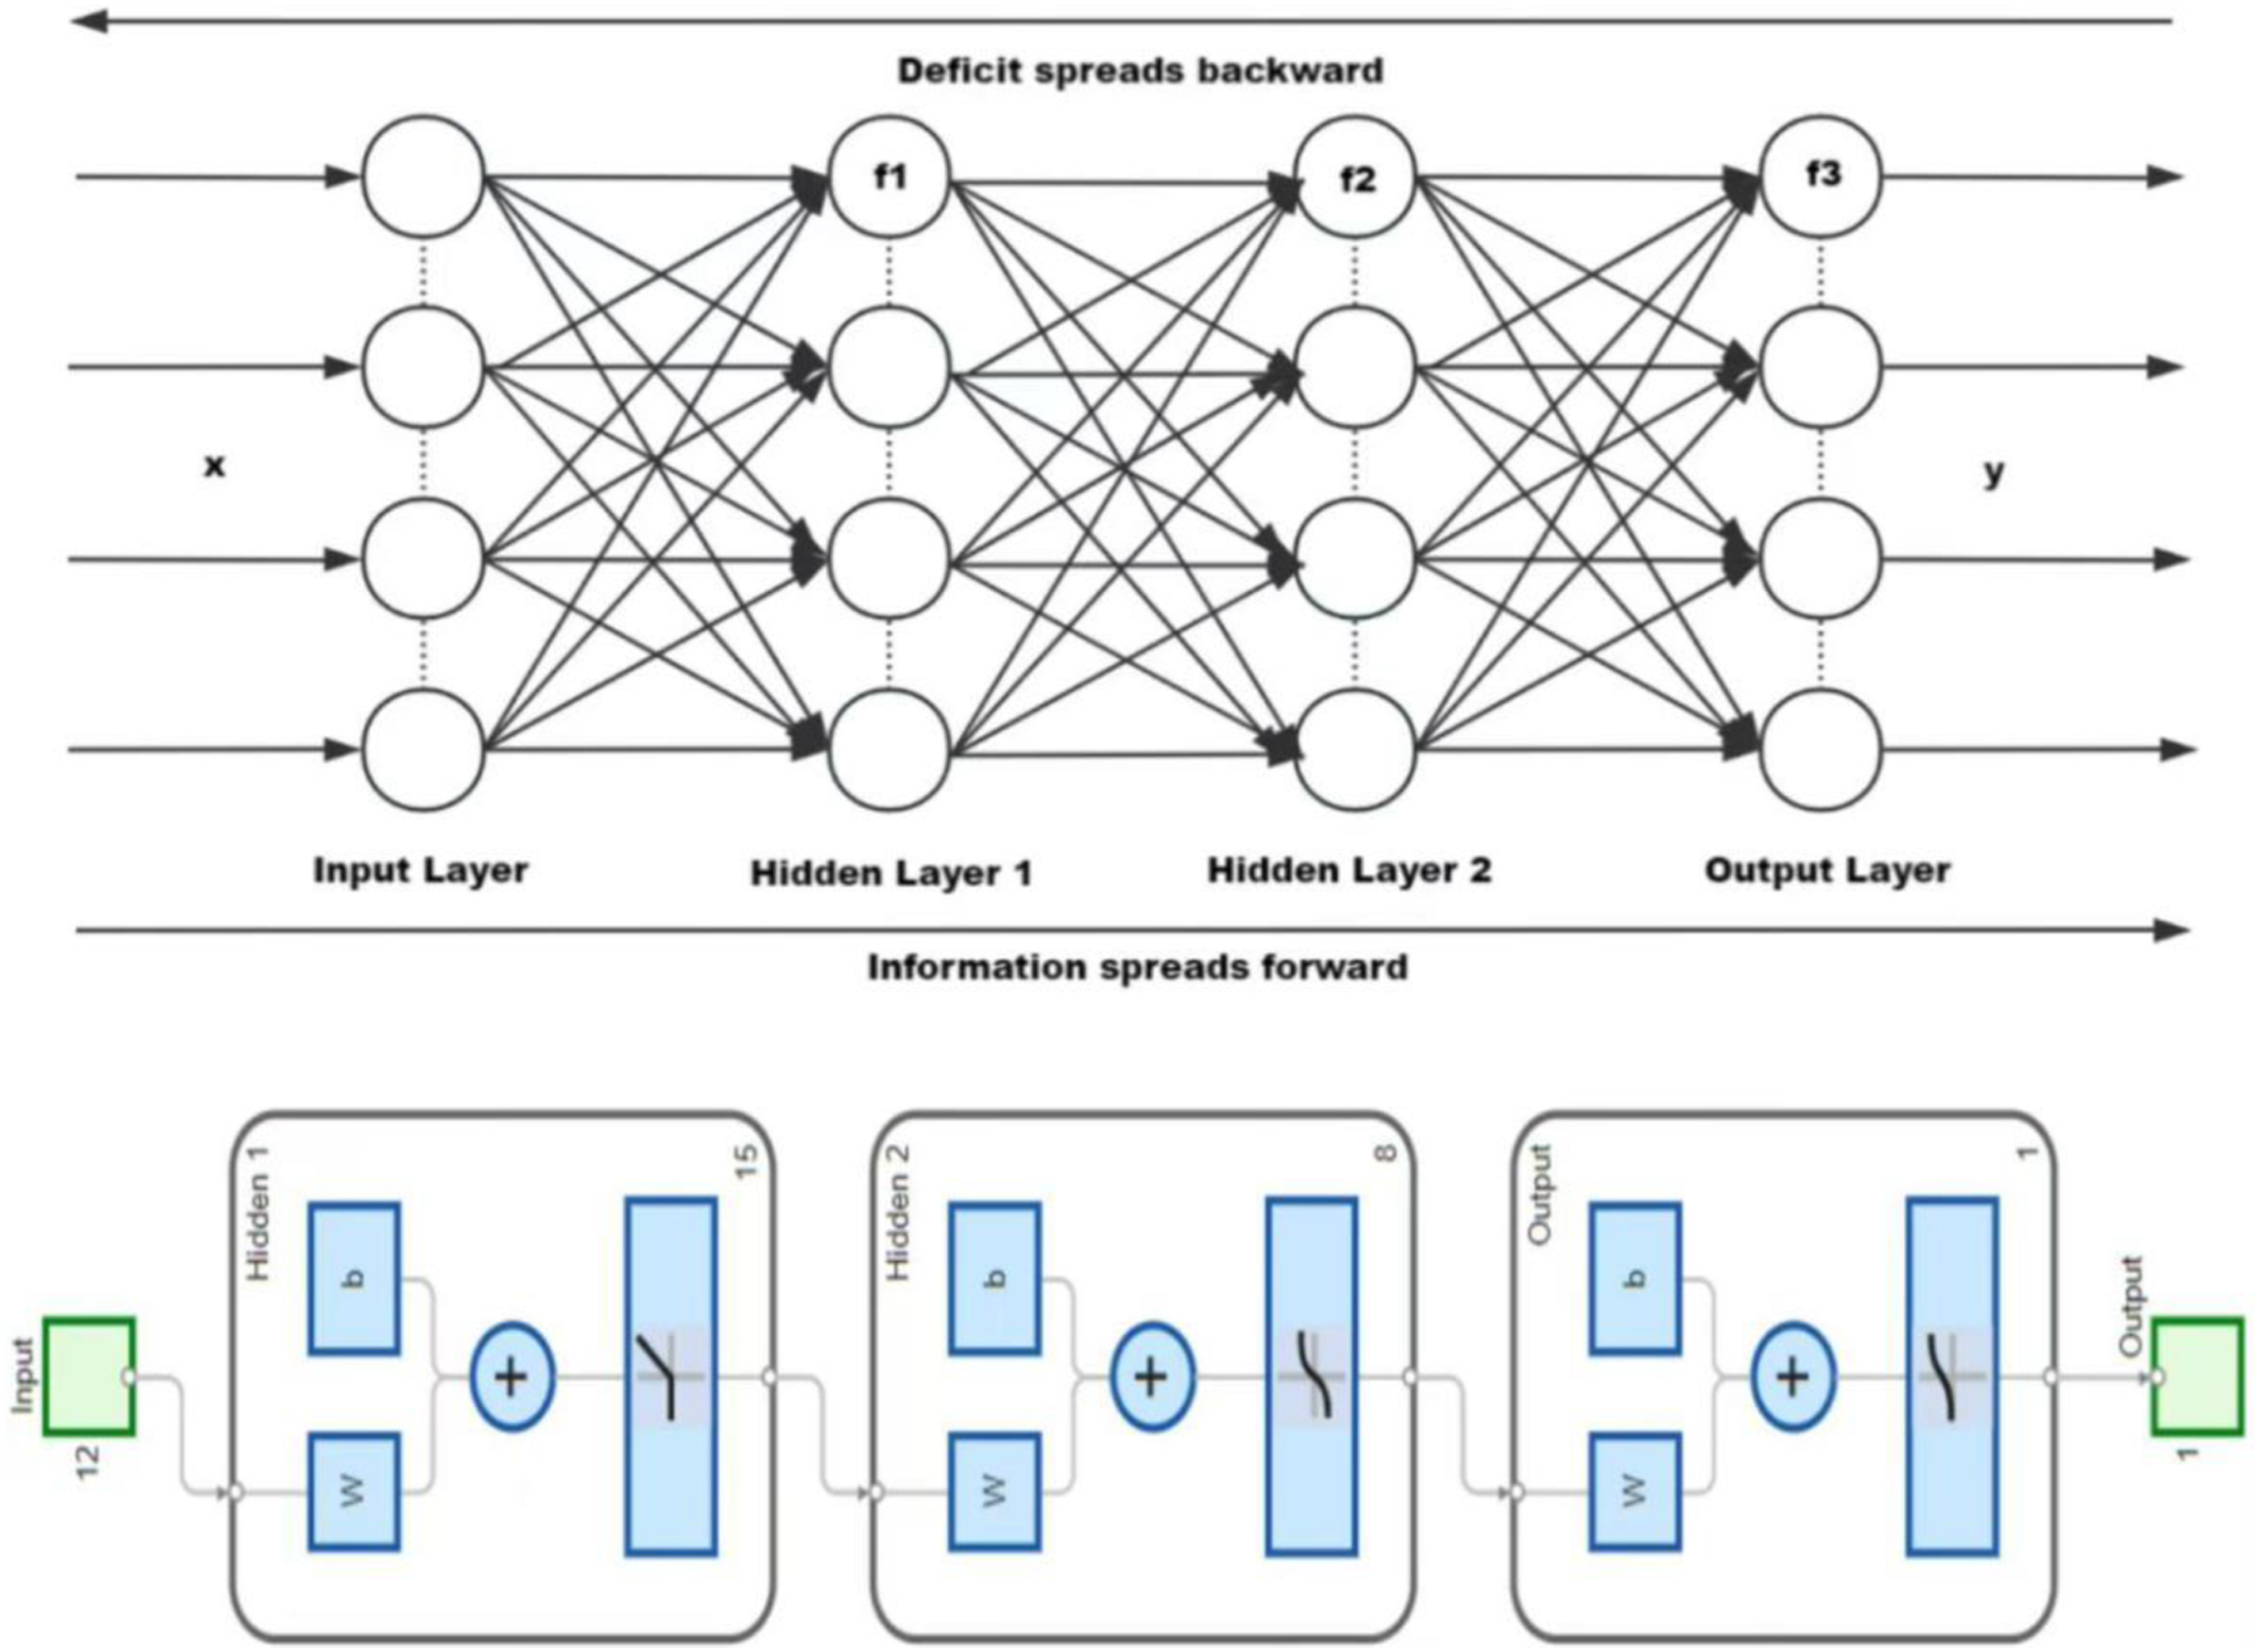
In developing the BP neural network model, the input layer incorporates 11 nodes: seven principal components from factor analysis, annual report tone (LM_TONE1), and ESG ratings. Empirical testing determined a dual hidden layer architecture: the first hidden layer employs hyperbolic tangent (tansig) activation to enhance nonlinear modeling, while the second uses positive linear (poslin) activation to mitigate gradient saturation. The output layer adopts a sigmoid function for binary classification (ST = 1 for default, 0 otherwise), mapping probabilities to [0,1]. Given BP networks’ sample size requirements, 75% of the data was allocated to training.
The network adopts a dual hidden layer structure, which requires a large amount of computation. To improve efficiency, set the maximum number of iterations to epoch = 300; Target error Training state diagram.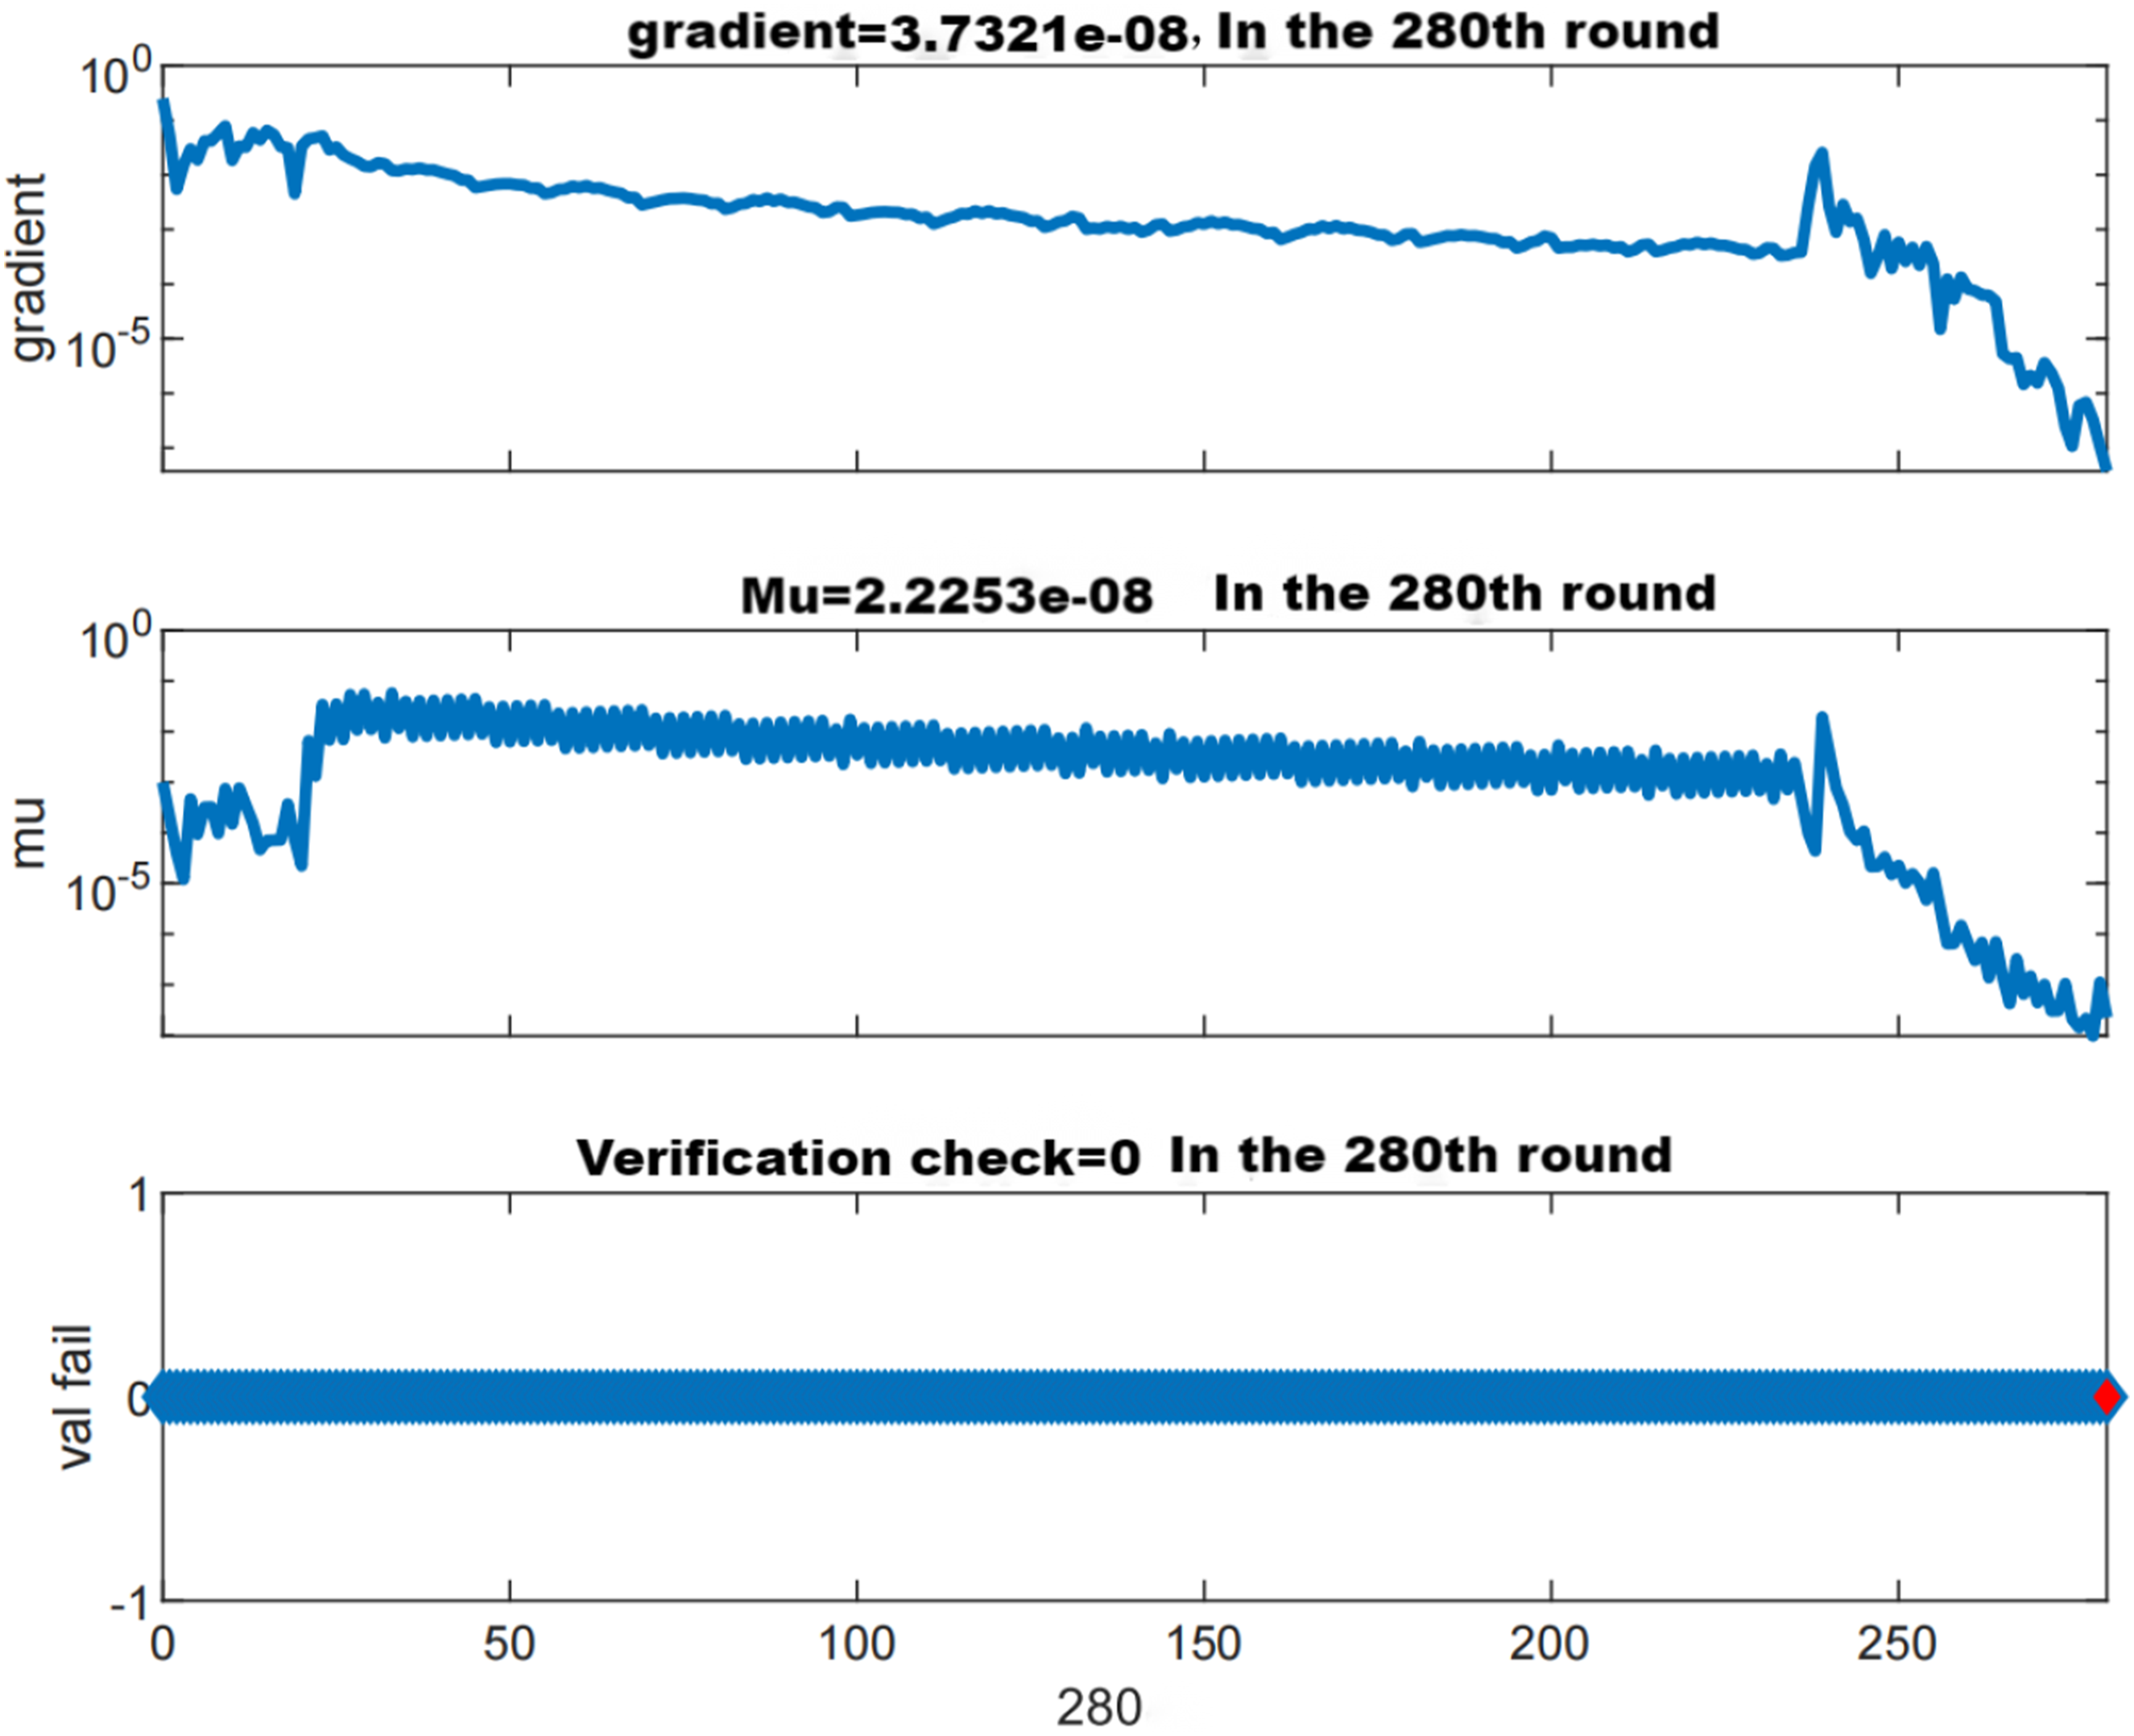
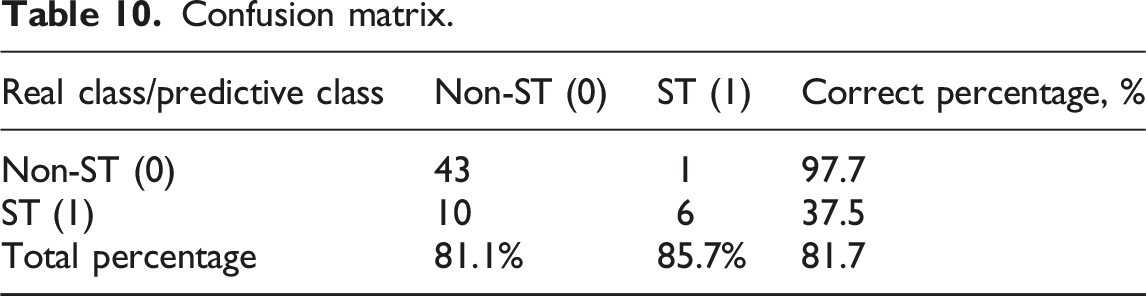
Confusion matrix.
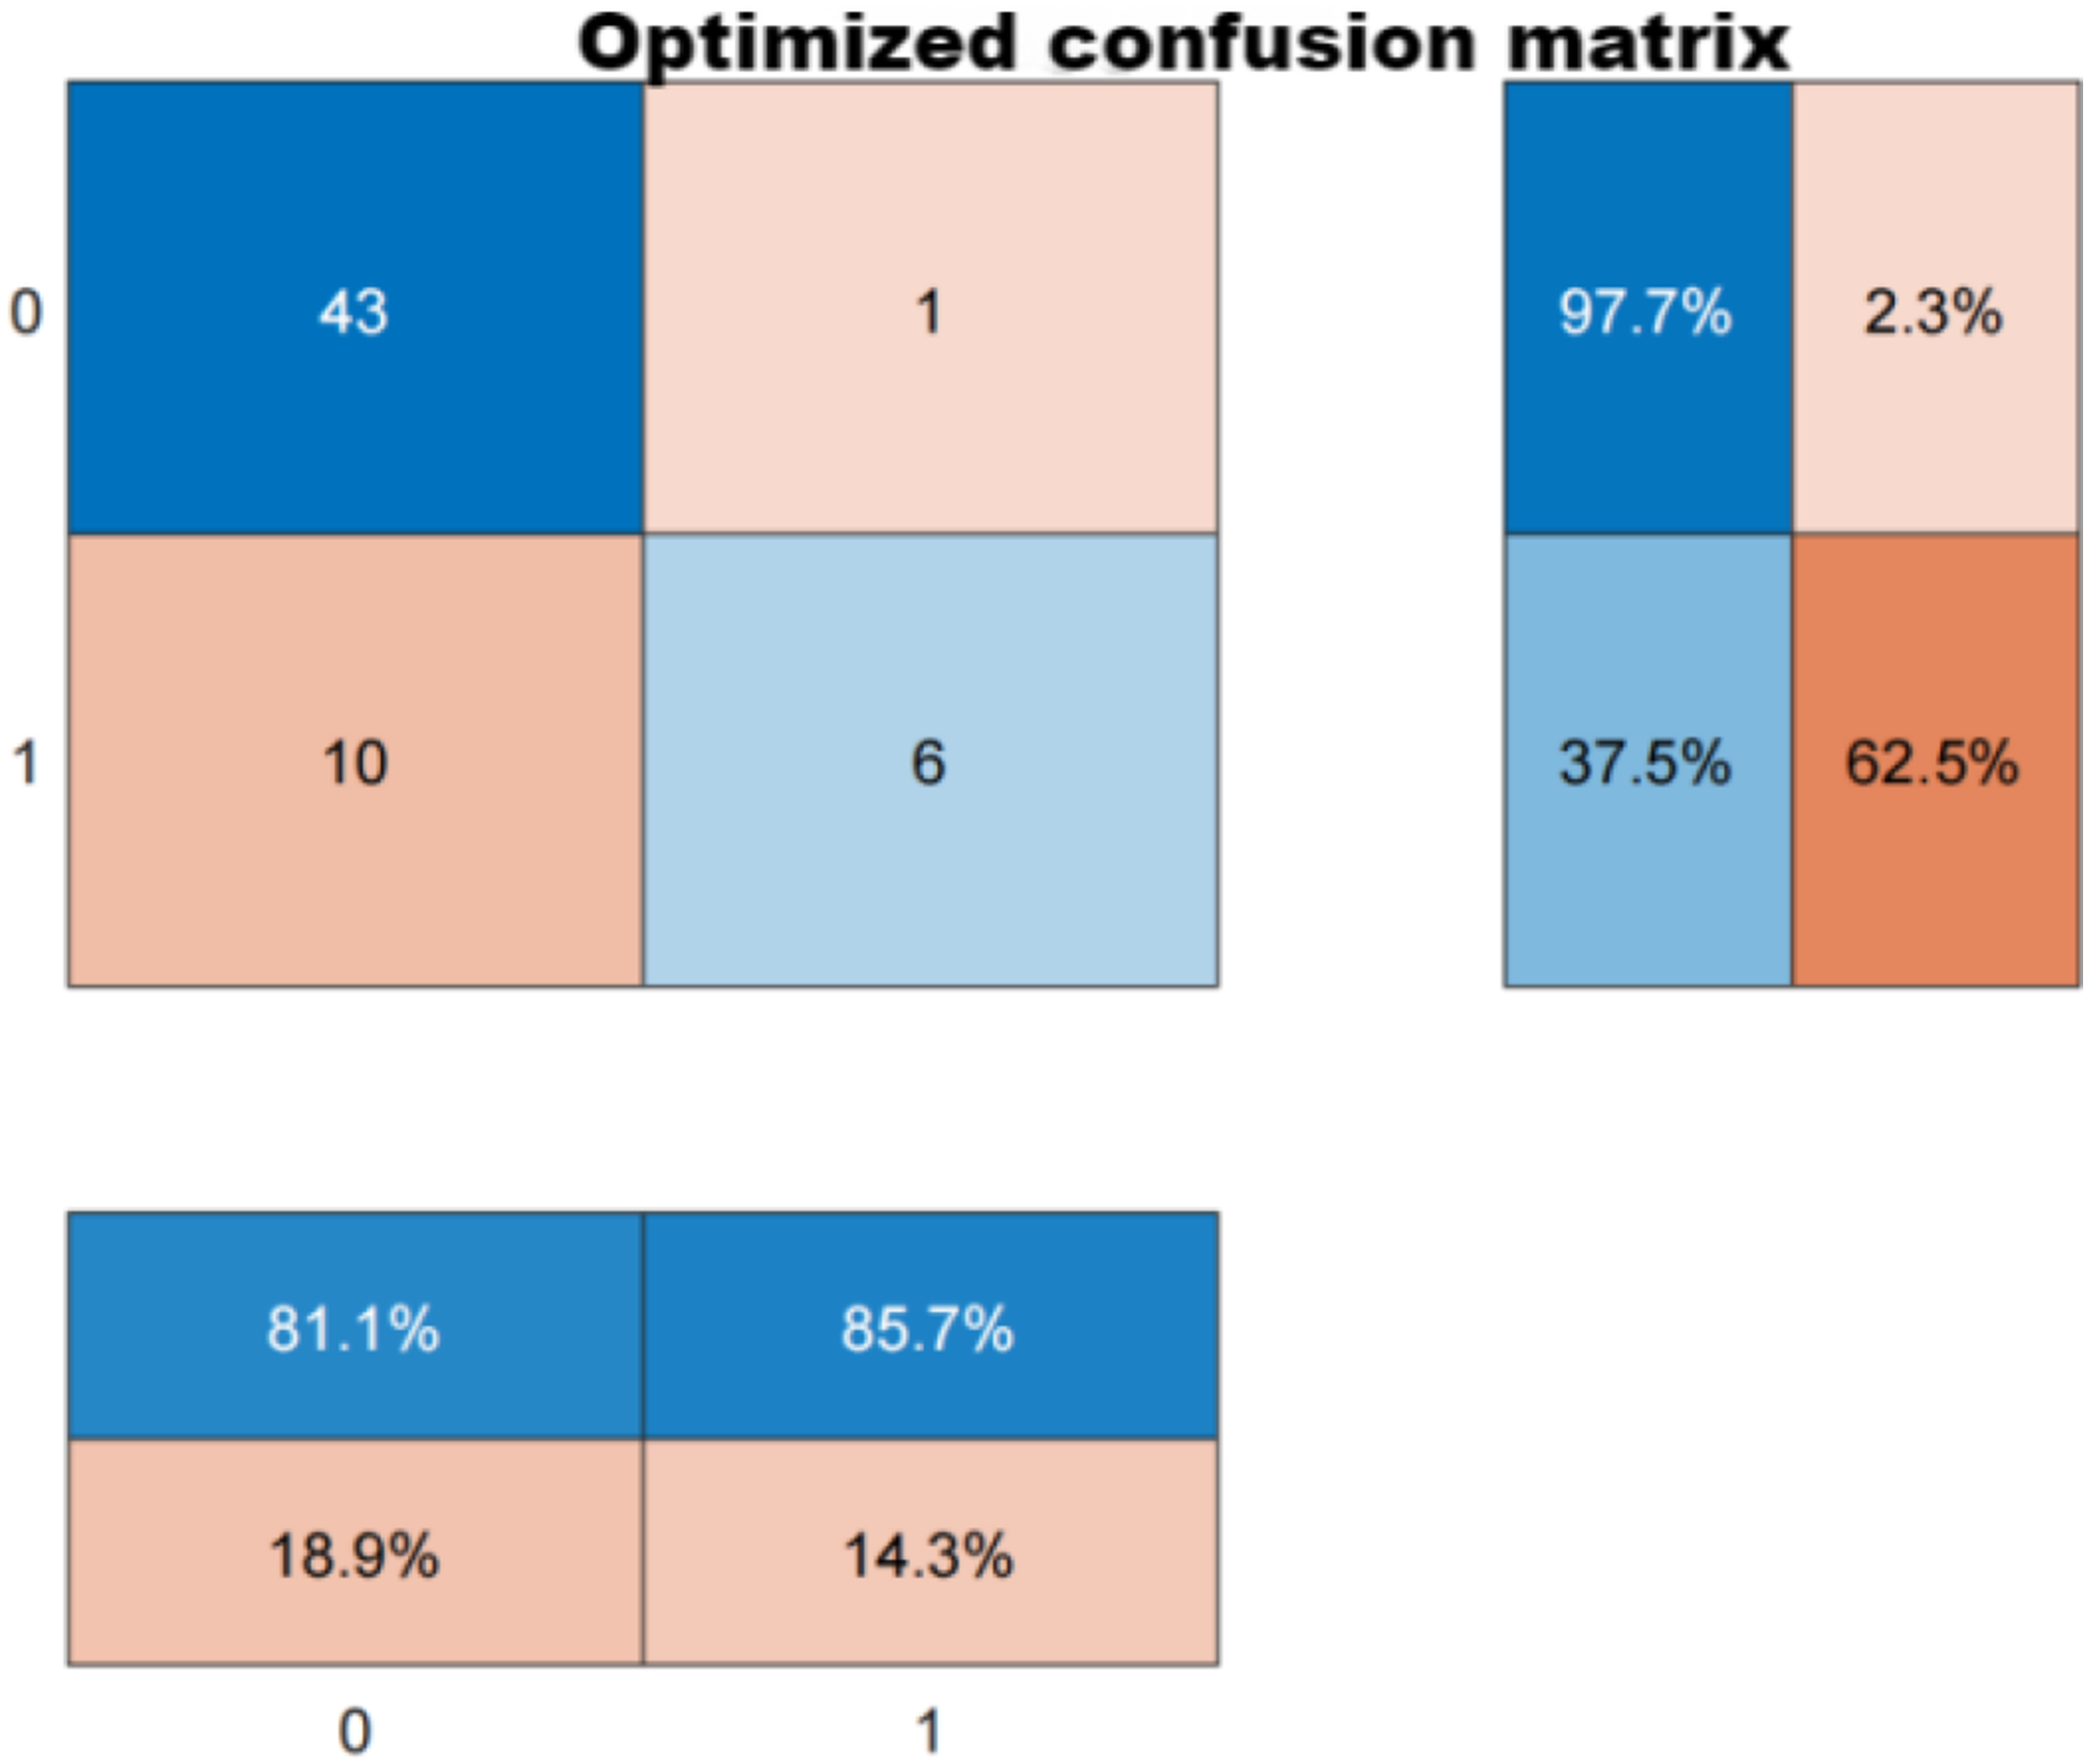
Matlab confusion matrix diagram.
According to the model prediction, AUC = 0.8125 was obtained, indicating that the model can correctly distinguish between defaulting and non-defaulting enterprises with a probability of 81.25%, verifying the significant advantage of nonlinear models in credit risk assessment, as shown in the ROC curve in Figure 6. By observing the curve shape, it can be seen that when the false positive rate (FPR) is below 0.4, the true rate (TPR) is close to 0.9, indicating that the model can still capture nearly 90% of the true defaulting enterprises under the premise of extremely low misjudgment of non-defaulting enterprises (controlling risk exposure), and has high practicality. By selecting a threshold near FPR = 0.2 (TPR ≈0.75), risk control and default identification needs can be further balanced (represented by the dashed line in Figure 6): this indicates that only 20% of normal enterprise misjudgments need to be tolerated to identify 75% of potential defaulting enterprises, which is suitable for high-risk customer screening scenarios. ROC curve.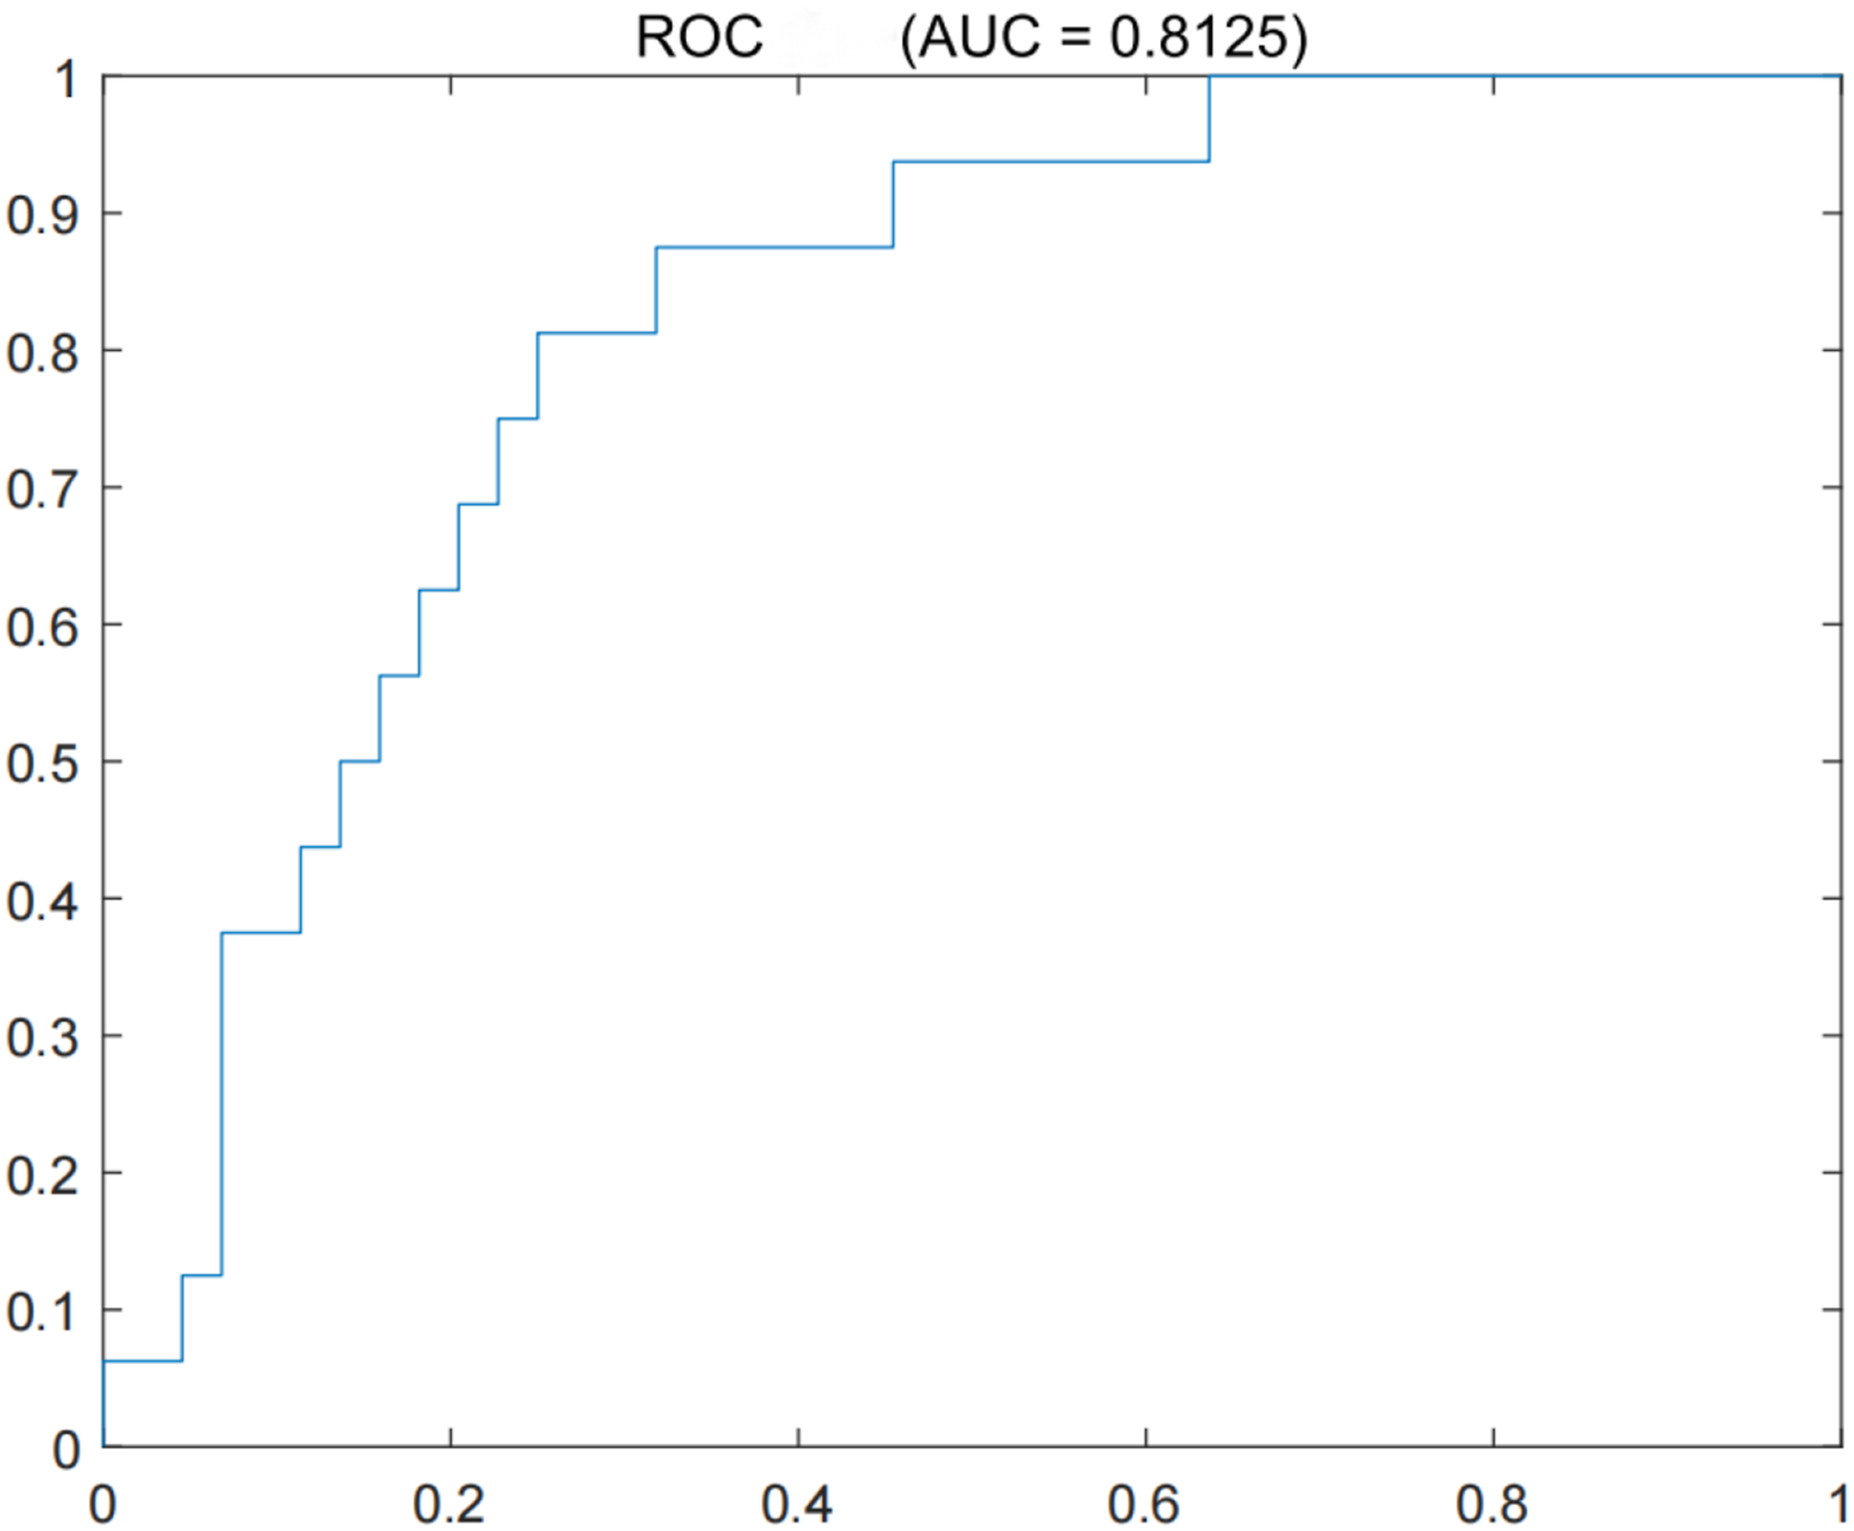
Overall, the BP neural network achieved a prediction performance of AUC = 0.8125 through a dual hidden layer structure, achieving a comprehensive prediction accuracy of 81.1%, and performing excellently in predicting non-defaulting enterprises. However, the weak ability to identify defaulting companies may be due to an imbalance in sample size between the two types (non-ST: ST ≈ 4:1) or insufficient capture of risk characteristics in the hidden layer structure.
Comparison of model results
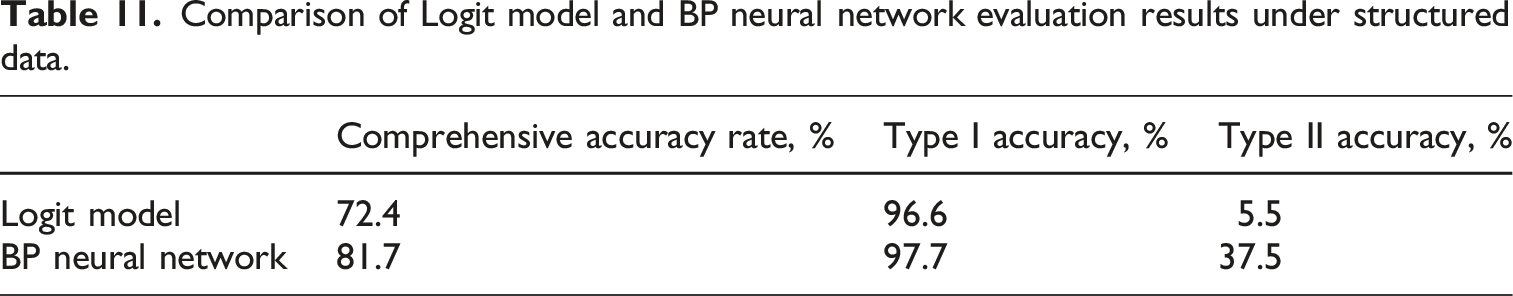
Comparison of Logit model and BP neural network evaluation results under structured data.
Comparison of Logit model and BP neural network evaluation results under unstructured data.
Comparison of Logit model and BP neural network performance.
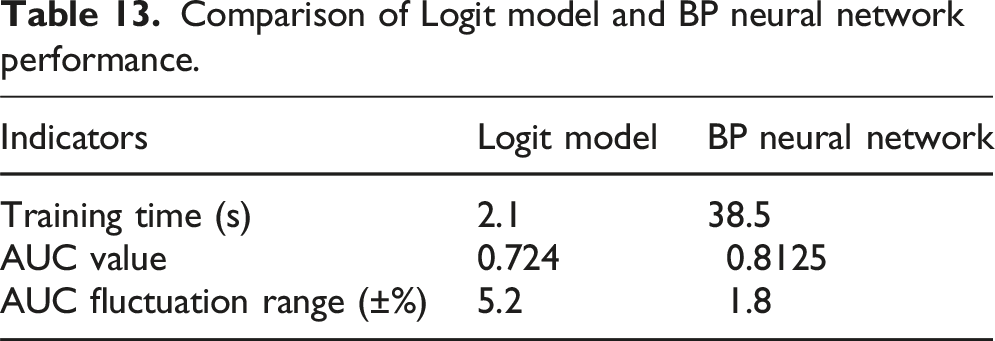
Although BP neural networks perform better, both models have poor control levels for type II errors. The main reasons include: BP neural network is prone to overfitting in small and medium-sized data, with slightly limited sample size, and there is an imbalance in the sample size between default and non-default enterprises, which may result in uneven learning performance of the model; the limited sample contains mixed financial data noise (such as extreme values), and the BP network overly relies on training set specific features, which may weaken its generalization ability; in practice, methods can be attempted to improve the BP neural network algorithm, such as using SMOTE oversampling or generative adversarial networks (GANs) to expand ST samples, alleviate class imbalance, or combining SHAP values or LIME methods to identify key risk factors and improve model transparency, etc.
Conclusion
This article takes the new energy vehicle industry as the research object, and compares and analyzes the performance differences between Logit model and BP neural network in credit risk assessment by constructing a comprehensive credit risk indicator system that integrates financial data, annual report text tone, and ESG rating. Research has found that the synergistic effect between financial factors extracted through principal component analysis and non-financial indicators significantly enhances the dynamism and foresight of credit risk identification, compensating for the lag of traditional financial indicators. The selected machine learning representative model, BP neural network, with its dual hidden layer structure and adaptive learning mechanism, performs outstandingly in capturing the nonlinear risk characteristics of “high-growth, high-volatility, and high-policy dependence” in the new energy vehicle industry. Its comprehensive prediction accuracy (81.7%) and AUC value (0.8125) are significantly better than the Logit model (72.4%), especially in the identification rate of defaulting enterprises (37.5% vs 5.5%), which has obvious advantages. In addition, the default recognition rate of BP neural network for policy sensitive enterprises is significantly higher than that for technology driven enterprises. Taking the implementation of the EU Carbon Tariff (CBAM) in 2022 as an example, some sample companies that rely on exports face a sudden increase in supply chain costs due to their carbon footprint not meeting standards. The BP neural network captures risk signals in advance through a nonlinear mapping between the “Environmental Resilience” dimension (ESG-E score) and cash flow fluctuations; However, the Logit model has a high misjudgment rate due to its insufficient linear separation ability. This indicates that the performance advantage of BP neural networks is closely related to the industry-specific policy cost threshold effect. This study focuses on the comparison between Logit and BP models, and in the future, models such as XGBoost and Random Forest can be included to verify the relative advantages of BP networks in industry-specific scenarios.
Financial institutions can adopt a hybrid evaluation system of “Logit model initial screening + BP neural network precision judgment,” which balances the robustness of linear models with the prediction accuracy of nonlinear models. The Logit model can be used for preliminary screening and risk stratification, while the BP neural network is used for in-depth analysis of high-risk enterprises to optimize risk exposure control. To address the issues of insufficient sample size and class imbalance, SMOTE oversampling or generative adversarial networks can be used to expand default samples and alleviate the overfitting tendency of the model towards non-defaulting enterprises. Regulatory authorities should promote the standardization of ESG information disclosure, requiring companies to disclose non-financial data such as carbon footprint and supply chain ethical disputes, and guiding capital flow to technologically robust and environmentally friendly enterprises. In response to the risk of technological iteration, a “New Energy Vehicle Technology Special Fund” can be established to provide research and development subsidies and tax incentives for cutting-edge fields such as solid-state batteries and sodium-ion batteries. At the same time, an overcapacity warning mechanism can be established to avoid redundant construction of low-end production capacity.
Based on the core findings and methodological boundaries of this study, future work can continue to deepen. For example, dynamic data can be integrated with real-time risk assessment to address the problem of model drift caused by accelerated technological iterations. Or try to construct a cross regional comparable evaluation system to support the benchmarking of NEV enterprise credit risk between the Chinese market and the European and American markets. Use transfer learning to adapt the model trained under Chinese policy scenarios to other international markets and identify the impact of geopolitical differences on technology path selection.
Footnotes
Funding
The author disclosed receipt of the following financial support for the research, authorship, and/or publication of this article: This project was supported by “Outbound ‘Smart’ Guide--Intelligent Guide Service System for Outbound Tourism Decision Making” won the Bronze Prize in the “Venture Alumni Cup” 19th Songjiang University Park Venture Competition and China International Student Innovation Competition (2024) of Shanghai University of International Business and Economics (SUIBE).
Declaration of conflicting interests
The author declared no potential conflicts of interest with respect to the research, authorship, and/or publication of this article.