




Abstract
This article studied an optimization method for enterprise financial health assessment (FHA) model based on genetic algorithm (GA). In response to the problems of strong subjectivity, insufficient dynamism, and limited data processing capabilities in traditional evaluation models, this article optimized the weights of financial indicators through GAs to improve the scientific and accurate evaluation results. It used 11 financial indicators as the main data to collect financial data from multiple enterprises and form a dataset. GA can be used to optimize the weights of financial indicators. This article constructed a FHA model, evaluated the constructed model, conducted corresponding analysis based on experimental results, and drew conclusions. The results showed that the model optimized by GA had significant improvements in evaluation accuracy and adaptability. The maximum mean squared error (MSE) of the GA in all comparative experiments was 19.962, which was lower than the minimum MSE of 20.043 obtained by other comparative methods. The maximum Mean Absolute Error (MAE) of the GA in all comparisons was 4.988, which was lower than the minimum MAE of 5.031 obtained by other comparison methods. This indicates that the enterprise financial health evaluation model based on GA has sufficient accuracy, is more objective in determining the weights of financial indicators, and has higher scientific validity in the evaluation results. The optimized enterprise FHA model provides more effective services for enterprise financial management. By optimizing the enterprise FHA model based on GA, it provides scientific basis for enterprise decision-making, improves enterprise management level, and provides new ideas and methods for the application of GA in enterprise finance. Future research can further explore the combined application of GAs and other intelligent algorithms, explore more efficient optimization methods, and promote the development of FHA research for enterprises.
Keywords
Introduction
In the modern economic environment, the financial health of a company is a key factor in evaluating its sustainability and market competitiveness. Accurately assessing the financial health of a company is helpful for its own management and decision-making, and also provides important references for investors, creditors, and other stakeholders. The traditional FHA methods 1 mainly rely on the experience judgment of financial experts and some basic financial ratio analysis. Although traditional FHA is intuitive, it has many shortcomings and is difficult to comprehensively reflect the true financial health status of enterprises. In recent years, with the rapid development of big data and artificial intelligence technology, more and more research has begun to attempt to use intelligent algorithms to optimize enterprise FHA models. GA, 2 as an optimization algorithm based on natural selection and genetic mechanisms, has the advantages of strong global search ability, wide adaptability, and significant effectiveness in solving complex problems. It has demonstrated strong potential in optimization solutions. Genetic algorithm (GA) is a global optimization algorithm that simulates natural selection and genetic mechanisms. It solves the problem into “chromosomes,” evaluates individuals using fitness functions, and then simulates biological evolution through operations such as selection, crossover, and mutation to search for the optimal solution. Genetic algorithms are widely used in many fields for their ability to handle complex nonlinear problems. Therefore, studying how to use genetic algorithms to optimize enterprise FHA models 3 has important theoretical significance and can provide more scientific basis for enterprise decision-making in practice. In existing research, many methods still have some problems in optimizing enterprise FHA models. Traditional methods such as expert rating and Analytic Hierarchy Process (AHP) mainly rely on the experience and judgment of experts, which have subjectivity and consistency issues, making it difficult to objectively and accurately evaluate the financial health of enterprises. Although methods such as entropy method and multivariate statistical analysis have improved the objectivity and scientificity of evaluation to a certain extent, the calculation process is complex, especially when facing large-scale and multidimensional financial data, the calculation efficiency is low, and it is difficult to meet the needs of practical applications. Many existing methods fail to fully consider the correlation between financial indicators when determining their weights, resulting in biased evaluation results. Multivariate statistical analysis and some machine learning models (such as random forests, support vector machines, etc.) often rely on linear relationships when processing financial data, making it difficult to deal with complex nonlinear problems. However, methods based on grey relational analysis, although suitable for small sample and uncertain data, perform poorly in large sample situations. In market analysis, genetic algorithms can be used to optimize investment portfolios and determine the best asset allocation plan. By simulating the process of natural selection and genetic variation, GA can effectively search in the vast investment portfolio space to find the best combination of maximizing returns and minimizing risks. In risk management, genetic algorithms can be used to optimize risk hedging strategies and credit risk assessment. Traditional methods often have difficulty in dealing with complex nonlinear relationships between multidimensional data, while GA can gradually approach the optimal solution through the evolutionary process, which is particularly suitable for dealing with highly complex financial risk management problems.
In response to these issues, this article studies an optimization method for enterprise FHA model based on genetic algorithm. 4 Genetic algorithm, as a global optimization algorithm, has been widely used in solving various optimization problems due to its unique evolutionary mechanism and powerful global search ability. Genetic algorithms are like simulating the process of natural selection in the process of finding the best solution. It can start with a set of different solutions, like the various organisms in nature. Each solution is evaluated for its quality, and then the best ones are selected to combine features and make random adjustments to produce a new generation of solutions. This process is repeated over and over again until the optimal solution is found. In short, genetic algorithms gradually optimize the solution to a problem by simulating the way nature evolves. Many studies have attempted to apply genetic algorithms 5 to optimize the FHA models of enterprises, and have achieved significant results. Some people have studied using genetic algorithms to optimize the weight allocation of financial indicators, significantly improving the accuracy and stability of evaluation models. In addition, some people have studied combining genetic algorithms with other intelligent algorithms, such as combining genetic algorithms with neural networks, fuzzy logic, etc., to further improve the evaluation performance of the model. 6 Although the application of genetic algorithms in enterprise FHA has made some progress, there are still some problems and challenges. For example, the parameter selection and fitness function design of genetic algorithms have a significant impact on the optimization performance of models, but existing research has not explored these aspects in depth. 7 Genetic algorithms still need to further improve their computational efficiency when dealing with large-scale data and high-dimensional problems. This article aims to optimize the FHA model of enterprises based on genetic algorithm. By improving the parameter selection and fitness function design of genetic algorithm, the accuracy, stability, and computational efficiency of the assessment model can be enhanced. Genetic algorithms are user-friendly in practical applications. The easy-to-understand and easy-to-implement features of genetic algorithms enable users to master basic operations through simple learning, and their wide applicability allows them to be directly applied to a variety of optimization problems. Flexible parameter settings and rich tool support reduce the difficulty of use, and even non-professional users can easily operate and tune the algorithm through a graphical interface. The research objectives and methods of this article are as follows: key parameters of genetic algorithm, such as population size, crossover rate, mutation rate, etc., can be optimized through experiments and comparisons to improve the search efficiency and convergence speed of the algorithm. Based on the actual needs of enterprise FHA, a scientifically reasonable fitness function can be designed to ensure that genetic algorithms can accurately reflect the financial health status of enterprises during the optimization process. Based on the global search capability of genetic algorithm, this article comprehensively analyzes various financial indicators of enterprises, determines the optimal weights of each indicator, and constructs an efficient enterprise financial health evaluation model. This article selects financial data from several typical enterprises for empirical analysis and model validation, compares the advantages and disadvantages of the genetic algorithm-based evaluation model with traditional methods, and verifies the effectiveness and applicability of the model. When faced with higher-dimensional data sets or complex optimization problems, genetic algorithms can effectively adapt to the complexity of the problem by adjusting parameters such as population size, crossover and mutation strategies. The parallel processing capabilities of genetic algorithms allow large amounts of data to be processed quickly in a distributed computing environment, improving computing efficiency and ensuring its strong scalability in large-scale, complex data environments. Through the above research, this article aims to provide an efficient and scientific optimization method for enterprise FHA, improve the accuracy and adaptability of evaluation models, provide more scientific basis for enterprise decision-making, and also provide theoretical support and practical experience for the application of genetic algorithms in enterprise management. Future research may focus on improving the accuracy and generalization ability of the corporate financial health assessment model based on genetic algorithms. The model performance and universality will be enhanced by combining other algorithms, optimizing data processing and feature selection, introducing dynamic update technology, and expanding to multidimensional evaluation.
Related work
Corporate FHA is an important research topic in the fields of enterprise management and finance, and scholars have conducted extensive research in this area and achieved significant results. Traditional FHA methods mainly include financial ratio analysis, AHP, and multivariate statistical analysis. Traditional FHA methods reveal the characteristics of a company’s financial situation to a certain extent, 8 but also have certain limitations. In recent years, with the development of artificial intelligence and data mining technology, people have begun to apply intelligent algorithms 9 to the FHA of enterprises. Researchers attempt to improve the accuracy and objectivity of evaluations by optimizing algorithms and models. The financial ratio analysis method is one of the earliest methods used for evaluating the financial health of enterprises, which evaluates the financial condition of enterprises by calculating their financial ratio indicators. 10 Although this method is simple and easy to implement, it mainly relies on historical data and does not fully consider the financial risks and development potential of the enterprise in the future. The AHP decomposes complex decision-making problems into several levels and elements by constructing an indicator system and hierarchical structure, and conducts comprehensive evaluation through expert scoring and weight allocation. This method has advantages in considering multidimensional factors, but the results are highly dependent on the subjective judgment of experts and have certain biases. Multivariate statistical analysis methods, such as factor analysis and principal component analysis, extract the main influencing factors by performing dimensionality reduction and comprehensive analysis on a large amount of financial data, and evaluate the financial health status 11 of enterprises. This method is capable of handling large-scale data and has strong objectivity, but its effectiveness is limited when dealing with nonlinear relationships and complex problems.
With the improvement of computing power and the increase of data volume, the application of intelligent algorithms in enterprise FHA is becoming increasingly widespread. Genetic algorithm (GA), as a global optimization algorithm based on natural selection and genetic mechanisms, has received widespread attention for its outstanding performance in solving complex optimization problems. Walmart uses genetic algorithms to optimize its global supply chain network, including inventory management and logistics distribution. Genetic algorithms help the company determine the best supplier selection and distribution routes to reduce transportation costs and increase supply chain responsiveness, thereby improving overall supply chain efficiency. In early research, genetic algorithms were mainly used to optimize the weight allocation of financial indicators in enterprises. Some people have used genetic algorithms to optimize the weights of financial indicators in their research, significantly improving the accuracy of corporate FHA. 12 The combination of genetic algorithm with other intelligent algorithms, such as neural networks, fuzzy logic, etc., has also shown good application prospects in enterprise FHA. Some researchers have combined genetic algorithms with neural networks for financial crisis warning in enterprises, 13 achieving good predictive results. In China, research on the application of intelligent algorithms in enterprise FHA has also made certain progress. Scholars have proposed a FHA model for enterprises based on fuzzy logic and genetic algorithm. 14 By using fuzzy logic to handle the fuzziness and uncertainty of enterprise financial data, combined with the global optimization ability of genetic algorithm, the accuracy and robustness of the assessment model have been improved. Some scholars have also studied intelligent stock investment strategies based on support vector machine (SVM), 15 using grid search methods, genetic algorithms, and particle swarm optimization algorithms to optimize parameters and improve prediction accuracy.
Although significant progress has been made in the application of genetic algorithms in enterprise FHA, there are still some challenges and issues. The parameter selection of genetic algorithms has a significant impact on optimization performance, but existing research in this area is not yet sufficiently explored. The key parameters of genetic algorithm, such as population size, crossover rate, mutation rate, etc., have a significant impact on the convergence speed and search efficiency of the algorithm. How to choose these parameters reasonably is still an urgent problem to be solved. The design of fitness function is the core of genetic algorithm optimization. Existing research often uses simple linear fitness functions, which are difficult to fully reflect the complexity of a company’s financial health status. Therefore, designing a scientifically reasonable fitness function to accurately evaluate the financial health of enterprises is of great significance. Genetic algorithms still have insufficient computational efficiency when dealing with large-scale data and high-dimensional problems. Although parallel computing has improved efficiency, there are still bottlenecks in complex data processing. Combining artificial intelligence and big data technology, combining genetic algorithms with deep learning, is beneficial for optimizing the performance of evaluation models. The deep neural network enterprise FHA model optimized based on genetic algorithm has significantly improved accuracy and adaptability. Blockchain technology improves data credibility and transparency through decentralization and data immutability. Genetic algorithms have a wide range of applicability. In the financial industry, genetic algorithms are used to optimize credit risk assessment models to predict borrowers’ default probability. By encoding and optimizing historical credit data, genetic algorithms can improve the accuracy of risk assessment and help financial institutions make more reasonable loan decisions and risk management strategies.
In summary, traditional methods have advantages in simplicity and operability, but they have certain limitations when dealing with complex problems and nonlinear relationships. The introduction of intelligent algorithms, especially genetic algorithms, provides new ideas and methods for evaluating the financial health of enterprises, significantly improving the accuracy and objectivity of evaluation models.
Experimental design
Data processing
Data collection
Financial data is divided into internal data, external data, and public data. The financial data collection standards are internal data: including financial statements, budgets and financial plans, operational data, etc., which must be regularly updated, accurate, and complete. External data: covering market data, supplier and customer information, macroeconomic indicators, etc., requiring reliable sources and timely data. Public data involves laws and regulations, socio-economic data, government and industry reports, etc., which must ensure the authority of the data and its relevance to corporate activities. Internal data 16 mainly collects financial statements (such as balance sheets, income statements, and cash flow statements), accounting records, budgets, and internal audit reports of enterprises. External sources 17 mainly collect industry reports, market analysis reports, economic data released by the government, financial information of competitors, third-party financial databases, etc. Public data 18 mainly collects financial reports disclosed by listed companies, stock exchange data, industry association data, etc. In terms of specific data, the article mainly collected financial indicators such as revenue, net profit, assets, liabilities, shareholder equity, and cash flow; financial ratios such as current ratio, quick ratio, asset liability ratio, net profit margin, and return on equity; non-financial information such as management comments, market environment, industry trends, macroeconomic indicators, etc. The article selected financial indicators that are closely related to financial health from the financial data, including current ratio, debt ratio, etc. These financial indicators are widely used in financial analysis and have theoretical support.
The websites used to collect data in Figure 1 are all official government websites with high credibility and professionalism. The websites contain various financial data of many large companies, which is convenient for use in this study. Financial data collection. (a) Internal financial data collection. (b) Financial external data collection. (c) Collection of financial public data.
Data preprocessing
The collected data can be preprocessed
19
to ensure its validity and integrity. Data can be collected from official websites and integrated into a unified database from different sources. It can ensure that data from different data sources have consistent formats and units. Performing data cleaning can convert data into the same scale range, convert categorical variables into numerical form, select features that have a significant impact on model prediction, and eliminate redundant or irrelevant features. Interpolation can be used to fill in missing values to make the data complete, and standard deviation can be used to handle outliers to ensure the validity of the data. After completing the filling and deletion, Z-score can be used to standardize the data, as shown in formula (1). The preprocessed data can be divided into a training set and a validation set, with a ratio of 8:2.

Among them,
Genetic algorithm
Encoding and initialization population design
The current ratio measures a company’s ability to repay short-term debts. A higher current ratio indicates that a company has a stronger ability to repay short-term debts. The debt ratio measures the proportion of liabilities to a company’s total assets, reflecting the company’s financial leverage level. The debt-to-asset ratio represents the ratio of a company’s liabilities to shareholders’ equity, reflecting the company’s financial risk. The cash flow coverage ratio represents a company’s ability to repay short-term debts using operating cash flow. The FHA model has 11 financial indicators, which are encoded using real number encoding to represent the weight of each financial indicator based on the situation. Each weight is randomly initialized within the range of [0, 1], as shown in formula (2). Randomly generate N individuals as the initial population. Each individual can be represented as an 11 dimensional vector with 11 different genes.

Among them,
Fitness function design
Based on the enterprise FHA model, the fitness function
20
is designed. The fitness function is the key to evaluating the quality of individuals in genetic algorithms. It reflects the effectiveness of solving problems by mapping the genotype of individuals to fitness values. When designing a fitness function, it is necessary to ensure that it can accurately map the objective function, maintain monotonicity to distinguish between good and bad solutions, consider multi-objective optimization and handle constraints, avoid over-optimization of local optimal solutions, and maintain simplicity and efficiency of calculations. This article takes

Prediction error is used to measure the difference between the predicted score and the actual score of a model. The commonly used error measurement methods include mean square error and root mean squared error (RMSE).
The formula for mean square error is formula (4):

Among them,
The formula for root mean square error is formula (5):

The fitness value is used to measure an individual’s strengths and weaknesses. In order to make the smaller the error, the larger the fitness value, the reciprocal of the error can be used as the fitness value. The fitness value is given by formula (6):

In formula (6),
Operation design
In genetic algorithms, selection operation, crossover operation, mutation operation, and replacement operation are key steps used to generate a new generation population and gradually optimize it. The population size is 200, the crossover probability is 0.7, and the mutation probability is 0.05. 200 individuals can ensure the comprehensiveness of the search in terms of computing resources without consuming too many resources, making the algorithm running time and computing overhead relatively moderate. The crossover probability of 0.7 is high, which can effectively exchange information between individuals and generate new solutions. A high crossover probability helps to find better solutions and speed up convergence. The mutation probability of 0.05 is moderate, which can appropriately increase the diversity of the population and prevent the algorithm from falling into a local optimum. The right amount of mutation helps to explore new solutions and avoid premature convergence.
The selection operation is to select individuals from the current population as the parents of the next generation population, based on their fitness values. This article uses roulette wheel 21 for the selection operation. The selection of roulette wheel can be based on the relative fitness of individuals, with individuals with higher fitness having a higher probability of being selected and those with lower fitness having a lower probability of being selected.
Crossover operation 22 is used to generate a new generation of individuals by exchanging some genes between the chromosomes (weight vectors in real coding) of two parent individuals. In this article, multi-point crossover is used for crossover selection, specifically selecting multiple crossover points and exchanging multiple gene fragments of two parent individuals.
Mutation operation 23 increases population diversity by randomly changing gene values in individuals’ chromosomes, which helps to escape from local optima. In this article, uniform mutation is used for operation. The operation process involves randomly selecting certain genes of an individual and changing their values with a certain probability.
The replacement operation 24 is to replace a portion of individuals in the current population with newly generated individuals to generate the next generation population. This article uses elite replacement for the operation. During the replacement process, the individual with the highest fitness in the current population is retained and directly passed on to the next generation, while the remaining individuals are filled with newly generated individuals.
The purpose of the selection operation is to select individuals with higher fitness in each generation to ensure that good genes can be passed on to the next generation. The crossover operation aims to generate new individuals by combining the genetic information of two parent individuals. The mutation operation is to maintain the diversity of the population and prevent the algorithm from falling into the local optimum. The selection operation ensures the continuation of good individuals, the crossover operation promotes information exchange and optimization, and the mutation operation maintains the diversity of the population.
The operation process of genetic algorithm is shown in Figure 2. Genetic algorithm flow chart.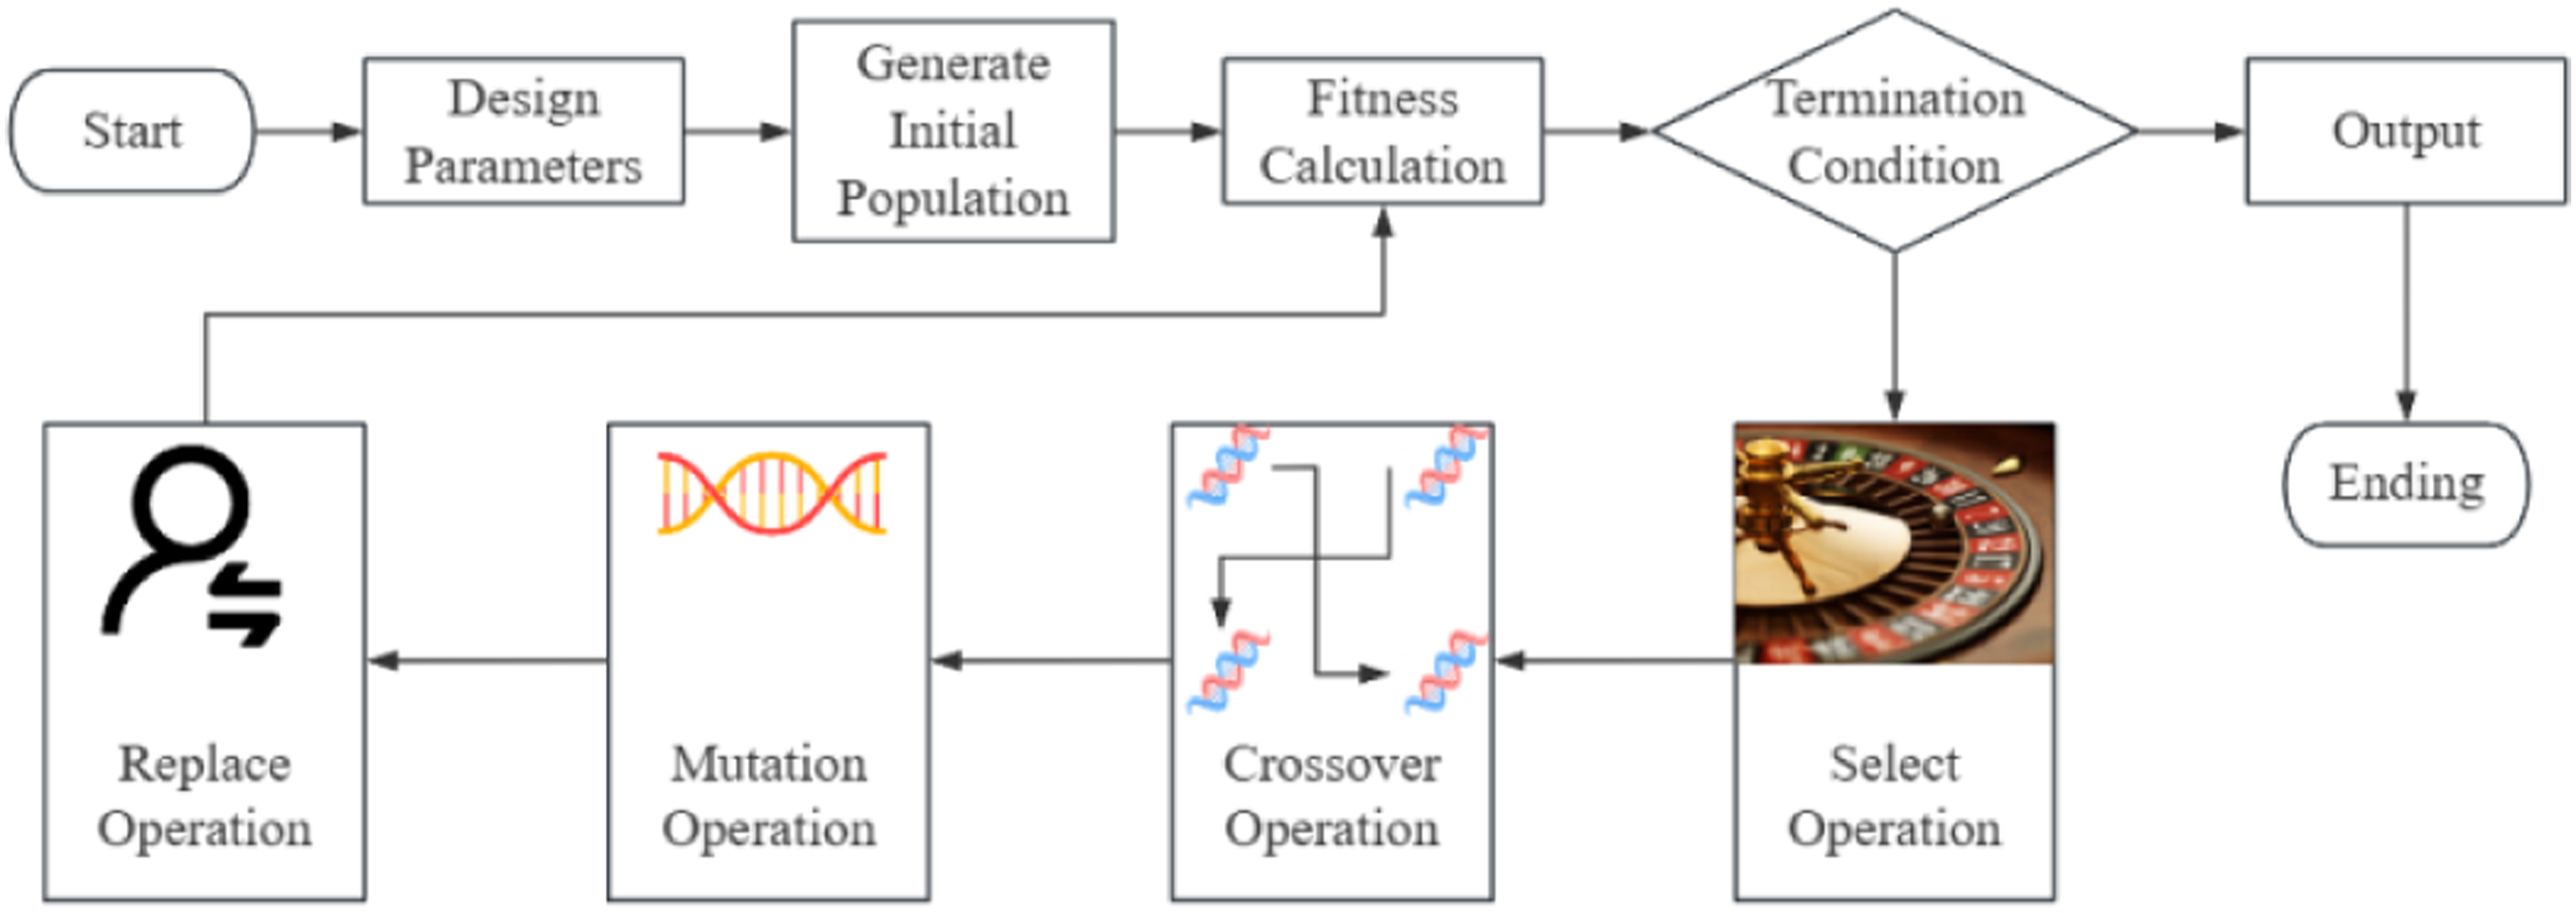
Experimental evaluation and analysis
Model evaluation
MSE and MAE results.
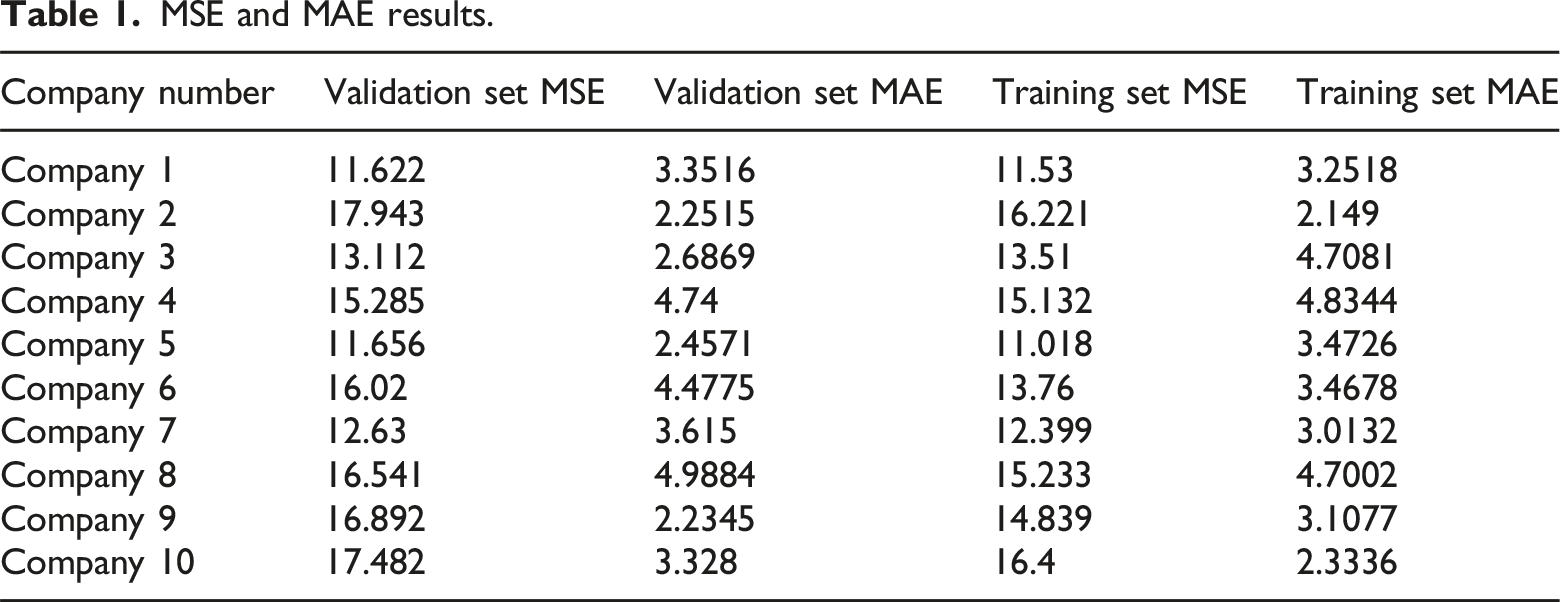
According to Table 1 analysis, it can be concluded that in the comparison of Company 1 to Company 10, the MSE and MAE values of the training set are roughly within the same range as those of the validation set, indicating that the model performs consistently on financial data from different companies. It is normal for the validation set MSE to be slightly higher than the training set MSE, indicating that the model performs slightly worse on the validation set data, but there is no significant overfitting issue.
R2 results.
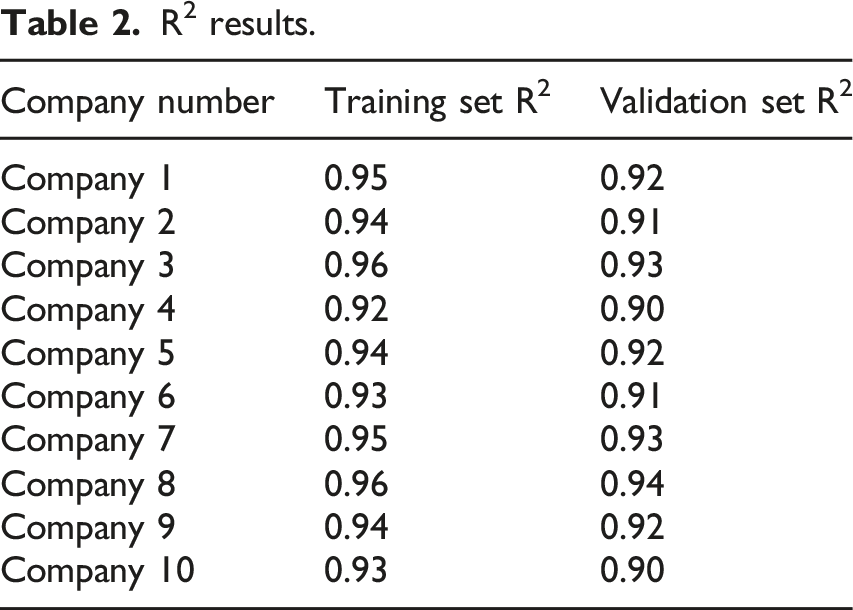
According to the data analysis in Table 2, the R2 values of the training sets from Company 1 to Company 10 are mostly between 0.92 and 0.96, indicating that the model has strong explanatory power on the training dataset. The R2 values of the validation sets from Company 1 to Company 10 are mostly between 0.90 and 0.94, indicating that the model also has strong explanatory power on the validation dataset. Through the evaluation of R2 value, it can be seen that the enterprise FHA model based on genetic algorithm has good predictive ability on most companies’ data. Although the R2 value of the validation set is slightly lower than that of the training set, this is still a normal phenomenon, indicating that the model has good generalization ability and no obvious overfitting problems have occurred.
Result analysis
By comparing the genetic algorithm in this article with traditional expert scoring method, AHP, entropy method, multivariate statistical analysis method, and grey relational analysis method in FHA models, the optimization effect and strengths and weaknesses of genetic algorithm on FHA models are analyzed. Experimental results show that genetic algorithm is superior to traditional expert scoring method, hierarchical analysis method, entropy method, multivariate statistical analysis method and grey correlation analysis method, and has the best corporate financial health assessment results.
Comparison between genetic algorithm and traditional expert rating method
The traditional expert rating method refers to the evaluation and scoring of financial conditions by experts in the field based on their experience and professional knowledge. 26 This article selects experts of ordinary level in the financial industry for scoring. Experts develop scoring criteria and indicators based on financial statements and other relevant information, score each indicator, and assign different weights to each indicator to reflect its importance. A comprehensive score can be calculated based on expert ratings and weights to assess the financial health of the company.
According to Figure 3 analysis, the MSE value range of genetic algorithm is 11.577–16.984, while the MSE value range of traditional expert scoring method is 20.082–29.616. The MAE value range of genetic algorithm is 2.1453–4.8128, while the MAE value range of traditional expert scoring method is 5.2157–8.2711. The average MSE of the genetic algorithm for 10 companies is 14.776, while the average MSE of the traditional expert scoring method is 25.238. The average MAE of genetic algorithm for 10 companies is 3.544, while the average MAE of traditional expert scoring method is 6.459, indicating that the performance of genetic algorithm is better than that of traditional expert scoring method. The MSE values of genetic algorithms in the same company are lower than those of traditional expert scoring methods. The MAE values of genetic algorithms in the same company are all lower than those of traditional expert scoring methods, further indicating that genetic algorithms are more effective in FHA. The traditional expert scoring method is subjective and relies on the experience of experts. The experts selected in this paper may have limited financial expertise and insufficient understanding of the analysis of corporate financial health, making the accuracy of the traditional expert scoring method lower than that of the genetic algorithm. Comparison between genetic algorithm and traditional expert rating method.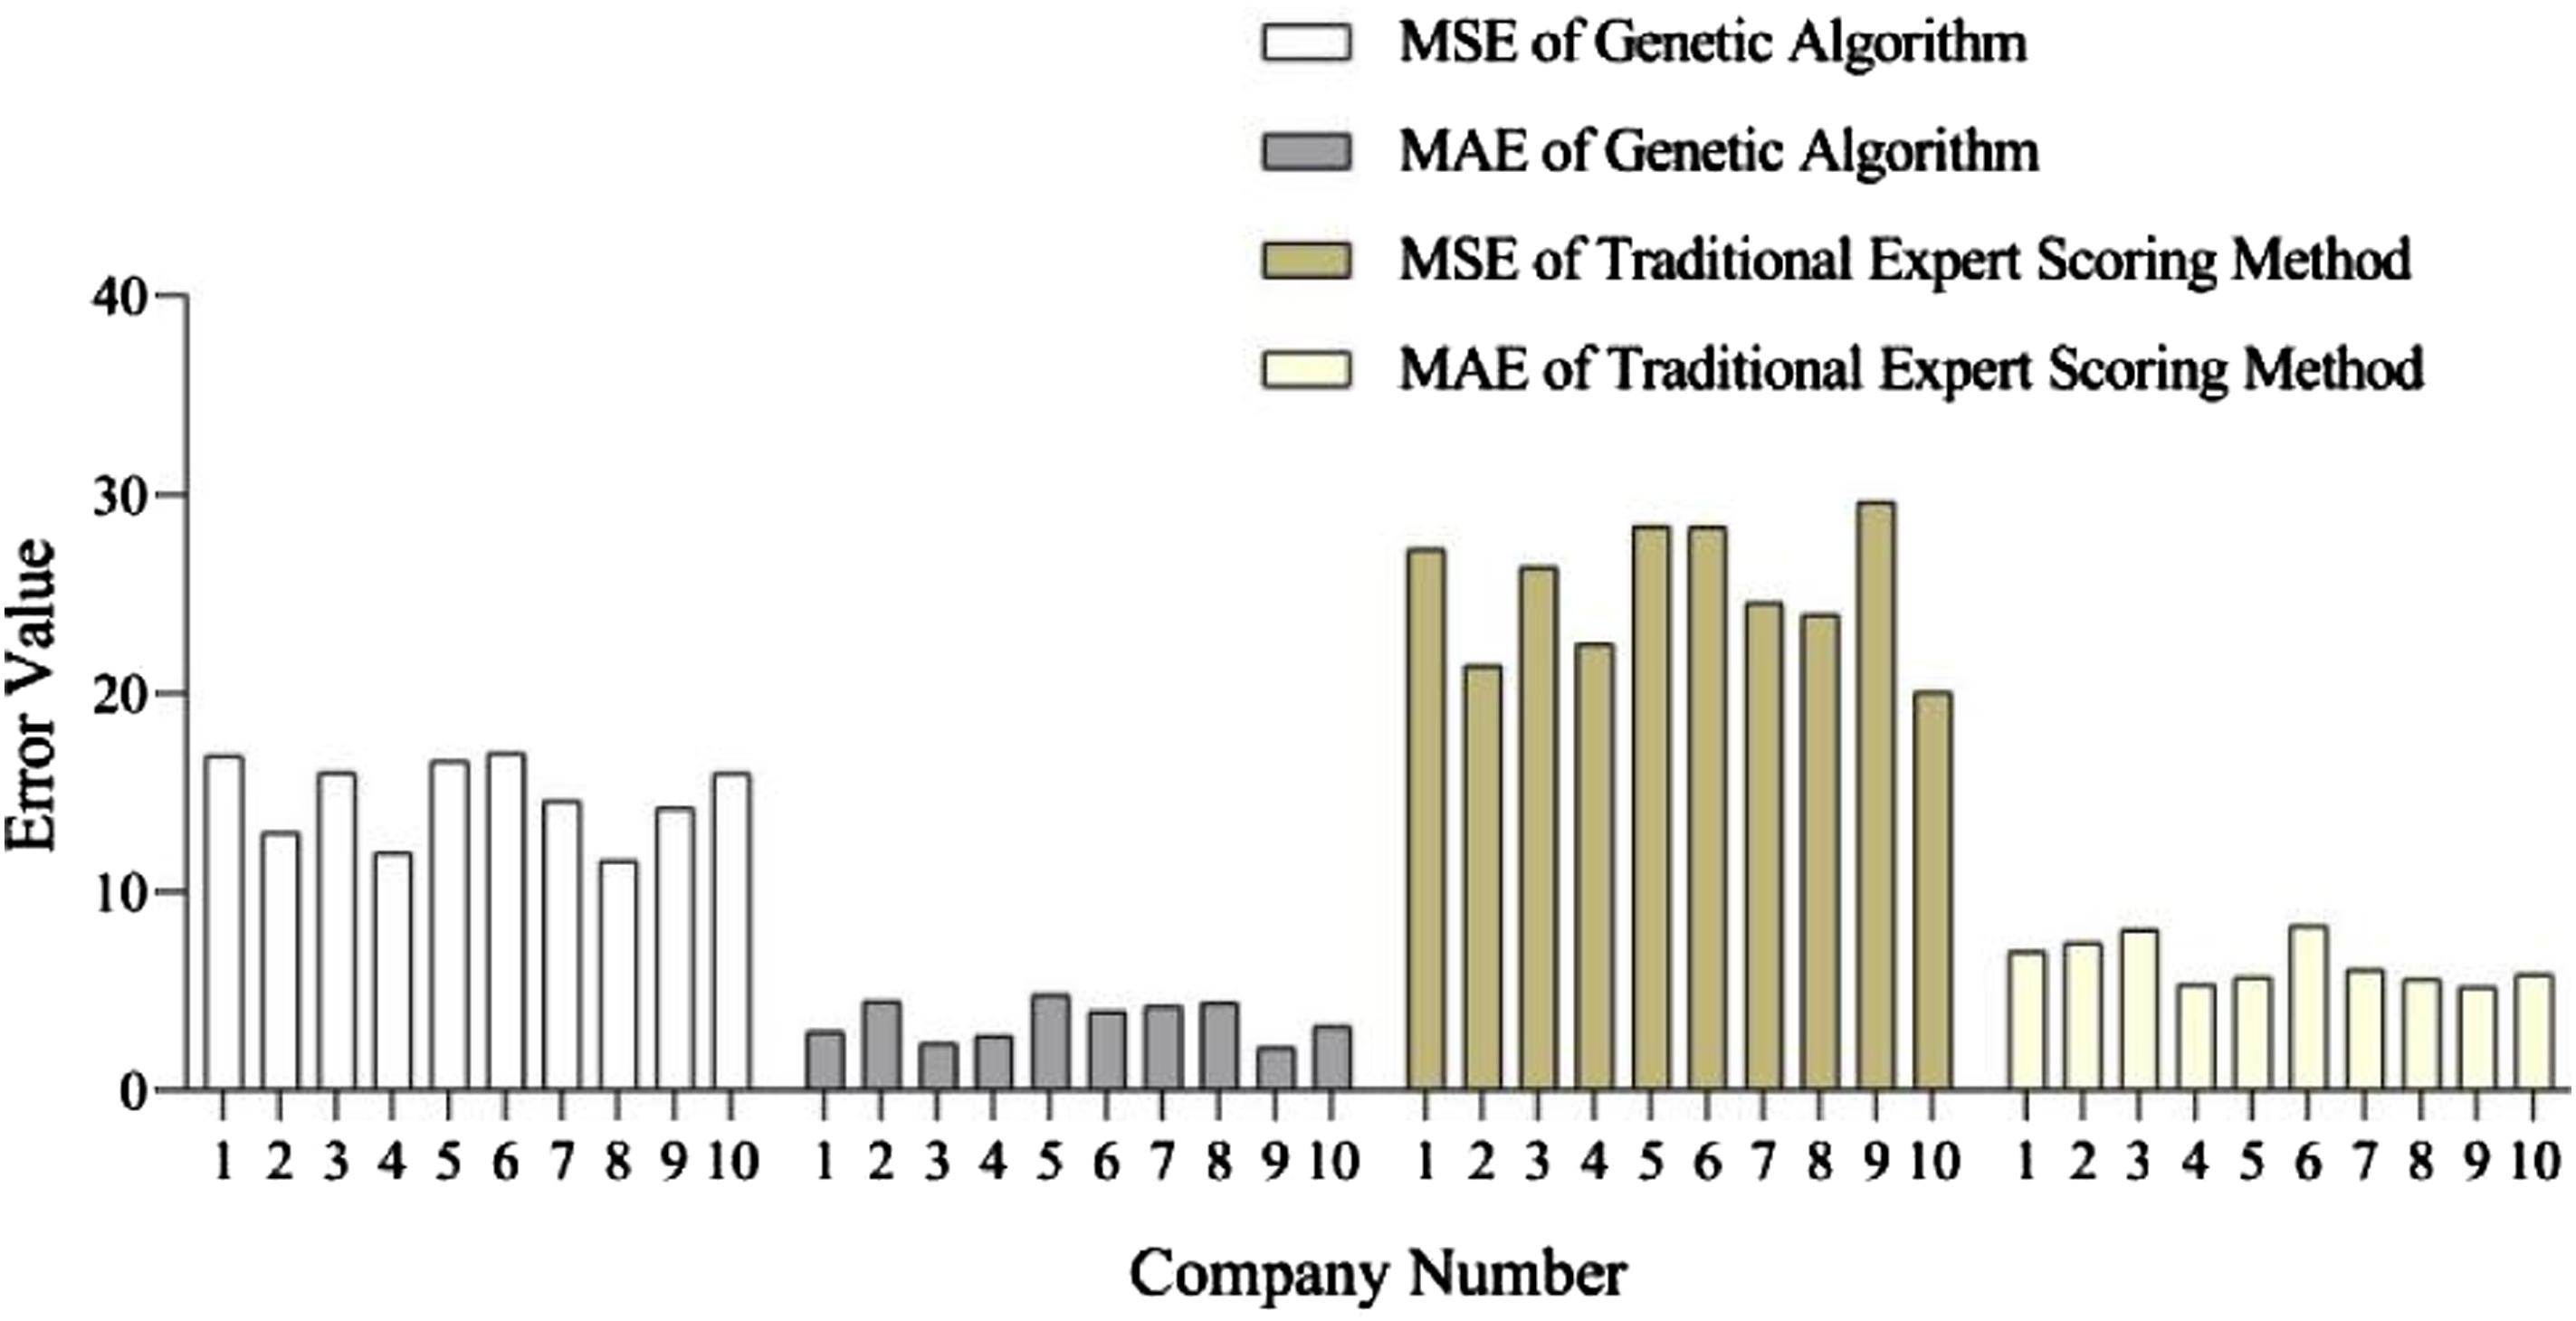
Comparison between genetic algorithm and AHP
Analytic Hierarchy Process (AHP) 27 is a multi-criteria decision analysis method used for decision-making and evaluation. The AHP decomposes complex problems into sub problems at different levels, establishes a judgment matrix based on the importance of the problem, and checks the consistency of the judgment matrix. If the consistency is passed, the calculation result is valid. If there is inconsistency, the judgment matrix needs to be readjusted.
According to Figure 4, the maximum MSE of the genetic algorithm is 18.058 and the minimum is 10.996. The maximum value of the AHP MSE is 29.883 and the minimum value is 22.725. The maximum value of the genetic algorithm MAE is 4.785 and the minimum value is 2.026. The maximum value of the AHP MAE is 9.766 and the minimum value is 5.671. The average MSE of the genetic algorithm for 10 companies is 15.589, and the average MSE of the AHP is 25.424. The average MAE of genetic algorithm for 10 companies is 3.209, and the average MAE of AHP is 8.032. This indicates that genetic algorithm performs better than AHP in FHA. The reason for the result shown in the above figure may be due to too much data. The AHP is prone to consistency issues when faced with large-scale and multidimensional financial data, resulting in poor evaluation performance. Comparison between genetic algorithm and AHP.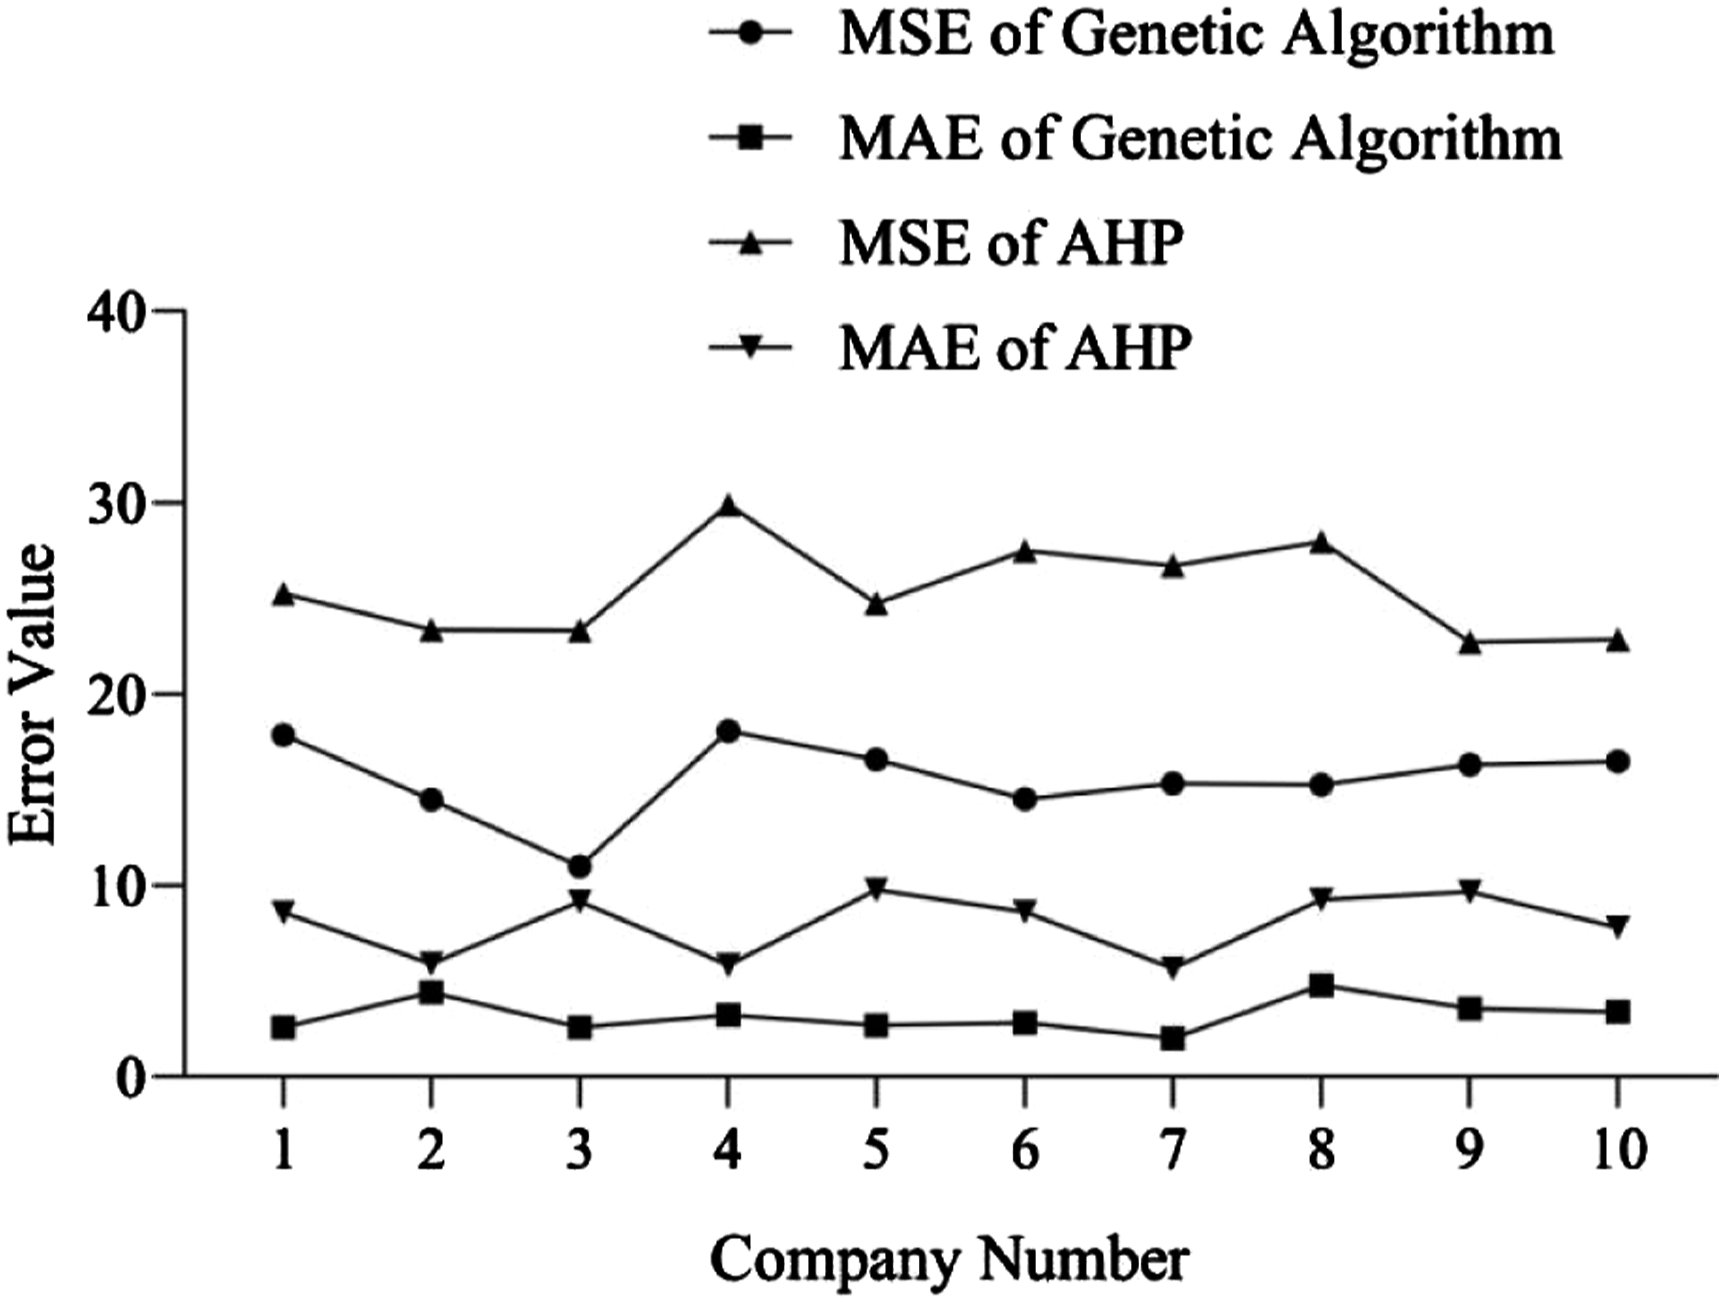
Comparison between genetic algorithm and entropy method
Entropy method 28 is an objective weighting method mainly used for determining weights in multi-index evaluation systems. The entropy method calculates the information entropy of each evaluation indicator to reflect the information content of the indicator, and determines the weight of the indicator based on this. The entropy method calculates weights based on the statistical characteristics of the data itself, reducing the interference of subjective factors. The entropy method directly uses the distribution characteristics of the data and does not need to rely on the judgment of external experts. The process can be fully automated, and the weight distribution results can be quickly obtained through statistics and calculations, reducing the complexity of manual calculations and adjustments. The entropy method is very sensitive to the distribution and quality of data. If there are serious missing values or outliers in the data, the entropy calculation results may be inaccurate, thus affecting the final weight distribution.
According to Figure 5, the maximum difference between the MSE of the genetic algorithm and the MSE of the entropy method for the same company is 11.754, and the minimum difference is 0.563. The maximum difference between the genetic algorithm MAE and the entropy method MAE of the same company is 5.497, and the minimum difference is 1.011. The average MSE of the genetic algorithm for 10 companies is 16.031, and the average MSE of the entropy method is 23.783. The average MAE of the genetic algorithm for 10 companies is 3.711, and the average MAE of the entropy method is 7.304. The MSE of entropy method is greater than that of genetic algorithm for all companies, and the MAE of entropy method is also greater than that of genetic algorithm, indicating that genetic algorithm is superior to entropy method in FHA models. Financial indicators are interdependent, and the entropy method emphasizes the objectivity of indicators, which may overlook their interrelationships and result in unsatisfactory evaluation results. Comparison between genetic algorithm and entropy method.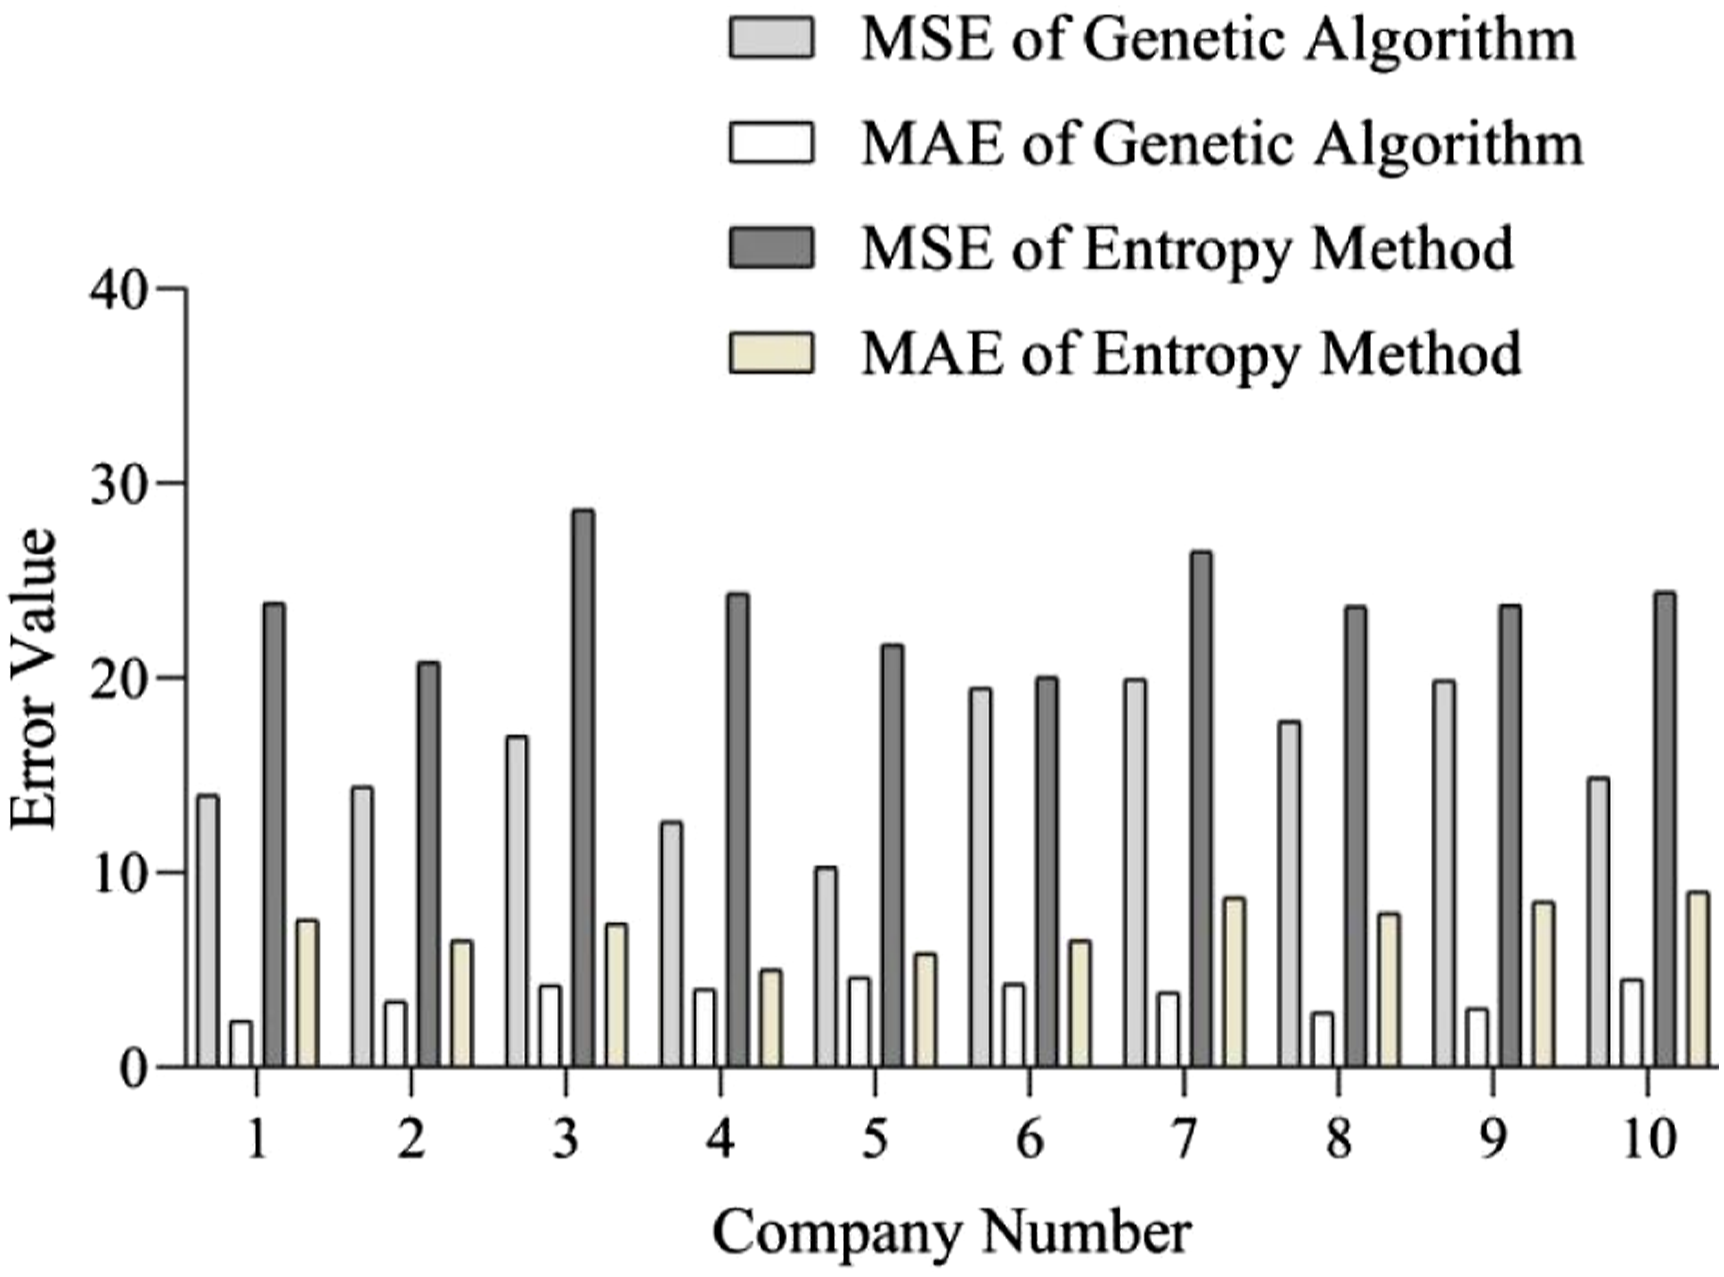
Comparison between genetic algorithm and multivariate statistical analysis method
Multivariate statistical analysis 29 is a statistical method used to analyze the relationships and structures between multiple variables.
According to Figure 6 analysis, the average MSE of genetic algorithm for 10 companies is 16.158, and the average MSE of multivariate statistical analysis is 26.032. The average MAE of genetic algorithm for 10 companies is 3.324, and the average MAE of multivariate statistical analysis is 7.288. The MSE value of the genetic algorithm for the same company is smaller than the MSE value of multivariate statistical analysis, and the MAE value of the genetic algorithm is also smaller than the MAE value of multivariate statistical analysis. This indicates that genetic algorithm is superior to multivariate statistical analysis in this experiment. Multivariate statistical analysis mainly relies on linear relationships and cannot handle complex nonlinear problems. Due to the selection of 11 financial indicators for FHA in this article, the relationship between different financial indicators is not simply linear, which may lead to inaccurate multivariate statistical analysis evaluation. Comparison between genetic algorithm and multivariate statistical analysis method.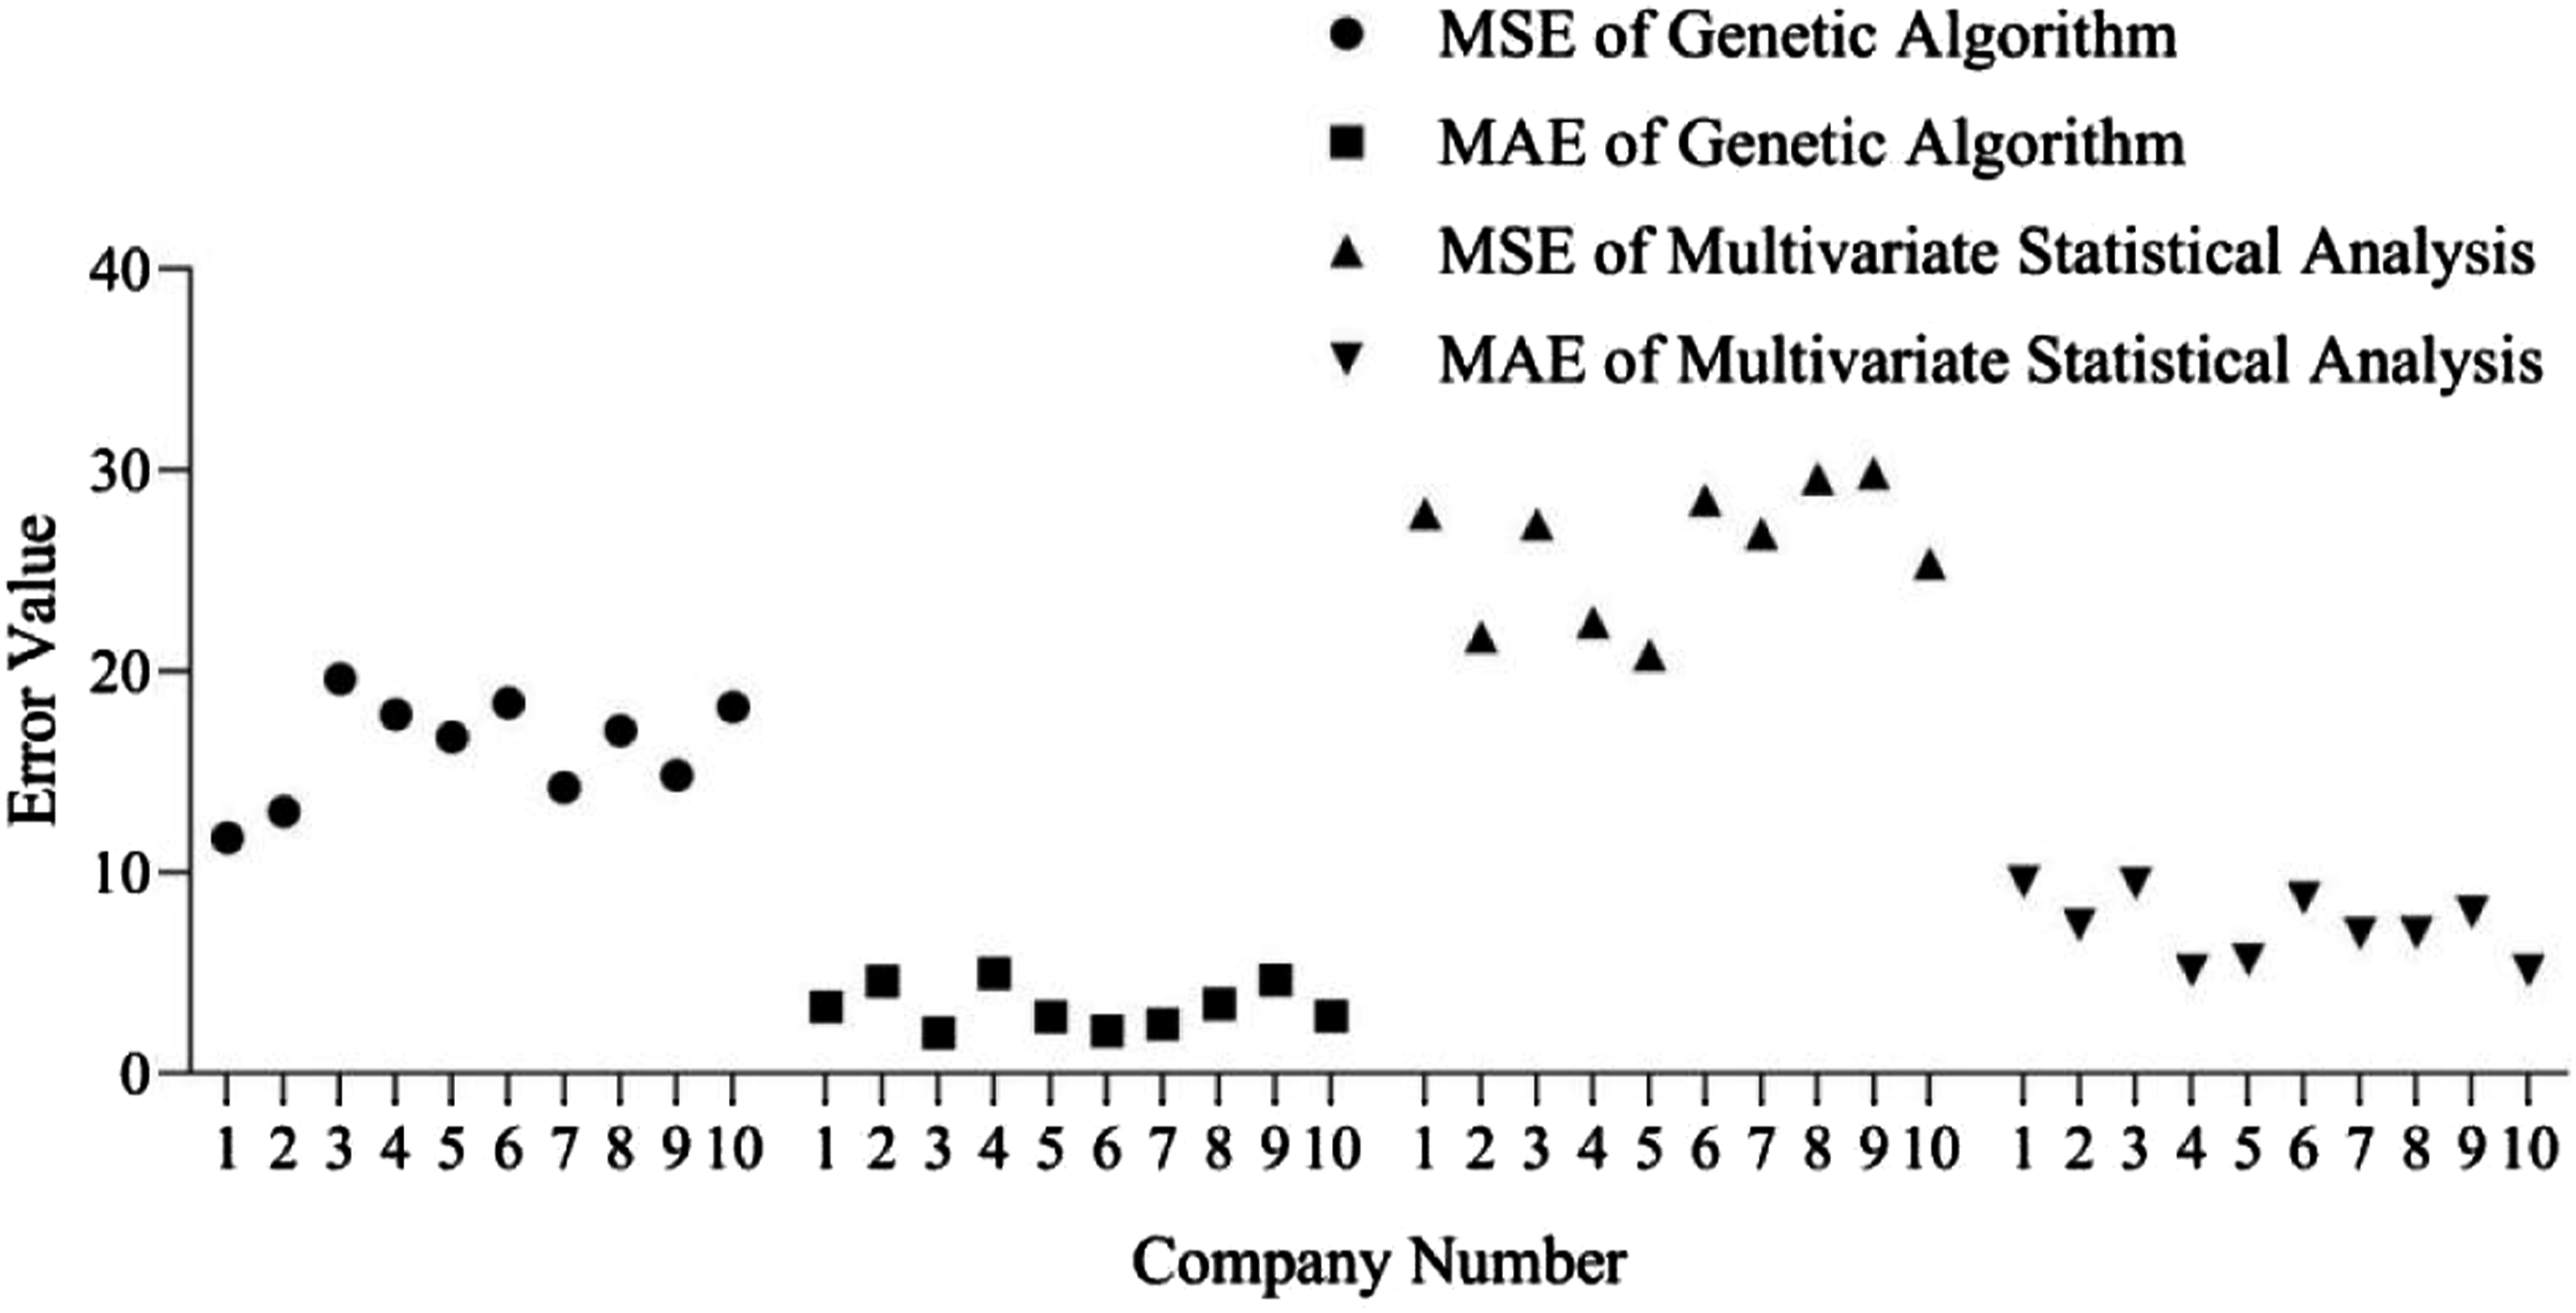
Comparison between genetic algorithm and grey relational analysis method
Grey correlation analysis 30 is an analysis method based on grey system theory, which is used to evaluate the correlation between different factors. The grey relational analysis method reveals the intrinsic relationships of a system by calculating the grey correlation degree between variable sequences.
According to Figure 7, the maximum MSE of the genetic algorithm is 16.947 and the minimum is 10.355. The maximum and minimum MSE values of the grey relational analysis method are 29.306 and 20.478, respectively. The maximum value of the genetic algorithm MAE is 4.511 and the minimum value is 2.057. The maximum value of grey relational analysis MAE is 9.527 and the minimum value is 5.155. The maximum difference between the MSE of the genetic algorithm and the MSE of the grey relational analysis method for the same company is 18.049, and the minimum difference is 3.531. The maximum difference between the genetic algorithm MAE and the grey relational analysis MAE of the same company is 5.545, and the minimum difference is 0.644. The average MSE of the genetic algorithm for 10 companies is 13.799, and the average MSE of the grey relational analysis method is 24.88. The average MAE of the genetic algorithm for 10 companies is 3.746, and the average MAE of the grey relational analysis method is 7.081. Genetic algorithm performs better than grey relational analysis in FHA models. The grey relational analysis method is suitable for small sample and uncertain data, which may be due to the large sample size in this article, resulting in poor evaluation performance. Comparison between genetic algorithm and grey relational analysis method.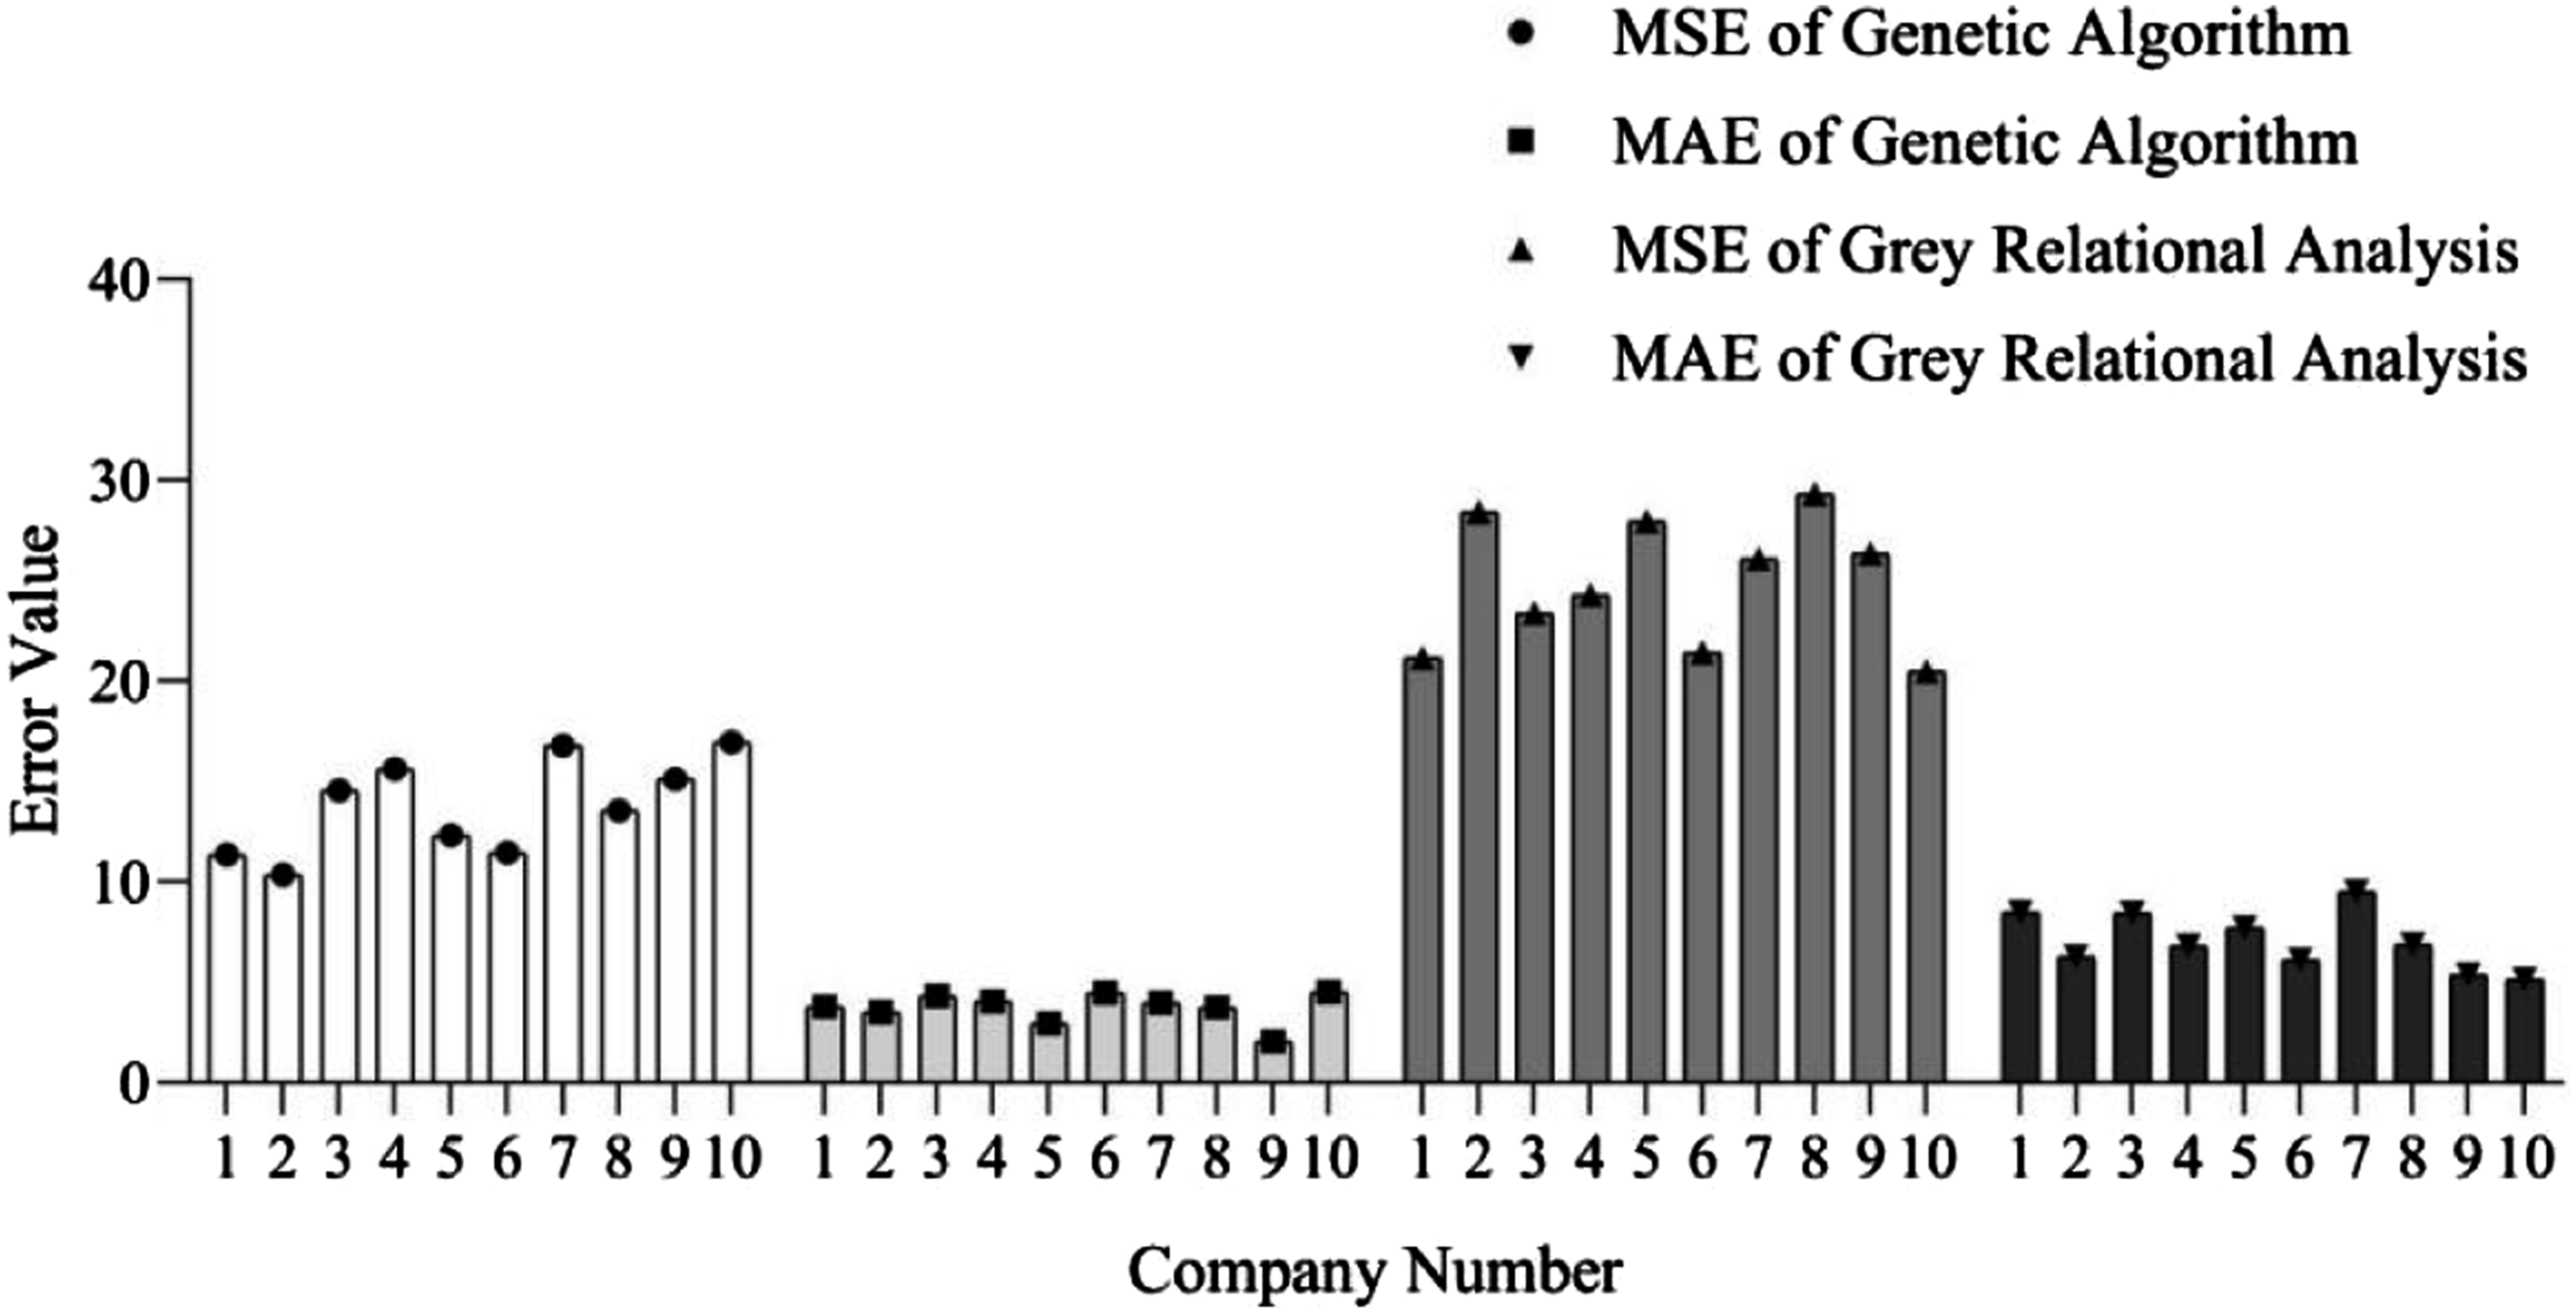
Conclusions
The enterprise FHA model based on genetic algorithm significantly improves the accuracy and robustness of the assessment by optimizing the algorithm parameters and fitness function. Genetic algorithms can improve the accuracy of comprehensive evaluation models by optimizing the weights of financial indicators. It enhances the ability to predict future financial conditions by adjusting the parameters of the prediction model. It supports complex financial decisions, such as capital investment and financing decisions, and optimizes decision plans under multiple objectives and constraints. Anomaly detection models can be used to identify potential issues in financial data, such as fraud or erroneous reporting, and improve model performance and computational efficiency through feature selection. They help companies find the best solutions in complex financial analysis and decision-making processes, and improve the efficiency and effectiveness of financial management. Compared to traditional expert scoring methods, genetic algorithms are more objective in determining weights and have higher consistency and scientificity in evaluating results. Compared to the AHP, genetic algorithms have more advantages in computational efficiency and processing large-scale data. Compared to entropy method, genetic algorithm can better consider the correlation between indicators and improve the accuracy of evaluation results. Compared to multivariate statistical analysis, genetic algorithms can handle complex nonlinear relationships and have stronger adaptability. Compared to grey relational analysis, genetic algorithm has better performance in large sample and complex data environments, performs better in handling complex financial data and multi-objective optimization, and can provide more accurate and comprehensive FHA results. The optimization of enterprise financial health assessment model based on genetic algorithm has significant innovations, including improving the accuracy and stability of the model by optimizing the weight of financial indicators and the design of dynamic fitness function. It can demonstrate excellent computational efficiency when processing large-scale data and effectively capture nonlinear relationships in financial data. The optimized model not only has strong generalization ability, but also provides more scientific data support for enterprise financial management and decision-making, promoting the progress of enterprise financial evaluation methods.
Genetic algorithm incorporates multiple financial indicators into the fitness function, making FHA more comprehensive and holistic. Genetic algorithms can provide a more comprehensive assessment of financial health status and offer richer information support for business managers. In the future, FHA models can be combined with other intelligent optimization algorithms, such as particle swarm optimization and differential evolution, to further improve the performance of assessment models. The enterprise financial health assessment model based on genetic algorithms helps enterprises find the best solution in complex financial decision-making, accurately identify and manage risks, thereby optimizing resource allocation, improving financial forecasting capabilities, providing important reference for enterprise decision-making, and gaining greater competitive advantages in the fiercely competitive market. The FHA model can also consider combining genetic algorithms with machine learning technology to develop a more intelligent and automated enterprise FHA system, which can assist in decision-making and management optimization. In practical applications, the value of genetic algorithms is reflected in its powerful optimization capabilities and wide applicability. In many fields such as resource allocation, portfolio optimization, supply chain management, production scheduling, and marketing strategies, genetic algorithms provide efficient solutions by simulating natural selection and genetic processes. Genetic algorithms not only improve the accuracy of decision-making, but also significantly optimize the operational efficiency of enterprises, reduce costs, improve overall economic benefits, and provide strong support for enterprises in a fiercely competitive environment.
