




Abstract
This article explores the application of the NSGA-II (Non-dominated Sorting Genetic Algorithm II) algorithm in optimizing parameters of project cost models using sensitivity analysis. Accurate project cost prediction is crucial in construction project management as it directly influences budgeting and resource allocation. The study begins by constructing a project cost model and applying the Sobol sensitivity analysis method to identify key parameters. Monte Carlo simulation is then employed to generate a large dataset of input samples, from which the first-order and total sensitivity indices for each variable are calculated to assess their impact on the model’s output. The NSGA-II algorithm, a multi-objective optimization technique, is utilized to balance multiple objectives within the cost model. By optimizing parameter settings, the study evaluates the model’s predictive performance under various parameter combinations, including the associated time and resource consumption. The optimized model achieved a mean squared error (MSE) of 0.042, a mean absolute error (MAE) of 0.15, and a coefficient of determination (R2) of 0.928, demonstrating its high prediction accuracy and robustness. The parameter optimization not only enhances the model’s predictive power but also efficiently manages computational costs, validating the effectiveness and practical value of the proposed method.
Keywords
Introduction
Construction projects have a significant impact on GDP (Gross Domestic Product) growth. The project cost1,2 model is crucial in construction projects, and accurate cost prediction 3 can effectively control costs and improve management efficiency and economic benefits. With the complexity of construction projects, traditional empirical estimation and simple statistical models can no longer meet the requirements. Establishing a cost model involves complex relationships between material, labor, equipment costs, and uncertainty factors. To improve prediction accuracy, researchers are attempting to optimize key parameters of the models to enhance their prediction performance. The accuracy of a model depends on the comprehensiveness and accuracy of the data, as well as the rationality of the model structure and parameters. The selection and setting of parameters have a significant impact on the prediction results, so scientific selection and optimization of parameters4,5 has become an important topic. Sensitivity analysis, 6 as a key tool, can identify the parameters that have the greatest impact on the model output and assist in parameter optimization.
Project cost prediction mainly adopts empirical estimation and statistical modeling methods. The empirical method relies on expert experience to estimate the cost of new projects by comparing and summarizing historical projects but is limited by subjective judgment and difficult to adapt to complex projects. Statistical modeling methods using regression analysis7,8 and other models require a large amount of historical data training but perform poorly when dealing with nonlinear and high-dimensional data. In recent years, machine learning methods such as neural networks, 9 support vector machines, 10 and artificial intelligence have been introduced. These methods have shown good performance in handling nonlinear relationships and high-dimensional data, with higher prediction accuracy compared to traditional methods. These methods require a large amount of data and computational resources. They are sensitive to parameter selection and adjustment, and are prone to overfitting.11,12 Traditional methods meet the requirements to a certain extent, but there are limitations in complex projects. Empirical methods are influenced by subjective factors and lack scientific basis. Statistical modeling methods have limited prediction accuracy and are challenging to handle complicated data. Machine learning-based methods have outstanding performance but high resource requirements and insufficient interpretability.
This article presents a parameter optimization approach for project cost models by combining the NSGA-II algorithm with sensitivity analysis. As a multi-objective optimization algorithm, NSGA-II excels in simultaneously optimizing multiple objective functions, utilizing non-dominated sorting and crowding distance to evaluate individuals, while offering high optimization efficiency and strong global search capabilities. By applying Sobol sensitivity analysis to the project cost model, the study identifies key parameters for optimization, effectively reducing the dimensionality of the optimization process and enhancing efficiency.
During the parameter optimization process, NSGA-II is employed for multi-objective optimization. The method begins by randomly generating an initial population, followed by non-dominated sorting, crossover, and mutation operations, ultimately arriving at the Pareto optimal solution set. From this set, the most suitable parameter combinations are selected based on real-world requirements. The experimental results show that this approach significantly improves the prediction accuracy of the project cost model, offering a scientific foundation for further model enhancements. This method holds considerable theoretical value and practical utility in improving the precision and reliability of project cost forecasting.
Related work
Numerous academics have carried out in-depth research on how to improve the accuracy of cost prediction in recent years. Saini et al. 13 used genetic algorithm (GA) 14 to optimize the parameters of the support vector machine (SVM) model, simulating daily price curves in a separate time series, and applied it to a large power system in the National Electricity Market (NEM) of Australia, achieving more accurate price prediction and verifying that the model outperformed other technologies in prediction ability. Matel et al. 15 proposed a method for estimating engineering service costs using artificial neural network (ANN). 16 By identifying key factors affecting costs, models were developed using data from 132 projects, and heuristic methods are developed to optimize model performance. Research has found that in small datasets, ANN could achieve fairly accurate cost estimation, with a 14.5% increase in model accuracy compared to other similar models. These studies indicated that advanced machine learning methods had significant advantages in dealing with complex cost prediction problems. At the same time, statistical methods were constantly being improved. Narbaev et al. 17 proposed a new cost estimate at completion (CEAC) method based on an improved exponential formula and a nonlinear Gompertz growth model. This method integrated schedule status as a cost-benefit factor, effectively overcoming the limitations of traditional earned value management (EVM) 18 indices, and improving the accuracy and precision of project cost estimation. These studies provided important theoretical basis and technical support for this article, especially in model construction and parameter optimization, providing effective references and references.
The study of the NSGA-II algorithm’s applications in optimization with many objectives field is very extensive. Deb et al. 19 first proposed the NSGA-II algorithm and proved its effectiveness in issues involving multi-objective optimization. In the last few years, the NSGA-II algorithm has been widely applied in various engineering and management optimization problems. Ma 20 and others conducted a comprehensive survey of NSGA-II and its improved version NSGA-III 21 using a literature review method, summarizing their applications regarding multi-objective optimization and exploring future research potential. Teo et al. 22 proposed a fuzzy energy-management system (FEMS), 23 which managed renewable energy and energy storage systems through NSGA-II-optimized fuzzy membership functions to lower microgrid running costs and average peak load. 24 A actual microgrid was used for experimental validation of the system. These studies demonstrated the strong ability and broad application prospects of the NSGA-II algorithm in handling complex multi-objective optimization problems. This article refers to these research results and applies the NSGA-II algorithm to optimize the parameters of project cost models. By optimizing multiple objective functions, the accuracy and reliability of cost prediction are improved.
Sensitivity analysis plays a crucial role in model optimization and parameter selection. Christopher Frey et al. 25 compared 10 different sensitivity analysis methods for identifying and qualitatively assessing food safety risk models, 26 aiming to identify key control points, prioritize data collection, and validate models. They emphasized the importance of combining multiple methods to achieve optimal outcomes. Similarly, Campolongo et al. 27 performed a parameter sensitivity analysis on a model for producing sulfur-containing compounds in algal biota. By employing Morris screening tests, they assessed the impact of parameter inputs on the model’s outputs, calculated variance measures, and analyzed standardized regression coefficients. The confidence interval of the simulated annealing (SA) estimator was evaluated using the bootstrap method, 28 offering new insights into system mechanisms and data parameterization.
Nossent et al. 29 applied the Sobol sensitivity analysis and bootstrap methods to the SWAT model for simulating water flow in the Kleine Nete River. They successfully evaluated the significance of the model parameters, analyzed parameter interactions, and identified key processes, providing essential information for model calibration 30 and parameter optimization. These studies serve as key references for this article, particularly in the selection and application of sensitivity analysis methods, offering both theoretical grounding and practical guidance for model optimization.
Parameter optimization of project cost model
Principle of NSGA-II algorithm
NSGA-II is an evolutionary algorithm used for multi-objective optimization, which evaluates individuals through non-dominated sorting and crowding distance. After initializing the population, non-dominated sorting is performed on individuals to find Pareto front (PF), and crowding distance is computed to preserve the diversity of solutions. Individuals are selected for procedures for crossover and mutation based on non-dominated levels and crowding distances to explore the solution space and avoid local optima. Repeat this process until the termination condition is met before ending the operation. In the parameter optimization of engineering cost models, NSGA-II does not require weighting operations on the objective function. Its efficient sorting and distance calculation ability make it perform well in parameter optimization problems.
Sensitivity analysis methods
Sensitivity analysis is used to determine the impact of input variables on model output. The Sobol method evaluates the contribution of input variables through variance decomposition, providing first-order and total sensitivity indices. It is assumed that model output

In formula (1),

The contribution of a given parameter and all of its higher-order interaction factors to the output variance is shown by the total sensitivity index, and the calculation formula is as follows:

In formula (3),
The total sensitivity index considers the interaction between variables. Sobol sensitivity analysis provides detailed parameter impact information and identifies key parameters. In the sensitivity analysis, Monte Carlo method is used to generate a large number of input samples, run the model and calculate the output, and obtain the sensitivity index through statistical analysis.
Construction of project cost model
Accurately capture the various factors affecting the cost and establish the relationship between it and the total cost, which is the key to build the project cost model. The input variable of the model is various costs, and the output variable is the total project cost. When inputting variables, the comprehensiveness and representativeness of input variables must be ensured. Traditional regression analysis is suitable for linear relationships, but for complex nonlinear relationships, neural networks and support vector machine (SVM) are more advantageous. In this paper, the support vector regression (SVR) model is used to deal with the nonlinear relationship by mapping the input variables to the high-dimensional space through the kernel function. Collect historical data to train SVR model and standardize input data to avoid dimensional difference. The prediction performance of the model is evaluated through cross-validation methods and the model parameters are adjusted to achieve optimal results. The optimized model is applied to actual engineering projects to predict the cost of new projects. By continuously updating and optimizing the model, its accuracy and reliability can be further improved.
In addition to traditional SVR models and kernel function mapping, parameter initialization strategy is also one of the important factors affecting model performance. Reasonable parameter initialization can significantly accelerate the optimization process, improve the prediction accuracy and convergence, speed of the model. This article explores a heuristic initialization strategy based on historical data, which uses existing historical data to train the model preliminarily and extracts parameter combinations with good performance as initial values. This method reduces the search space by utilizing existing information in historical data, making the optimization process more efficient. Compared to simple random initialization, heuristic initialization can significantly improve the initial performance of the model, reduce the time and resource consumption required for optimization, and thus achieve the global optimal solution more quickly.
Process of parameter optimization
In the process of parameter optimization, this article adopts a heuristic initialization strategy based on historical data, extracting outstanding parameter combinations from historical data as individuals for the initial population. This strategy effectively reduces the search space for optimization and improves the optimization efficiency of the NSGA-II algorithm. After generating the initial population, non-dominated sorting is performed on individuals, and high-quality individuals are selected for crossover and mutation operations based on crowding distance, continuously optimizing parameter combinations, and finally obtaining the Pareto optimal solution set. The optimization process includes the generation of the initial population, non-dominated sorting, crossover and mutation operations, as well as the final Pareto optimal solution selection, as shown in Figure 1. Parameter optimization process.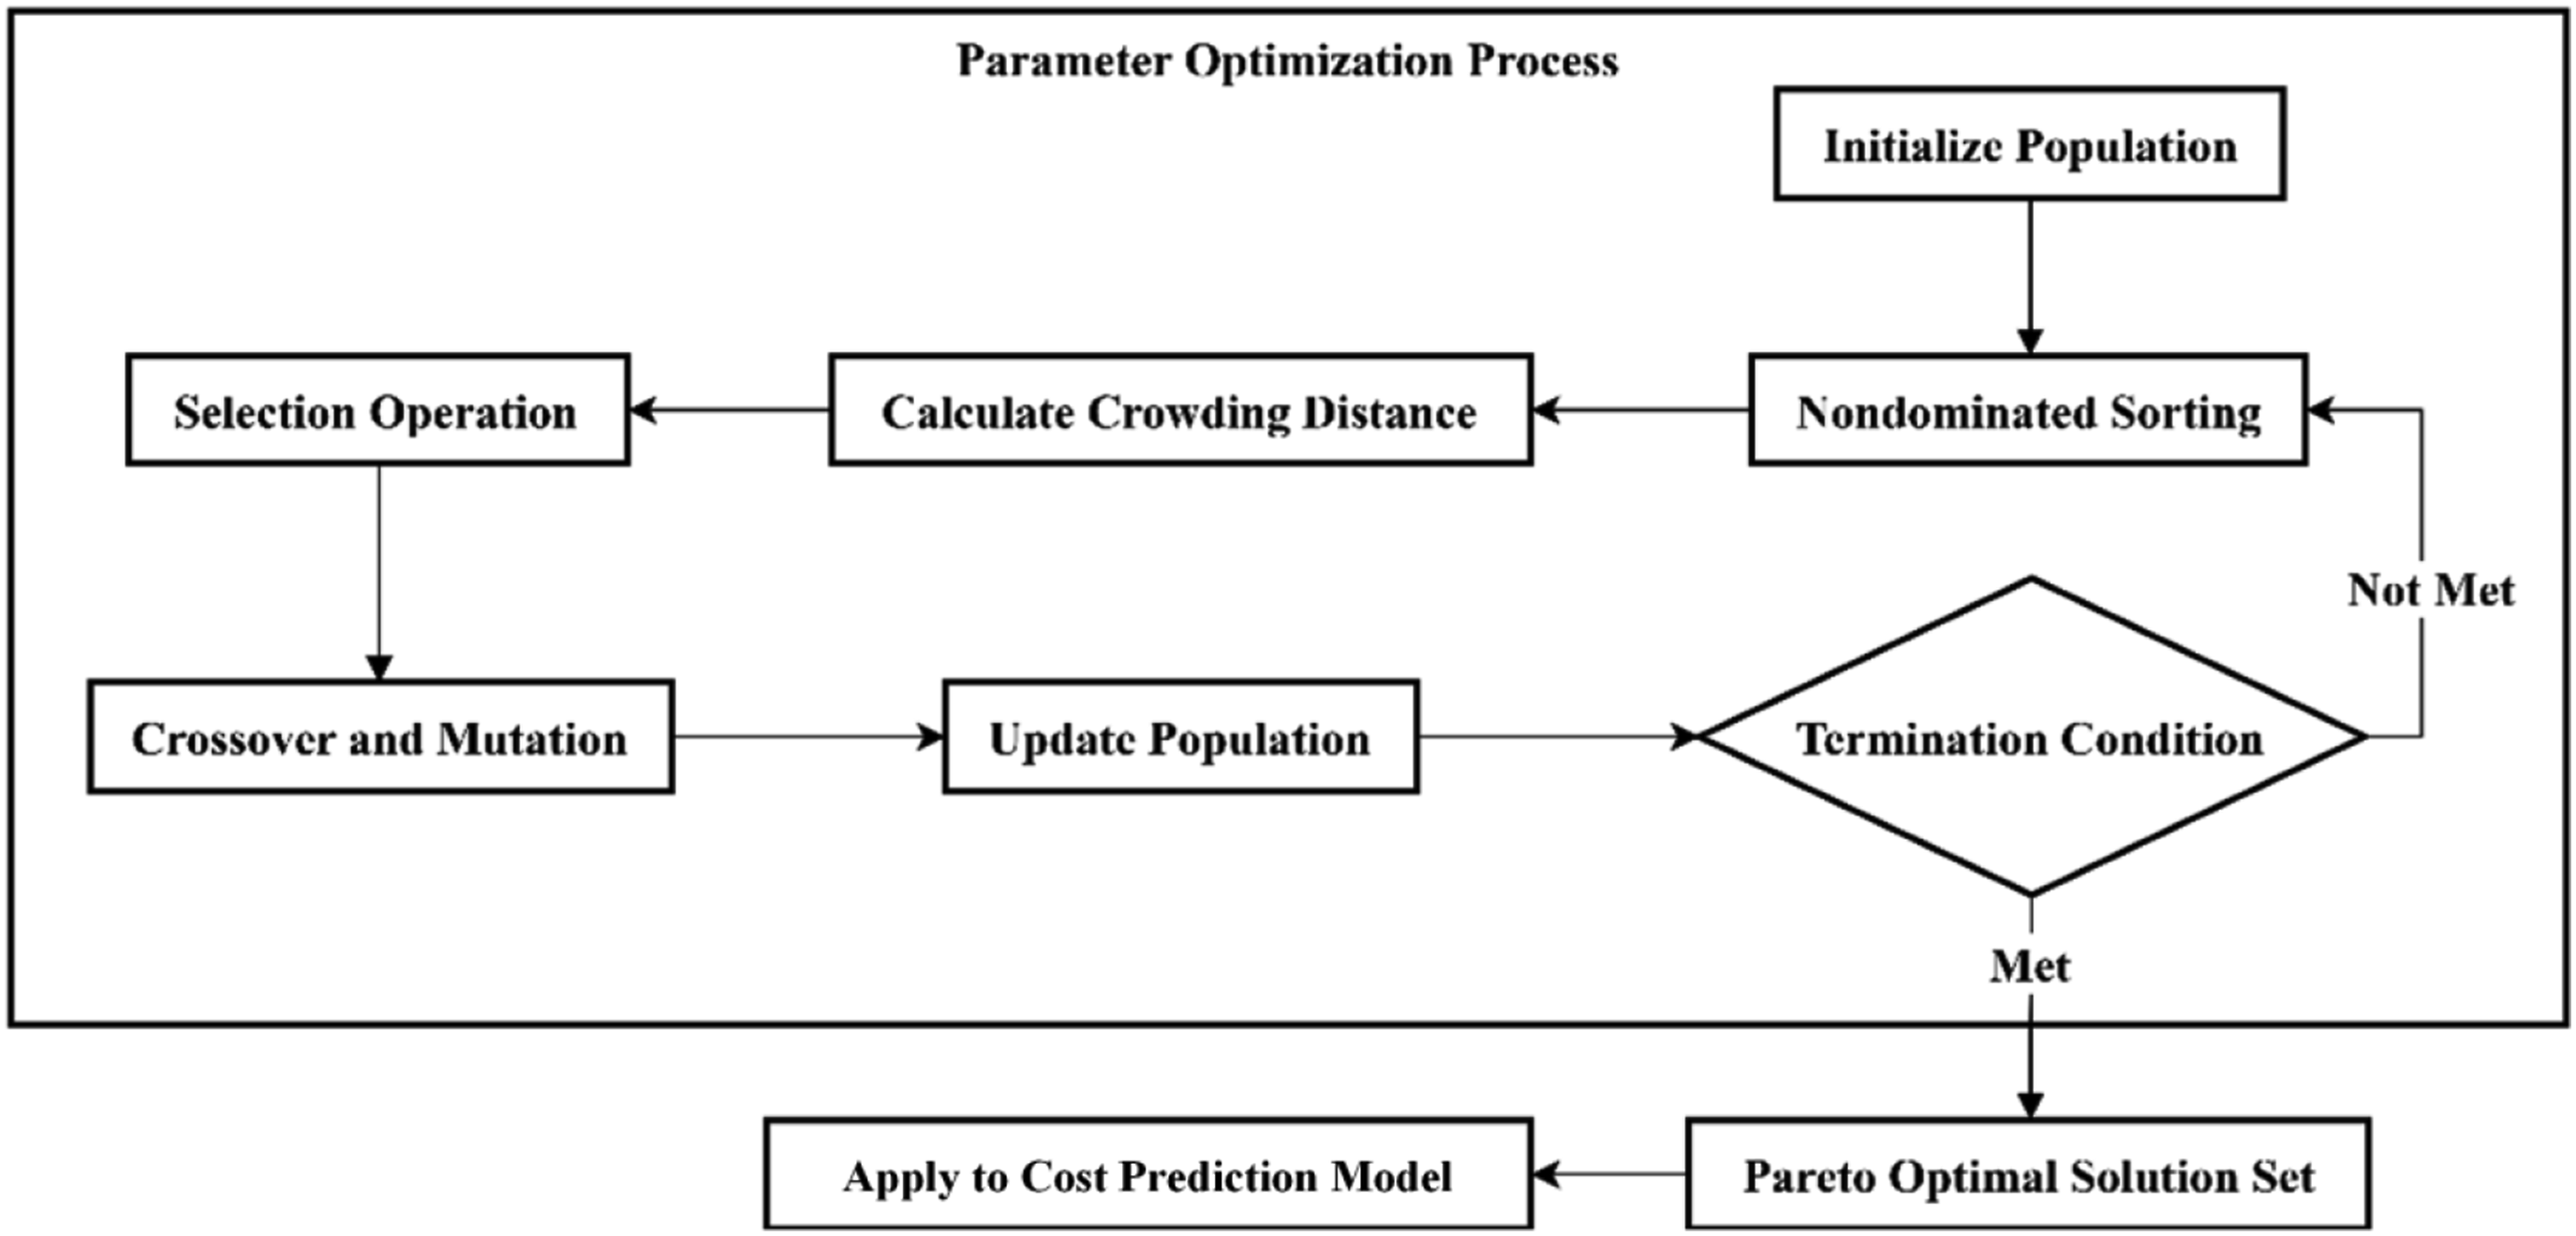
An initial population containing multiple individuals is generated, each representing a possible combination of parameters. Non-dominated sorting is performed on individuals in the population, dividing them into several levels. The higher the level, the better the parameter combination corresponding to the individuals in the optimization objective. The crowding distance of individuals within each level is calculated. The larger the crowding distance, the higher the sparsity of individuals in the solution space, and these individuals are retained first to maintain population diversity. Based on non-dominated sorting and crowding distance, some individuals are selected to enter the next generation, and a tournament selection mechanism is adopted to ensure that high-quality individuals are selected first. Operations for crossover and mutation are carried out on selected individuals to generate new ones. Crossover operation simulates gene recombination, and mutation operation introduces random perturbation to explore new solution spaces. Newly generated individuals are added to the population, and the calculation of crowding distance and non-dominated sorting are repeated. The high-quality individuals are retained to form a new population. The above process is repeated continuously until the termination conditions are met, such as reaching the predetermined number of iterations or there being no significant improvement in population quality. After several generations of evolution, a non-dominated solution set containing Pareto optimal solutions is ultimately obtained. Based on the sensitivity analysis results, the optimal parameter combination is selected and applied to the project cost model to improve its prediction accuracy and reliability.
Evaluation indicators
Evaluating the optimization effect requires defining reasonable evaluation indicators, which not only include the prediction accuracy of the model but also consider the complexity and computational cost of the model. In this paper, MSE, MAE, R2, and RMSE are used as the performance evaluation indexes of the model. The calculation formulas are shown in formulas (4)–(7):




The lower the MSE and MAE values, the higher the prediction accuracy, and RMSE is the square root of MSE. R 2 evaluates the goodness of fit of the model, ranging from 0 to 1. The fitting effect improves with proximity to 1. The model complexity affects the prediction accuracy and calculation cost, and too high complexity easily leads to over fitting. It is necessary to balance the prediction accuracy and complexity, display the prediction accuracy and complexity under different parameter combinations through charts, and identify the optimal scheme. The calculation cost is the key to evaluate the practicability of the model. It is necessary to select the optimization algorithm to complete the calculation in a reasonable time, especially when dealing with large-scale data and high-dimensional parameters.
Experiments on project cost optimization
Data collection and processing
To verify the practical application effect of the parameter optimization method for engineering cost models based on NSGA-II algorithm and sensitivity analysis proposed in this paper, a case study was conducted on a certain actual engineering project. The project is a comprehensive office building with a total budget of 50 million yuan and a construction period of 18 months. The main costs involved in the project include key variables such as material costs, labor costs, equipment costs, project duration, project scale, and project type. The diversity and representativeness of these data ensure the wide applicability of the model. After data collection is completed, data cleaning, missing value processing, and outlier detection and preprocessing are performed on the data. Data cleaning is to remove duplicate records and irrelevant information, ensuring the accuracy and consistency of data. Approximately 5% of records are found to have missing values during the cleaning process. The missing values are processed using interpolation and mean imputation methods to reduce the impact of incomplete data on model construction. Outliers are detected through box plots, and records with excessively large outliers are removed. The box plot of data distribution is shown in Figure 2. Box plot of data distribution.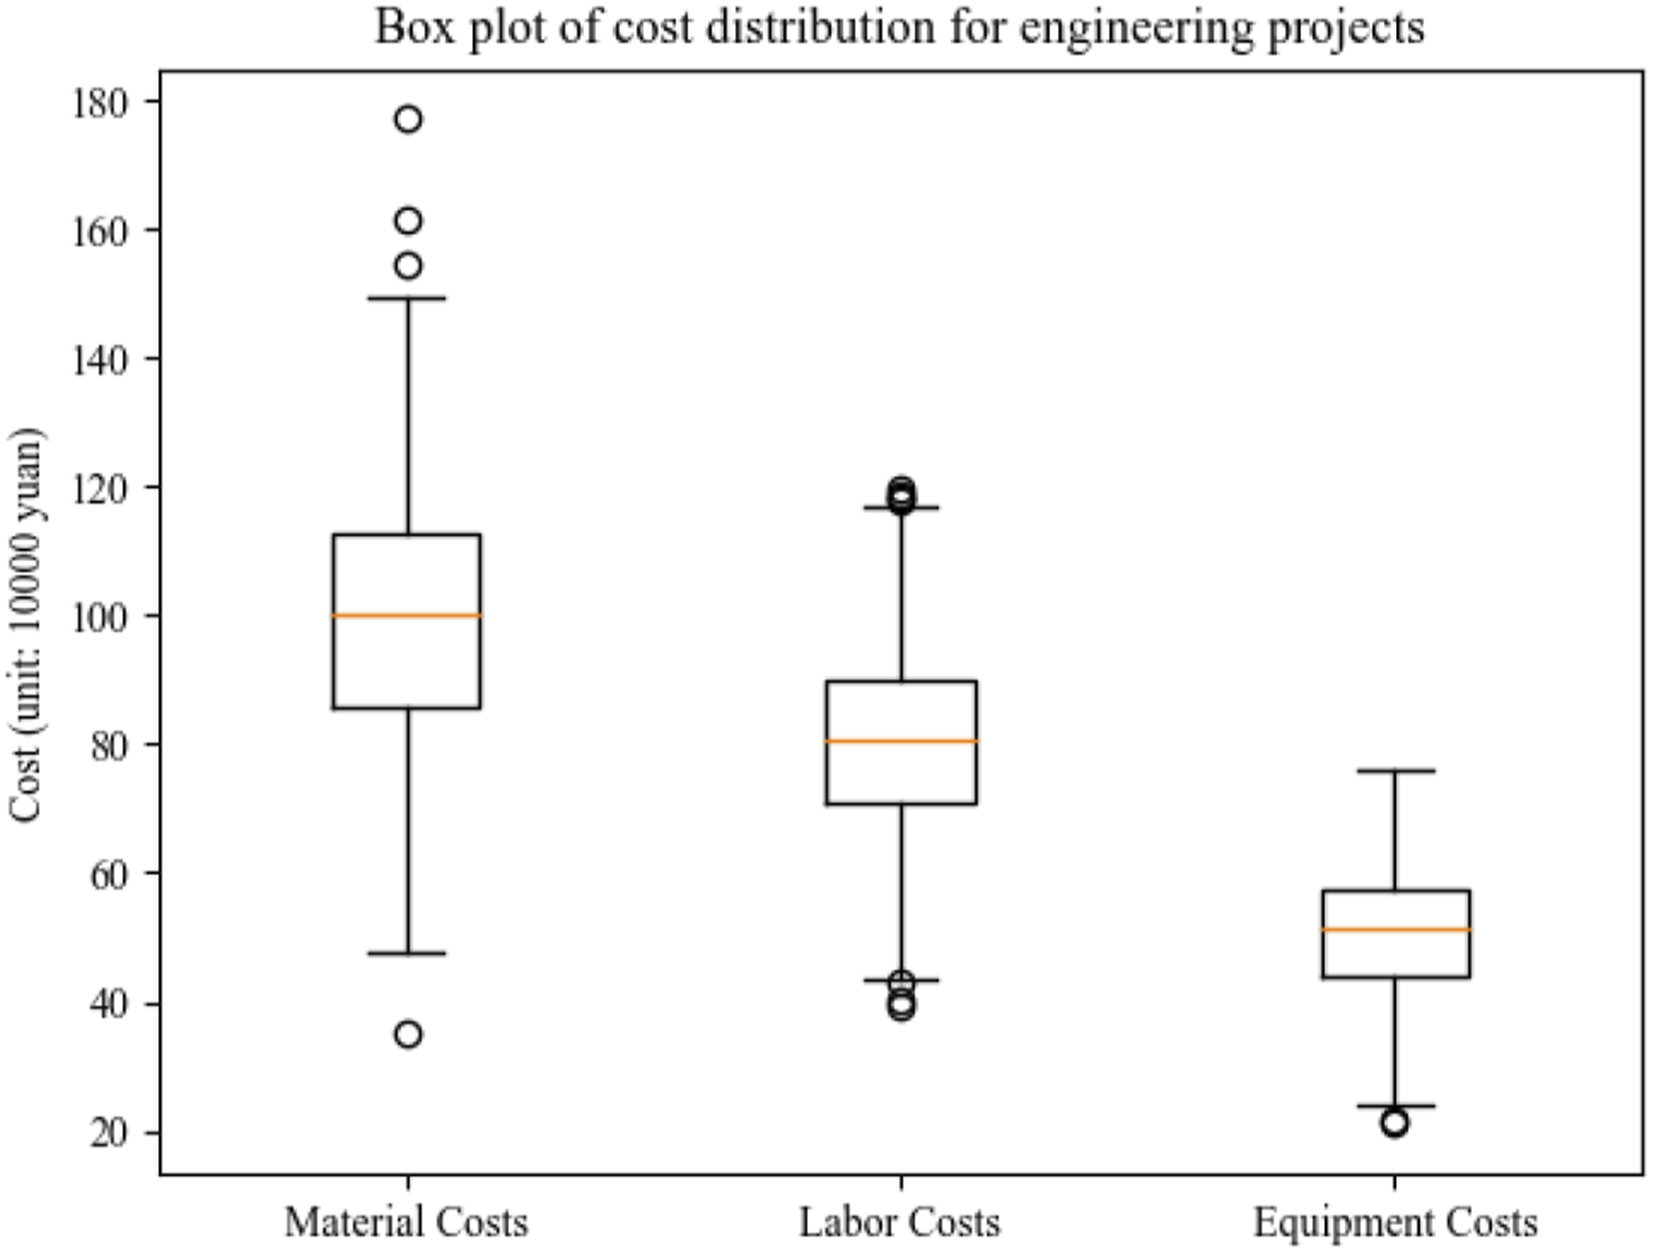
From Figure 2, it can be seen that there are four outliers in material costs, namely, 370,000 yuan, 1.57 million yuan, 1.61 million yuan, and 1.79 million yuan. There are four outliers in labor costs, namely, 400,000 yuan, 410,000 yuan, 1.18 million yuan, and 1.2 million yuan. The equipment costs have an outlier of 220,000 yuan. A total of 9 outliers are identified, which are removed to ensure the rationality and accuracy of the data.
After data preprocessing is completed, the data is standardized. Due to the different dimensions and ranges of different variables, using raw data directly may lead to certain variables dominating model training while the influence of other variables is ignored. Using the Z-score normalization method, all variables are transformed into a conventional normal distribution with a mean of 0 and a standard deviation of 1. The convergence speed is accelerated by this processing technique and prediction accuracy of the model. In the process of data processing, this experiment conducts feature selection and dimensionality reduction of the data. Feature selection is to screen out key variables that have a significant impact on cost prediction and avoid redundant features causing noise interference to the model. This article adopts a feature selection method based on correlation coefficient and mutual information, selecting variables highly related to project cost. The principle component analysis (PCA) approach is used to reduce the dimensionality of the data, translating high-dimensional data into the low-dimensional space while maintaining as much of the original data information as possible. This further reduces the complexity and processing cost of the model.
The final step in data processing is to partition the divided the processed dataset in an 8:1:1 ratio between training, validation, and testing sets. The training set is used for model training; the validation set is used for model parameter tuning and selection; the testing set is utilized to assess the model’s ultimate performance. For the purpose of ensuring the reliability of model evaluation and the robustness of results, a cross-validation method is adopted, which partitions the dataset multiple times and conducts multiple training and validation to lessen the effects of uncertainty in data partitioning on model performance evaluation. In order to verify the generalization ability of the model on unseen data, this paper additionally divided a portion of the data as an external validation set. The data of the external validation set is independent of the training and testing sets, and is used to ultimately evaluate the generalization performance of the model.
Experimental design
Data collection and processing should be carried out before the experiment begins. After constructing the project cost model, the NSGA-II algorithm is used for parameter optimization to obtain the Pareto optimal solution set. Sobol sensitivity analysis is used to identify and evaluate the importance of parameters before the parameter input model. Monte Carlo simulation is used to generate input samples and run the model to record the output data. Calculate the first-order and total sensitivity index, and identify the variables with the greatest impact through the chart display analysis results. Adjust the optimization strategy of NSGA-II algorithm, and select the optimal parameter combination according to cross validation. The optimization model is applied to the actual project cost prediction and verified with the actual data.
Results
Evaluation of model prediction performance
Prediction performance indicators of different parameter combinations.
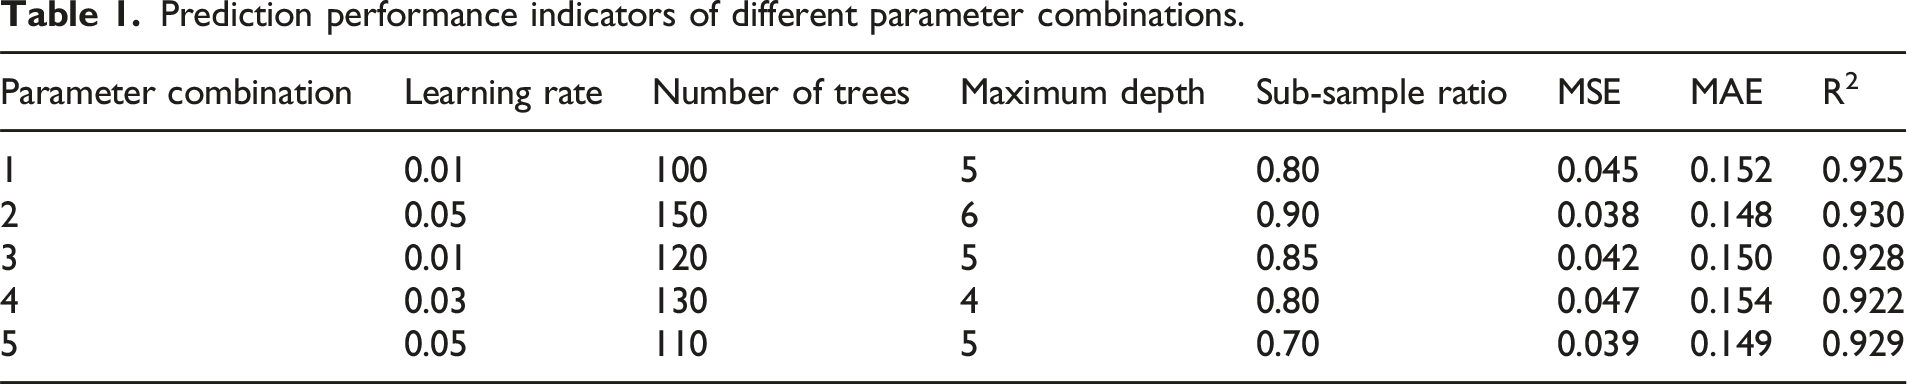
From Table 1, it can be seen that different parameter combinations have significant impacts on the prediction performance of the model. Combination 2 performs the best on the three indicators of MSE, MAE, and R2, with values of 0.038, 0.148, and 0.930, respectively, indicating that this parameter combination has excellent performance in reducing prediction errors and improving fit. In contrast, Combination 1 and Combination 3 also perform similarly, but slightly inferior to Combination 2 in terms of MAE and R2. Although Combination 4 and Combination 5 perform well in some indicators, overall they are still not as outstanding as Combination 2. This indicates that the NSGA-II algorithm can effectively find parameter combinations that exhibit outstanding performance in multiple indicators in parameter optimization, thereby providing more reliable prediction results for project cost models.
Computational costs of different parameter combinations.
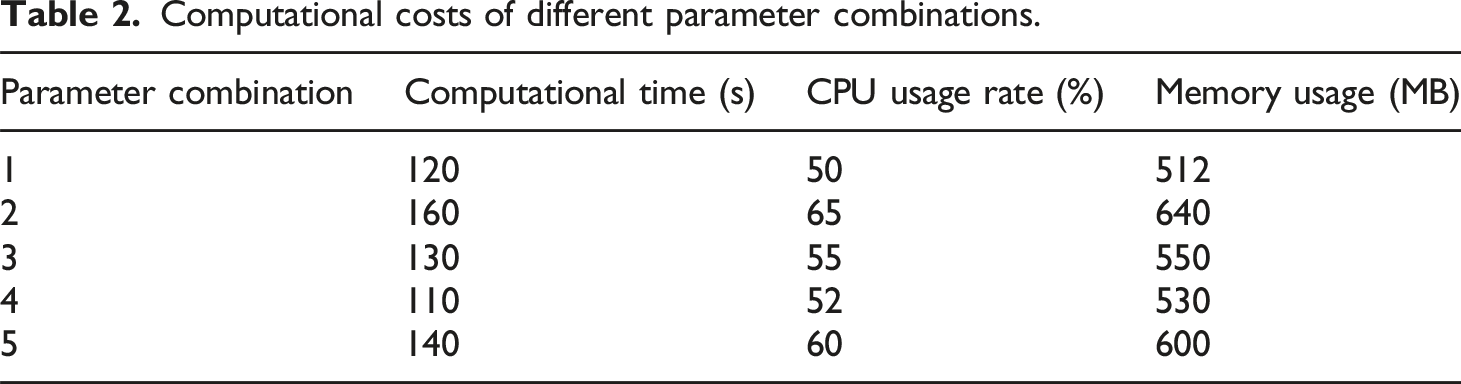
Table 2 shows that Combination 2 has the highest calculation time and resource consumption, but its prediction performance is the best according to Table 1. The calculation cost of Combination 1 and Combination 4 is relatively low, which is suitable for use in the case of limited resources. Combination 3 achieves a good balance between the prediction performance and the calculation cost, and is suitable for the optimal parameter combination of the project cost prediction model in this paper. This parameter combination not only ensures the prediction accuracy but also effectively controls the calculation cost.
This paper compares the performance of NSGA-II, Multi Objective Evolutionary Algorithm based on Decomposition (MOEA/D), GA, differential evolution (DE), and simulated annealing (SA) on the same dataset to further verify the prediction performance of the model. The performance of these algorithms is evaluated by comparing their performance on MSE, MAE, R2, and RMSE. Figure 3 shows the performance of different algorithms on various indicators, intuitively reflecting that the NSGA-II algorithm outperforms other algorithms in most indicators, especially in terms of mean squared error and coefficient of determination. Comparison of different algorithms.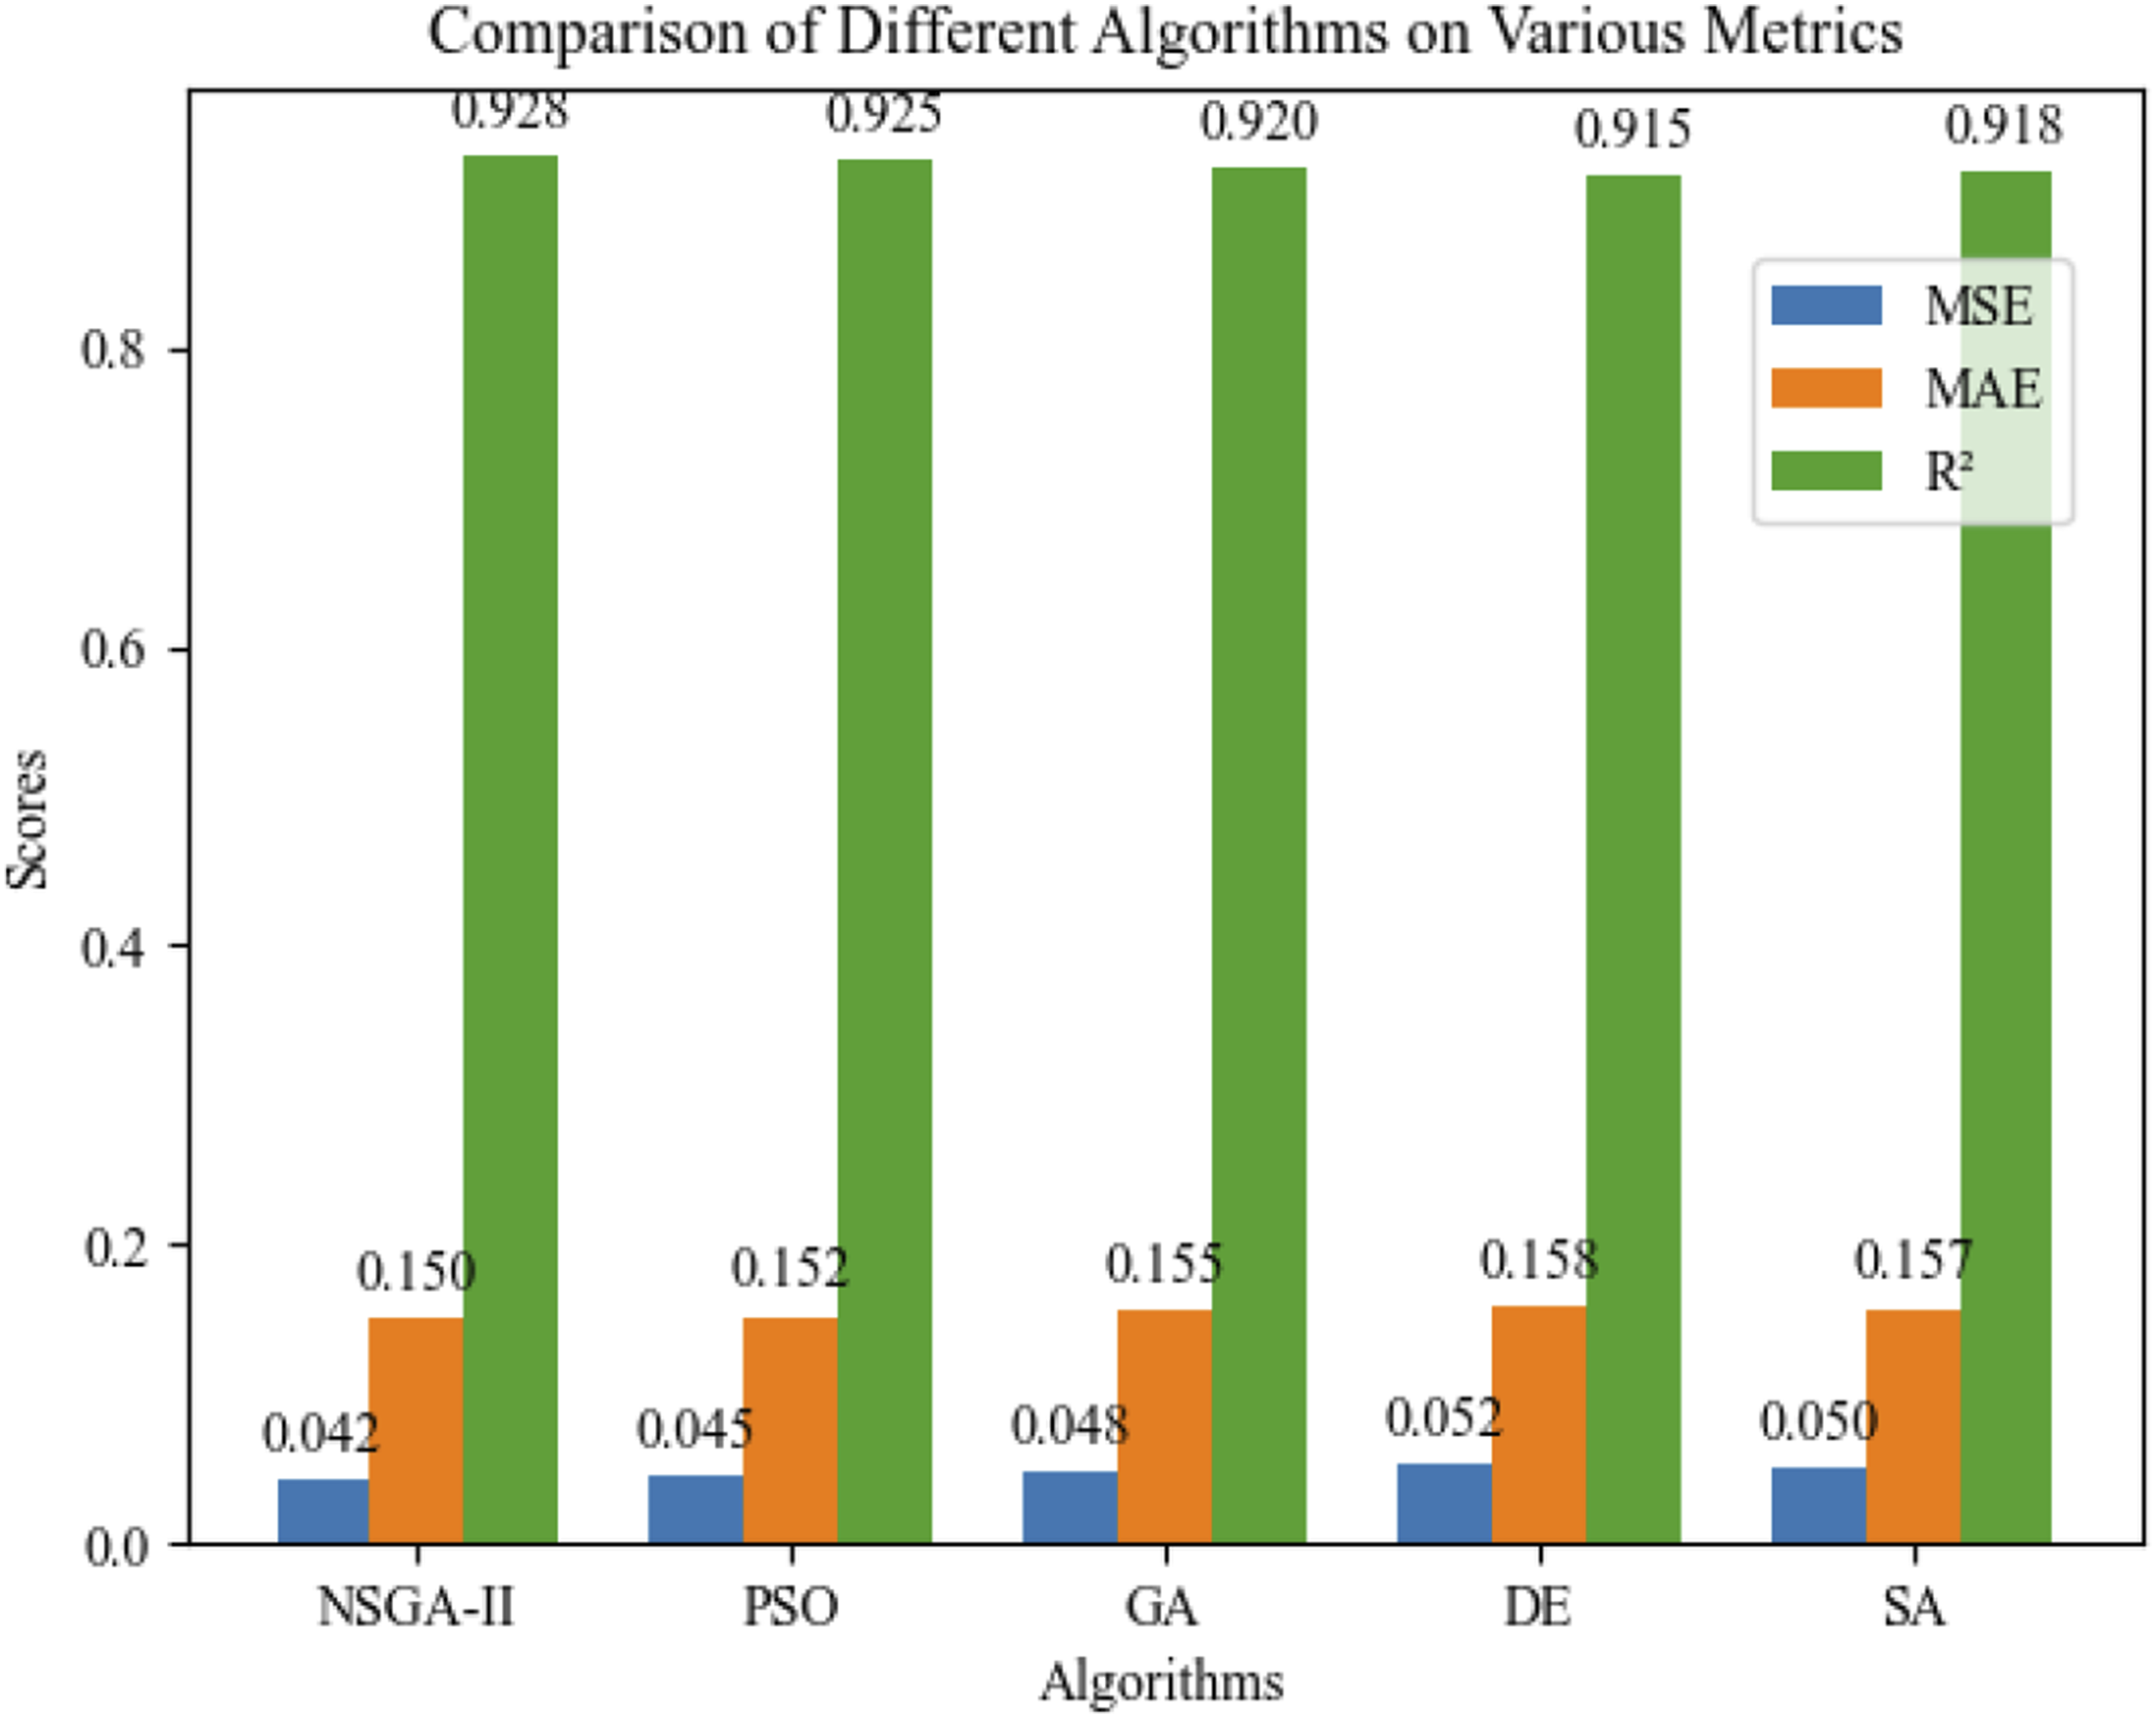
Figure 3 shows that the MSE, MAE, R2, and RMSE of NSGA-II algorithm reach 0.042, 0.150, 0.928, and 0.205, respectively, which outperform alternative algorithms. The performances of MOEA/D and GA are relatively close, and de and SA perform well in some indicators, but the overall performance is not as good as the above three algorithms. It shows that NSGA-II algorithm has obvious advantages in optimizing the parameters of the project cost model.
Results of parameter optimization
In parameter optimization, NSGA-II algorithm obtains the Pareto optimal solution set. Figure 4 shows the Pareto solution set of MSE and MAE. The balance is suitable for multi-objective optimization problems for decision-makers to choose, and the color of the points is coded according to the R 2 value. This visualization method intuitively displays the various solutions in the Pareto front and how these solutions perform on different objectives. Various solutions in the Pareto front.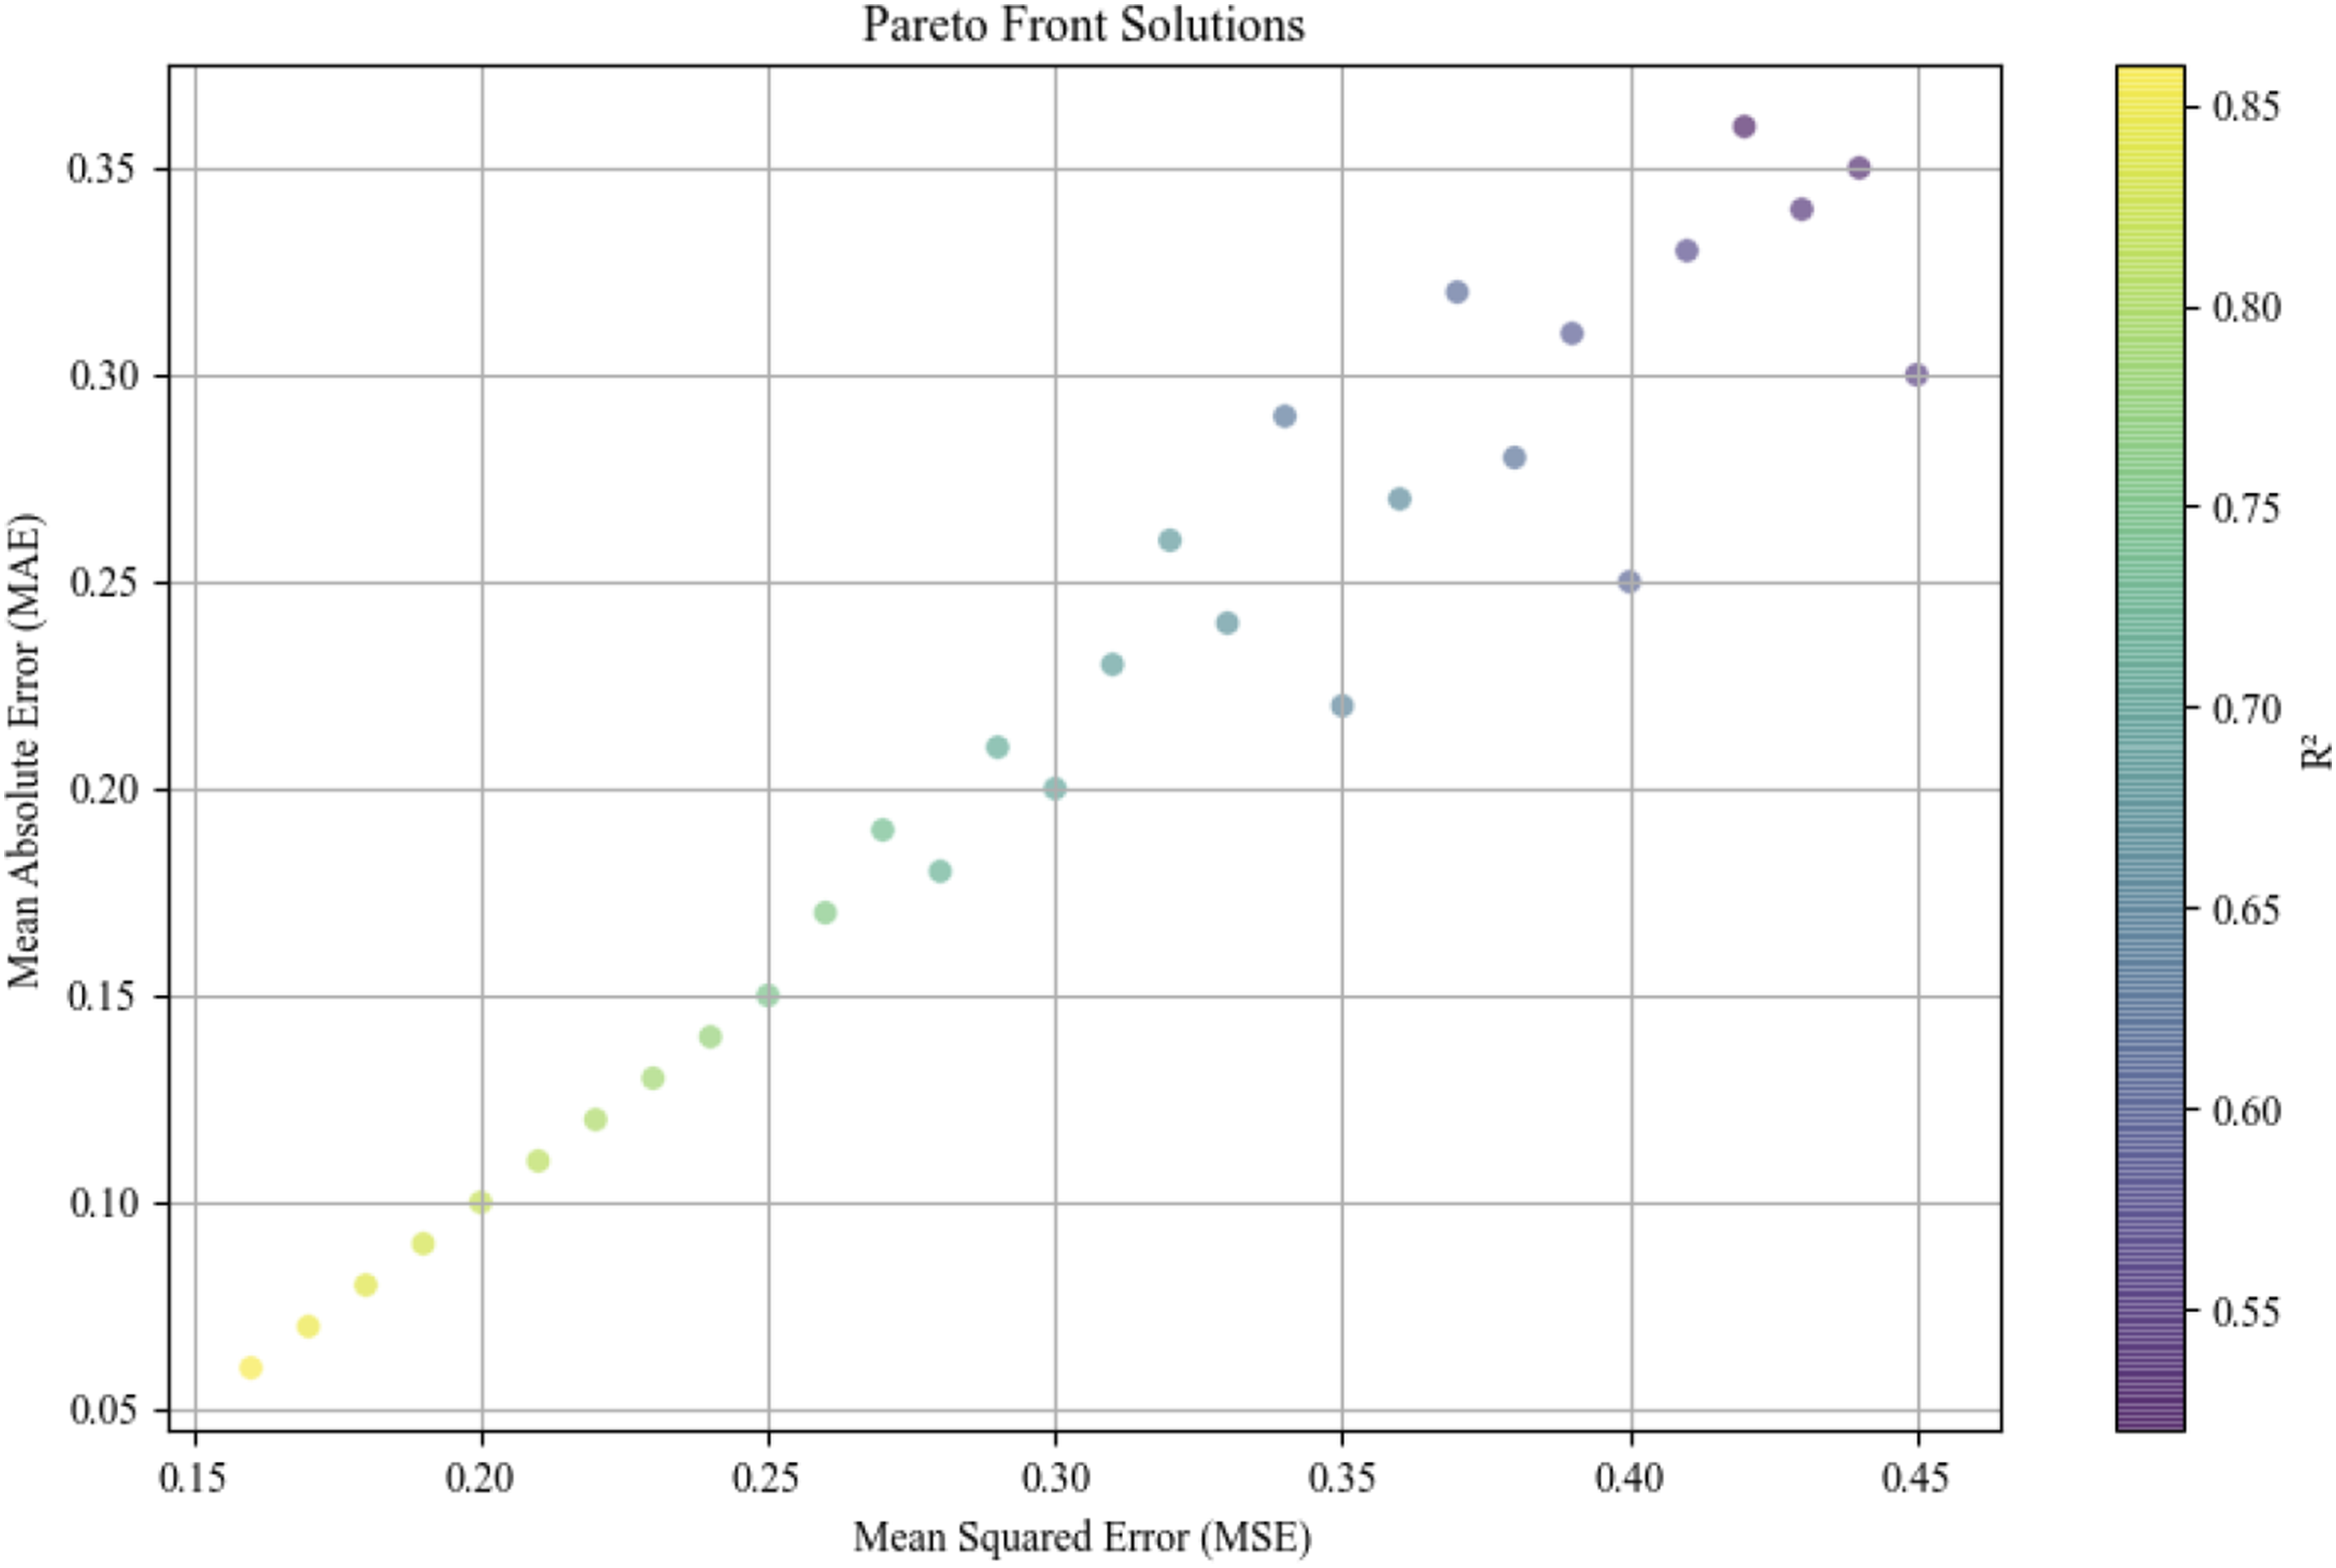
The Pareto front solution set produced by the NSGA-II algorithm is displayed in Figure 4. It can be seen that the Pareto front solution set is distributed in both the MSE and MAE dimensions, forming a relatively smooth front line. As MSE and MAE decrease, the R2 shows an increasing trend. Although some solutions perform generally on MSE and MAE, they are still included in the Pareto front due to their high R2 values. This indicates that for multi-objective optimization problems, there is a certain balancing relationship between different objectives, and the NSGA-II algorithm searches for the optimal solution set through this balancing relationship.
It is crucial to recognize the effects of various parameters combinations on the prediction performance of the project cost model parameter optimization process. By conducting systematic testing on multiple parameter combinations, it is possible to identify which parameters have the greatest impact on model performance and provide direction for subsequent optimization. This article determines the two key parameters of learning rate and batch size through experiments, and systematically tests their impacts on the MSE of model prediction error. The experimental results are visualized as a heat map, as shown in Figure 5. Each color block represents the MSE value of a specific parameter combination. This figure not only shows the impact of different parameter combinations on model performance but also reveals the complex relationship between learning rate and batch size on model error. MSE of different parameter combinations.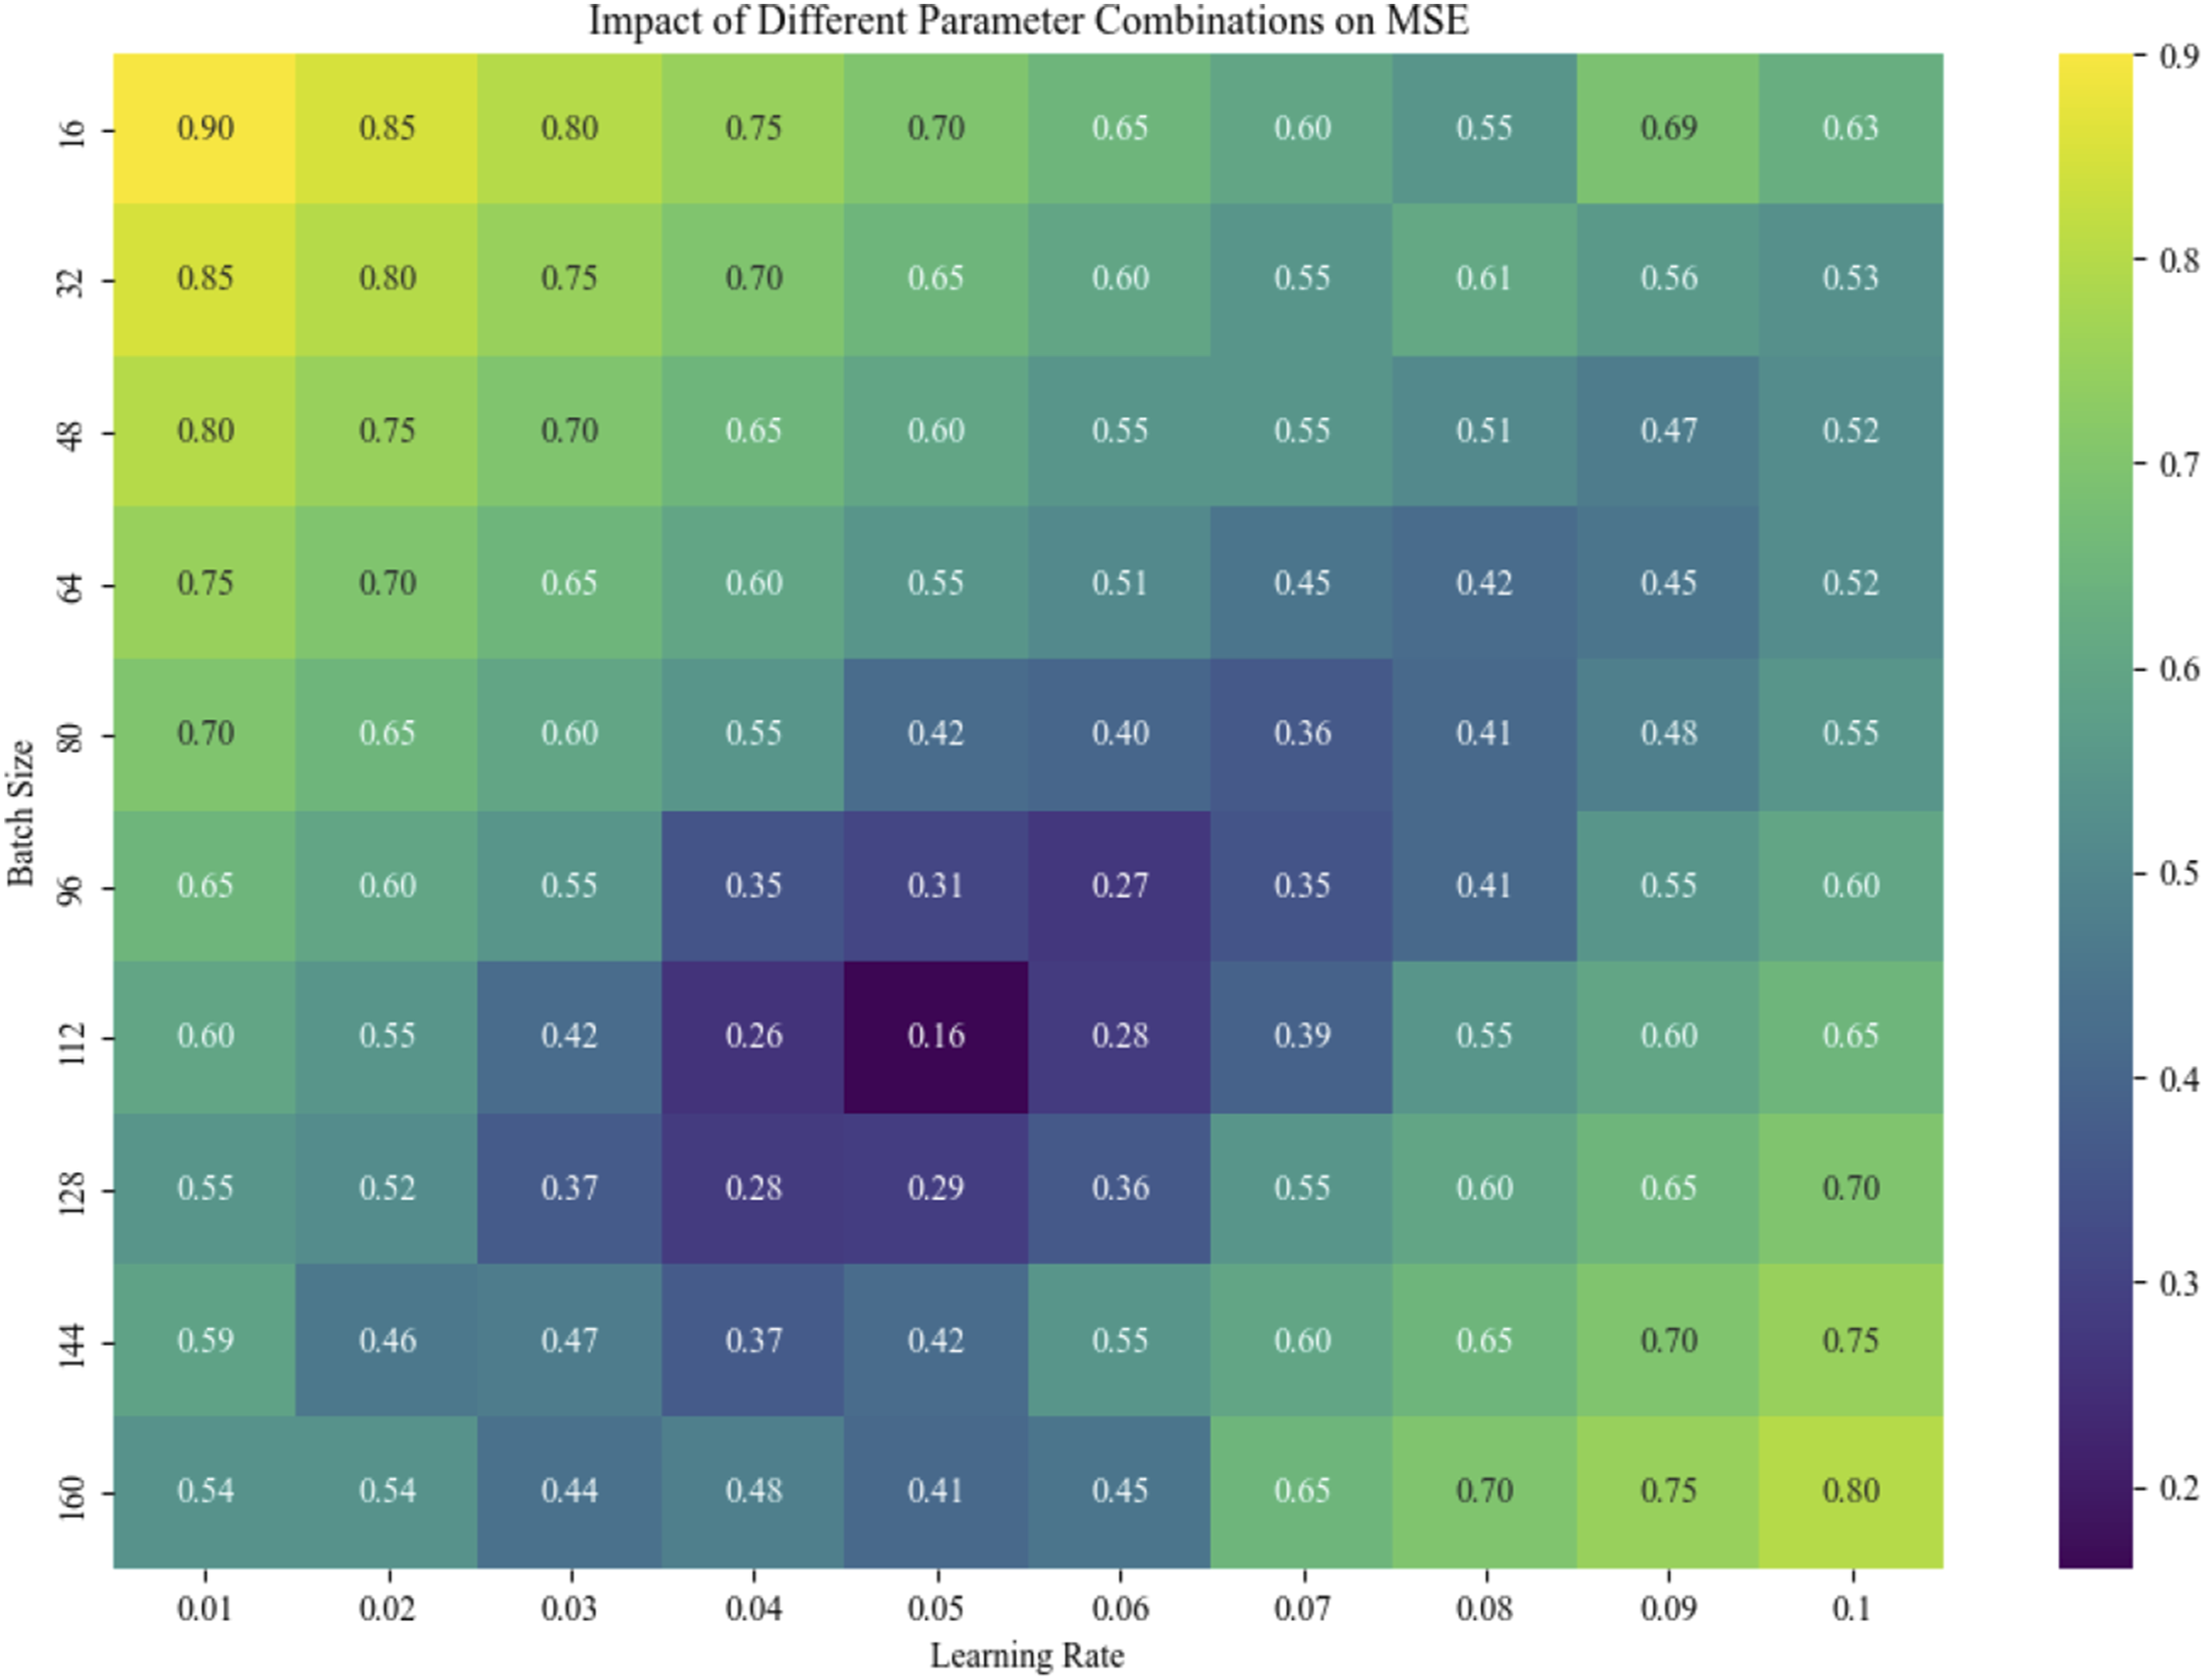
Figure 5 shows the impact of different combinations of learning rates and batch sizes on MSE. The combination of learning rate of 0.04–0.06 and batch size of 96–128 showed the lowest MSE and the best performance. When the learning rate increases, the MSE first declines and subsequently climbs, and the batch size is the best in the range of 96–128, indicating that the appropriate combination of learning rate and batch size significantly improves the accuracy of model prediction.
This study further validated the optimization effect through systematic testing of different parameter combinations. The experimental results show that different parameter combinations have a significant impact on the predictive performance of the model, especially in terms of learning rate and batch size. The optimized parameter combination significantly improves the prediction accuracy and stability of the model. This is mainly because during the optimization process, the NSGA-II algorithm effectively balances multiple objective functions, achieving the best balance between global search capability and local accuracy of the model. Efficient non-dominated sorting and crowding distance calculation ensure diversity and resolution quality, thus performing well in complex engineering cost prediction. The sensitivity analysis results indicate that learning rate and batch size have the greatest impact on model performance, and optimizing these key parameters significantly reduces prediction errors. In addition, the Sobol sensitivity analysis method provides detailed information on the impact of parameters, making the optimization process more targeted and efficient. By generating a large number of input samples through Monte Carlo simulation and calculating the first-order and total sensitivity indices of each input variable, the contribution of each parameter to the model output was effectively evaluated, providing a scientific basis for optimization. The combination of NSGA-II algorithm and sensitivity analysis method has shown significant advantages in improving the accuracy and stability of engineering cost model prediction, providing reliable theoretical and technical support for practical engineering applications.
Results of sensitivity analysis
Through sensitivity analysis, this research determines and comprehends the impact of input variables on model output. In this paper, the global sensitivity analysis based on Sobol method is employed to assess the model’s primary parameters. Figure 6 displays the effect of important variables on model output. Degree of influence of key parameters on model output.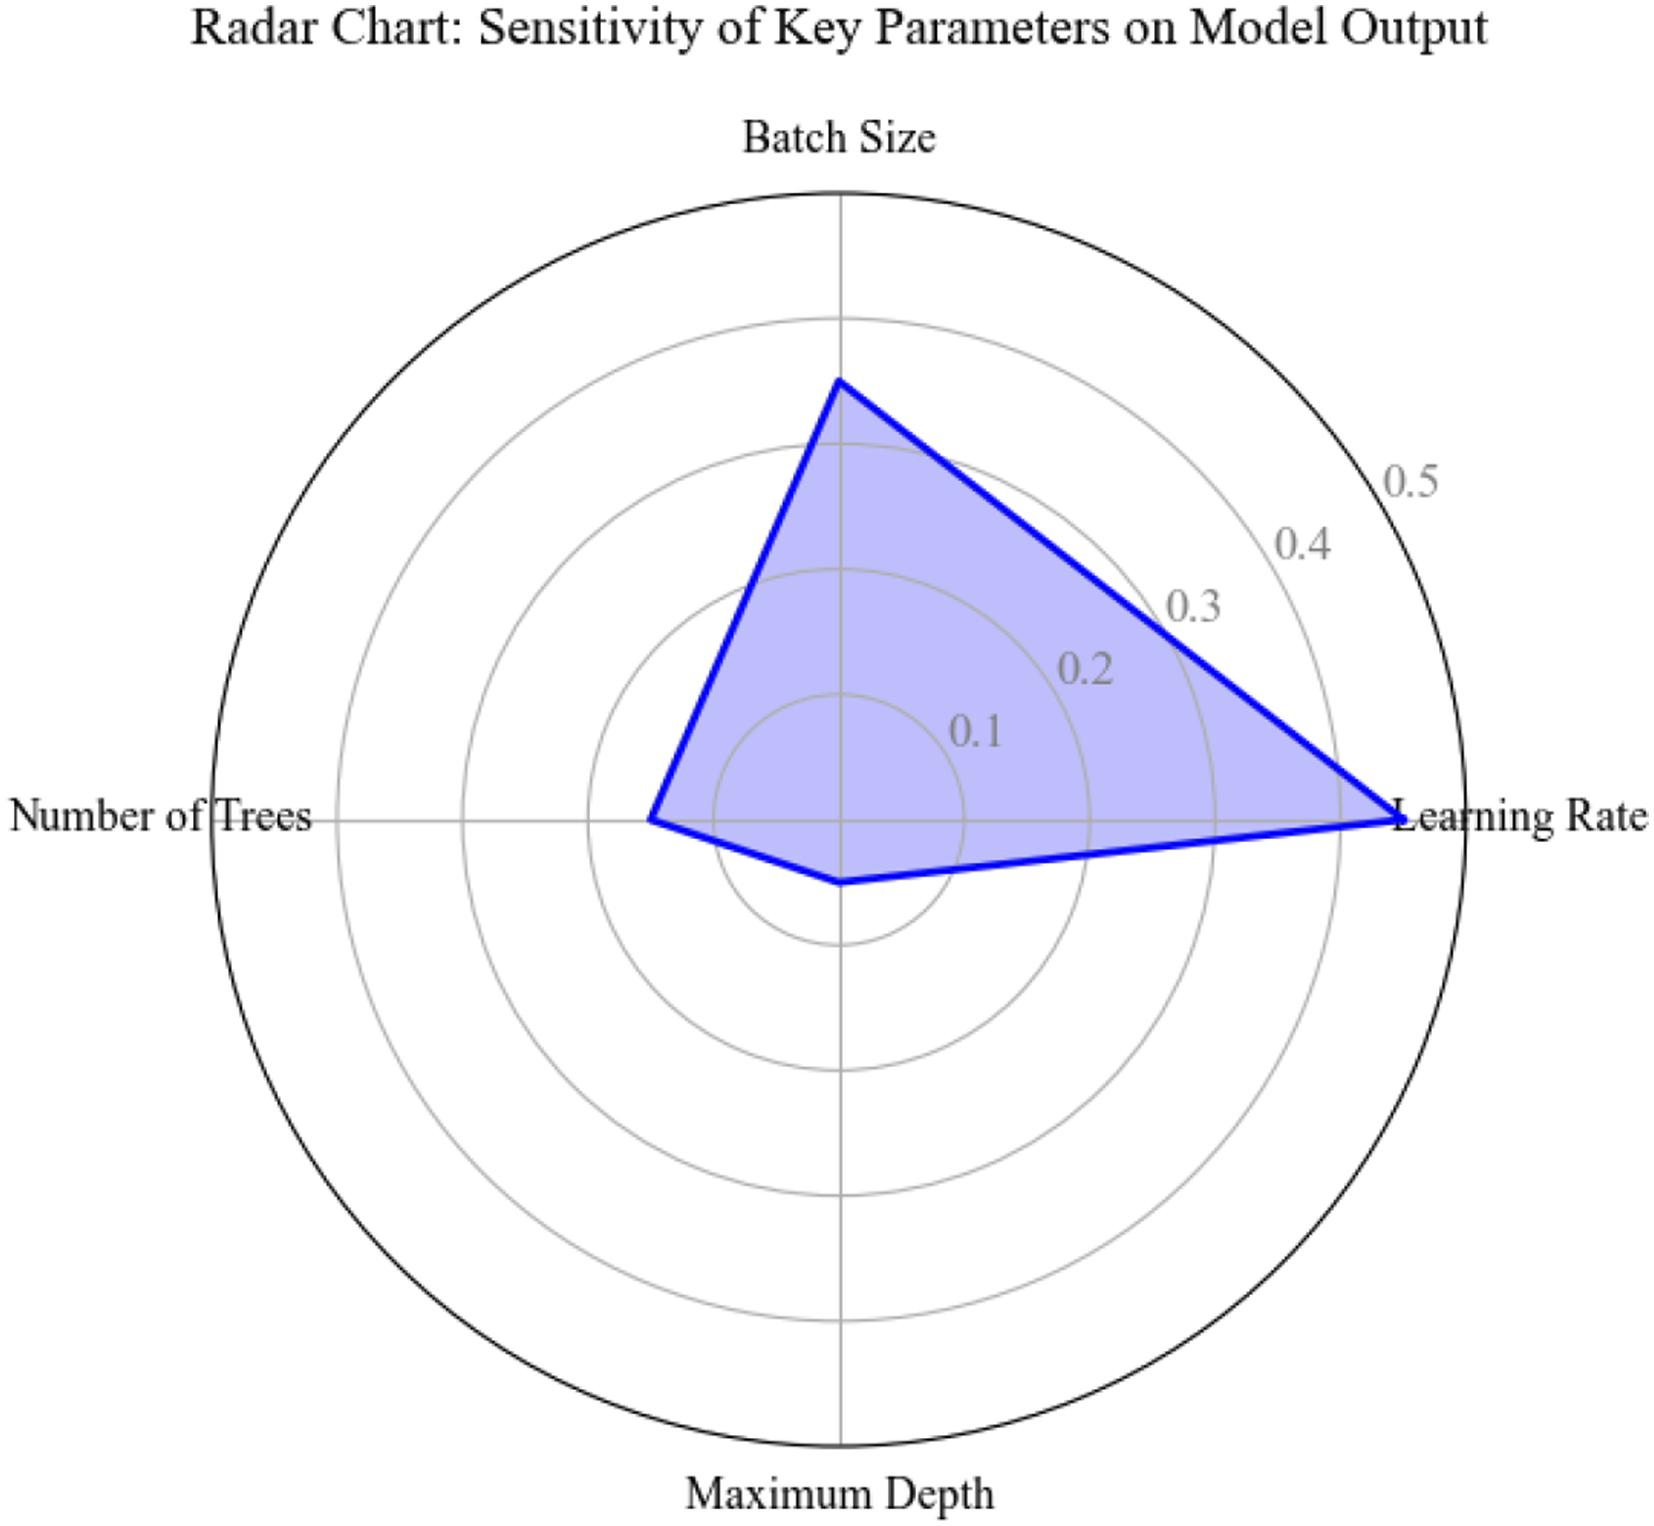
Figure 6 shows that the maximum impact of learning rate and batch size on model output is 0.45 and 0.35, respectively. The learning rate determines the convergence speed and error, and appropriate adjustment can reduce the prediction error. The batch size affects the stability and accuracy of training, and the moderate value improves the overall performance. The number and maximum depth of trees have relatively little effect. According to this result, priority should be given to adjusting the learning rate and batch size when optimizing parameters.
Contribution of different parameters.
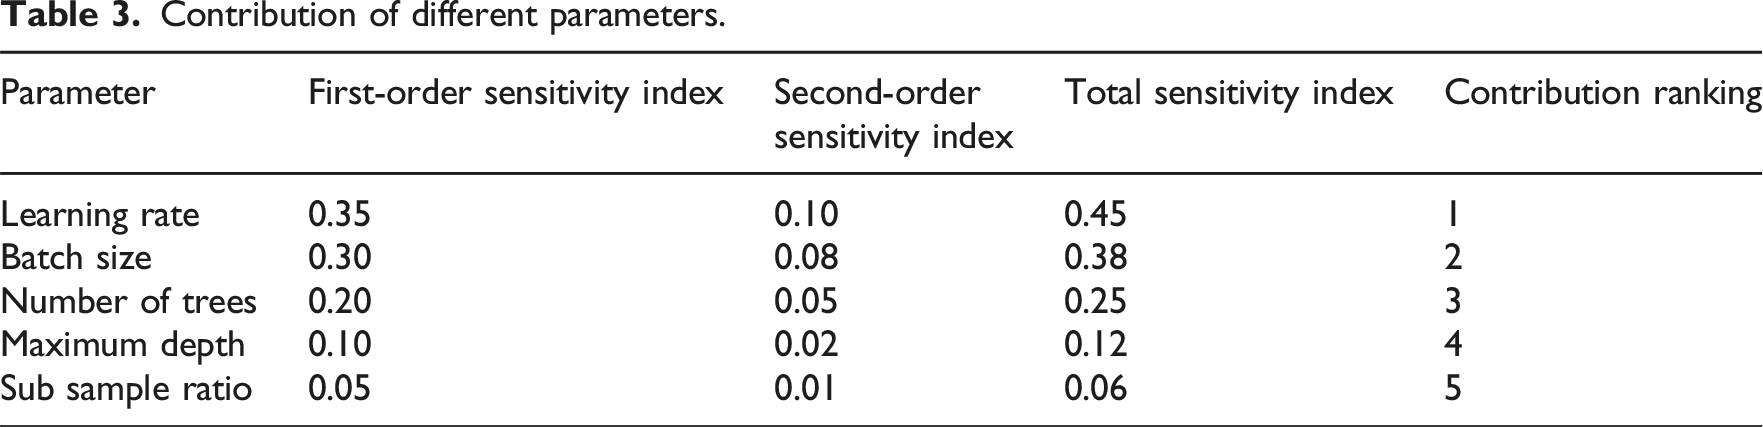
From Table 3, it can be seen that the learning rate and batch size are the two parameters that have the greatest impact on the prediction performance of the model, with the highest first-order sensitivity index of 0.35 and 0.30, and the total sensitivity index of 0.45 and 0.38, respectively. Their contribution ranking is the first and the second, respectively. The number of trees and maximum depth have a secondary impact on the model. Although their first-order and second-order sensitivity indices are low, they still need to be considered. The ratio of sub samples has the smallest impact on model performance, with a total sensitivity index of only 0.06 and ranking last in contribution. These results indicate that when optimizing the project cost model, priority should be given to adjusting the learning rate and batch size to achieve optimal prediction performance.
Migration capability analysis
In order to verify the applicability of the NSGA-II algorithm in different types and scales of engineering projects, this paper conducted a study on the model transfer capability. Multiple types of engineering projects (such as residential, commercial, and industrial) and different scales of engineering projects (such as small, medium, and large projects) were selected as test cases. The optimized model was applied to projects of different types and scales, and its predictive ability in different projects was evaluated using the same evaluation metrics (MSE, MAE, and R2) as described above, as shown in Figure 7. Analysis of the migration capability of NSGA-II algorithm in projects of different types and sizes.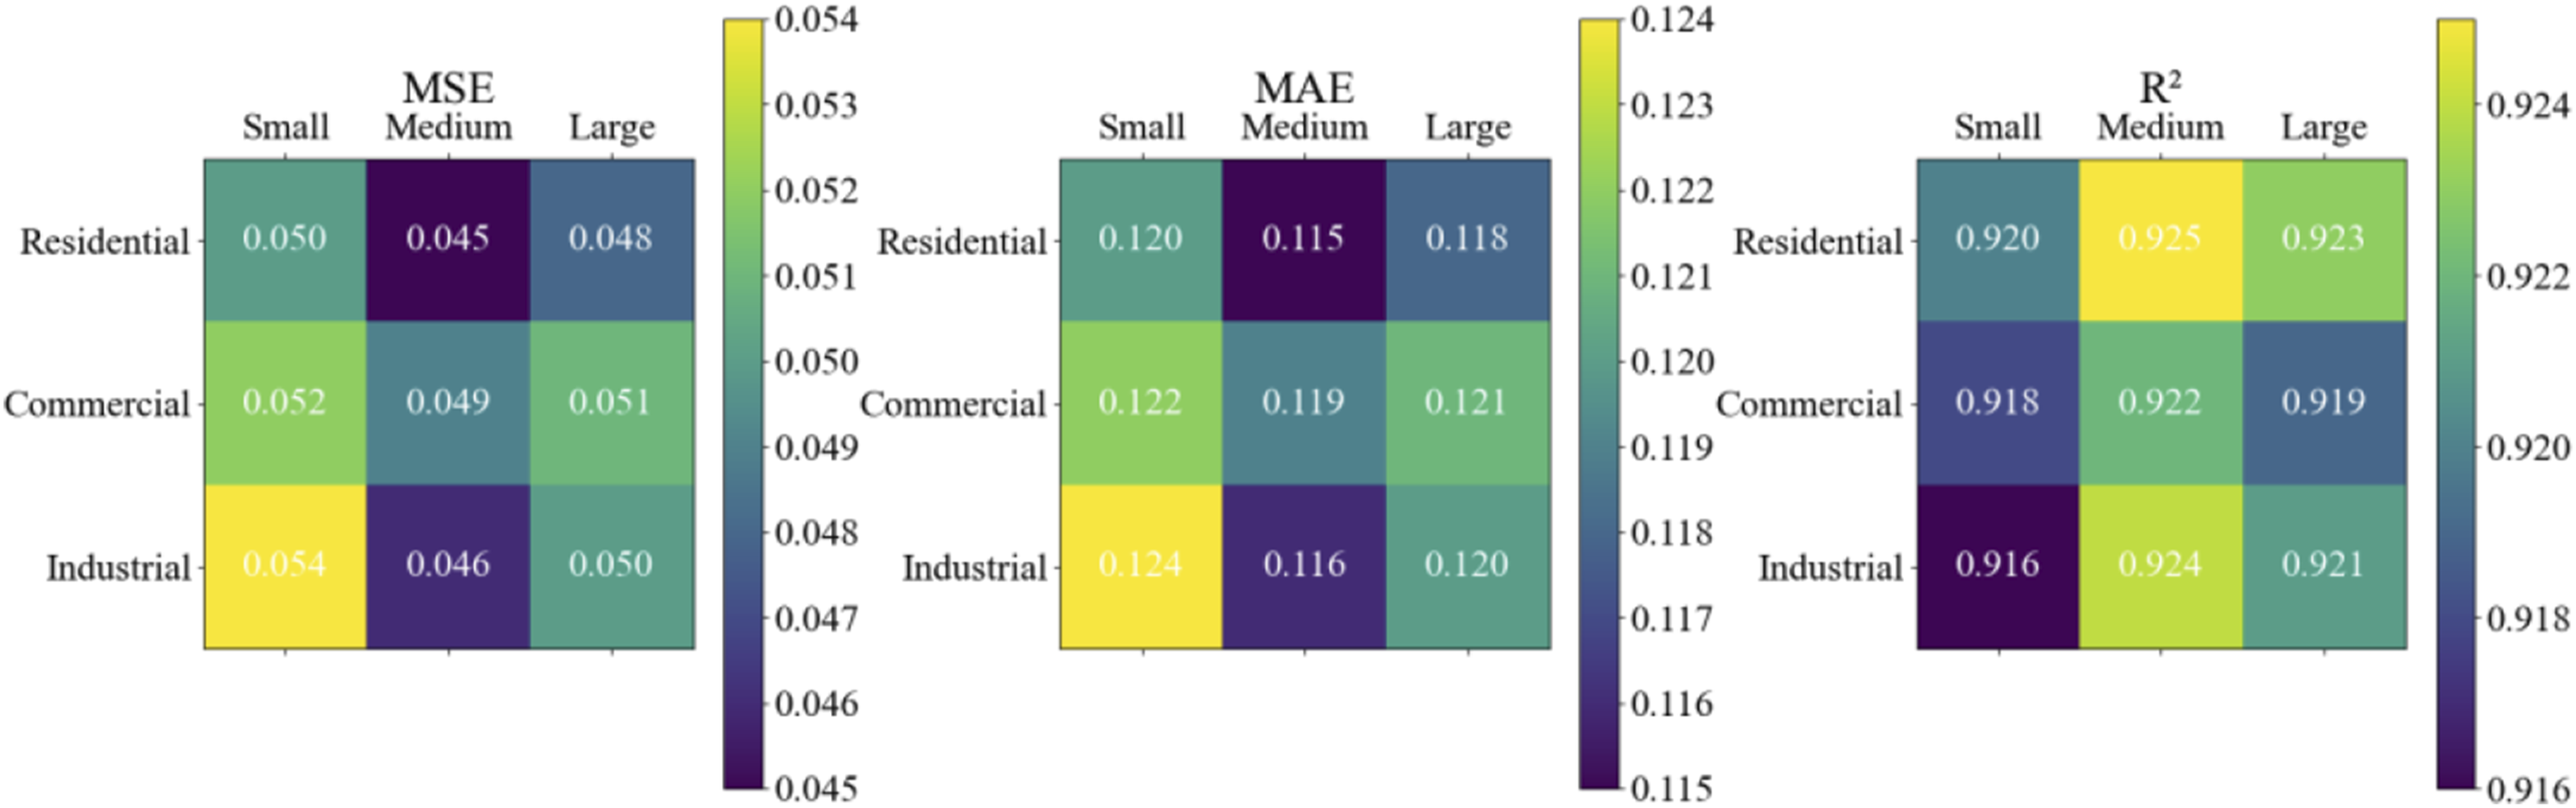
The experimental results show that the MSE values of the model in residential projects are 0.050 (small), 0.045 (medium), and 0.048 (large), respectively, demonstrating high prediction accuracy. The MAE values in commercial projects are 0.122 (small), 0.119 (medium), and 0.121 (large), indicating that the model has consistent prediction errors at various scales. The R2 values in industrial projects are 0.916 (small), 0.924 (medium), and 0.921 (large), indicating that the model has a high predictive fit in projects of different scales. Experimental data shows that the optimized engineering cost model exhibits reasonable fluctuations in indicators such as MSE, MAE, and R2 across different types and scales of engineering projects. This indicates that the model has good transferability and can be effectively applied in engineering projects of different types and scales.
Comparison before and after parameter optimization
Before parameter optimization, there is a certain degree of error in the performance of the project cost prediction model, mainly reflected in the large deviation between the predicted value and the actual value. By optimizing the model parameters, the prediction accuracy of the model is improved. Under the guidance of multi-objective optimization, the optimized model not only improves the accuracy of prediction but also considers the robustness and generalization ability of the model. The comparison between the predicted value and the actual value of the project cost before and after the parameter optimization is shown in Figure 8. Comparison of project cost prediction before and after parameter optimization.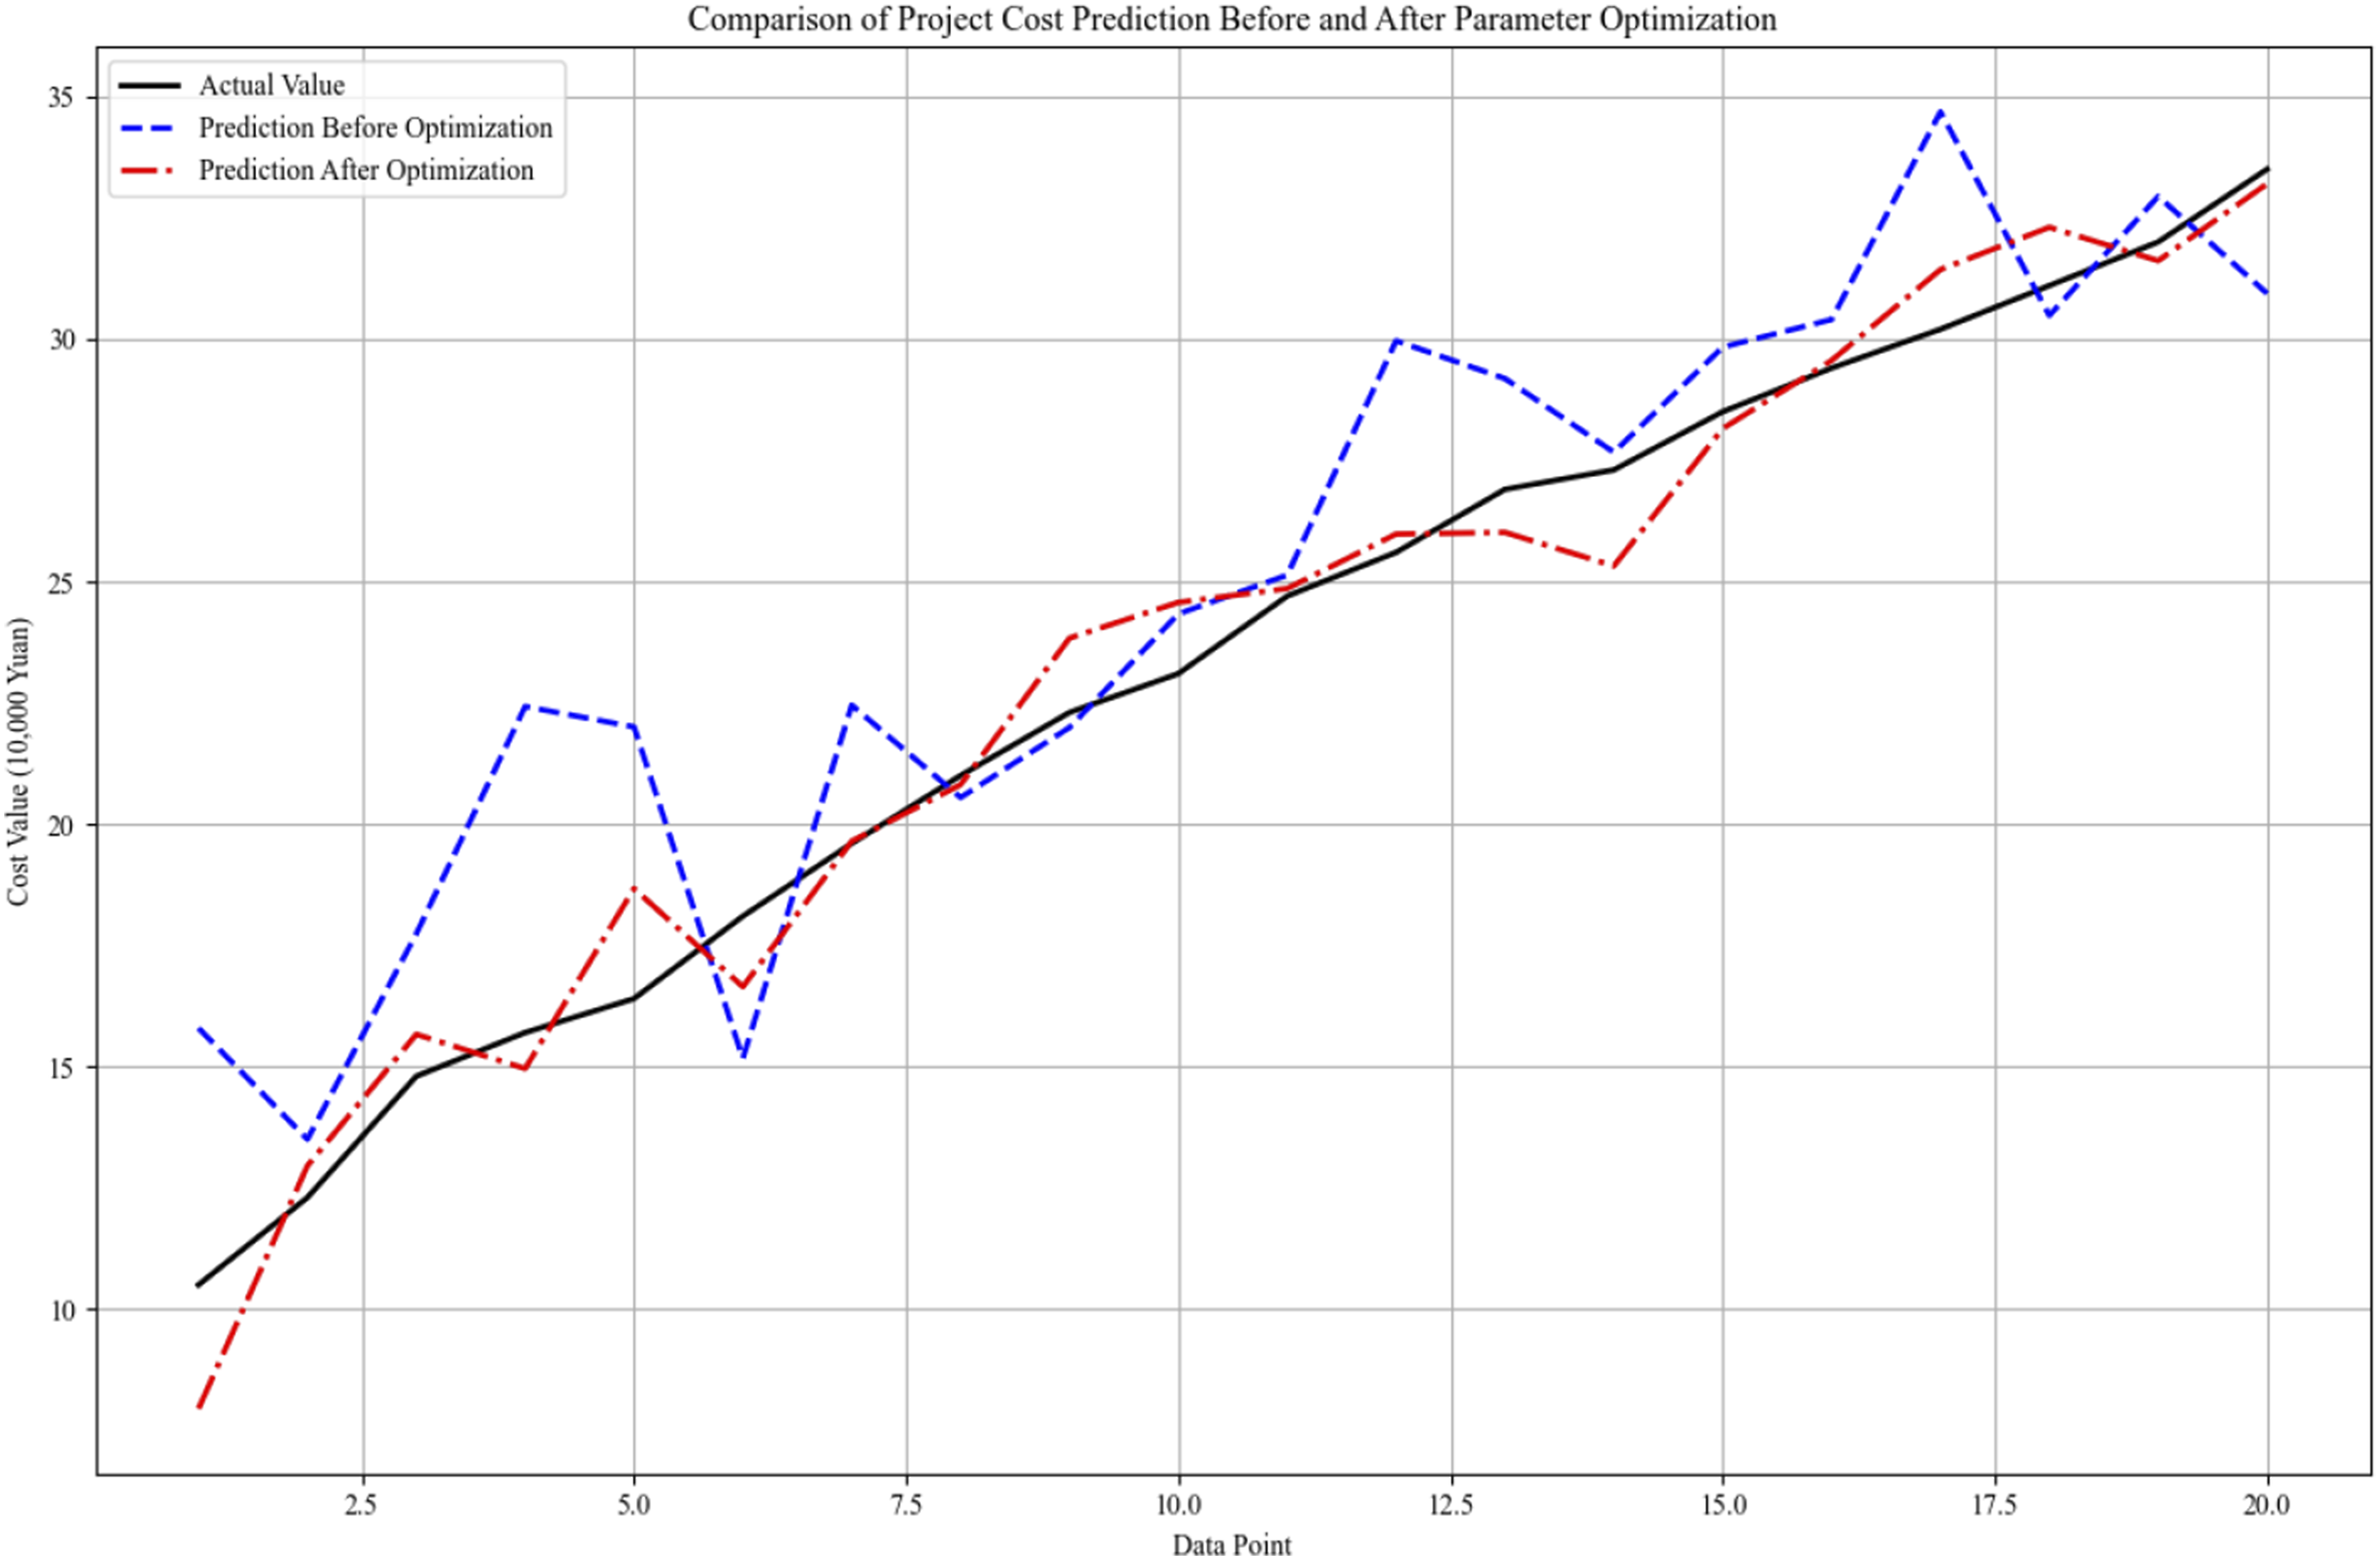
Figure 8 shows that before optimization, the model has significant deviation on sample data points 1, 4, 6, 7, 12, and 17, and the prediction ability is insufficient. After NSGA-II algorithm optimization, the model is highly consistent with the actual value, and the prediction error is reduced, showing stronger generalization ability and prediction stability. This proves the effectiveness of NSGA-II algorithm in model parameter optimization.
Uncertainty analysis of experimental results
Conducting uncertainty analysis on the predicted results of the model is a key step in evaluating its reliability. This article conducted residual analysis, calculated the residual between the predicted value of the model and the actual value, and drew a residual graph to observe the distribution of the residual, as shown in Figure 9. Residual plot.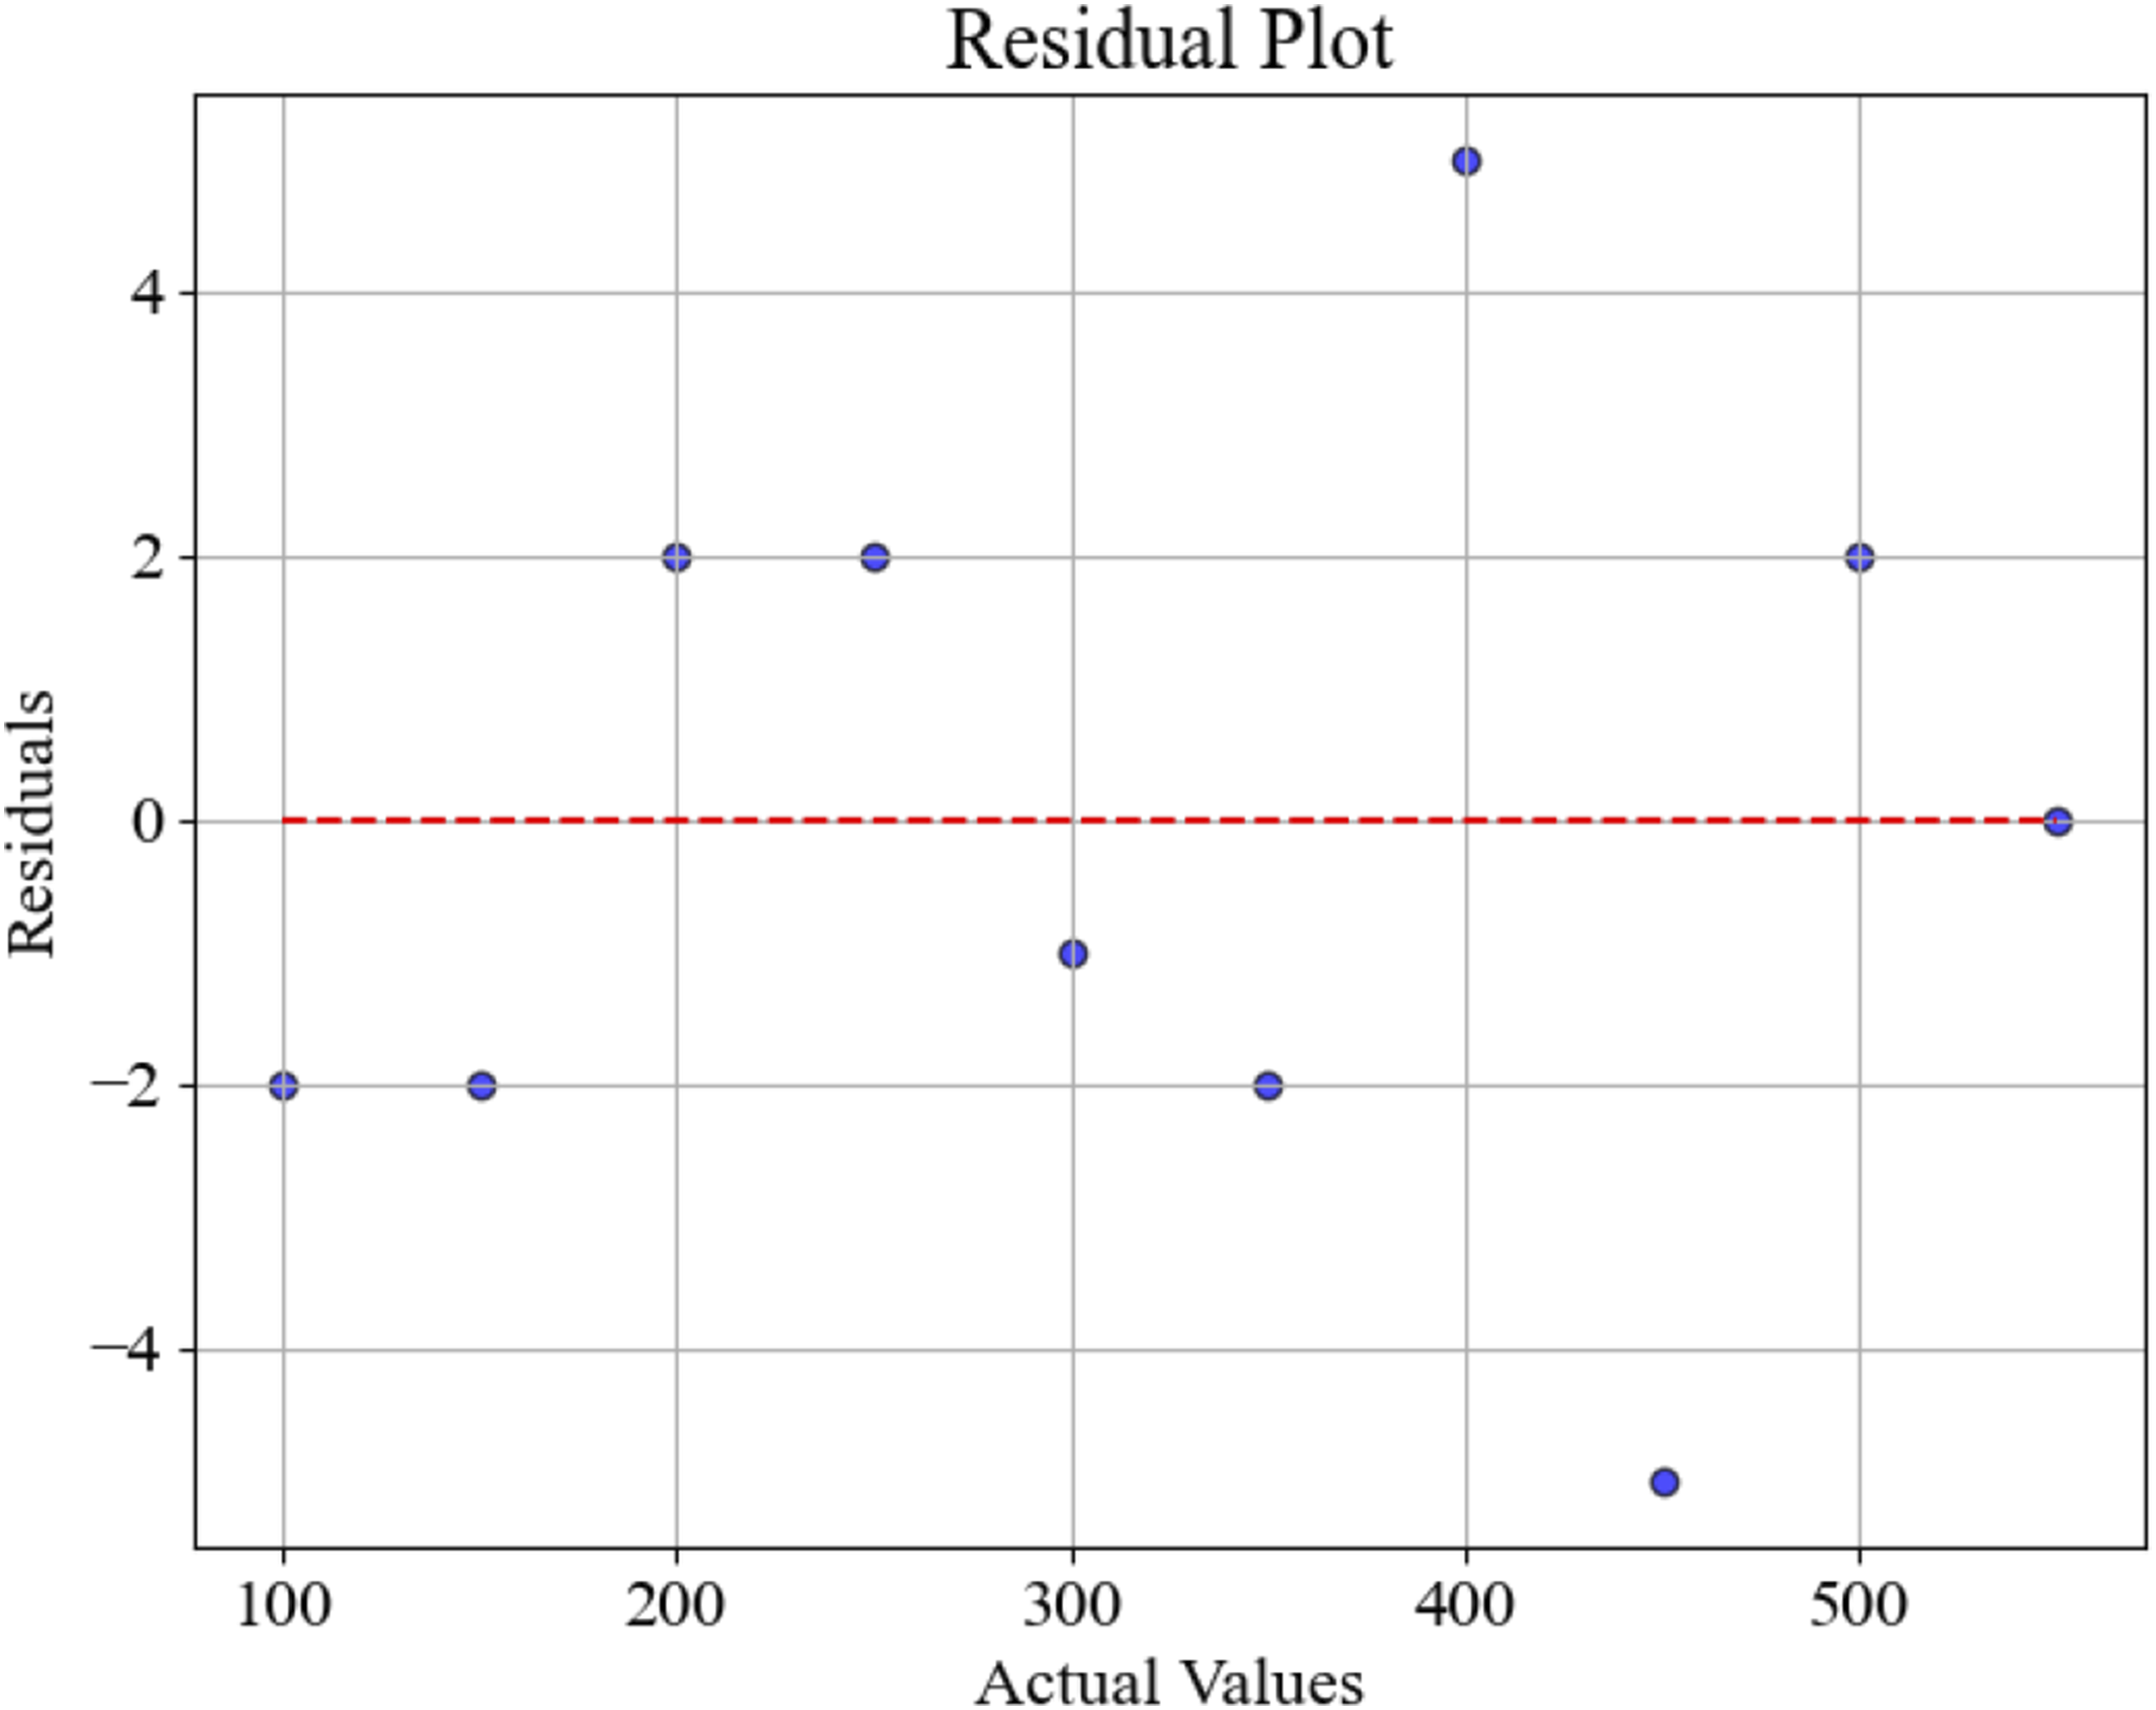
In Figure 9, the horizontal axis represents the actual value, the vertical axis represents the residual, and the red dashed line is the reference line with zero residual. The standard deviation of the residuals is 0.05, and the MSE is 0.042. The analysis results show that the residual distribution is relatively uniform, with no obvious systematic bias, and most of the residuals are close to zero, indicating that the model’s prediction results are relatively accurate.
Using Monte Carlo simulation method, a large number of samples are generated by randomly sampling the input variables of the model and running the model to obtain corresponding prediction results, in order to evaluate the uncertainty of the model’s prediction results. 1000 samples can be generated based on the probability distribution of input variables, and the model can be run to record the predicted results of each sample. The standard deviation and confidence interval of these predicted results can be calculated. The simulation results show that the standard deviation of the predicted results is 0.12, and at a 95% confidence level, the range of the predicted results is [0.88, 1.12], indicating that the model’s predicted results have high reliability. In order to further evaluate the stability of the model, the Bootstrap method was used to perform multiple samples with replacement on the original data, generate multiple datasets, and train the model and predictions on each dataset. Statistically analyzing these prediction results and calculating the standard deviation and confidence interval, the results showed that the standard deviation of the prediction results was 0.11, and the 95% confidence interval was [0.89, 1.11], verifying the reliability of the model’s prediction results. The Sobol sensitivity analysis method can be used to decompose the variance of input variables through sensitivity analysis and calculate the first-order and total sensitivity indices of each input variable. The results showed that learning rate and batch size were the two parameters that had the greatest impact on the model’s predictive performance, with total sensitivity indices of 0.45 and 0.38, respectively. By comparing the performance of the optimized model before and after parameter optimization, it was found that the predicted values of the optimized model on the sample data points were highly consistent with the actual values, and the prediction error was significantly reduced, demonstrating stronger generalization ability and prediction stability. This proves the effectiveness of the NSGA-II algorithm used in model parameter optimization.
Model robustness testing
This article tests the robustness of the model under different conditions and evaluates its performance in the face of various uncertain factors. Multiple representative engineering project data can be selected to conduct interference tests on different input variables. By introducing varying degrees of random noise, the changes in the model’s prediction results can be observed. The experiment shows that even in the presence of fluctuations in input data, the optimized model can still maintain high prediction accuracy and demonstrate strong anti-interference ability, as shown in Figure 10. Comparison of MSE under baseline and disturbance conditions for different projects.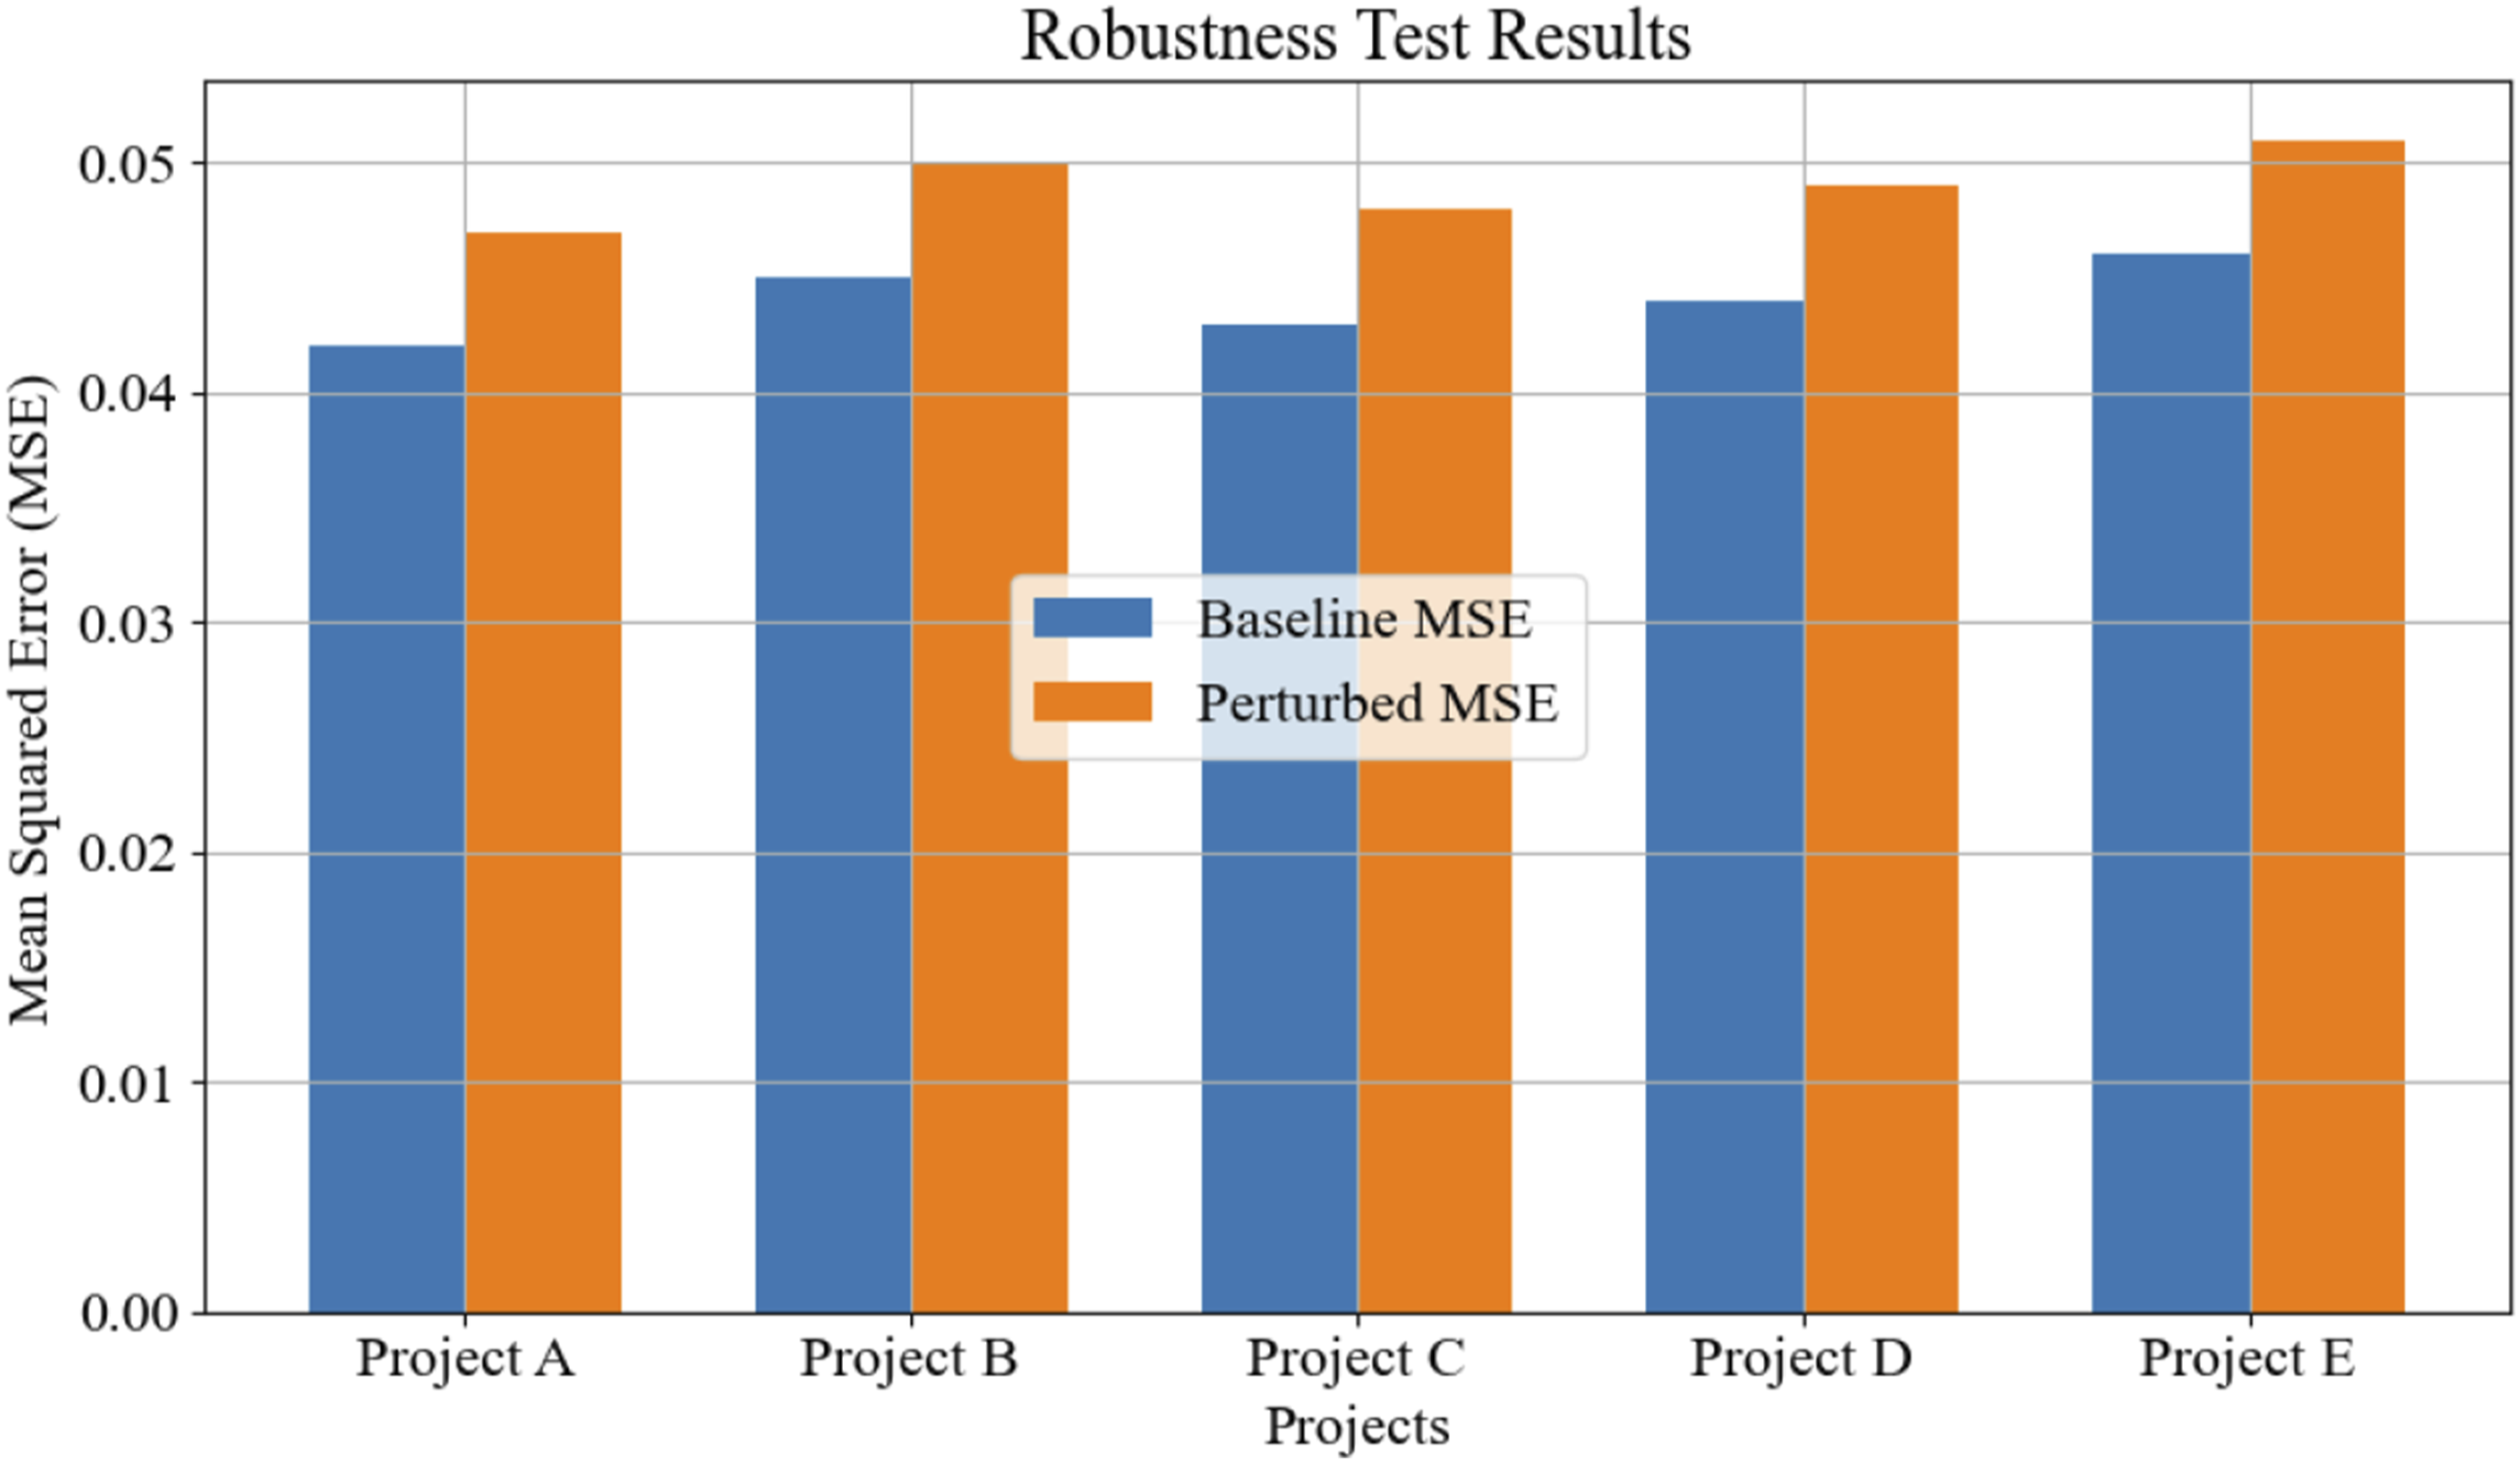
Figure 10 shows that under baseline and disturbance conditions, the MSEs of five different engineering projects are 0.042, 0.045, 0.043, 0.044, and 0.046, as well as 0.047, 0.050, 0.048, 0.049, and 0.051, respectively. The MSE value under perturbation conditions is slightly higher than that under baseline conditions, but the difference is not significant, indicating that the model can still maintain high prediction accuracy in the presence of input data fluctuations. The MSE value variation of each project under two conditions is approximately 0.005, demonstrating the strong anti-interference ability and stability of the model. The optimized model performs consistently in projects of different types and scales, verifying its effectiveness and applicability in multi-objective balancing processing.
This is mainly attributed to the effective handling of multi-objective balance by the NSGA-II algorithm in the optimization process, which enables the model to fit the data well under various input conditions. Through statistical analysis of the prediction results of different engineering projects, it was found that the optimized model maintained a small range of prediction errors in different projects, and the error distribution was uniform, indicating that the model has good robustness. When faced with engineering projects of different types and scales, the model’s prediction results remain stable without significant deviations. The stability of the model was further verified through residual analysis and sensitivity index calculation. The experimental results showed that even in the case of significant changes in input parameters, the predictive performance of the model is still reliable and can effectively cope with various complex situations in practical applications. The robustness test results not only verify the applicability of the model under different conditions but also provide important basis for further optimization of the model.
Conclusion
In the decision-making phase of construction projects, efficient and accurate cost prediction is essential to ensure smooth project execution. Historically, cost prediction models based on various mathematical methods have often underperformed in terms of predictive accuracy. To address this issue, this paper proposes a parameter optimization method for engineering cost models using the NSGA-II algorithm and sensitivity analysis within a big data context to enhance prediction accuracy and reliability. Through a review of existing literature, the primary factors influencing project costs are identified and used as the input variables for the model. The Sobol sensitivity analysis method is then employed to pinpoint the key parameters, with Monte Carlo simulations generating a large dataset of input samples. First-order and total sensitivity indices for each variable are calculated to assess their impact on the model’s output.
The NSGA-II algorithm is subsequently applied to optimize parameter settings and evaluate the model’s predictive performance and computational cost under various parameter combinations. Experimental results demonstrate that the optimized model exhibits high accuracy and robustness, with MSE, MAE, and R2 values reaching 0.042, 0.15, and 0.928, respectively. Further comparison of the optimized NSGA-II model with traditional Grid-SVM and BP neural network models confirms its superior prediction capability, even when applied to project data outside the existing cost database platform. As project cost data continues to accumulate, the NSGA-II algorithm model will receive increasing data support, further enhancing its applicability and precision. Overall, the proposed parameter optimization method based on the NSGA-II algorithm and sensitivity analysis shows significant potential and practical value for project cost modeling in the era of big data.
Footnotes
Funding
The author received no financial support for the research, authorship, and/or publication of this article.
Declaration of Conflicting Interests
The author declared no potential conflicts of interest with respect to the research, authorship, and/or publication of this article.