




Abstract
This article uses long short-term memory (LSTM) to capture the dynamic changes of learners during the learning process, improve the modeling ability of learners’ learning trajectories, and generate personalized learning suggestions and feedback. This article collects learning data from 8 learners from March to June 2020, including characteristics such as learning duration, learning frequency, and learning performance. LSTM model is adopted to model and predict these time series data. To validate the effectiveness of the model, the model is evaluated using evaluation indicators such as mean absolute error (MAE), root mean squared error (RMSE), and coefficient of determination (R2) and is compared with Transformer, Gated Recurrent Unit (GRU), recurrent neural network (RNN), and Hidden Markov Model (HMM). The experimental results show that the MAE, RMSE, and R2 of LSTM’s prediction of English learning performance are 0.08, 0.06, and 0.98, respectively, and the MAE, RMSE, and R2 of LSTM’s prediction of English learning duration are 0.09, 0.10, and 0.97, respectively. The prediction error of LSTM is lower than that of Transformer, GRU, RNN, and HMM, and this maintains high stability in the prediction of 8 learners. Visual analysis of learning trajectories shows that some learners exhibit intermittent learning states with significant fluctuations in learning performance, while others tend to stabilize after a significant increase in performance at specific stages, indicating that their learning strategies are effective in the early stages but then enter a learning bottleneck period. Some learners exhibit a decline in performance, suggesting that their current learning strategies are ineffective. This article highlights the advantages of the LSTM model in predicting English learning outcomes. By dynamically analyzing learners’ progress and trajectories, the model enables the development of personalized and targeted learning recommendations, helping learners refine and optimize their strategies for improved performance.
Keywords
Introduction
In today’s society, English1,2 has an important position as a global language. With the acceleration of globalization and the increasing international exchanges, English has become one of the necessary skills for many people. Traditional teaching methods for learning English are usually classroom-based and teacher-centered, and students passively accept knowledge. This one-size-fits-all approach to teaching fails to adequately meet students’ individual needs and often leads to poor learning performances. If attention can be paid to the learning process and behaviors of learners, personalized learning support and suggestions can be provided for learners through in-depth analysis of their learning data. Therefore English learning trajectory analysis has become a research hotspot. By analyzing learners’ learning data, their learning behaviors and learning patterns can be revealed, providing data support for personalized learning. In English learning, learners’ learning behaviors and learning patterns change over time, but the traditional method of English learning trajectory analysis has problems such as static modeling, lack of personalization, and untimely feedback, so it needs to be improved and optimized with the help of advanced technical means. Constructing a dynamic learning trajectory model using long short-term memory (LSTM)3,4 neural networks can help provide personalized learning support and suggestions based on learners’ individual needs. Through in-depth analysis of their learning characteristics and learning patterns, learning plans can be tailored for learners to improve their efficiency and outcomes of English learning. Deep learning models mainly rely on their ability to capture sequential data in time series data processing. Especially, long short-term memory networks effectively solve the long-term dependency problem in traditional RNN through their gating mechanism, enabling them to capture long-term relationships in data. Convolutional neural networks can effectively handle short-term fluctuations in time series by extracting local features. The Transformer model combined with self-attention mechanism further enhances the modeling ability of remote dependencies in sequences and improves the processing efficiency of time series data.
The designed LSTM model includes an input layer, multiple LSTM hidden layers, and an output layer. By visualizing the learning trajectory, it is possible to analyze the learning patterns and behavioral characteristics of learners, identify key nodes and trends in the learning process. By applying the LSTM model to the prediction of English learning performance and duration, its superiority in processing time series data is verified, significantly improving the accuracy and stability of predictions. The results of learning trajectory analysis can generate personalized learning feedback to help learners optimize their learning strategies. This article reveals the changing patterns of academic performance through the visualization of learning trajectories, providing a solid foundation for the generation of personalized learning suggestions. The LSTM model has enormous potential in educational data analysis and can provide valuable reference and guidance for the further application of deep learning models in the field of education.
Related work
Learning trajectory analysis aims to provide data support for personalized learning by mining and analyzing learners’ behavioral data in the learning process to reveal their learning behaviors and patterns. Early learning trajectory5,6 analysis mostly relied on simple statistical methods, such as frequency analysis and regression analysis. These methods are able to reveal some basic learning behavior characteristics, but they are unable to mine deeper into the complex patterns and dynamic changes that exist in the learning process. With the increasing amount of educational data and advances in analysis, more and more studies have begun to analyze learning trajectories using machine learning and data mining techniques. For example, Zhang Hai 7 proposed a framework for educational data mining and learning analysis, emphasizing the importance of data in education. By summarizing the main methods and applications of educational data mining,8,9 multiple factors need to be considered in learning trajectory analysis. In recent years, the application of time series analysis 10 methods in learning trajectory analysis has gradually increased. Time series analysis methods are able to deal with time-dependent learning behavior data and reveal dynamic changes in the learning process. Zhang Jiahua 11 studied learners’ behaviors on an online learning platform using time series analysis and found that learners’ learning behaviors have obvious time-dependent and stage-specific characteristics. However, these methods often suffer from high computational complexity and difficult optimization of model parameters when dealing with long-time series data.
LSTM neural network as a special kind of recursive neural network has significant advantages in processing time series data. LSTM is used to solve the gradient vanishing and exploding problems of traditional recursive neural networks in long series data. In recent years, LSTM12,13 has been widely used in various fields, including natural language processing, speech recognition, and financial data prediction. In the field of education, the application of LSTM is also gradually increasing. Wang Minghu 14 used LSTM to predict learners’ learning behaviors and achieved good results. Liu Hanqiang 15 applied LSTM to predict students’ learning performance on a MOOC (massive open online courses) platform, which verified the potential of LSTM in educational data analysis. LSTM has also been used in learning path recommendation and personalized learning16,17 to support the development of personalized learning. and other applications. It has significant advantages in processing complex and dynamic learning behavior data, and can provide strong support for personalized learning. However, there is still limited research on the application of LSTM in English learning trajectory analysis, and further exploration and practice are urgently needed. The application of deep learning in the field of education is rapidly expanding. Currently, deep learning technology is used in personalized learning recommendations, automated assessments, and intelligent tutoring systems. By analyzing learner data, deep learning models can provide tailored learning paths and feedback to enhance learning outcomes. Meanwhile, image recognition and natural language processing technologies are gradually being applied in education, such as automatic grading systems and interactive learning tools. In the future, deep learning can play a greater role in fields such as educational data analysis, learning behavior prediction, and virtual reality classrooms, further promoting innovation and development in educational technology.
Method
Collection of English learning data
In order to analyze the English learning trajectory of learners, this article obtains data from 8 learners on an online learning platform. The time range for data collection is from March 1, 2022 to June 30, 2022, with data collected once a day. The collected data includes collection time, learning content, learning performance, learning duration, and learning frequency.
8 learners are randomly selected and it should be ensured that they agree to record learning data daily during the learning period. Their learning data is collected at 23:59 every day. The collected data is organized into a unified format for easy subsequent analysis, and the data is saved in a secure database to ensure its integrity and accuracy.
This article uses online learning platform data from 8 learners from March to June 2022, including time series data such as learning duration, learning frequency, and learning performance. The data source is reliable. The collection frequency is recorded once a day to ensure the integrity of the data. Through data preprocessing, the issues of outliers and missing values are resolved, ensuring data quality and providing a solid foundation for subsequent analysis.
Collected data.
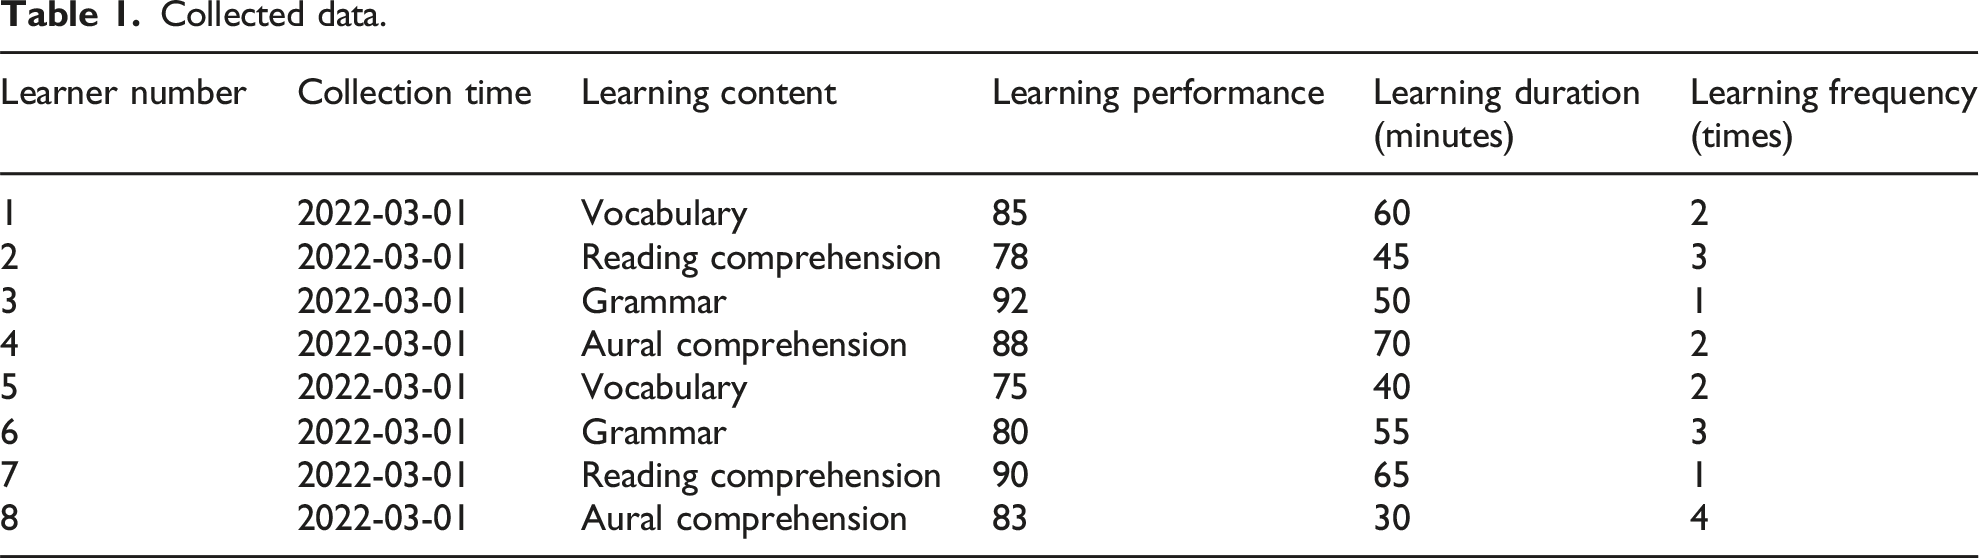
The types of content that learners learn on that day include grammar, vocabulary, reading comprehension, and aural comprehension. Learners receive a daily learning test with a score range of 0–100. The learning frequency is the number of times a learner learns on that day, that is, how many times a learner has completed a learning task that day.
Presentation of learning content.
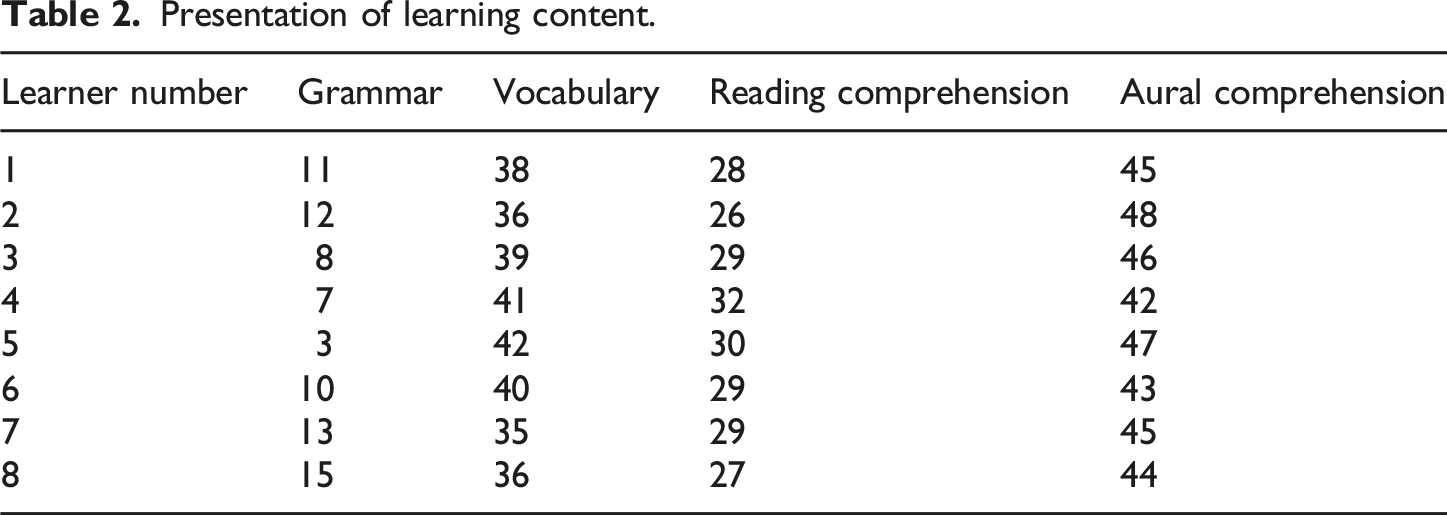
Within 122 days, the 8 learners learned the most about aural comprehension, followed by the vocabulary. Learners have the least amount of time to learn grammar. By collecting English learning data, learners’ learning progress can be tracked in real time, and their learning status can be timely understood, including what knowledge points they have mastered and what they need to strengthen.
Data preprocessing
The data obtained directly from online learning platforms may have outliers,18,19 missing values,20,21 etc. Data preprocessing is used to ensure the quality and availability of the data. The content of data preprocessing includes processing abnormal data and missing values.
Abnormal data refers to data points that do not match most of the data, which are caused by recording errors or other abnormal situations on online learning platforms. The data can be visualized by drawing box-plots, and once outliers are found, whether these data are truly outliers rather than real data is confirmed. The outliers are further analyzed, and their relationship is compared with other data to confirm the rationality of the outliers.
Outliers are replaced with the average of the data, and the formula for calculating the average of the data is:
The results of abnormal data processing are shown in Figure 1. Results of abnormal data processing. (a) Data before processing outliers. (b) Data after processing outliers.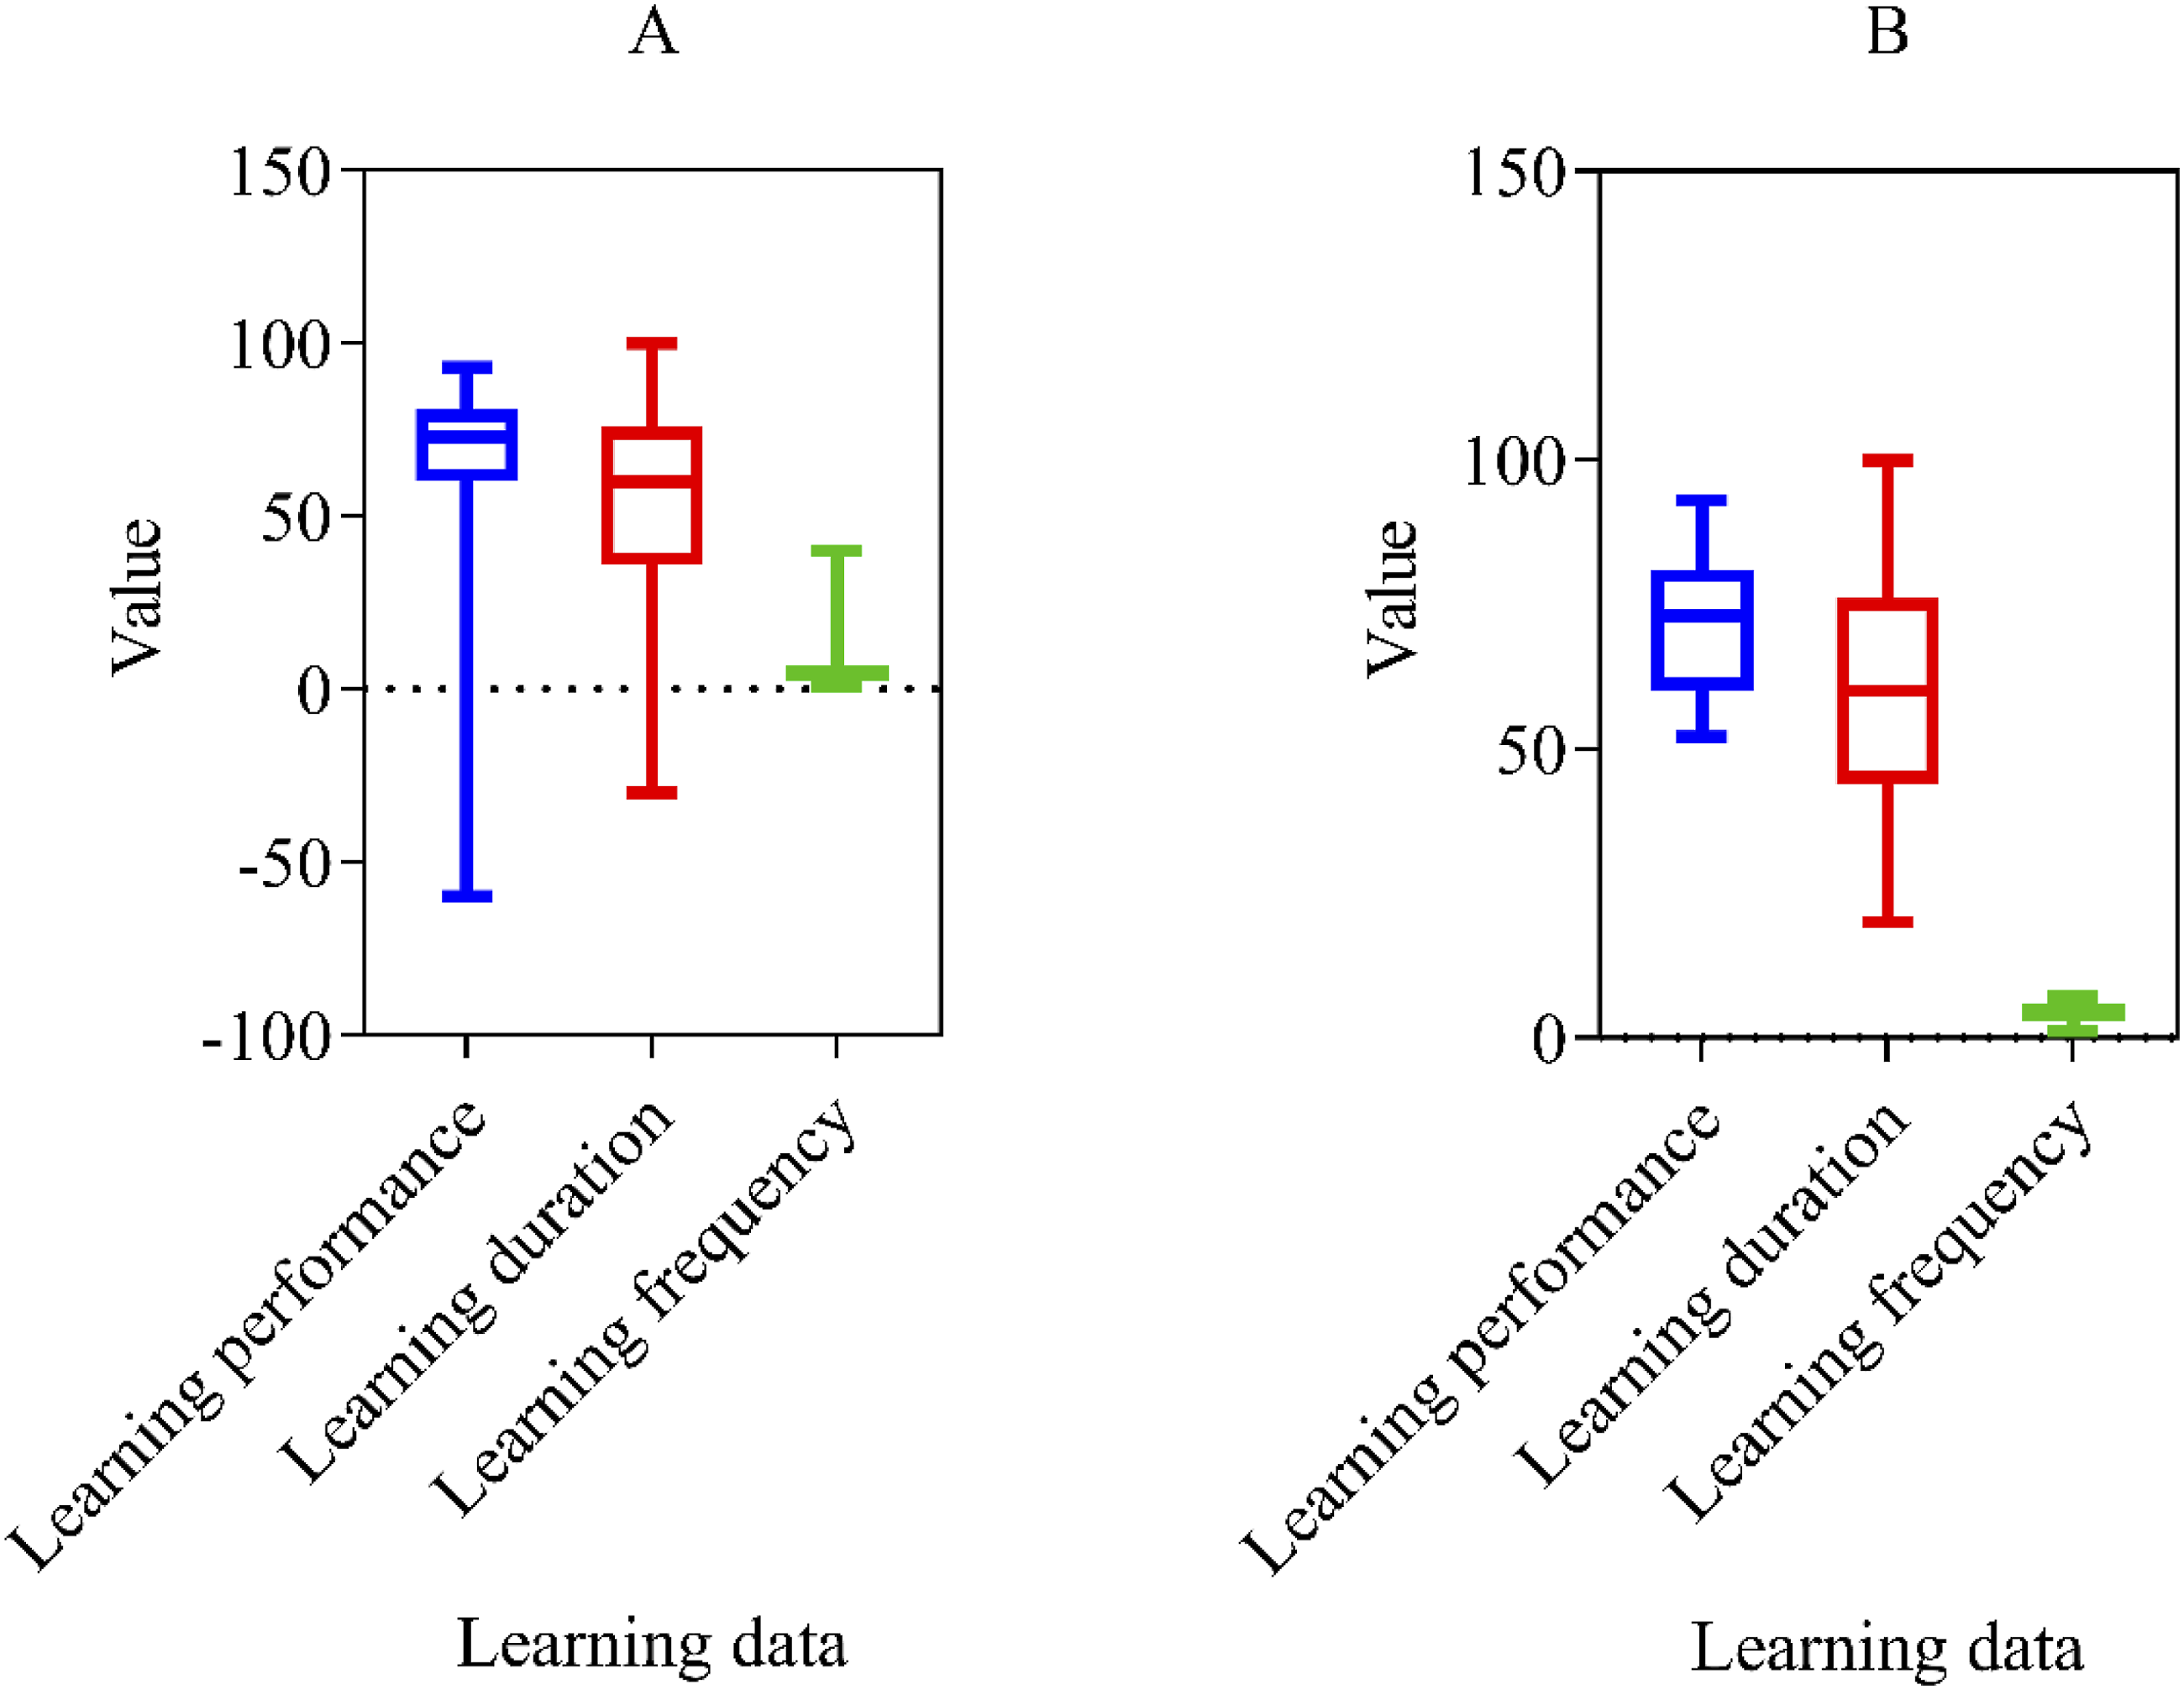
In Figure 1(a), the learning performance, learning duration, and learning frequency data before outlier processing are shown. The box-plot shows that some data are abnormal. In the learning performance data, the minimum value is −60, which is not within the normal range of learning performance. The learning duration data cannot be negative, and the learning frequency cannot reach 40 times. Figure 1(b) shows the results after data outlier processing. By replacing the outlier data with the average value of the data, the entire collected data can reach a reasonable range, ensuring the accuracy of data analysis.
Missing values refer to situations where values in a dataset are missing or empty. Missing values need to be detected and the cause of the missing values should be determined. The average of the two digits before and after the missing value is used for filling. The formula for calculating the filling number is:
If 

Data preprocessing includes data cleaning and feature engineering. The data cleaning steps include removing missing values and outliers, and standardizing the data range. In feature engineering, selecting relevant features and constructing new features are key to improving model performance by analyzing the importance and correlation of features. In addition, dataset partitioning and cross-validation are also important steps to ensure the model’s generalization ability.
Model training and evaluation
The process of English learning22,23 is continuous and long-term, and LSTM can capture and learn long-term dependency relationships, which is helpful for learning trajectory analysis. In order to analyze the learning trajectory, this article chooses the LSTM neural network model. LSTM24,25 is a special type of recursive neural network suitable for processing and predicting time series data.
In the field of deep learning, common models include convolutional neural networks for image recognition, long short-term memory networks for processing time series data, and generative adversarial networks for generating new data. CNN excels at capturing spatial features. LSTM processes long-term dependencies through memory mechanisms. GAN generates realistic data through adversarial training of generative and discriminative networks. Understanding the basic principles of these models can help in selecting appropriate tools to solve specific problems.
The LSTM26,27 layer is the core part of the model, responsible for processing time series data. The LSTM layer consists of multiple LSTM units, each containing a memory unit and three gates, which can selectively remember or forget information. This article designs three LSTM layers, each containing 64 hidden units.
The output layer is designed according to the specific task requirements. In learning trajectory analysis, the output layer is a fully connected layer that predicts future learning performances, etc.
The LSTM model used in this article is shown in Figure 2. LSTM model.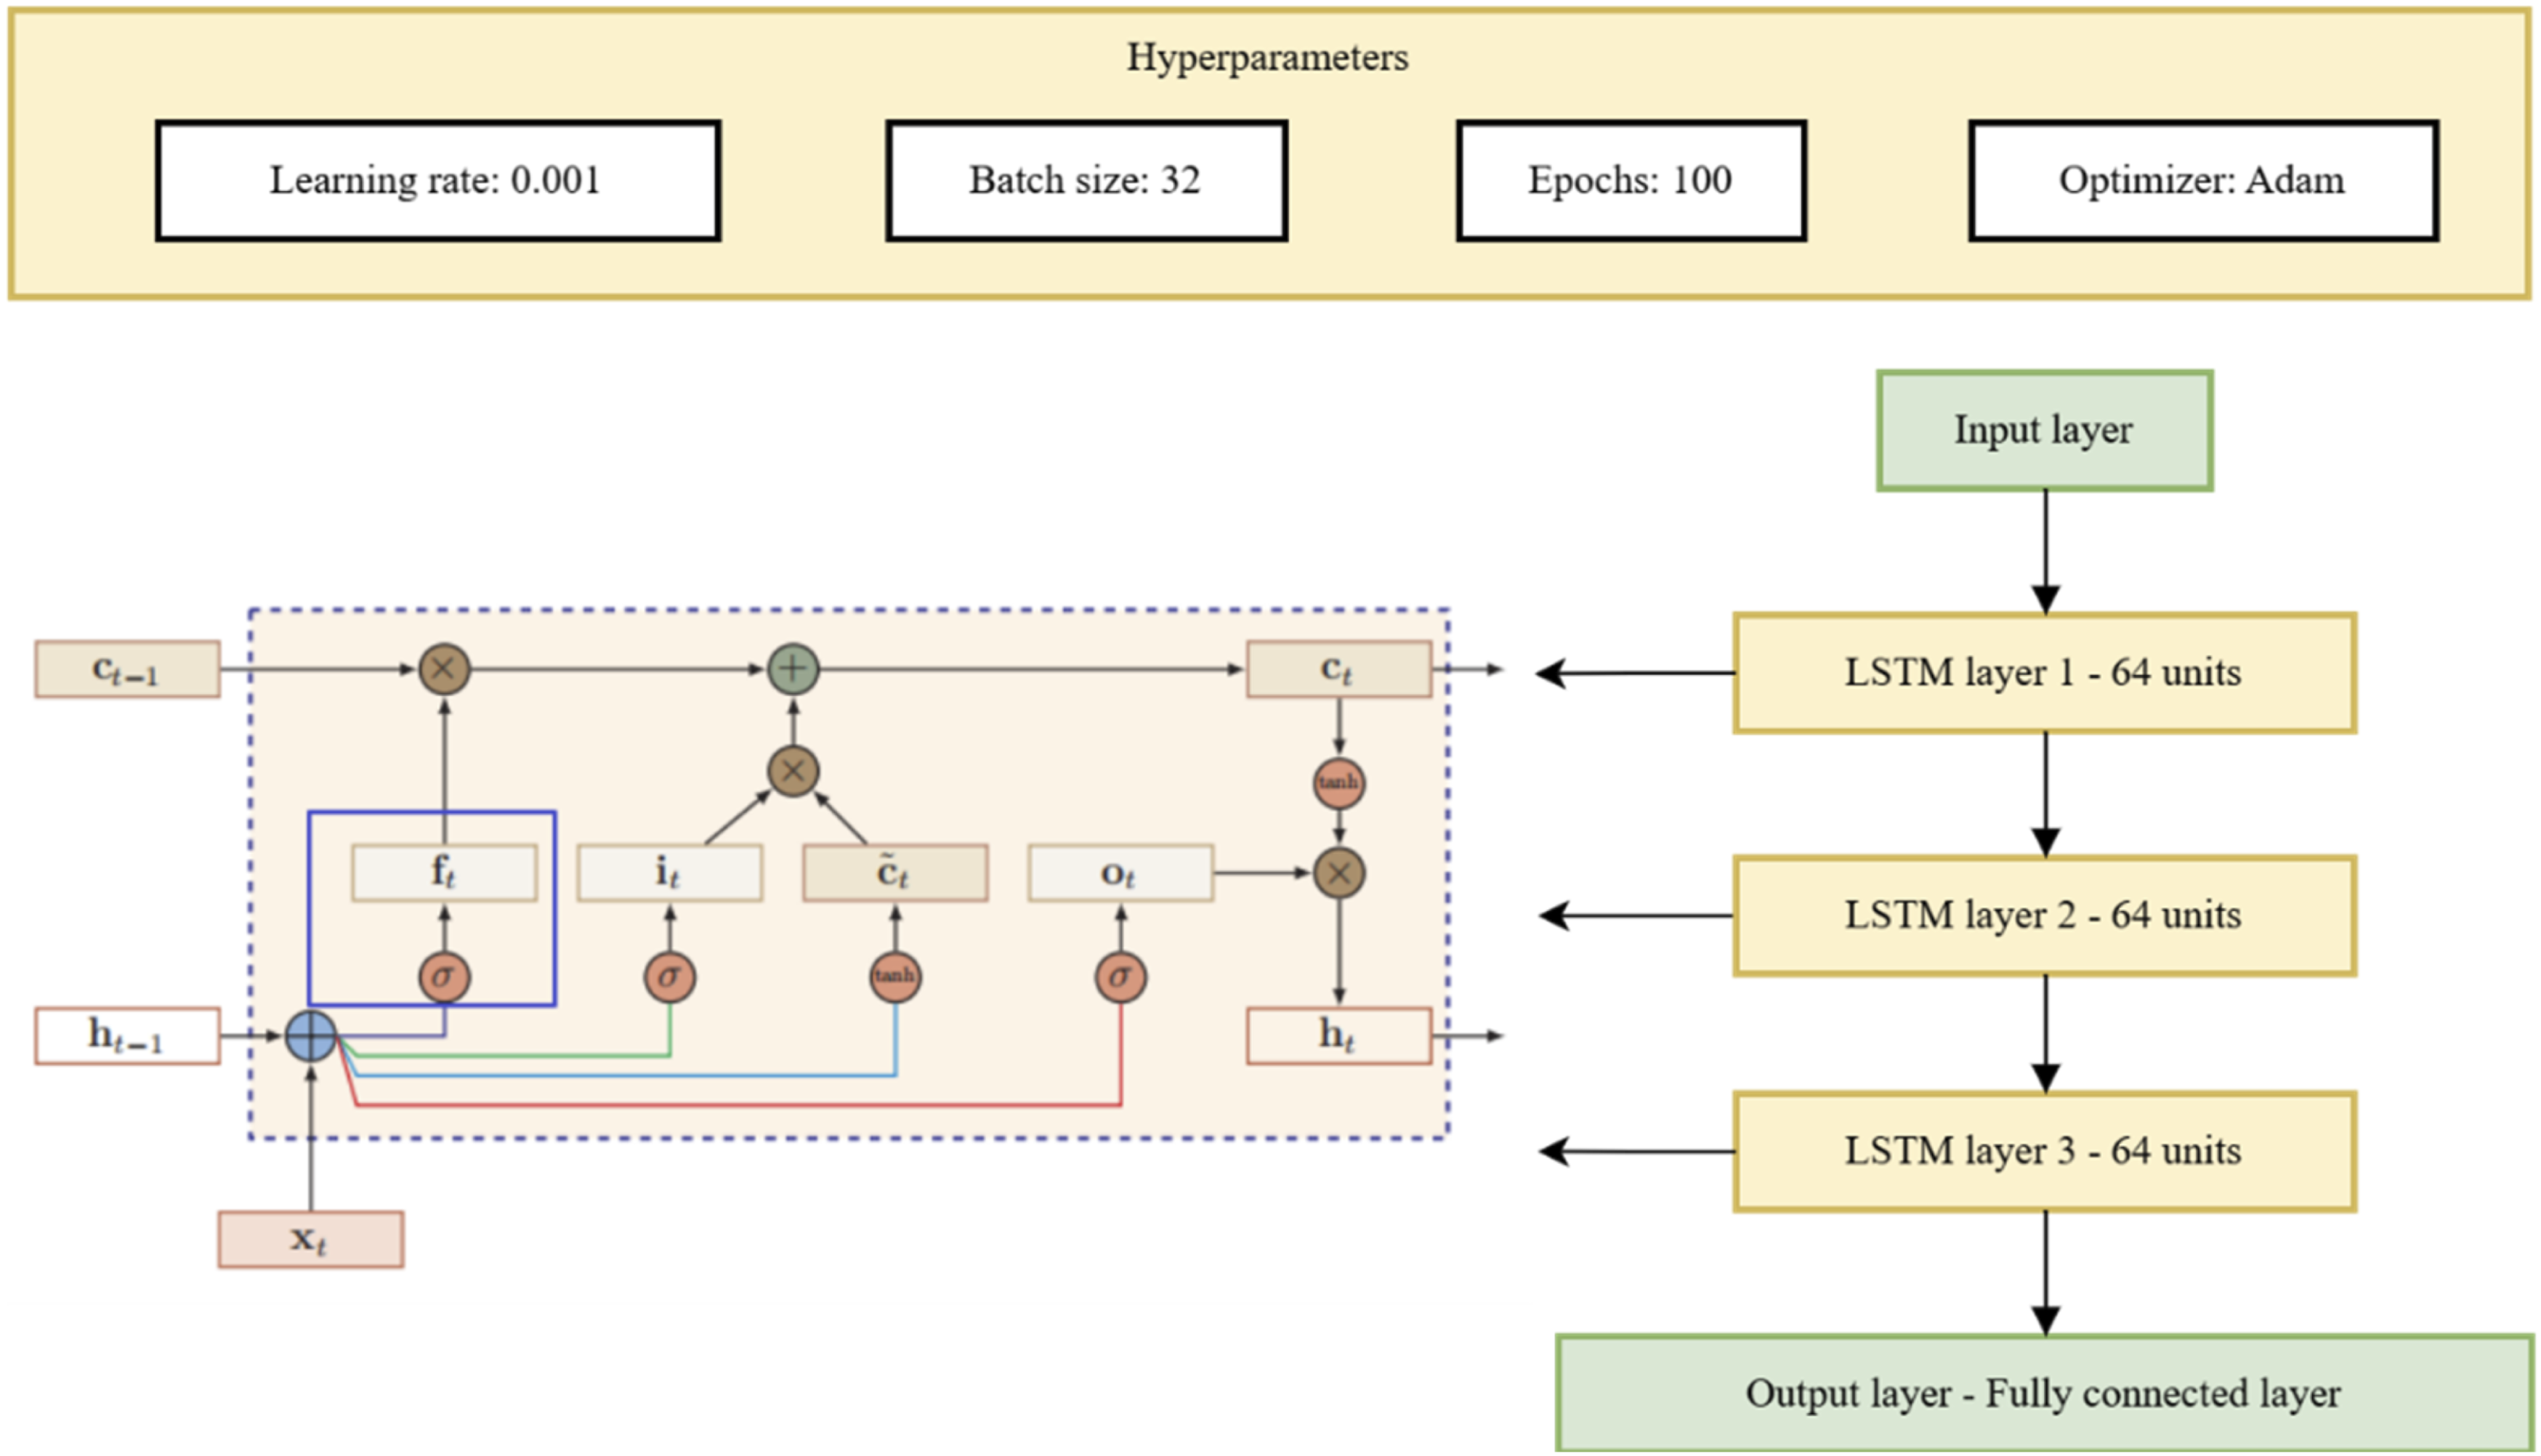
The output of the forget gate is a number between 0 and 1, implemented through the sigmoid28,29 activation function. The formula is expressed as:
The formula for the input gate is:
The candidate memory unit state is a new memory content generated through the tanh activation function, which is partially written into the memory unit under the control of the input gate. The formula is:
The output gate determines how many memory units is output as hidden state 
The formula for updating the state of memory units is:
The dataset of 8 learners collected is divided. The collected data is classified from March, April, and May as the training set, and the data from June is classified as the testing set. During the model training process, the loss function is used to evaluate the difference between the predicted and true values of the model and guide the updating of model parameters. The loss function used in this article is mean square error (MSE), and the formula is:
The LSTM model is trained using a training dataset and the model parameters are optimized through backpropagation algorithm. The historical learning data of learners is input into the trained LSTM model, and the LSTM model predicts based on input data and outputs data such as the learners’ learning performance and duration for a period of time in the future. By analyzing the output results of the model, the learning patterns of learners are identified and the trend of performance changes is analyzed.
The physical meaning of model parameters refers to the adjustable values within the model, which are optimized during the training process to adapt to the characteristics of the data. For example, in LSTM, the weight matrix determines the activation level of the input, forget, and output gates, directly affecting the memory and forget of information. By adjusting the learning ability and prediction accuracy of the model, the specific needs of the task can be met.
The learning trajectory can reveal the learning situation of learners at different time periods, and personalized learning suggestions and feedback can thus be generated for learners. Through continuous trajectory analysis, personalized suggestions and feedback, learners can continuously adjust and optimize their learning strategies, gradually improve their learning methods, thereby improving learning efficiency and effectiveness, enhancing their ability and confidence in autonomous learning, and ultimately achieving better learning outcomes. Through systematic learning trajectory analysis, learners can obtain more personalized and efficient learning experiences under scientific and effective guidance.
The selected dataset covers a diverse sample of English learners, including different ages, backgrounds, and learning stages, to ensure the broad applicability of the experimental results. The setting of experimental parameters needs to be adjusted according to the characteristics of the model, such as the number of layers, units, and learning rate of LSTM hyperparameters, and the optimal combination is determined through cross-validation. In addition, data preprocessing steps such as standardization, segmentation, and filling should also be standardized to improve model training effectiveness and prediction accuracy. The experimental setup includes dataset partitioning, training to testing ratio, batch size, and training epochs. The dataset is divided into 80% training and 20% testing. The batch size is set to 64 and the training epochs to 50. Adam optimizer is utilized, and the learning rate is set to 0.001. In addition, to avoid overfitting, early stopping mechanisms and regularization techniques are applied.
Results
Prediction error of English learning performance
By predicting the English learning performance of learners, the learning effectiveness can be evaluated and the learning performance of learners at different stages can be understood. Based on the predicted learning performance, targeted learning suggestion and guidance can be provided to learners, helping them adjust their learning strategies, focus on breaking through weak links, and improve learning outcomes.
The MAE,
30
RMSE, and coefficient of determination R2 are used to measure the prediction error of learning performance, and the formulas are:


The prediction error of the first learner’s English learning performance is shown in Figure 3. Prediction error of English learning performance.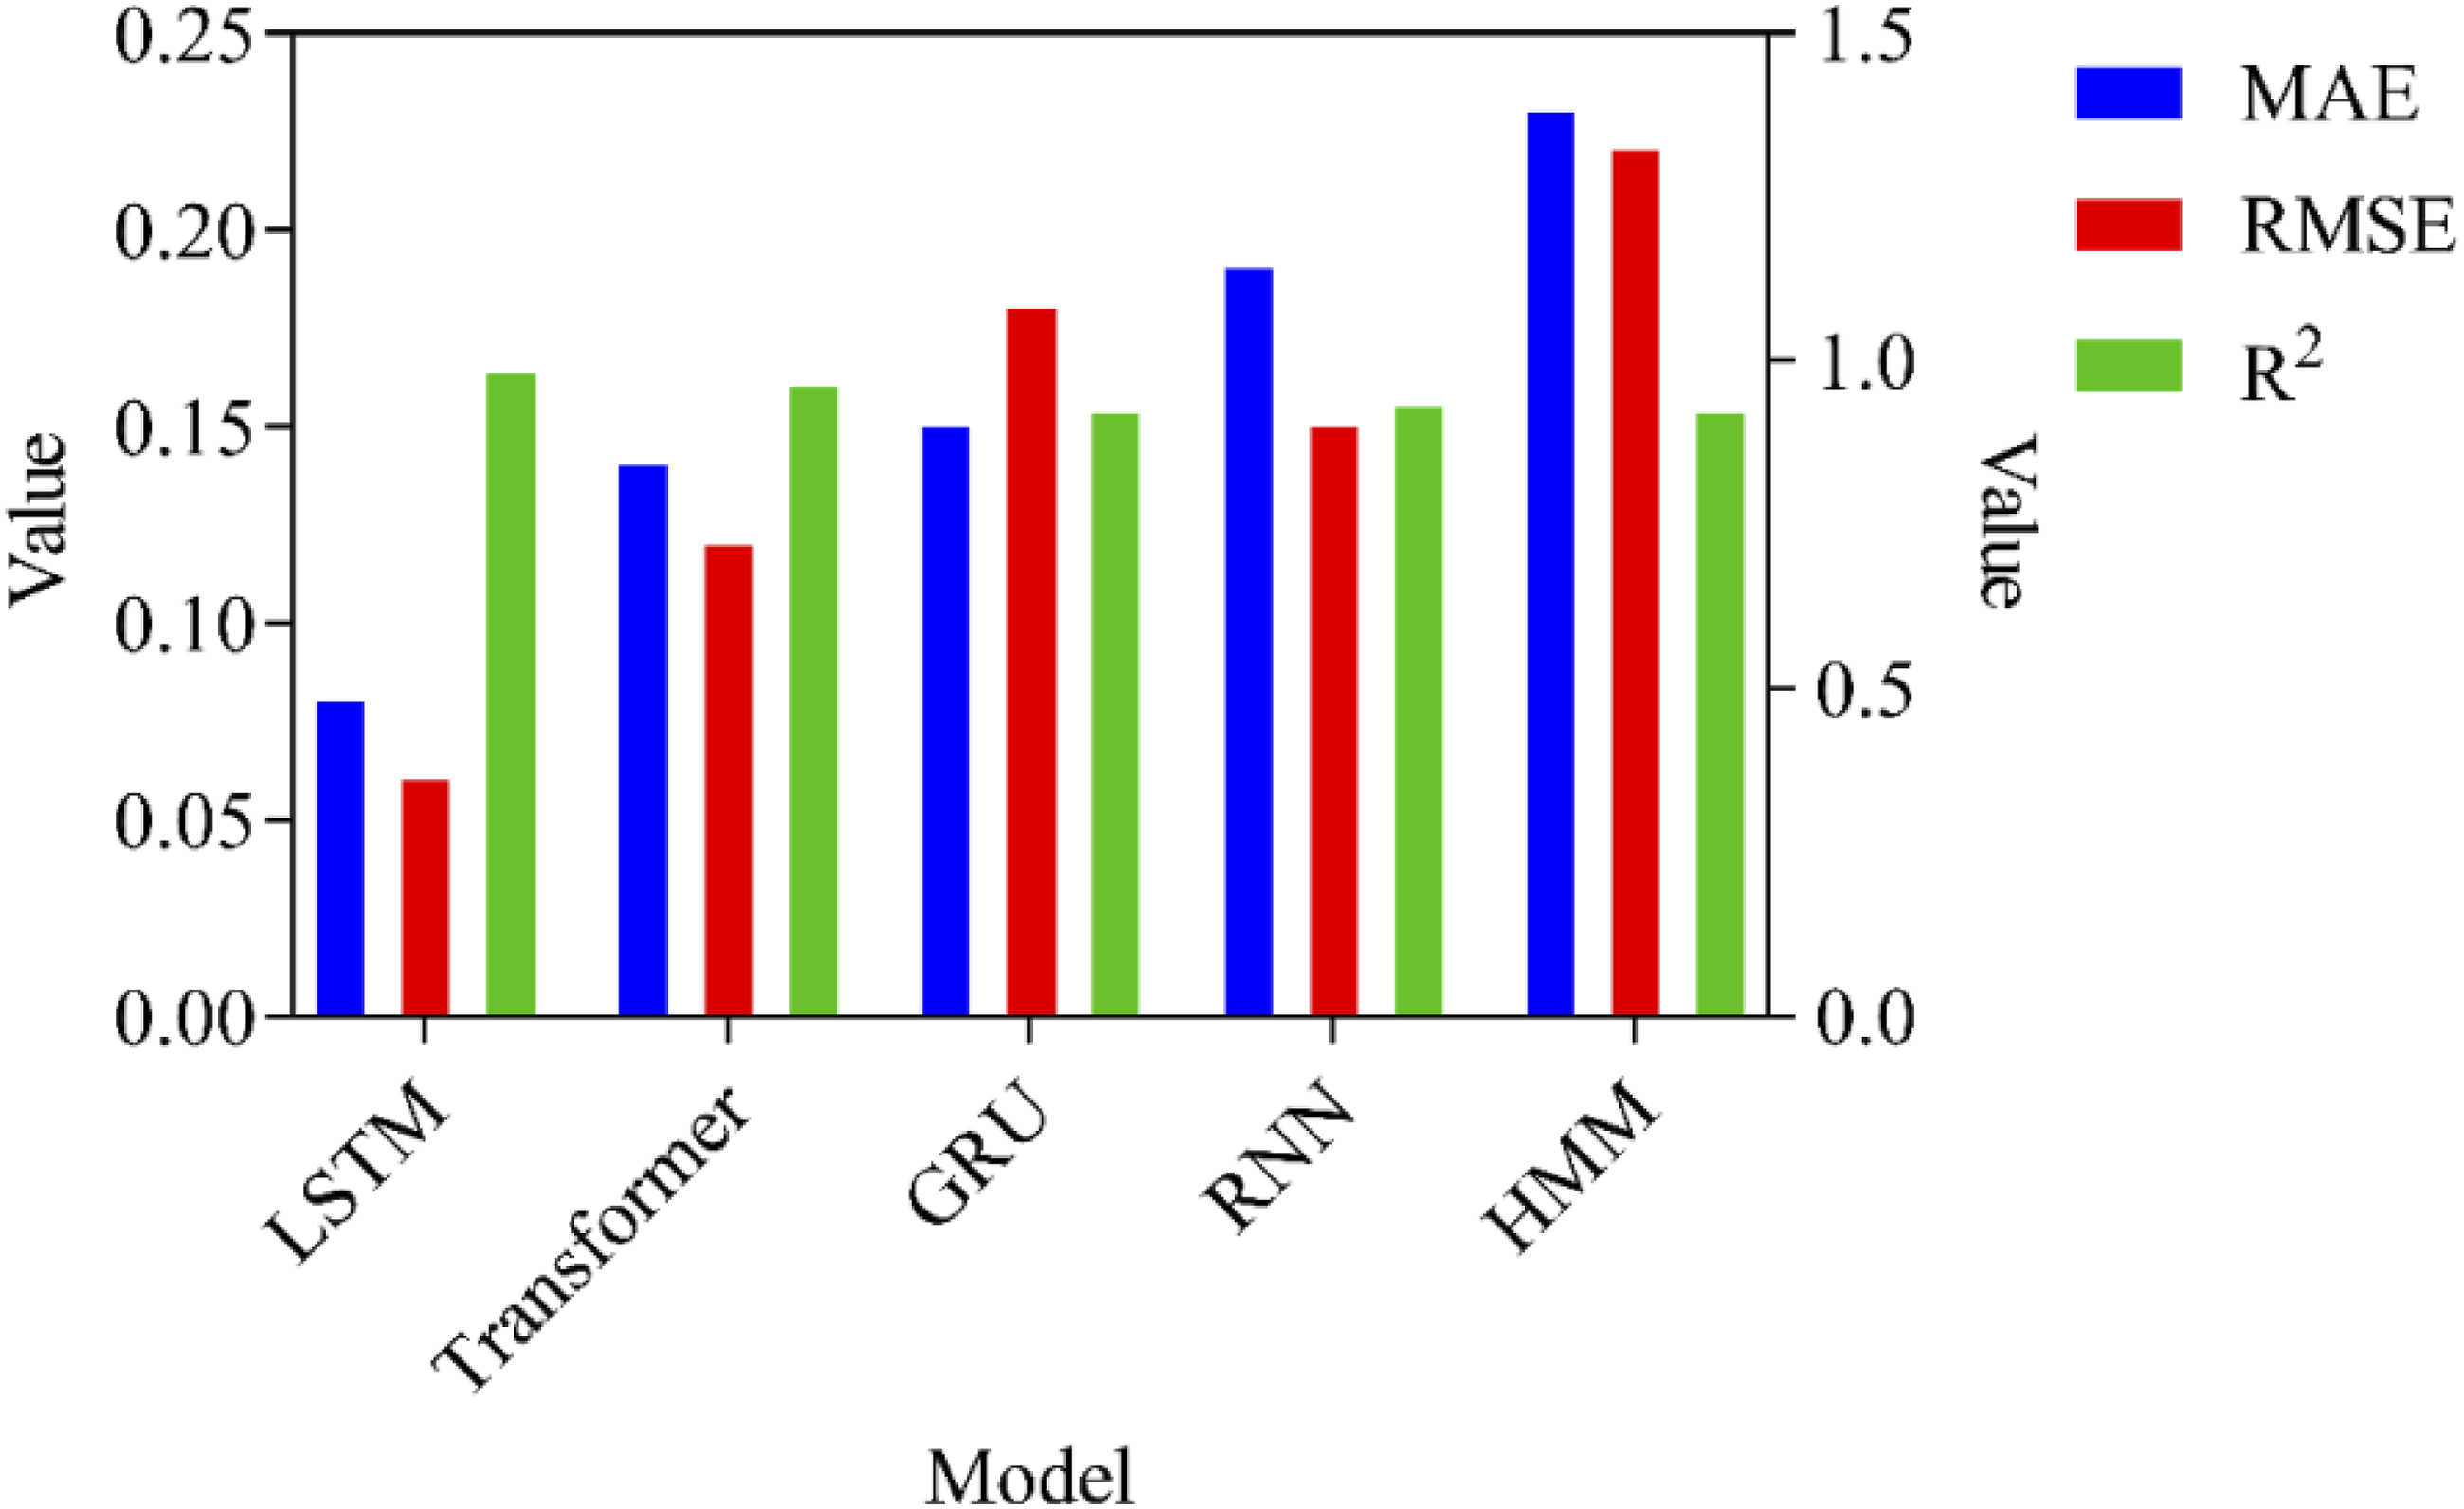
In Figure 3, the horizontal axis represents 5 compared models; the left vertical axis represents the values of MAE and RMSE, and the right vertical axis represents
Prediction stability of English learning performance
LSTM is used to predict English learning performance of 8 learners, and the stability is judged by comparing the performance changes of LSTM in English learning performance prediction on different learners’ data. If the performance of English learning performance prediction varies significantly among different learners, it indicates that the prediction is unstable. The stability results of English learning performance prediction are shown in Figure 4. Prediction stability results of English learning performance.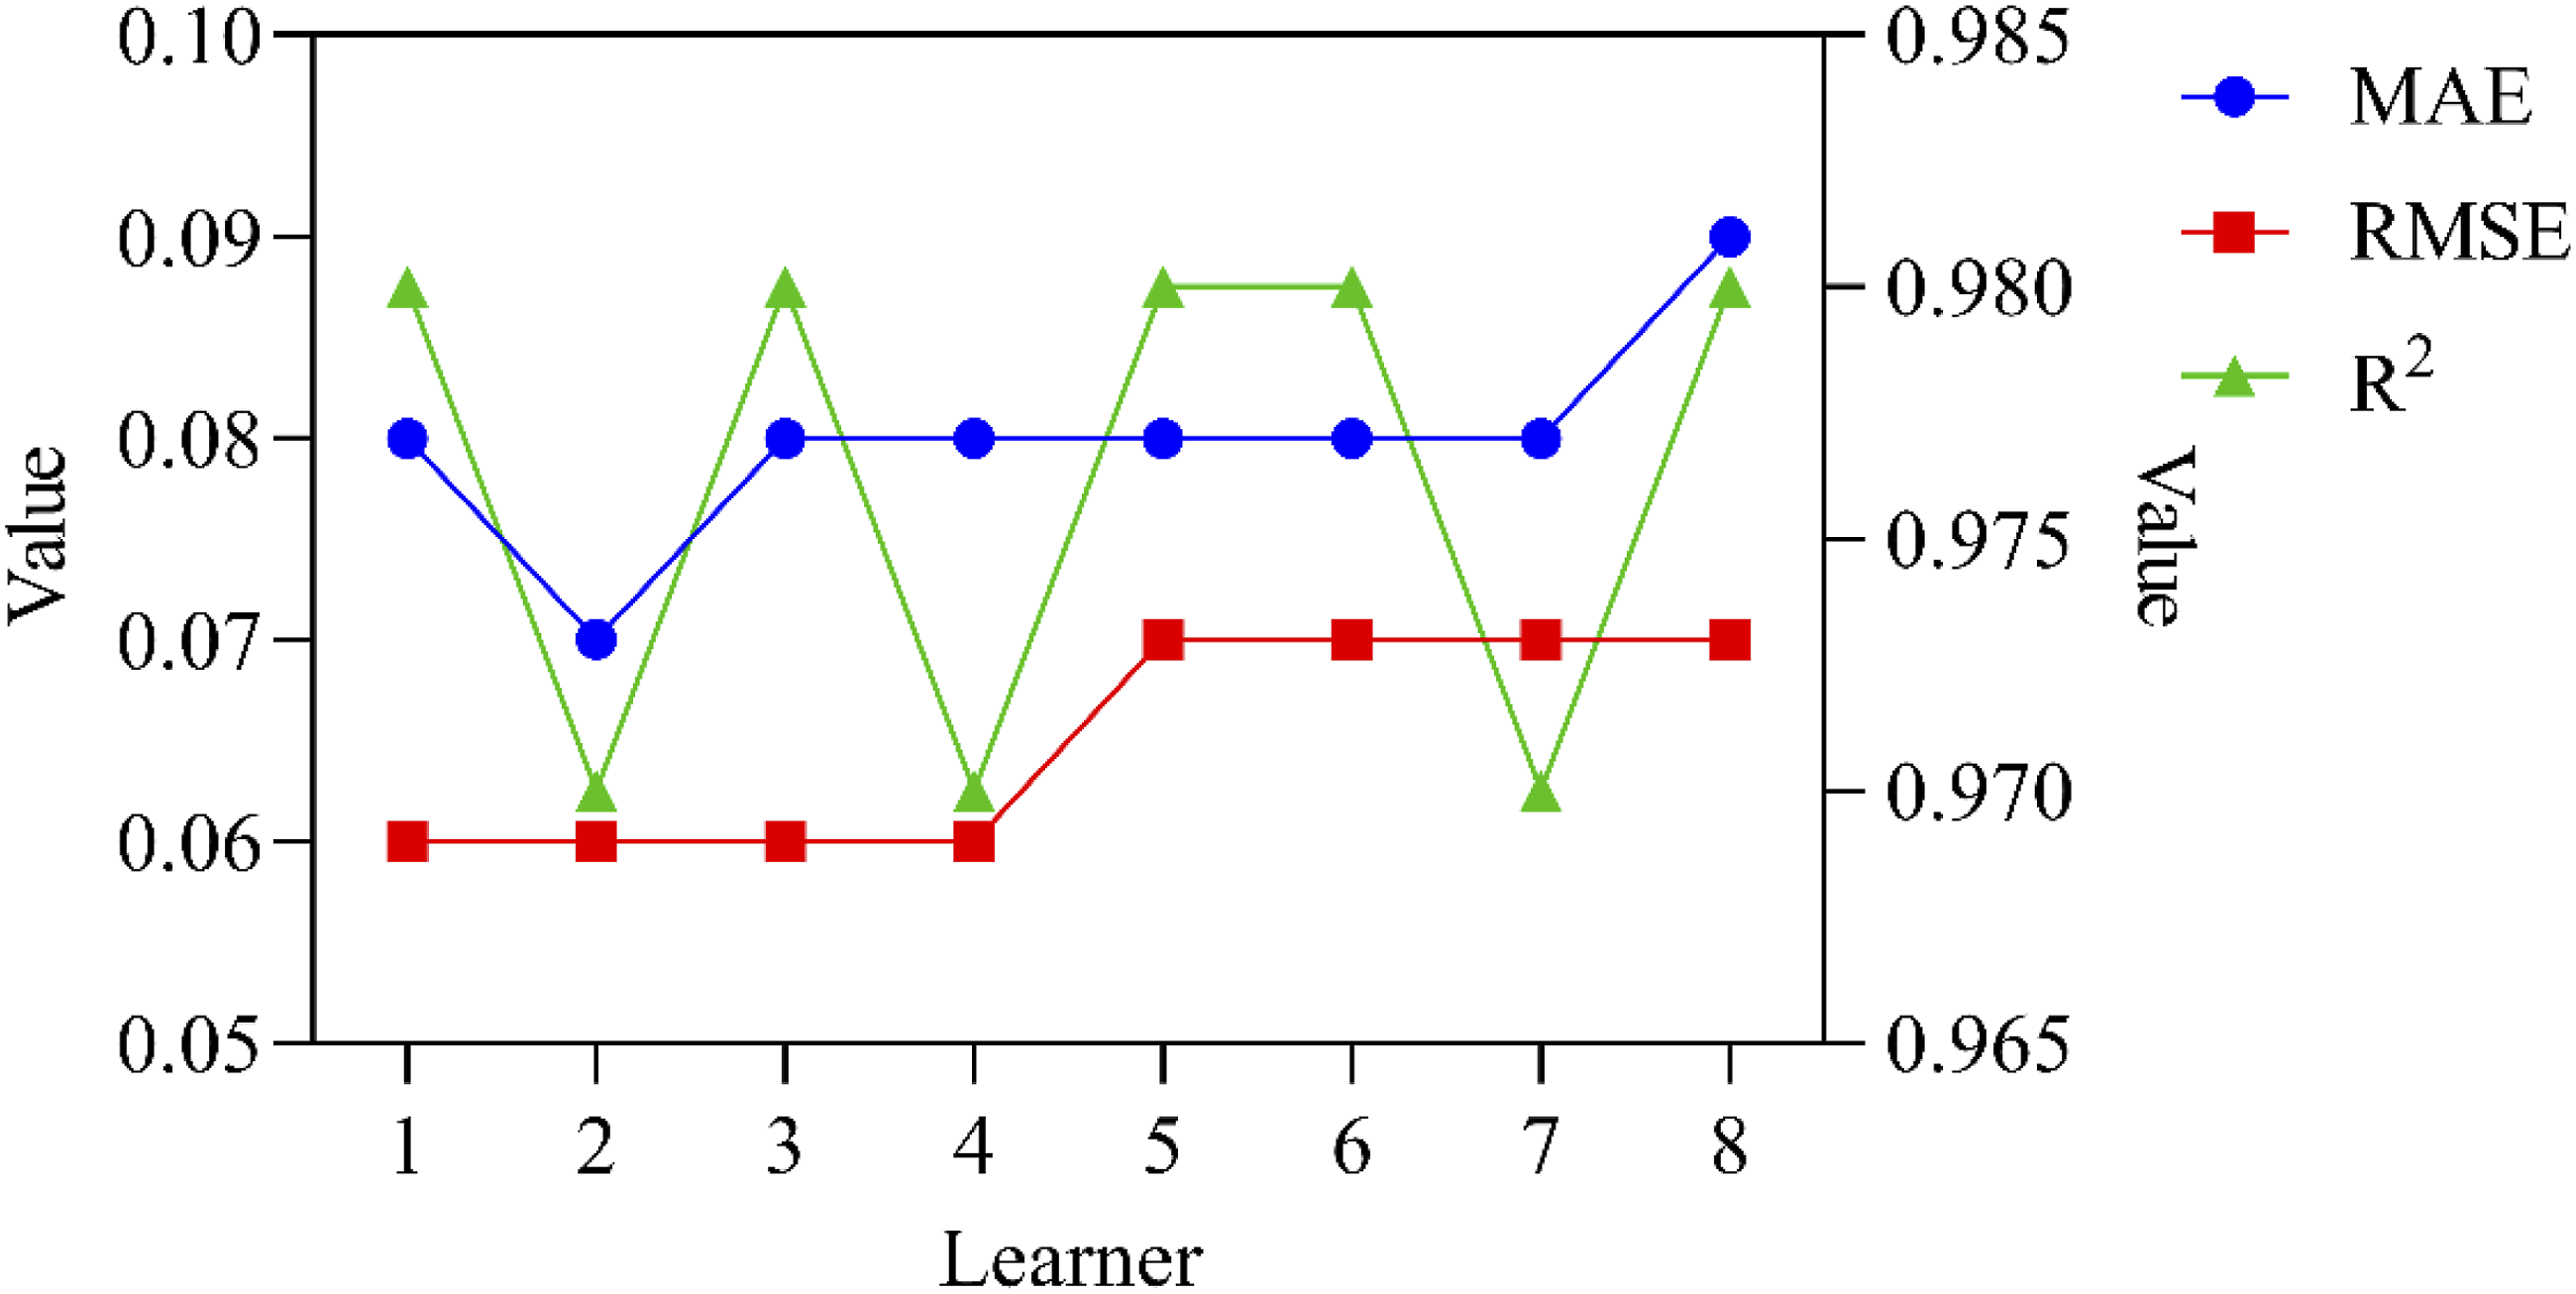
Figure 4 shows the prediction of English learning performance by LSTM for 8 learners. The left vertical axis represents the values of MAE and RMSE, and the right vertical axis represents
More different types of deep learning models such as convolutional neural networks, generative adversarial networks, and variational autoencoders are applied as comparison models. The performance of these models in predicting English learning outcomes is evaluated through experiments. This can help to comprehensively understand the applicability and limitations of each model, providing scientific basis for selecting the best model.
Prediction error of learning duration
This article compares the performance of five models, including LSTM, Transformer, GRU, RNN, and HMM. LSTM excels at capturing long-term dependencies and is suitable for predicting time series data. Transformer processes sequential data with its powerful self attention mechanism. GRU optimizes the gradient vanishing problem of RNN through gating mechanism. RNN can process sequential data but may face gradient vanishing. HMM is used to model hidden state transitions in time series. These models demonstrate their respective strengths and weaknesses on different tasks and datasets. Predicting the duration of English learning can help learners develop more effective learning plans and time management strategies, improve learning efficiency, and better utilize limited learning time. The prediction error results of the first learner’s learning duration are shown in Figure 5. Prediction error results of learning duration.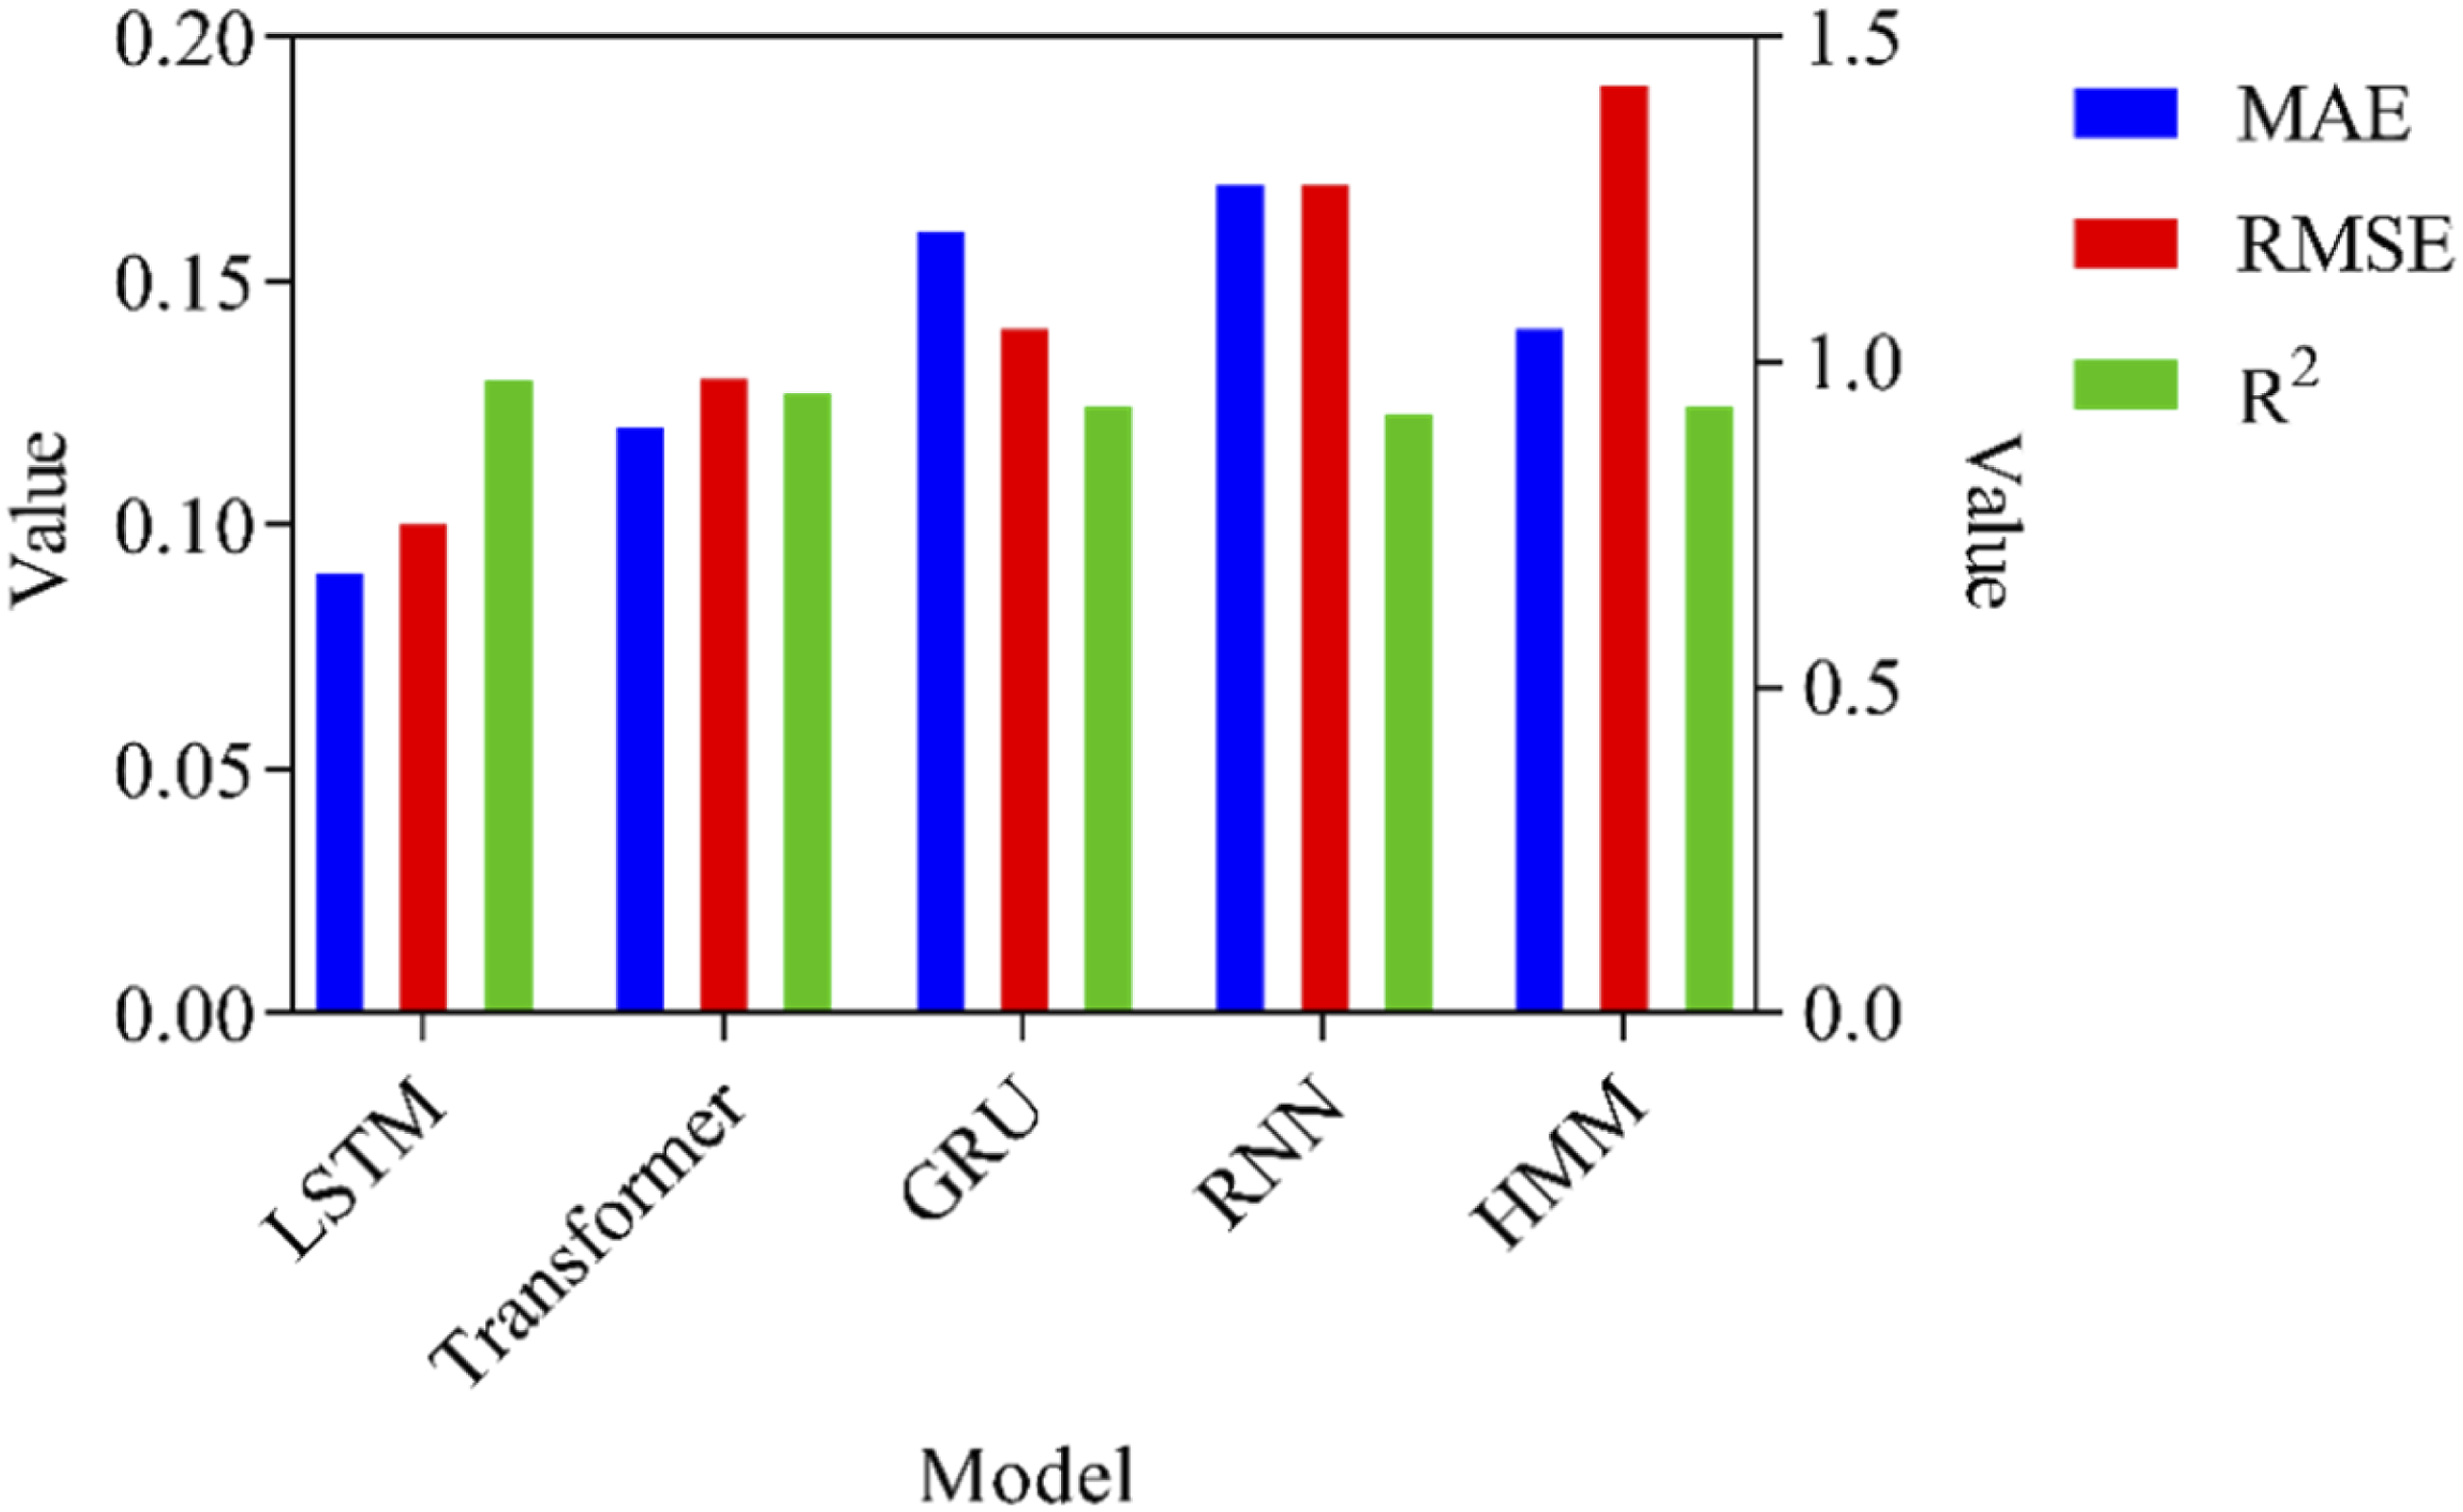
Figure 5 shows a comparison of learning duration prediction errors of 5 models. The left vertical axis represents the values of MAE and RMSE, and the right vertical axis represents the values of
Prediction stability of learning duration
Predicting the time required for learners to complete specific learning tasks can help them plan their daily and weekly learning time reasonably, thereby avoiding blind learning and time waste. The prediction stability of English learning duration is shown in Figure 6. Prediction stability of English learning duration.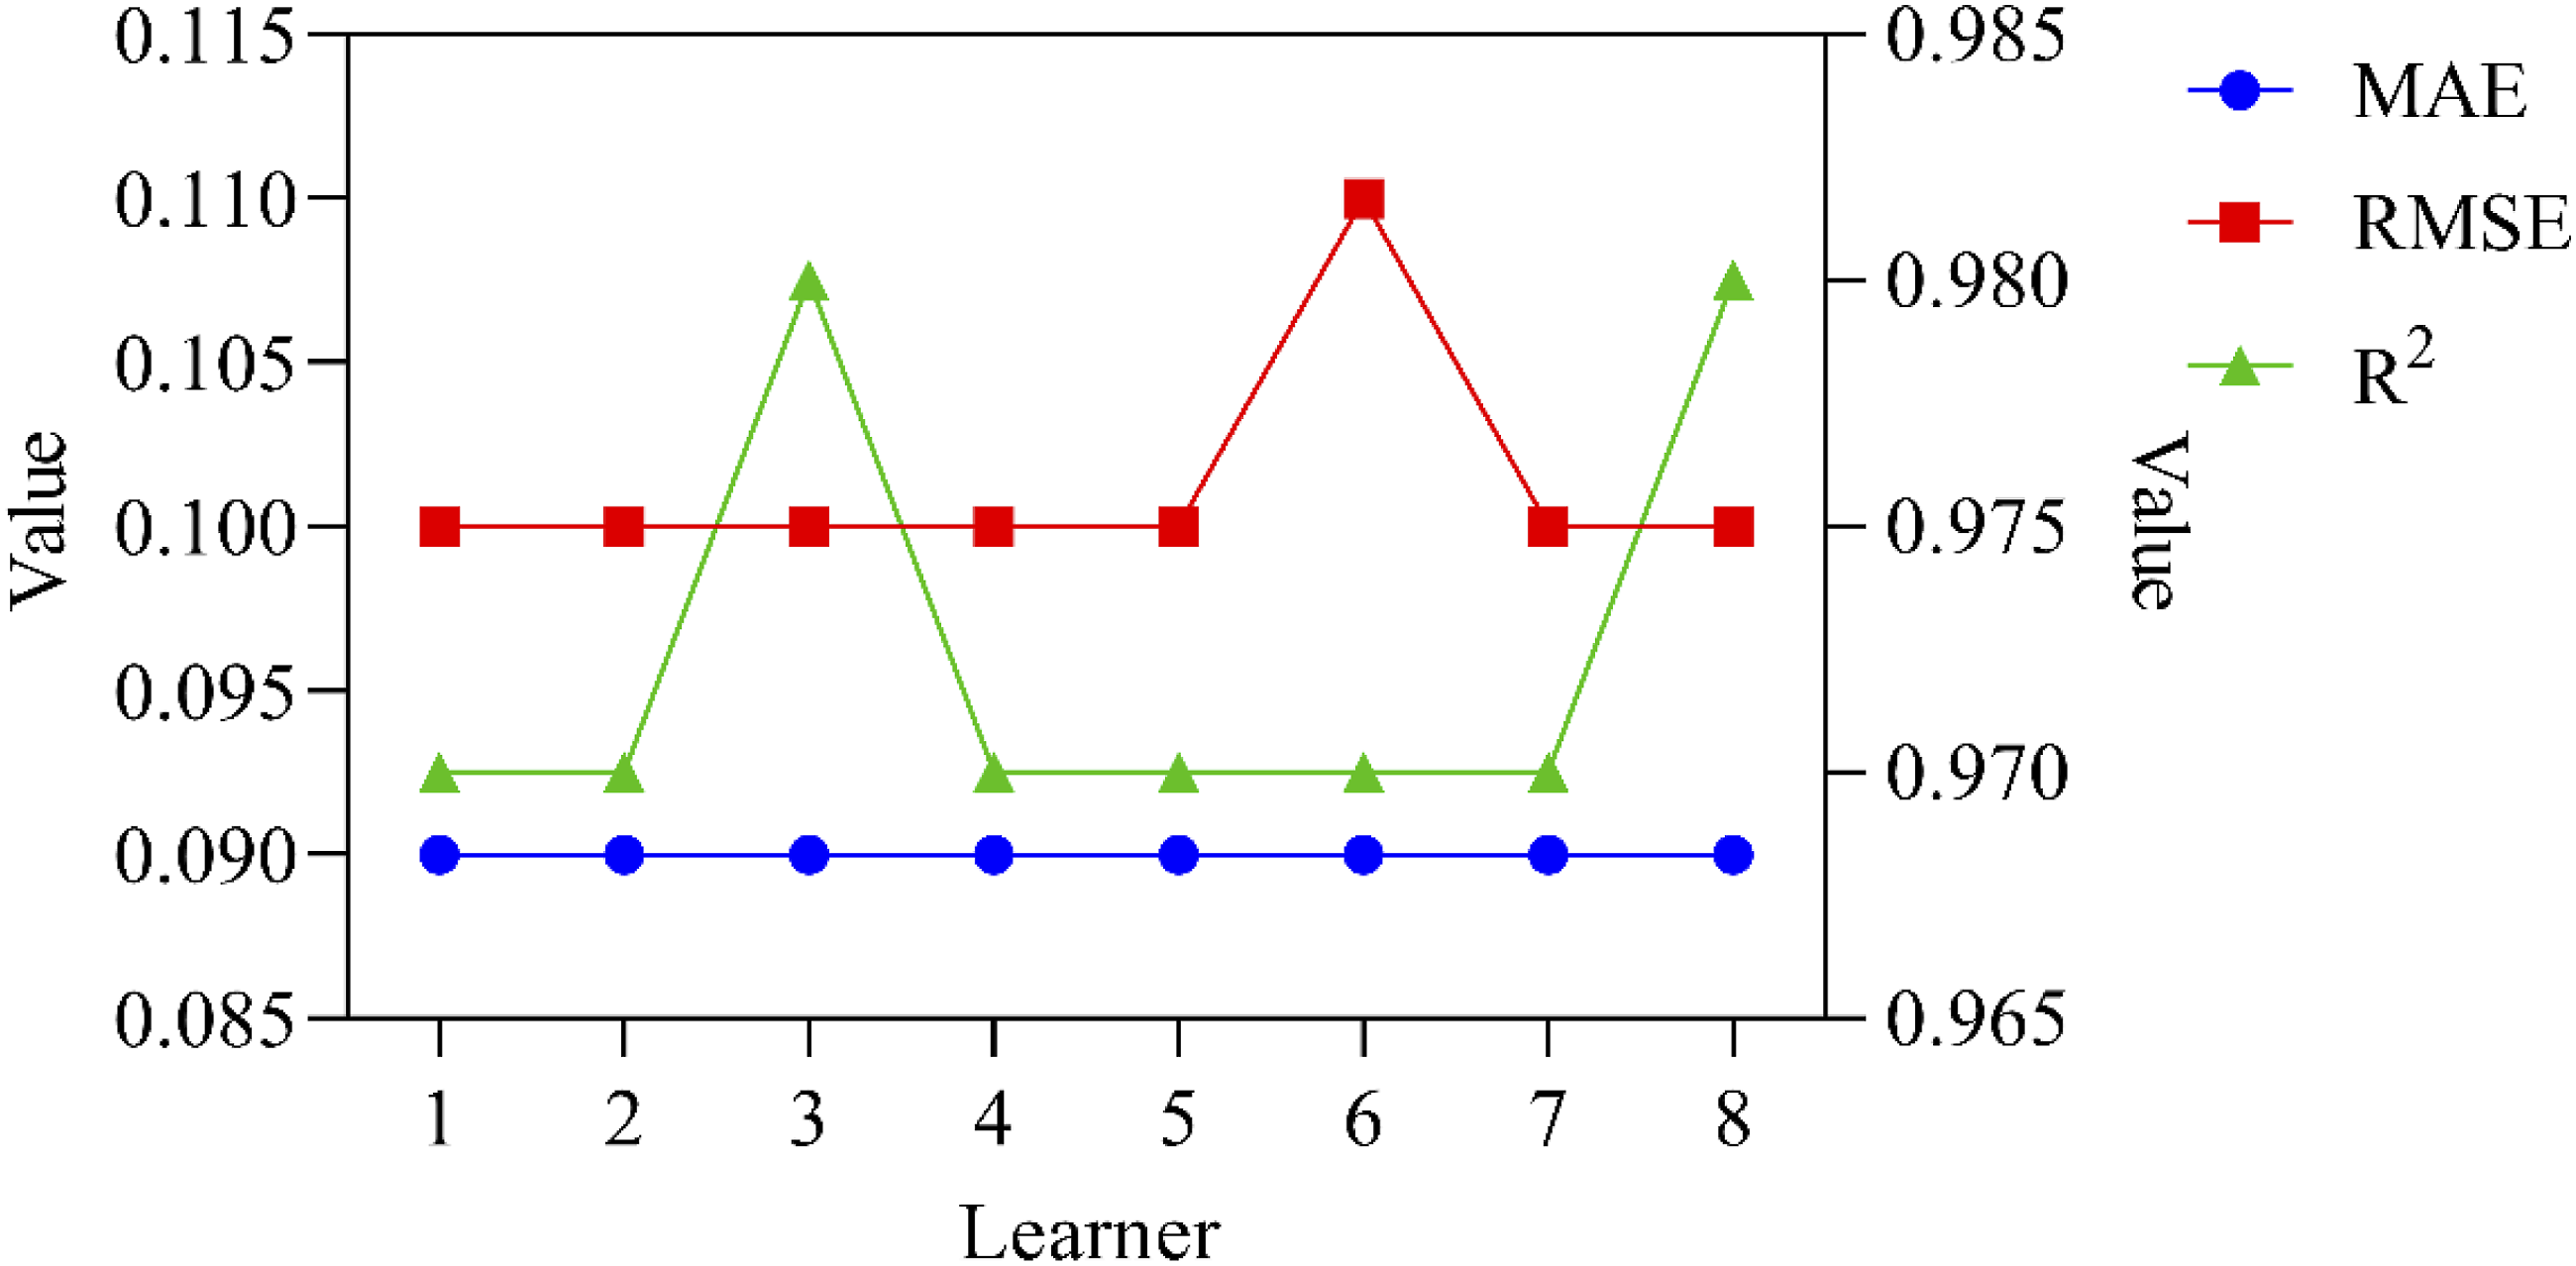
LSTM is used for stability analysis of English learning duration prediction. The left vertical axis in Figure 6 represents the values of MAE and RMSE, and the right vertical axis represents the value of
Visualization of learning trajectories
By analyzing the learning trajectories, learners and educators can identify patterns in the learning process. The predicted learning performance of learners is visualized, as shown in Figure 7. Visualization of learning trajectories.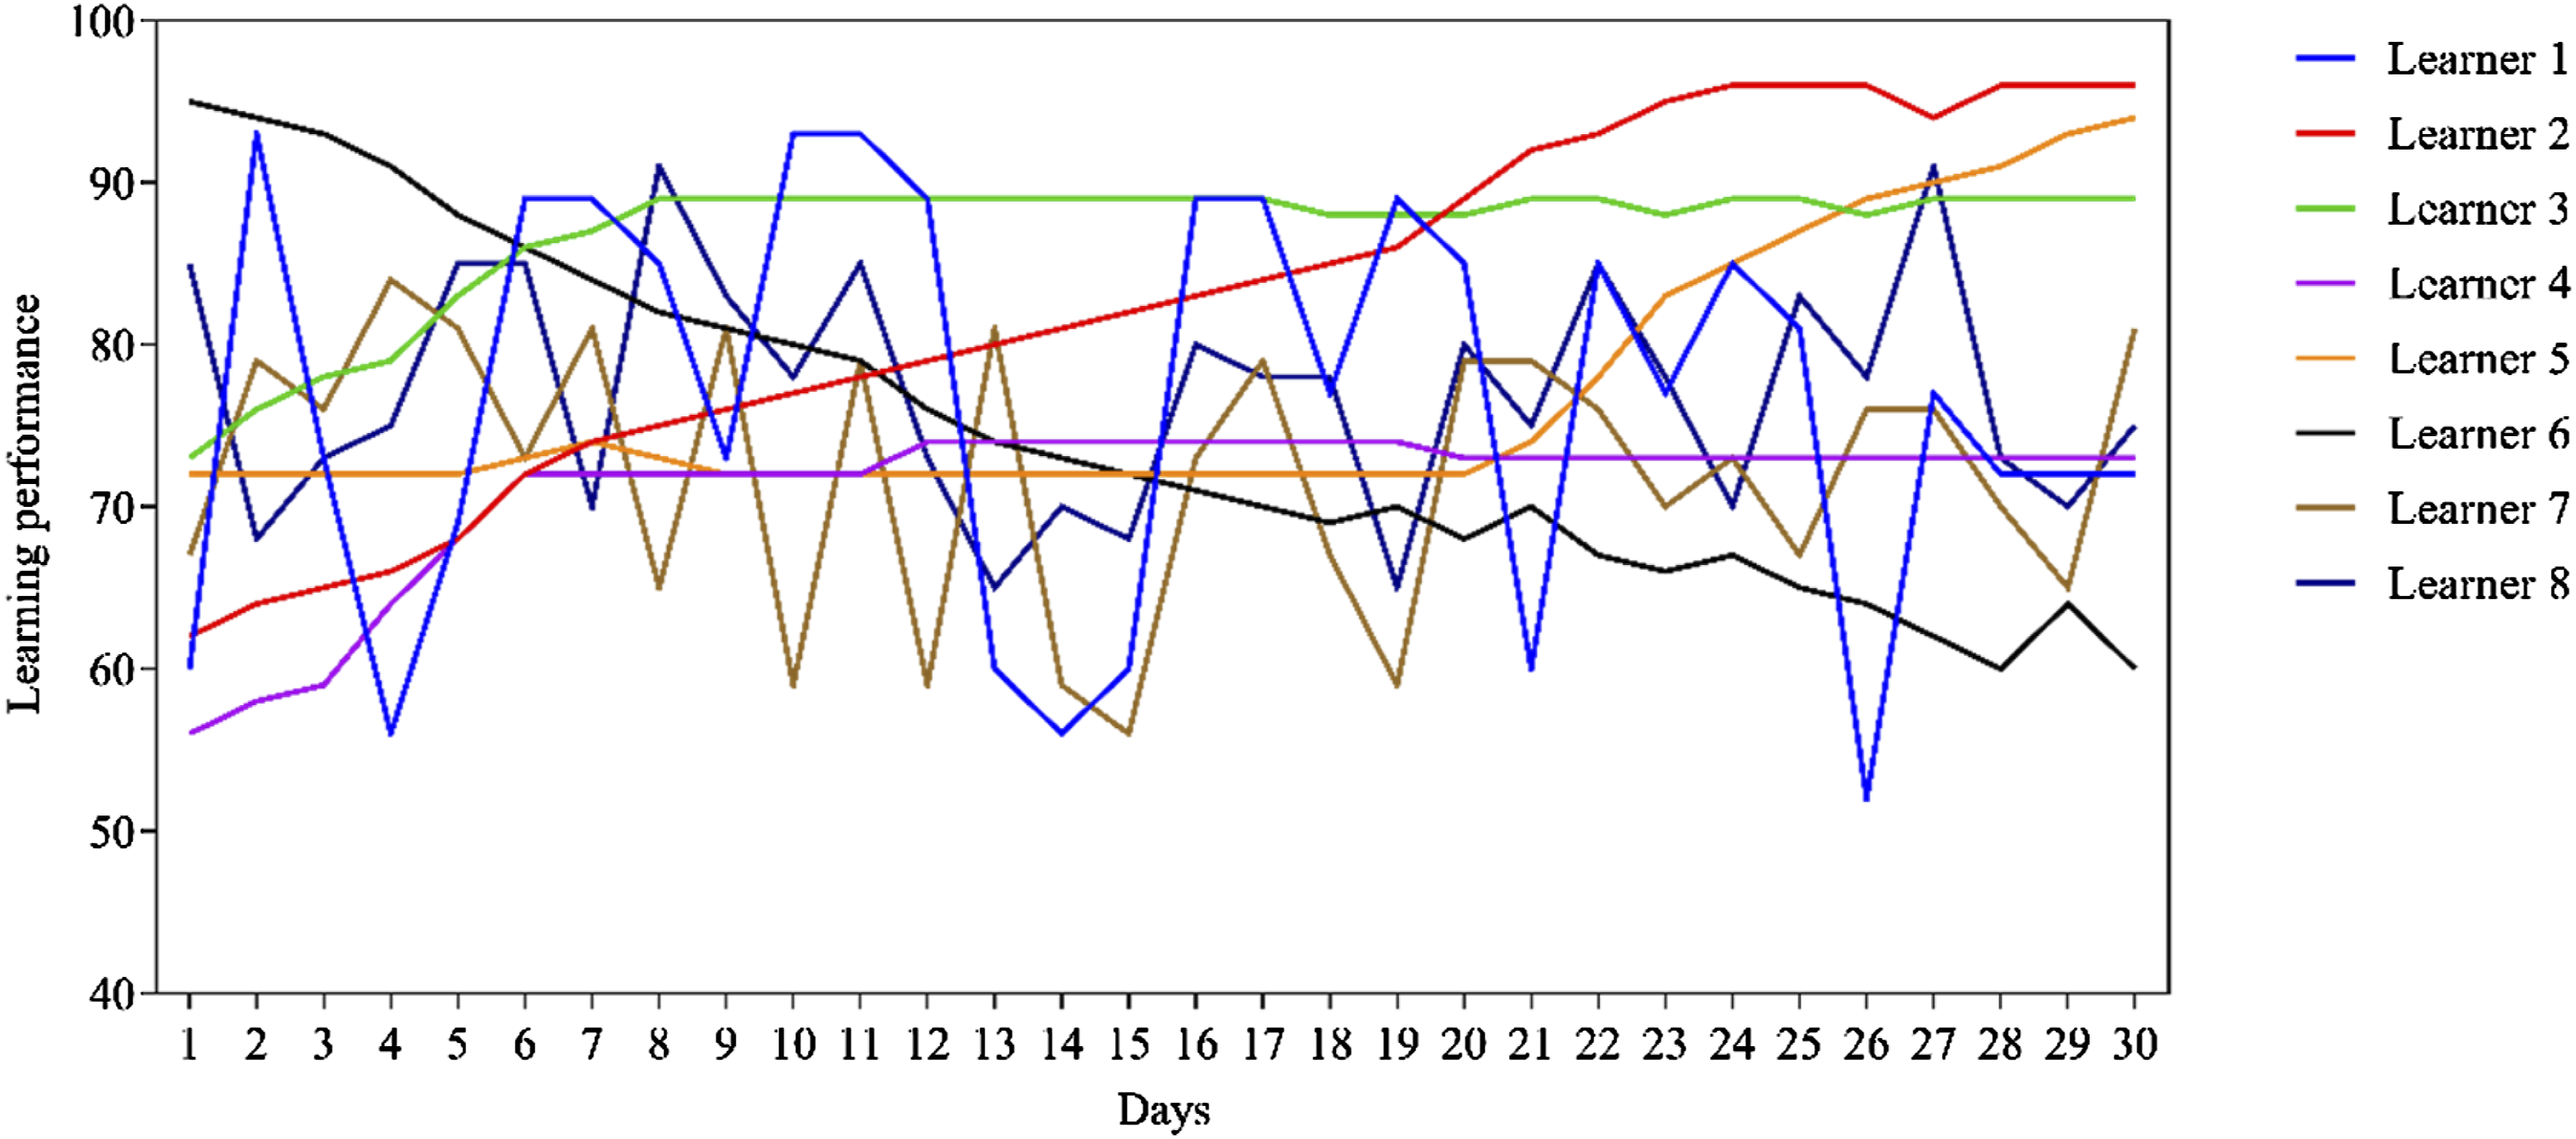
LSTM is used to predict the learning performance of learners, and the prediction results of learning performance for 8 learners in June 2020 are presented. Visualization of learning trajectories can help identify key nodes and turning points in the learning process, as well as trends in learning performance. Learners 1, 7, and 8 experience significant fluctuations in their learning performance over a period of 30 days, indicating that learners 1, 7, and 8 are in an intermittent learning state. The learning performances of learners 2, 3 and 4 all rise first and then reach stability. Learner 2’s performance improves within days 1–23 and stabilizes within days 24–30, indicating that his learning strategy is effective and reaches a learning bottleneck within 24–30 days. Similarly, learner 3’s learning strategy in days 1–7 is effective, and learner 4’s learning strategy for days 1–5 is effective. Learner 5 experiences a learning bottleneck during the days 1–20, and his learning performance continues to improve within the days 21–30. The overall learning performance of learner 6 shows a downward trend, indicating that learner 6’s learning strategy is inappropriate. Visualized learning trajectories can be tracked and evaluated over the long term. By continuously monitoring changes in learning performance and evaluating the effectiveness of different learning stages and strategies, reference can be provided for future learning and teaching. Figure 7 shows the prediction ability of LSTM neural network in English learning trajectory. By analyzing data on learners’ vocabulary growth, grammar mastery, and reading comprehension ability, it is found that the LSTM model can accurately capture learners’ learning progress at different time points and provide personalized learning path recommendations. However, the accuracy of the model slightly decreases when processing data with long time intervals, and further optimization is needed.
There may be sources of error when using LSTM to predict academic performance. Firstly, the model is highly sensitive to input data, and data noise or inaccuracy may lead to prediction bias. Secondly, LSTM models require a large amount of training data to capture complex learning trajectories, and a small number of samples may lead to overfitting or insufficient generalization ability of the model. In addition, individual differences among learners and external factors such as environmental changes that have not been fully considered may also affect prediction accuracy. Therefore, it is necessary to comprehensively consider data quality, sample size, and other influencing factors.
Discussion
This article uses LSTM to analyze the learning trajectories in English learning. By comparing it with Transformer, GRU, RNN, and HMM, it has been found that LSTM can more accurately predict learning performance and learning duration, while maintaining high stability. LSTM model is used to predict the learning performance of 8 learners in June 2020, and in-depth analysis and understanding of their learning behaviors and patterns are conducted. In this article, multi-layer perceptron, convolutional neural network, and recurrent neural network models are applied. MLP is suitable for structured data, but its effectiveness in processing time series data is limited. CNN excels in image data processing but struggles to handle temporal features. RNN is suitable for time series data analysis, but its training complexity is relatively high. In the selection of model parameters, hyperparameter selection follows the principle of balancing performance and complexity. Grid search and random search are used for optimization, and model performance is evaluated through cross-validation. Regularly tuning parameters include learning rate, batch size, number of layers, and number of neurons.
Intermittent learners (learners 1, 7, and 8): their significant fluctuations in learning performance indicate unstable learning strategies. For these learners, it is recommended to develop a more stable learning plan to avoid long learning intervals and adopt some strategies to improve learning persistence, such as setting short-term goals and reward mechanisms.
Learners with effective learning strategies (learners 2, 3, and 4): they show a significant improvement in their learning performance at a certain stage, and then reach stability, indicating that their learning strategies are effective in the early stages, but then enter a learning bottleneck period. It is recommended to try changing learning methods or increasing the difficulty of learning content to break the existing bottleneck when it is reached.
Learners whose learning performances break through the bottleneck and continue to improve (learner 5): his performance continues to improve within days 21–30, indicating that his strategy is gradually taking effect. For such kind of learners, they can be encouraged to maintain their existing learning methods and make timely adjustments to maintain continuous progress.
Learners with declining learning performance (learner 6): his overall performance is showing a downward trend, indicating that his current learning strategy is not suitable. It is recommended that such kind of learners reflect and adjust their learning strategies, which may require seeking guidance from teachers or adopting new learning resources and methods.
LSTM is used for visual analysis of learning trajectories, so key nodes and trends can be identified, providing personalized learning suggestions and feedback for learners. Such analysis and suggestions not only help learners optimize learning strategies and improve learning outcomes but also provide scientific basis for educators to improve teaching methods and enhance teaching quality.
LSTM is superior to other models because its design focuses on long-term dependencies and can effectively capture complex patterns in time series data. In contrast, models such as GRU and RNN may be affected by gradient vanishing when processing long sequences. Parameter selection also significantly affects model performance, and optimizing hyperparameters can help improve prediction accuracy.
Model stability is an important indicator for evaluating its performance. Different datasets and parameter settings may significantly affect the performance of the model. A stable model should maintain consistent predictive performance across different datasets and parameter adjustments. Using diverse datasets for training and testing can help evaluate the stability of a model in various contexts. Meanwhile, systematically adjusting hyperparameters and monitoring their impact on performance can help identify and correct potential instability in the model. Models with higher stability have more practical application value and can provide reliable prediction results in different environments.
The performance of the model is significantly affected by factors such as data quality and feature selection. Poor data quality, such as noise or missing values, can lead to overfitting or underfitting of the model. Improper feature selection may miss key information and affect prediction performance. To improve, data cleaning should be used to enhance data quality, feature engineering should be applied to extract meaningful features, and feature selection optimization should be carried out to improve the model’s generalization ability. In addition, cross-validation methods can be used to evaluate model performance and ensure the reliability of the results.
The applicability of the model in different learning environments and populations needs to consider feature differences and data diversity. When evaluating, the performance of the model should be tested in various learners and educational backgrounds to ensure its universality and accuracy for different groups, thereby providing targeted optimization recommendations. Although deep learning models perform well in many applications, they also have limitations. Although LSTM can effectively handle long-term dependency problems, it has high computational complexity and long training time. Therefore, in practical applications, it is necessary to balance model performance and resource consumption, and strictly clean the data.
Conclusion
This article uses LSTM to predict the English learning performance and duration of learners, achieving significant results. The experimental results show that the LSTM model can accurately predict the learning performance and duration of learners, and exhibits high stability and low error in data from multiple learners. Through visual analysis of learning trajectories, key nodes and turning points in the learning process can be identified, revealing the trend of changes in learning performance. These analysis results not only validate the advantages of the LSTM model in processing time series data but also provide strong support for the generation of personalized learning suggestions. This article applies the LSTM model to predict English learning performances, demonstrating its superiority in capturing long-term dependencies and complex dynamic changes. Visualized learning trajectories are utilized to provide targeted learning suggestions for English learners. Learning trajectory analysis can provide data support for personalized teaching and learning interventions, thereby promoting the development of data-driven educational methods. However, only data from 8 learners is used in this article, and the sample size is small, which may affect the universality of the results. In the future, more data from learners can be collected, covering different age groups, learning stages and backgrounds, so as to enhance the universality and robustness of the results. In future research, emphasis can be placed on optimizing model parameters and combining them with more learning behavior data to improve the accuracy of long-term interval predictions. In addition, other deep learning models such as Transformer can be explored to further enhance prediction capabilities.
